

Abstract
Cancer cells often have increased levels of reactive oxygen species (ROS); however, acquisition of redox adaptive mechanisms allows for evasion of ROS‐mediated death. Inflammatory breast cancer (IBC) is a distinct, advanced BC subtype characterized by high rates of residual disease and recurrence despite advances in multimodality treatment. Using a cellular model of IBC, we identified an oxidative stress response (OSR) signature in surviving IBC cells after administration of an acute dose of an ROS inducer. Metagene analysis of patient samples revealed significantly higher OSR scores in IBC tumor samples compared to normal or non‐IBC tissues, which may contribute to the poor response of IBC tumors to common treatment strategies, which often rely heavily on ROS induction. To combat this adaptation, we utilized a potent redox modulator, the FDA‐approved small molecule Disulfiram (DSF), alone and in combination with copper. DSF forms a complex with copper (DSF‐Cu) increasing intracellular copper concentration both in vitro and in vivo, bypassing the need for membrane transporters. DSF‐Cu antagonized NFκB signaling, aldehyde dehydrogenase activity and antioxidant levels, inducing oxidative stress‐mediated apoptosis in multiple IBC cellular models. In vivo, DSF‐Cu significantly inhibited tumor growth without significant toxicity, causing apoptosis only in tumor cells. These results indicate that IBC tumors are highly redox adapted, which may render them resistant to ROS‐inducing therapies. DSF, through redox modulation, may be a useful approach to enhance chemo‐ and/or radio‐sensitivity for advanced BC subtypes where therapeutic resistance is an impediment to durable responses to current standard of care.
Keywords: Apoptosis, SUM149, Antioxidant, XIAP, NFκB, ALDH
Highlights
A novel, in vitro oxidative stress response (OSR) signature is demonstrated.
Using patient samples, we demonstrate that IBC has a higher OSR score than non‐IBC.
Redox modulator, disulfiram (DSF) + Cu, induces oxidative stress‐mediated apoptosis.
DSF + Cu shows potent anti‐tumor efficacy in in vitro and in vivo IBC models.
Potential for repurposing DSF, an approved anti‐alcoholism drug, for IBC therapy.
1. Introduction
Oxidative stress is an imbalance between the levels of ROS within the cell and the antioxidant systems responsible for detoxifying ROS. Cancer cells are often characterized by increased levels of ROS due to metabolic and signaling aberrations (Gorrini et al., 2013); in order to compensate for high levels of ROS, cancer cells, specifically of advanced subtypes, survive by activating redox adaptive mechanisms including increased expression and activity of ROS‐scavenging systems and antioxidants (Trachootham et al., 2009). Many anti‐cancer regimens work at least in part through the generation of ROS, and thus may be rendered ineffective by redox adaptation. Chemotherapies including the anthracyclines (doxorubicin), taxanes (paclitaxel, docetaxel), alkylating agents, and platinum compounds (cisplatin, carboplatin) as well as radiation therapy all rely heavily on the induction of oxidative stress‐induced apoptosis for their anti‐tumor activities (Brown and Bicknell, 2001; Manda et al., 2009; Trachootham et al., 2009); thus, redox adaptation can confer resistance to many anti‐cancer therapies.
Inflammatory breast cancer (IBC) is one of the most aggressive forms of disease that presents with a unique pathobiology in which hyperproliferative clusters, or tumor emboli, are formed (Robertson et al., 2010). Due to its high metastatic potential and the frequent occurrence of therapeutic resistance, the prognosis remains poor with a 3‐year survival of ∼40% despite progress in multimodality treatment (Masuda et al., 2014). Following trimodal therapy including neoadjuvant chemotherapy (CT), surgery, and post‐operative radiation, patients with IBC are more likely to have residual disease and have a significantly higher risk of recurrence (Rueth et al., 2014; Saigal et al., 2013). Both residual disease and recurrence, following what appears to have been clearance of the tumor, are a direct result of resistant cells that are able to survive these anti‐cancer therapies. Clearly, therapeutic resistance is a serious problem for the IBC population, and new molecular therapeutic targets need to be identified to improve treatment and increase patient survival. Further, IBC can serve as a model for studying the role of cellular oxidative stress responses in modulating the efficacy of anti‐cancer therapies.
Gene expression analyses show that IBC tumors have elevated expression of the redox‐sensitive nuclear transcription factor NFκB and related survival signaling pathways compared to non‐IBC tumors (Iwamoto et al., 2011; Nguyen et al., 2006; Van Laere et al., 2006). Pre‐clinical evidence in cellular models of IBC indicates that redox adaptation through enhancement of cellular antioxidant capacity can confer therapeutic resistance to a number of drugs including classical ROS inducers, chemotherapeutics, and targeted agents (Aird et al., 2012; Allensworth et al., 2012; Williams et al., 2013). We hypothesize that redox adaptation via enhancement of the oxidative stress response plays a significant role in therapeutic resistance in the IBC patient population; thus, to overcome resistance, induction of ROS must be accompanied by rational targeting of those adaptive mechanisms.
Disulfiram (DSF), a member of the dithiocarbamate family, is an FDA‐approved drug for alcoholism which can react with redox‐sensitive sulfhydryl groups (thiols) and bind copper (Cu) (Hogarth, 2012), an essential cofactor for key cellular enzymes (e.g. cytochrome c oxidase and superoxide dismutase 1 (SOD1)) involved in oxidative stress response (Fraga, 2005). Notably, DSF is a redox modulator whose induction of ROS is enhanced by the addition of Cu (Yip et al., 2011), and it has been reported to inhibit the activity of NFκB (Wang et al., 2003; Yip et al., 2011), a potential mediator of redox adaptation in IBC. These properties highlight DSF as an attractive agent by which to enhance cancer cell death and enhance therapeutic sensitivity in IBC.
We analyzed a cohort of IBC and non‐IBC pre‐treatment biopsies using an oxidative stress response (OSR) metagene generated by evaluating the genes activated and repressed in cultured IBC cells that mount a successful protective response to an ROS inducer. Consistent with our hypothesis, IBC patient samples exhibited significantly higher OSR scores, indicating an enhancement of protective mechanisms that enables them to survive an onslaught of ROS, i.e. redox adaptation. We then conducted a number of mechanistic studies in both cellular and animal models of IBC to assess the strategy of targeting redox adaptation with DSF alone and in combination with Cu. Our study provides strong evidence that DSF, in conjunction with Cu, targets tumor redox adaptation to reverse therapeutic resistance and supports the use of DSF as a novel anti‐cancer drug in IBC.
2. Materials and methods
2.1. Gene expression profiling of H2O2‐treated SUM149 cell lines and clinical samples
Messenger RNA triplicates of SUM149 cells treated with or without H2O2 were profiled using the Affymetrix HGU133A2 GeneChip at the Duke University Institute for Genome Sciences and Policy Microarray Facility. Raw expression data were background‐corrected, normalized, and summarized using Robust Multiarray Averaging method taking into account probe sequence information (GCRMA). Normalized data were filtered to include only probe sets that showed expression above log2(100) in at least 2/6 expression profiles, resulting in 9962 informative data points. Differential gene expression analysis between treated and untreated cells was performed using linear regression models implemented in the limma package of BioConductor in R. P‐values were corrected for false discovery rate (FDR) using the Benjamini and Hochberg correction. Probe sets were considered significant if the nominal p‐value was smaller than 0.05, the FDR‐adjusted P‐values smaller than 0.1, and the fold change (ratio SUM149 cells H2O2‐treated versus untreated) higher than |2|. A metagene signature designated “oxidative stress response” (OSR) was generated from the resulting gene list and defined for each sample as follows: ratio between average expression level of genes upregulated and average expression level of genes downregulated in H2O2‐treated cells. This classifier was applied to a series of 389 pre‐treatment IBC and non‐IBC samples previously described (Bertucci et al., 2013; Van Laere et al., 2013). Those samples were obtained from pre‐treatment biopsies from patients treated in three institutions: Institut Paoli‐Calmettes (IPC, Marseille, France: 71 IBC and 139 non‐IBC), MD Anderson Cancer Center (MDA, Houston, TX, USA: 25 IBC and 58 non‐IBC), and General Hospital Sint‐Augustinus (TCRU, Antwerp, Belgium: 41 IBC and 55 non‐IBC). Patients with IBC were selected by strictly adhering to the consensus diagnostic criteria published by Dawood and colleagues (Dawood and Cristofanilli, 2011). Each patient gave written informed consent, and this study was approved by the institutional review boards of all 3 participating centers. The normal breast samples series contained 21 samples extracted from the GEO public database (GSE31448, GSE16873, GSE21422). Before applying the metagene signature, Empirical Bayes normalization method with inSilicoMerging package (Taminau et al., 2012) was applied to merge all expression data sets and remove inter‐study bias; correct normalization was checked using PCA (data not shown). The molecular subtype of tumors was based on the ER, PR and HER2 statuses (Bertucci et al., 2013; Van Laere et al., 2013) as follows: hormone receptor (HR)+/HER2‐for ER and/or PR+ and HER2‐ samples, HER2+ for HER2+ samples, and triple negative (TN) for ER‐/PR‐/HER2‐ samples. A metagene score was calculated based upon the genes common to the signature and all data sets after background filtering. In addition, we tested the relationship between the IBC/non‐IBC phenotype from our 389‐sample series and another “oxidative stress” expression signature represented by the 84‐gene list from the Human Oxidative Stress RT2 Profiler PCR Array (Qiagen). Fifty‐five out of 84 genes were present in our data set and retained after background filtering, and used to classify the 389 samples by unsupervised analysis (Principal Component Analysis, PCA). We then defined the “Qiagen oxidative stress” metagene as the first component of PCA and compared its distribution between IBC and non‐IBC.
2.2. Cell culture
SUM149 and SUM190 cells were obtained from Asterand, Inc. and cultured as described previously (Aird et al., 2008). Asterand routinely characterizes cell lines by short tandem repeat polymorphism analysis. Cells were banked upon receipt and cultured for no more than 6 months before use in any assay. rSUM149 and rSUM190 are isogenic acquired resistance models established in the laboratory (Aird et al., 2010). MDA‐IBC‐3 cells were kindly provided by Dr. Woodward (MD Anderson Cancer Center) and cultured as described (Klopp et al., 2010).
2.3. Trypan blue viability assay
Cells were treated for 24 h in regular growth medium with Disulfiram (Sigma), CuSO4 (VWR), SOD mimetic (MnTnHex‐2‐PyP5+), bathocuproine disulfonate (BCS, Sigma), and tetrathiomolybdate (TM, Sigma). Cell viability was determined by trypan blue exclusion as described previously (Aird et al., 2008) where % viability was calculated as live cells/total cells ×100.
2.4. Western immunoblotting
Cell lysates were harvested after treatment with DSF ± Cu for 24 h. Membranes were incubated with primary antibodies against XIAP, SOD2 (BD Bioscience), SOD1, PARP, eIF4G1, p38, ERK1/2 (p44/42 MAPK), NFκB (p65 subunit) (Cell Signaling Technologies), Ctr1 (Nose et al., 2006), actin, or GAPDH (Santa Cruz Biotechnology Inc.) overnight at 4 °C as described previously (Aird et al., 2008). Additional information about antibodies used in this study is provided in Supplementary Table 1. Stripping of membranes to detect total protein was done as previously (Aird et al., 2010). Densitometric analysis was conducted using NIH ImageJ software (Abramoff, 2004).
2.5. Measurement of ROS
Mitochondrial (Mitosox Red) and cytoplasmic (DHE) ROS were measured as described previously (Aird et al., 2012). Cells were treated with DSF ± Cu for 24 h, harvested, and analyzed by flow cytometry. 25,000 events were collected on a FACSCalibur (Becton Dickinson) flow cytometer and analyzed using Cellquest (Becton Dickinson). For DHE, high fluorescence was calculated by setting a gate on control cells where the peak reached a minimum; experimental samples were compared to this control. For MitoSox Red, mean fluorescent intensity was determined and all samples normalized to untreated.
2.6. Glutathione assay
Reduced glutathione levels were assessed as described previously (Aird et al., 2012) using the GSH‐Glo Glutathione Assay (Promega) according to manufacturer's instructions.
2.7. Nrf2 activity assay
Cells in opaque 96‐well plates (Greiner Bio‐One) were transfected with pGL4.37 (ARE firefly luciferase reporter, Promega) and pGL4.75 (Renilla luciferase control, Promega) plasmids using a 3:1 ratio of Xtremegene HP (Roche Applied Science, Indianapolis, IN) to DNA. The next day, cells were treated as indicated. After 24 h, the Dual‐Glo Luciferase Assay System (Promega) was used and luminescence read on a Veritas microplate luminometer (Turner BioSystems). Firefly luminescence was normalized to Renilla luminescence for each sample, and this value normalized to untreated.
2.8. Measurement of cell‐associated Cu in cell lysates and murine tumor tissue
Cell lysates were prepared as above. For tumors, a portion of each tumor was placed into tissue lysis buffer (GoldBio Technology) and homogenized using the Bullet Blender Storm and lysis beads (MidSci). Lysates were analyzed for Cu content using a Thermo Scientific Element2 inductively coupled plasma high‐resolution mass spectrometer (ICP‐HRMS) at the W.M. Keck Elemental Geochemistry Laboratory (University of Michigan, Ann Arbor, MI), and Cu content of lysis buffer blank was subtracted from each sample. Values were normalized to protein for reporting as ng Cu/mg protein.
2.9. Ctr1 knockdown
A luciferase‐targeting control or Ctr1‐targeting siRNAs (A and B, Invitrogen) were transfected into cells using Dharmafect 1 reagent (Thermo Scientific). 24 h post‐transfection, DSF, Cu, or DSF‐Cu was added and cells were harvested for trypan blue staining and western immunoblotting to confirm knockdown.
2.10. Complementation of Saccharomyces cerevisiae Cu+‐transport mutants
SEY6210 (wild type) (Robinson et al., 1988) and ctr1/ctr3Δ mutant MPY17 S. cerevisiae cells (Pena et al., 1998) were grown in YPEG media (3% ethanol, 3% glycerol, 1% yeast extract, 2% Bacto Peptone, 2% agar) with addition of 0–50 μM known Cu ionophore, zinc pyrithione (ZPT) (Reeder et al., 2011), or DSF. Cells were allowed to grow at 30 °C for 3 days; growth was assessed by measuring optical density at 600 nm on a Spectramax Plus 384 plate reader (Molecular Devices).
2.11. ALDEFLUOR assay
ALDH enzymatic activity was assessed using the ALDEFLUOR kit (Stem Cell Technologies) according to the manufacturer's instructions. Briefly, cells were incubated with ALDH substrate for 35 min at 37 °C. The specific ALDH inhibitor diethylaminobenzaldehyde (DEAB) was used as negative control. Sorting gates were established using 7‐AAD stained cells for viability and ALDEFLUOR‐stained cells treated with DEAB as negative controls. Dot plots from a representative experiment are shown with mean ± SEM from four experiments.
2.12. Mammosphere growth
Matrigel was applied to 24‐well plates at 150 μL/cm2 and incubated at 37 °C for 30 min to allow gel to solidify, after which 25,000 cells were seeded. After overnight incubation, treatments were applied for 24 h; images were recorded using a Motic AE2000 microscope, M14 camera, and Infinity Capture (Lumenera) software.
2.13. Anchorage‐independent growth assay
AIG was measured as previously described (Allensworth et al., 2013). Images of representative fields were taken with 5× magnification using a Zeiss Axio Observer microscope, Hamamatsu Orca ER digital camera, and MetaMorph software (Molecular Devices).
2.14. Human breast tumor xenograft studies
Female SCID mice were obtained from a breeding colony at the Cancer Center Isolation Facility at Duke University. All experiments were performed in accordance with the Duke University International Animal Care and Use Committee. SUM149 cells (1 × 10⁶) were suspended in 50 μL PBS/50 μL Matrigel and injected into the flank subcutaneously. Once tumors were palpable (50–60 mm3 volume or approximately 4.5–5 mm length or width), mice were randomly assigned to treatment groups: vehicle control (V = 5% DMSO, 5% EtOH, 90% corn oil), DSF (50 mg/kg in V), or combination of DSF and Cu (0.5 mg/kg in saline) (n = 5–6). Animals were treated daily via intraperitoneal injection, and tumor volume measured using the formula V = (L × W 2)/2 where L is length and W is width of the tumor. Tumor growth inhibition was calculated using the formula: TGI = (1−(T/V))*100, where T is mean tumor volume for DSF‐Cu or DSF and V is mean tumor volume for vehicle. When control tumors reached humane endpoint, the experiment was terminated and all mice were sacrificed. Tumors were removed, and tissue was harvested for H&E staining, TUNEL assay, western immunoblotting, and Cu measurement.
2.15. TUNEL staining of murine tumor tissue
Tumor xenografts were fixed in 10% formalin, processed and embedded in paraffin. Serial sections were cut and deparaffinized in a series of 100%, 95% and 70% ethanol for 5 min each and washed in 1X PBS. Sections were incubated with 20 μg/mL Proteinase K solution (Roche Diagnostics) for 15 min at 25 °C. After 2 washes in 1X PBS, sections were incubated with In Situ cell death enzyme per manufacturer's instructions (In Situ Cell Death Detection Kit, Roche). Sections were coverslipped and mounted with Prolong Anti‐fade mounting medium with DAPI (Invitrogen), imaged using the Zeiss Axio Imager microscope, and analyzed with Metamorph and ImageJ software.
2.16. Statistical analysis
The statistical analyses were conducted using GraphPad Prism (GraphPad Software, Inc.) Student's 2‐tailed t‐test and Fisher's exact test. Differences were considered significant at p < 0.05.
3. Results
3.1. Altered oxidative stress response in IBC versus non‐IBC clinical samples
We first defined an oxidative stress response (OSR) signature by performing a supervised analysis comparing expression profiles of untreated SUM149 cells with SUM149 cells challenged with an acute 1 h exposure to 500 μM H2O2. Following H2O2 exposure, the cells were allowed to recover for 24 h, and then the OSR response was analyzed in the surviving tumor cells. We identified 642 differentially expressed probe sets representing 532 genes, 248 genes upregulated and 284 downregulated, in response to H2O2 challenge and recovery (Figure 1A). A metagene set designated “oxidative stress response” (OSR) was generated from this gene list (521 out of 532 genes retained after filtering), with genes upregulated including NFκB targets, antioxidants, heat shock proteins, DNA damage repair systems, and many others previously validated as participants in the oxidative stress response (Supplementary Table 2).
Figure 1.
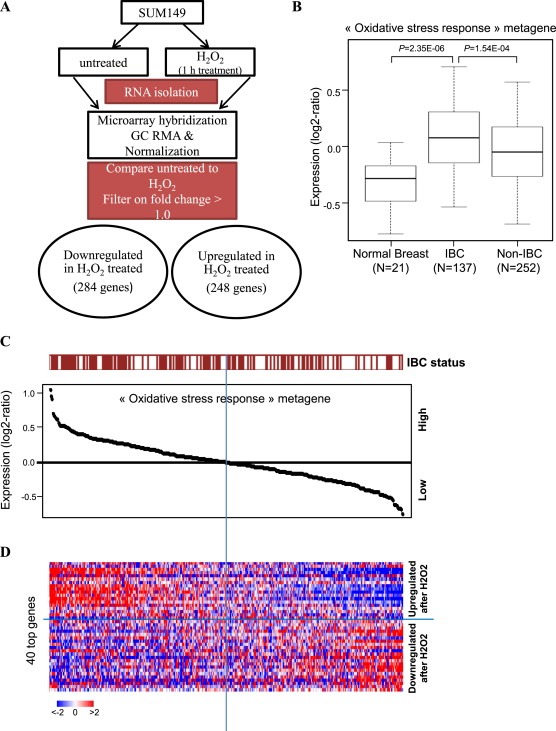
Oxidative stress response signature in IBC clinical samples. A, Schematic of development of oxidative stress response (OSR) metagene in SUM149 cells, comparing untreated to H2O2 administration. B, Expression values of the “oxidative stress response” metagene set generated from H2O2‐treated and untreated SUM149 cells; values are reported as a box plot according to the type of samples (normal breast, IBC, non‐IBC). p‐values are indicated (t‐test). C, Classification of 389 breast cancer samples from left to right based upon decreasing metagene value; the IBC/non‐IBC type is shown above the curve: red for IBC, white for non‐IBC. D, Heatmap showing expression values in BC samples from C for the top 40 genes most differentially expressed. Genes ordered from top to bottom according to decreasing log2‐ratio. Each row represents a gene and each column a sample. Expression levels are depicted according to the color scale at the bottom left, and color saturation represents the magnitude of deviation from the median.
In order to investigate our hypothesis that IBC tumors are inherently more resistant to ROS‐mediated cancer therapies as a result of an enhanced oxidative stress response, we applied the OSR metagene to gene expression data from 137 IBC patients and 252 non‐IBC patients treated across three centers as well as 21 normal breast samples. All BC samples were from diagnostic biopsies taken before systemic therapeutic intervention. As shown in Figure 1B, OSR metagene values were higher in BC patient tissues (both IBC and non‐IBC) than in normal breast samples (p = 2.35E‐06 for IBC vs normal), and IBC samples exhibited significantly higher OSR values than non‐IBC samples (p = 1.54E‐04). Figure 1C shows an enrichment of IBC tumors among the BC samples that display a higher metagene value and conversely, an enrichment of non‐IBC tumors among the breast cancer samples that display a lower value (p = 3E‐03; Fisher's exact test). Figure 1D shows the heatmap built from the 40 most differentially expressed genes out of 521. Per molecular subtype, we found that the OSR metagene was significantly higher in IBC than in nIBC in the HR+/HER2‐ subtype (p = 0.026) and the HER2+ subtype (p = 9.7E‐04), whereas there was no significant difference in the TN subtype (p = 0.23) (data not shown). In order to validate the findings of our OSR metagene, we compared the distribution of values between IBC and non‐IBC in a metagene set from Qiagen, which includes 55 genes that are known to regulate oxidative stress response in multiple cell types. Here again, IBC showed significantly higher metagene values than non‐IBC (p = 0.01; Student's t‐test; data not shown), indicating that the pronounced activation of the oxidative stress response observed with the 521‐gene signature does not depend on the fact that this signature was identified in a preclinical model of IBC. Together, these results support a general enhancement of the oxidative stress response in BC cells compared to their normal counterparts, indicative of redox adaptation. Within BC, IBC tumors are characterized by an especially strong activation of this protective regimen, which may contribute to therapeutic resistance, residual disease, and high rate of recurrence following treatment. Therefore, advanced breast cancer like IBC is likely to benefit significantly from the addition of a redox modulatory therapy that targets mediators of the oxidative stress response.
3.2. A novel redox modulatory strategy (DSF‐Cu) overcomes the OSR in therapy‐resistant IBC cells
Having determined that the oxidative stress response is especially strong in IBC patient samples, we next sought to discern whether targeting this system could enhance ROS‐induced therapeutic cell death in these aggressive tumors. For this purpose we selected DSF, a redox modulator that can react with protein thiols, bind Cu, and has been reported to inhibit NFκB. We characterized the effects of DSF alone and in combination with exogenous Cu on ROS generation and downstream redox signaling in therapy‐resistant, redox‐adapted rSUM149 cells [isogenic clonal derivatives (Aird et al., 2010) of well‐established, triple‐negative SUM149 IBC cell line] which show increased tolerance to ROS‐inducing agents (H2O2, paraquat), kinase inhibitors (lapatinib, sorafenib, sunitinib, gefitinib) and chemotherapies (including taxanes, vinca alkaloids, capecitabine, mitoxantrone, mitomycin C, and anti‐aromatases) (Williams et al., 2013). Data in Figure 2A show that DSF‐Cu induced significant levels [comparable to levels in SUM149 cells exposed to ROS‐inducing agents (Aird et al., 2012; Evans et al., 2013)] of mitochondrial (teal bars) and cytoplasmic (red bars) superoxide radicals compared to DSF or Cu alone. Increased ROS corresponded with decreased superoxide dismutase 1 (SOD1) expression (Figure 2B) and decreased levels of GSH (rSUM149 shown), the most potent cellular ROS scavenging system (Figure 2C). We then investigated the effects of DSF‐Cu on activity of Nrf2 and NFκB redox‐responsive transcription factors (Bellezza et al., 2010). Figure 2D shows that Cu (10 μM) and high‐dose DSF (10–20 μM) induced Nrf2 transcriptional activity; however, the strongest induction was observed with low dose DSF‐Cu (150 nM, 10 μM). DSF‐Cu decreased NFκB phosphorylation within 4 h following treatment (Figure 2E), and this reduction was sustained 24 h post‐treatment (Supplementary Figure S1). The ROS increase also corresponded with increased phosphorylation of p38 MAPK and ERK1/2 (Figure 2E). Incubation of cells with an exogenous SOD mimetic (MnTnHexyl‐2‐PyP5+) with potent antioxidant activity blocked cell death caused by DSF‐Cu treatment (Figure 2F, teal bars, rSUM149 shown), confirming the pro‐oxidant role of DSF‐Cu in inducing cell death in redox‐adapted rSUM149 cells.
Figure 2.
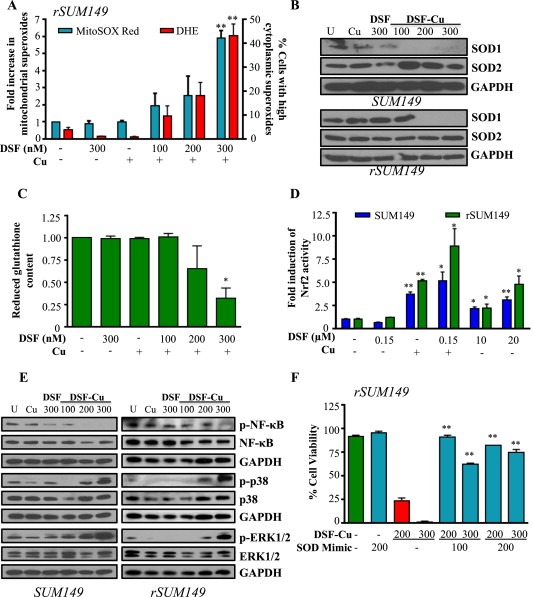
DSF‐Cu reduces cellular antioxidant capacity to induce ROS and activate redox signaling. SUM149, rSUM149 cells treated with DSF, DSF + Cu (100–300 nM, 10 μM), Cu alone (10 μM). A, Fold induction of mitochondrial superoxides (teal bars) and percentage of cells with high cytoplasmic superoxides (red bars) measured by flow cytometry. B, Immunoblot analysis of SOD1/2. C, Reduced glutathione content relative to untreated (rSUM149 shown). D, Fold induction of Nrf2 activity measured by ARE‐responsive luciferase activity. E, Immunoblot analysis of indicated proteins in treated cells at 4 h time point. F, Effect of SOD mimetic (MnTnHexyl‐2‐Pyp5+, 100–200 μM) on viability measured by trypan blue exclusion assay (rSUM149 shown). *p < 0.05, **p < 0.005 in all panels. GAPDH and respective total proteins as loading controls.
3.3. DSF‐Cu induces cell death corresponding with XIAP and eIF4G1 downregulation
We next sought to compare the effect of DSF and DSF‐Cu on viability of multiple BC cell lines. DSF induced cell death only at higher micromolar concentrations (Figure 3A: SUM149‐left, squares, IC50 ∼17 μM; rSUM149‐right, squares, IC50 ∼25–30 μM), and Cu alone was not cytotoxic. DSF's potency was significantly enhanced by addition of 10 μM Cu (DSF‐Cu), with approximately 100‐fold decrease in IC50 values in SUM149 and rSUM149. Remarkably, DSF‐Cu caused cell death in redox‐adapted rSUM149 cells at levels comparable to parental redox‐sensitive SUM149 cells. DSF‐Cu has been found to be non‐toxic to normal, immortalized breast cells (MCF10A) at up to 20 μM (Chen et al., 2006). In addition, similar to SUM149 cells, DSF‐induced cell death by Cu was observed in other IBC cell lines tested (Supplementary Figure S2), which included MDA‐IBC‐3 (Her2‐overexpressing), SUM190 (Her2‐overexpressing, ROS sensitive), and rSUM190 (isogenic derivative of SUM190 with therapeutic resistance, redox adaptation). SUM190 cells were highly sensitive to DSF‐Cu treatment even at very low DSF concentrations. Comparison with other non‐IBC cell lines (T47D, MDA‐MB‐436, and MDA‐MB‐468) revealed that similar to IBC cells, addition of Cu to DSF induced cell death at similar dose ranges tested, albeit with somewhat lower potency compared to SUM149 cells (data not shown).
Figure 3.
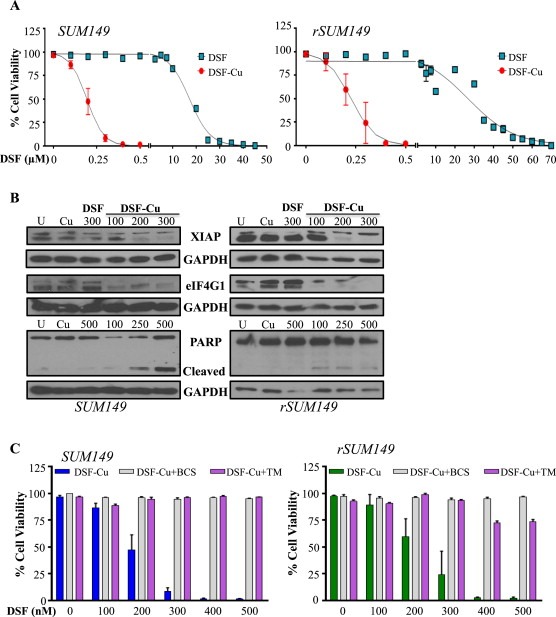
DSF induces Cu‐dependent apoptosis. A, Dose‐dependent measurement of viability in cells treated with DSF, Cu (10 μM), or DSF‐Cu. B, Immunoblot analysis of apoptotic pathway proteins. GAPDH as loading control. C, Viability in the presence of Cu chelators bathocuproine disulphonate (BCS, 100 μM, gray bars) or tetrathiomolybdate (TM, 10 μM, purple bars) measured by trypan blue exclusion assay.
Decrease in IBC cell viability in the presence of DSF‐Cu correlated with decreased levels of XIAP, considered the most potent mammalian caspase inhibitor and anti‐apoptotic protein (Figure 3B). This is consistent with the fact that oxidative stress can trigger the intrinsic apoptotic pathway, and our previous studies identified that XIAP overexpression in IBC cells correlates with resistance to therapeutic apoptosis (Aird et al., 2008, 2010, 2012). Further, DSF‐Cu‐mediated cell death was associated with decreased expression of eIF4G1 (a disease pathogenesis factor identified in IBC tumors (Silvera et al., 2009)) and increased PARP cleavage (Figure 3B). Together, these data suggest that induction of apoptotic cell death is a primary mode of action of DSF‐Cu.
To determine whether the interaction between DSF and Cu is necessary for DSF's mechanism of action, we evaluated the impact of disrupting the DSF‐Cu interaction using high affinity chelators to sequester free Cu. Addition of bathocuproine disulphonate (BCS, gray bars) (Cen et al., 2004), or tetrathiomolybdate (TM, purple bars) (Brewer, 2009) almost completely blocked DSF‐Cu‐induced cell death in SUM149 (Figure 3C, left) and rSUM149 (Figure 3C, right) cells, highlighting the importance of Cu binding for enhancement of DSF's cytotoxic effects. While TM has been previously reported to induce cancer cell death through its ability to sequester Cu (Brewer, 2009), the TM–Cu mixture was without effect in these models of IBC. These data confirm that the activity of DSF is not related to Cu sequestration, but rather a gain of function that results in increased ROS production.
3.4. DSF is a Cu ionophore that induces Ctr1‐independent Cu accumulation in IBC cells
Given that Cu interacts with DSF and this interaction is necessary for cytotoxicity, it was of interest to address whether DSF affects Cu accumulation in IBC cells. A slight increase in Cu accumulation at 24 h, measured by ICP‐HRMS, was observed upon treatment with 10 μM Cu; however, there was a dramatic dose‐dependent increase in cell‐associated Cu following treatment with DSF‐Cu, with up to a 30‐fold increase at the maximum concentration tested (Figure 4A). Analysis of protein levels of the Cu transporter Ctr1, which tightly regulates Cu import, revealed expression (Figure 4B) in mammary epithelial cells (HME1), normal‐like MCF10A cells, and the IBC cell lines (SUM149, rSUM149, SUM190, MDA‐IBC‐3). rSUM149 cells expressed Ctr1 at much lower levels than SUM149, but notably, Cu accumulation in the presence of DSF (Figure 4A) was similar in SUM149 and rSUM149 cells irrespective of Ctr1 expression status. These findings suggest that transport via the classical cellular Ctr1 mechanism may not play a significant role in DSF‐mediated Cu accumulation. To investigate the possibility that DSF may promote cellular uptake of Cu in a Ctr1‐independent fashion, two Ctr1‐targeting siRNAs were used to knock down expression of the Cu transporter in SUM149 cells (Figure 4C, right). Assessment of viability revealed that Ctr1 knockdown (Figure 4C, left, gray and purple) does not change the sensitivity of SUM149 cells to DSF (Figure 4C, left, white bars).
Figure 4.
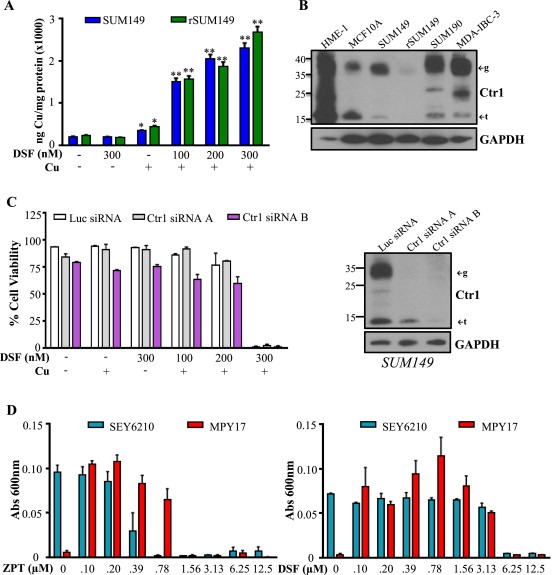
DSF acts as an ionophore to induce Ctr1‐independent Cu uptake. A, Cu content (ng) normalized to protein (mg) in SUM149 (blue bars) and rSUM149 (green bars) treated with DSF alone or in combination with Cu measured by ICP‐HRMS. *p < 0.05, **p < 0.005. B, Ctr1 expression in normal and IBC cell lines. ←g indicates glycosylated form, ←t indicates truncated form. GAPDH as loading control. C, Left: Viability of SUM149 cells treated with Ctr1‐targeting siRNAs (gray and purple bars) or control luciferase‐targeting siRNA (white bars) following DSF (300 nM), Cu (10 μM), or DSF‐Cu (100–300 nM, 10 μM) treatment for 24 h. Right: Immunoblot analysis of SUM149 cells treated with Ctr1‐targeting siRNAs (A and B) or control luciferase‐targeting siRNA. D, Growth of SEY6210 (blue bars) and Ctr1/3‐deficient MPY17 (red bars) S. cerevisiae cells in YPEG media with addition of ZPT (left) or DSF (right) measured by absorbance at 600 nm.
In addition, to further evaluate the Cu ionophore activity of DSF, we took advantage of a novel yeast model. We examined the growth of wild type S. cerevisiae (SEY6210) and a ctr1/ctr3Δ mutant (MPY17) lacking both high affinity Cu transporters (yeast express Ctr1 and Ctr3, while humans have only Ctr1) (Pena et al., 1998) in YPEG media, where Cu is required for growth. Data in Figure 4D show that while wild type SEY6210 cells (teal bars) grew well in YPEG due to their ability to take up trace levels of Cu from the media, the ctr1/ctr3Δ MPY17 cells (red bars) did not. However, in the presence of the known Cu ionophore zinc pyrithione (ZPT) (Reeder et al., 2011), MPY17 cells grew similarly to the SEY6210 cells. In this assay, the addition of DSF to MPY17 cells enhanced their growth similar to ZPT treatment. These results strongly support that DSF acts as a Cu ionophore in a Ctr1‐independent manner leading to DSF‐Cu mediated cell death in IBC cells.
3.5. DSF‐Cu inhibits anchorage‐independent growth and ALDH1 activity in IBC cells
Because SUM149 cells can form mammospheres (Debeb et al., 2012) and therapeutic response of 3D cultures is generally more indicative of in vivo activity, the effects of DSF, Cu, and DSF‐Cu on 3D IBC structure were assessed. We observed ablation of IBC cell mammospheres formed in Matrigel after treatment with DSF‐Cu, evidenced by dispersion of cell clusters (Figure 5A). Paralleling 2D culture conditions, SUM149 mammospheres remained intact following treatment with either agent alone.
Figure 5.
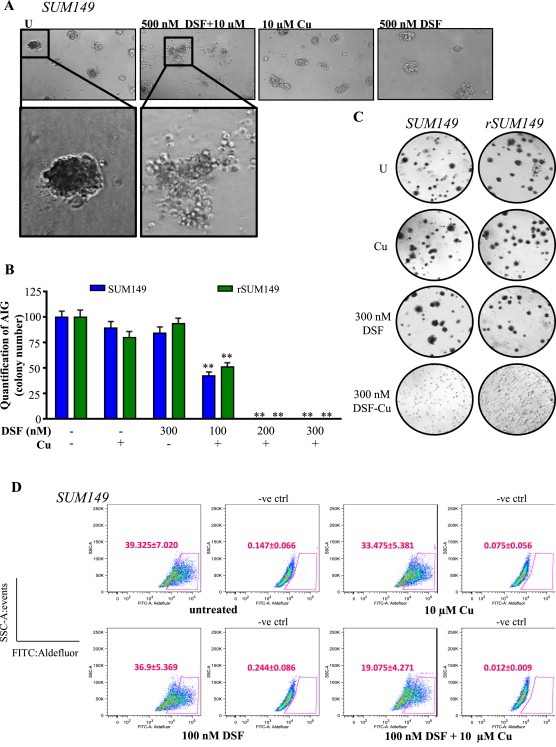
DSF‐Cu inhibits AIG and ALDH activity of IBC cells. A, Representative images of SUM149 mammospheres treated with indicated concentrations. Magnification: 10× inset: 20×. B, Quantification of AIG assay (by colony number) relative to untreated in SUM149 (blue bars) and rSUM149 (green bars) cells treated with DSF, Cu (10 μM), or DSF‐Cu complex. C, Representative AIG images of cells treated as indicated. D, Representative dot‐plots of ALDH1 activity. Cells were incubated with ALDEFLUOR substrate (BAAA), and the specific inhibitor of ALDH1, DEAB, was used to establish the baseline fluorescence and define ALDEFLUOR‐positivity (gated population). DEAB‐treated plots are labeled as –ve ctrl. Mean ± SEM of four independent experiments. Inset, Labeling of X and Y axes.
Anchorage‐independent growth (AIG) in soft agar is widely used as an in vitro model to assess cancer cell tumorigenicity and is considered a useful predictor of in vivo activity (Debeb et al., 2012). AIG (measured by colony number) was significantly inhibited by DSF‐Cu in both SUM149 and rSUM149 cell lines (Figure 5B). Representative images in Figure 5C show an abundance of large colonies in untreated and single treatment samples, while only diffuse individual cells are seen in DSF‐Cu‐treated samples.
Since DSF is an inhibitor of the aldehyde dehydrogenase class of enzymes (Johansson, 1992), we wanted to determine whether DSF or DSF‐Cu could inhibit the tumorigenic factor ALDH. SUM149 cells were treated for 24 h with a sub‐lethal dose of DSF or DSF‐Cu and analyzed for ALDH activity using the ALDEFLUOR assay. Data in Figure 5D show that while neither DSF nor Cu alone affected the ALDH+ population, DSF‐Cu significantly reduced the proportion of ALDH+ cells (Figure 5D, p < 0.005). These data are highly relevant as IBC tumors and cell lines, including SUM149, are often characterized by a high degree of ALDH activity, which has been linked with increased growth capacity in 3D culture and enhanced tumorigenicity in vivo (Charafe‐Jauffret et al., 2010).
3.6. DSF‐Cu inhibits growth of SUM149‐derived tumors in an in vivo murine model
To further investigate DSF as a potential therapeutic strategy for IBC, we utilized an in vivo tumor model to evaluate the anti‐tumoral efficacy of systemically administered DSF and Cu. Mice were treated daily with vehicle control, DSF, or DSF‐Cu, and tumor volume was monitored. DSF‐Cu significantly inhibited growth of SUM149 tumors compared to vehicle control and DSF alone (p = 3.4E‐06, Figure 6A). Mice treated with DSF‐Cu reached an average tumor volume of 363 mm3 over the study, while all vehicle‐treated tumors exceeded 1500 mm3, revealing 84% inhibition of tumor growth (Figure 6A). Tumor burden in the DSF treatment group was reduced at the time of dissection despite no reduction in tumor growth, however tumor burden was lowest in the DSF‐Cu group (75%; p < 0.0001). Whole animal weights did not change significantly in any group during treatment (Supplementary Table 3). Data in Figure 6B show reduced levels of NFκB p65 phosphorylation, eIF4G1 and SOD1 expression in DSF‐Cu‐treated tumor lysates, consistent with results from our in vitro studies (2, 3B). Tumors from mice treated with vehicle and DSF showed little to no TUNEL staining (apoptotic marker) (Figure 6C, left and middle panel), while tumor cells from DSF‐Cu‐treated mice showed significant TUNEL staining (Figure 6C, right panel). Quantitation of the number of TUNEL positive cells is displayed in Figure 6D.
Figure 6.
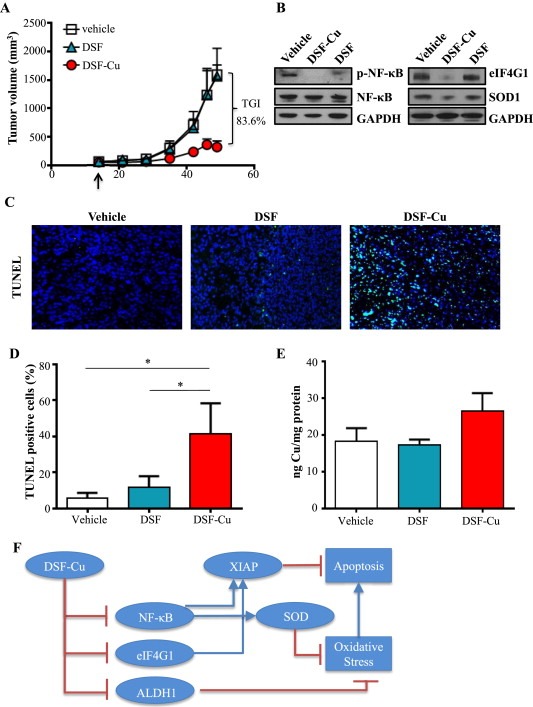
DSF‐Cu inhibits tumor growth in an in vivo model of IBC. A, Tumor volumes (measured V = (L × W2)/2) of mice with SUM149 subcutaneous flank tumors treated with vehicle, DSF, or DSF‐Cu. B, Representative immunoblot analysis of indicated proteins in tumor lysates from mice treated with vehicle, DSF, or DSF‐Cu. GAPDH as loading control. C, Representative images of tumor tissue from mice treated with vehicle, DSF, or DSF‐Cu with TUNEL staining. Magnification: 40×. DAPI (nuclei): blue; TUNEL (apoptotic cells): green. D, Quantification of TUNEL positive cells (from C). Mean ± SEM % TUNEL positive/total number of cells, *p < 0.05. E, Cu content of excised tumors (ng) measured by ICP‐HRMS relative to protein (mg). F, Schematic representation of DSF‐Cu mechanisms of action. DSF‐Cu complex acts as a pro‐oxidant, induces ROS‐mediated cancer cell death by inhibiting NFκB, which attenuates NFκB‐dependent antioxidant and anti‐apoptotic gene expression. DSF‐Cu inhibits ALDH1, which has been implicated in protection from ROS. DSF‐Cu also inhibits the potent anti‐apoptotic protein, XIAP, and translation initiation factor eIF4G1 (which can enhance XIAP translation during cell stress), promoting apoptosis.
Our own studies (Figure 4), consistent with a previous report (Cen et al., 2004), indicated that DSF can increase uptake of Cu by cancer cells in culture. Because bioavailability and tissue distribution are important pharmacokinetic factors, we investigated whether administered Cu reached the tumor by comparing Cu concentrations between treated tumors. DSF‐Cu treatment resulted in higher intratumoral Cu concentrations measured via ICP‐HRMS, although the difference was not statistically significant potentially due to limited sample size (Figure 6E). Together, these results indicate that DSF‐Cu is an effective combination whose mechanisms including targeting of the oxidative stress response and the anti‐apoptotic program work together to inhibit tumor growth in an in vivo setting. The schematic in Figure 6F summarizes the multi‐factorial mechanisms that contribute to DSF‐Cu's anti‐tumoral efficacy.
4. Discussion
Cancer cells are under persistent oxidative stress relative to normal cells, and redox status regulates many cancer cell characteristics such as activation of proto‐oncogenes and transcription factors, genomic instability, and therapeutic outcome. To compensate for increased oxidative stress, cancer cells activate redox adaptive mechanisms which enhance their ability to detoxify ROS (Trachootham et al., 2009). To examine oxidative stress response in BC, we identified 521 differentially expressed genes in SUM149 cells (an established, well‐studied model of IBC) with and without addition of the classical ROS inducer, H2O2. We applied this oxidative stress response (OSR) metagene to expression data from pretreatment IBC and non‐IBC clinical samples and normal breast tissue. The data revealed the identified OSR metagene scores were significantly higher in IBC samples than in non‐IBC samples or normal breast tissue. As the efficacy of many anti‐cancer agents depends on a strong induction of ROS and oxidative stress‐induced cell death, resistance to those therapies develops when cancer types with inherently high ROS levels like IBC evolve redox adaptive mechanisms that allow them to survive in an environment of increased oxidative stress. Thus, the IBC tumor cells with an inherently high OSR may represent a redox‐adapted population that develops high rates of failure to ROS‐inducing treatments like chemo‐ and radiotherapy. Therefore, introduction of a redox modulatory strategy has the potential to block the oxidative stress response, tip the balance toward ROS‐mediated cell death, and enhance efficacy of traditional therapies in cancer cells (Trachootham et al., 2009). In the current study, DSF, an FDA‐approved anti‐alcoholism drug used for over 40 years with extensive pre‐clinical, clinical, and safety data (Johansson, 1992), induced potent ROS accumulation and death in IBC cells when combined with exogenous Cu. Further, DSF‐Cu equalized the response of cells with acquired therapeutic resistance (rSUM149 and rSUM190) to that of their more sensitive parental counterparts.
In addition to the fact that dithiocarbamates like DSF can bind Cu (Hogarth, 2012), we identified that DSF acts as a Cu ionophore, facilitating cellular Cu accumulation in a Ctr1‐independent manner. Although use of Cu as an anti‐cancer agent is considered attractive (Gupte and Mumper, 2009), intracellular transport of Cu is a major challenge due to stringent control by Cu transporters. One scenario for the mechanism of DSF‐Cu complex formation is that lipophilic DSF penetrates into cancer cells to form the apoptosis‐inducing Cu(deDTC)2 complex with intracellular Cu. As many cancer cells, including breast, have higher levels of Cu than normal tissue (two‐to three‐fold increases) (Mulay et al., 1971; Rizk and Sky‐Peck, 1984), the increase in Cu(deDTC)2 after DSF enters may enable DSF to target cancer cells selectively (Chen et al., 2006). However, in the IBC cells tested here, DSF induced toxicity only at concentrations greater than 10 μM, a dose that is not readily achievable in human plasma where the accepted daily dosing of 250–500 mg yields a plasma concentration <2 μM (Faiman et al., 1984). DSF's potency was significantly enhanced by exogenous Cu, with IC50s for DSF‐Cu in the 200–300 nM range in SUM149 and rSUM149 (Figure 3A). In the present study, the addition of DSF significantly enhanced cell‐associated Cu concentrations (Figure 4A), indicating that DSF plays a role in mediating Cu uptake rather than just binding intracellular Cu. Further, the fact that DSF‐Cu is equally effective in rSUM149 cells, which express Ctr1 at significantly lower levels than SUM149 (Figure 4B), indicates that a Ctr1‐independent mechanism is behind DSF‐Cu efficacy. The inability of Ctr1 knockdown to inhibit DSF‐Cu‐mediated cell death (Figure 4C) confirms the Ctr1‐independence of DSF‐Cu and provides further evidence for DSF as a Cu ionophore. These results are consistent with a model in which DSF complexes with Cu in the extracellular space and transports it across the plasma membrane into the cell as part of the Cu(deDTC)2 complex.
It has been shown that dysregulation of NFκB (a pro‐survival factor and redox sensor) and its target genes is a critical molecular determinant in IBC disease progression (Iwamoto et al., 2011; Nguyen et al., 2006; Van Laere et al., 2006). DSF‐Cu inhibited NFκB activation and decreased antioxidants levels in SUM149 and rSUM149 cells, leading to activation of a pro‐apoptotic redox response (Figure 2B, C, and E). Another observation of significance is downregulation of XIAP by DSF‐Cu (Figure 3B). XIAP, the most potent anti‐apoptotic protein, is considered a chemoresistance factor in many cancer types (Kashkar, 2010), and we have previously reported a strong correlation between XIAP overexpression and acquired resistance to trastuzumab (Aird et al., 2008), TRAIL (Allensworth et al., 2012), lapatinib (Aird et al., 2010), and other therapies (Williams et al., 2013) in IBC. Further, XIAP is a Cu homeostasis factor, and formation of a Cu‐XIAP complex can inhibit XIAP's anti‐apoptotic function (Mufti et al., 2007), identifying a potential mechanism by which DSF‐Cu induces apoptosis. Inhibition of NFκB, a positive transcriptional regulator of XIAP, may also play a role in XIAP's downregulation. Further, XIAP is translationally upregulated during cell stress, which may involve the translation initiation factor eIF4G1 (Silvera et al., 2009). As eIF4G1 overexpression is a critical factor in tumor emboli formation and the metastatic nature of IBC (Silvera et al., 2009), reduction in eIF4G1 levels by DSF‐Cu in IBC cells (Figure 3B) and tumors (Figure 6D) would be expected to reduce tumor aggressiveness. DSF‐Cu also inhibited ALDH1 activity, which is linked to cancer stem cells (CSCs) (Croker et al., 2009), enhanced tumorigenic and metastatic potential (Croker et al., 2009), and resistance to chemo‐ and targeted therapies (Januchowski et al., 2013). Additionally, CSCs exhibit low basal levels of ROS (Diehn et al., 2009), and some studies have shown that ALDH1A1 plays an important role in protection again oxidative stress in stem cells (Singh et al., 2013); thus, ALDH represents an important target for anti‐tumor therapy, particularly in redox‐adapted cells.
5. Conclusion
Together, these data reveal the role of DSF as a Cu ionophore and demonstrate anti‐cancer efficacy of DSF‐Cu in in vitro and in vivo models of IBC. Additionally, the metagene analyses of pre‐treatment samples supports translation of this FDA‐approved drug into clinical trials for advanced breast cancers to enhance and prolong sensitivity to standard chemotherapy.
Conflict of interest disclosure
The authors disclose no conflict of interest.
Supporting information
The following are the supplementary data related to this article:
Supplementary Figure 1 Immunoblot analysis of phosphorylation status of indicated proteins in SUM149 and rSUM149 cells treated with DSF (100–300 nM), Cu (10 μM), or DSF‐Cu (100–300 nM, 10 μM) for 24 h. Respective total proteins and GAPDH as loading controls.
Supplementary Figure 2 Viability of (A) SUM190, (B) rSUM190, and (C) MDA‐IBC‐3 IBC cells treated with DSF (0–70 μM, squares), Cu (10 μM) or DSF‐Cu (100–500 nM, 10 μM, circles) measured by trypan blue exclusion assay. DSF‐Cu is not shown for SUM190 and rSUM190, as the combination resulted in 0% cell viability at all doses test (as low as 50 nM DSF, 10 μM Cu).
Supplementary Table 1 List of antibodies, companies, catalog numbers, and dilutions used in this study.
Supplementary Table 2 List of 532 genes differentially expressed between H2O2‐treated and untreated SUM149 cells.
Supplementary Table 3 Statistics for mice used in the in vivo study. Tumor burden was determined by dividing tumor weight by final mouse weight; tumor doubling time was found by fitting a nonlinear regression model to tumor volumes in GraphPad Prism.
Acknowledgments
We thank Ted Huston in the W. M. Keck Lab in the Department of Earth & Environmental Sciences at the University of Michigan for ICP‐HRMS analyses; Tao Wang, Hasan Abbas, and Jess Hendin for technical assistance; and Drs. Shelley Hwang, P. Kelly Marcom, Dan George, Scott Sauer, and H. Kim Lyerly for helpful discussions and Duke Cancer Institute Microscopy core. This work was supported by American Cancer Society Grant RSG‐08‐290‐01‐CCE, Dept. of Surgery research funds and Duke Cancer Institute Cancer and Environment P3917733 sub‐award (G. R. Devi), Duke Graduate School Fellowship (J. L. Allensworth), Duke University Diversity Enhancement Fellowship (M. K. Evans), NIH grants GM41840 and DK074192 (D. T. Thiele), CA198818 (D. P. McDonnell.) and NIH Postdoctoral Fellowship F32 GM100678 (R. F. Safi).
Supplementary data 1.
1.1.
Supplementary data related to this article can be found at http://dx.doi.org/10.1016/j.molonc.2015.02.007.
Allensworth Jennifer L., Evans Myron K., Bertucci François, Aldrich Amy J., Festa Richard A., Finetti Pascal, Ueno Naoto T., Safi Rachid, McDonnell Donald P., Thiele Dennis J., Van Laere Steven, Devi Gayathri R., (2015), Disulfiram (DSF) acts as a copper ionophore to induce copper-dependent oxidative stress and mediate anti-tumor efficacy in inflammatory breast cancer, Molecular Oncology, 9, doi: 10.1016/j.molonc.2015.02.007.
References
- Abramoff, M.D. , Magalhaes, P.J. , Ram, S.J. , 2004. Image processing with ImageJ. Biophotonics Int. 11, 36–42. [Google Scholar]
- Aird, K.M. , Allensworth, J.L. , Batinic-Haberle, I. , Lyerly, H.K. , Dewhirst, M.W. , Devi, G.R. , 2012. ErbB1/2 tyrosine kinase inhibitor mediates oxidative stress-induced apoptosis in inflammatory breast cancer cells. Breast Cancer Res. Treat. 132, 109–119. [DOI] [PMC free article] [PubMed] [Google Scholar]
- Aird, K.M. , Ding, X. , Baras, A. , Wei, J. , Morse, M.A. , Clay, T. , Lyerly, H.K. , Devi, G.R. , 2008. Trastuzumab signaling in ErbB2-overexpressing inflammatory breast cancer correlates with X-linked inhibitor of apoptosis protein expression. Mol. Cancer Ther. 7, 38–47. [DOI] [PubMed] [Google Scholar]
- Aird, K.M. , Ghanayem, R.B. , Peplinski, S. , Lyerly, H.K. , Devi, G.R. , 2010. X-linked inhibitor of apoptosis protein inhibits apoptosis in inflammatory breast cancer cells with acquired resistance to an ErbB1/2 tyrosine kinase inhibitor. Mol. Cancer Ther. 9, 1432–1442. [DOI] [PMC free article] [PubMed] [Google Scholar]
- Allensworth, J.L. , Aird, K.M. , Aldrich, A.J. , Batinic-Haberle, I. , Devi, G.R. , 2012. XIAP inhibition and generation of reactive oxygen species enhances TRAIL sensitivity in inflammatory breast cancer cells. Mol. Cancer Ther. 11, 1518–1527. [DOI] [PubMed] [Google Scholar]
- Allensworth, J.L. , Sauer, S.J. , Lyerly, H.K. , Morse, M.A. , Devi, G.R. , 2013. Smac mimetic Birinapant induces apoptosis and enhances TRAIL potency in inflammatory breast cancer cells in an IAP-dependent and TNF-alpha-independent mechanism. Breast Cancer Res. Treat. 137, 359–371. [DOI] [PubMed] [Google Scholar]
- Bellezza, I. , Mierla, A.L. , Minelli, A. , 2010. Nrf2 and NF-kappaB and their concerted modulation in Cancer pathogenesis and progression. Cancers 2, 483–497. [DOI] [PMC free article] [PubMed] [Google Scholar]
- Bertucci, F. , Ueno, N.T. , Finetti, P. , Vermeulen, P. , Lucci, A. , Robertson, F.M. , Marsan, M. , Iwamoto, T. , Krishnamurthy, S. , Masuda, H. , Van Dam, P. , Woodward, W.A. , Cristofanilli, M. , Reuben, J.M. , Dirix, L. , Viens, P. , Symmans, W.F. , Birnbaum, D. , Van Laere, S.J. , 2014. Gene expression profiles of inflammatory breast cancer: correlation with response to neoadjuvant chemotherapy and metastasis-free survival. Ann. Oncol. : Off. J. Eur. Soc. Med. Oncology/ESMO 25, (2) 358–365. [DOI] [PMC free article] [PubMed] [Google Scholar]
- Brewer, G.J. , 2009. The use of copper-lowering therapy with tetrathiomolybdate in medicine. Expert Opin. Investig. Drugs 18, 89–97. [DOI] [PubMed] [Google Scholar]
- Brown, N.S. , Bicknell, R. , 2001. Hypoxia and oxidative stress in breast cancer. Oxidative stress: its effects on the growth, metastatic potential and response to therapy of breast cancer. Breast Cancer Res. 3, 323–327. [DOI] [PMC free article] [PubMed] [Google Scholar]
- Cen, D. , Brayton, D. , Shahandeh, B. , Meyskens, F.L. , Farmer, P.J. , 2004. Disulfiram facilitates intracellular Cu uptake and induces apoptosis in human melanoma cells. J. Med. Chem. 47, 6914–6920. [DOI] [PubMed] [Google Scholar]
- Charafe-Jauffret, E. , Ginestier, C. , Iovino, F. , Tarpin, C. , Diebel, M. , Esterni, B. , Houvenaeghel, G. , Extra, J.M. , Bertucci, F. , Jacquemier, J. , Xerri, L. , Dontu, G. , Stassi, G. , Xiao, Y. , Barsky, S.H. , Birnbaum, D. , Viens, P. , Wicha, M.S. , 2010. Aldehyde dehydrogenase 1-positive cancer stem cells mediate metastasis and poor clinical outcome in inflammatory breast cancer. Clin. Cancer Res. : Off. J. Am. Assoc. Cancer Res. 16, 45–55. [DOI] [PMC free article] [PubMed] [Google Scholar]
- Chen, D. , Cui, Q.C. , Yang, H. , Dou, Q.P. , 2006. Disulfiram, a clinically used anti-alcoholism drug and copper-binding agent, induces apoptotic cell death in breast cancer cultures and xenografts via inhibition of the proteasome activity. Cancer Res. 66, 10425–10433. [DOI] [PubMed] [Google Scholar]
- Croker, A.K. , Goodale, D. , Chu, J. , Postenka, C. , Hedley, B.D. , Hess, D.A. , Allan, A.L. , 2009. High aldehyde dehydrogenase and expression of cancer stem cell markers selects for breast cancer cells with enhanced malignant and metastatic ability. J. Cell. Mol. Med. 13, 2236–2252. [DOI] [PMC free article] [PubMed] [Google Scholar]
- Dawood, S. , Cristofanilli, M. , 2011. Inflammatory breast cancer: what progress have we made?. Oncology (Williston Park, N.Y.) 25, 264–270. 273 [PubMed] [Google Scholar]
- Debeb, B.G. , Cohen, E.N. , Boley, K. , Freiter, E.M. , Li, L. , Robertson, F.M. , Reuben, J.M. , Cristofanilli, M. , Buchholz, T.A. , Woodward, W.A. , 2012. Pre-clinical studies of notch signaling inhibitor RO4929097 in inflammatory breast cancer cells. Breast Cancer Res. Treat. 134, 495–510. [DOI] [PMC free article] [PubMed] [Google Scholar]
- Diehn, M. , Cho, R.W. , Lobo, N.A. , Kalisky, T. , Dorie, M.J. , Kulp, A.N. , Qian, D. , Lam, J.S. , Ailles, L.E. , Wong, M. , Joshua, B. , Kaplan, M.J. , Wapnir, I. , Dirbas, F.M. , Somlo, G. , Garberoglio, C. , Paz, B. , Shen, J. , Lau, S.K. , Quake, S.R. , Brown, J.M. , Weissman, I.L. , Clarke, M.F. , 2009. Association of reactive oxygen species levels and radioresistance in cancer stem cells. Nature 458, 780–783. [DOI] [PMC free article] [PubMed] [Google Scholar]
- Evans, M.K. , Tovmasyan, A. , Batinic-Haberle, I. , Devi, G.R. , 2013. Mn porphyrin in combination with ascorbate acts as a pro-oxidant and mediates caspase-independent cancer cell death. Free Radic. Biol. Med. 68c, 302–314. [DOI] [PMC free article] [PubMed] [Google Scholar]
- Faiman, M.D. , Jensen, J.C. , Lacoursiere, R.B. , 1984. Elimination kinetics of disulfiram in alcoholics after single and repeated doses. Clin. Pharmacol. Ther. 36, 520–526. [DOI] [PubMed] [Google Scholar]
- Fraga, C.G. , 2005. Relevance, essentiality and toxicity of trace elements in human health. Mol. Aspects Med. 26, 235–244. [DOI] [PubMed] [Google Scholar]
- Gorrini, C. , Harris, I.S. , Mak, T.W. , 2013. Modulation of oxidative stress as an anticancer strategy. Nature reviews. Drug Discov. 12, 931–947. [DOI] [PubMed] [Google Scholar]
- Gupte, A. , Mumper, R.J. , 2009. Elevated copper and oxidative stress in cancer cells as a target for cancer treatment. Cancer Treat. Rev. 35, 32–46. [DOI] [PubMed] [Google Scholar]
- Hogarth, G. , 2012. Metal-dithiocarbamate complexes: chemistry and biological activity. Mini Rev. Med. Chem. 12, 1202–1215. [DOI] [PubMed] [Google Scholar]
- Iwamoto, T. , Bianchini, G. , Qi, Y. , Cristofanilli, M. , Lucci, A. , Woodward, W.A. , Reuben, J.M. , Matsuoka, J. , Gong, Y. , Krishnamurthy, S. , Valero, V. , Hortobagyi, G.N. , Robertson, F. , Symmans, W.F. , Pusztai, L. , Ueno, N.T. , 2011. Different gene expressions are associated with the different molecular subtypes of inflammatory breast cancer. Breast Cancer Res. Treat. 125, 785–795. [DOI] [PMC free article] [PubMed] [Google Scholar]
- Januchowski, R. , Wojtowicz, K. , Zabel, M. , 2013. The role of aldehyde dehydrogenase (ALDH) in cancer drug resistance. Biomed. Pharmacother. = Biomedecine Pharmacotherapie 67, 669–680. [DOI] [PubMed] [Google Scholar]
- Johansson, B. , 1992. A review of the pharmacokinetics and pharmacodynamics of disulfiram and its metabolites. Acta Psychiatrica Scand. Suppl 369, 15–26. [DOI] [PubMed] [Google Scholar]
- Kashkar, H. , 2010. X-linked inhibitor of apoptosis: a chemoresistance factor or a hollow promise. Clin. Cancer Res. : Off. J. Am. Assoc. Cancer Res. 16, 4496–4502. [DOI] [PubMed] [Google Scholar]
- Klopp, A.H. , Lacerda, L. , Gupta, A. , Debeb, B.G. , Solley, T. , Li, L. , Spaeth, E. , Xu, W. , Zhang, X. , Lewis, M.T. , Reuben, J.M. , Krishnamurthy, S. , Ferrari, M. , Gaspar, R. , Buchholz, T.A. , Cristofanilli, M. , Marini, F. , Andreeff, M. , Woodward, W.A. , 2010. Mesenchymal stem cells promote mammosphere formation and decrease E-cadherin in normal and malignant breast cells. PloS One 5, e12180 [DOI] [PMC free article] [PubMed] [Google Scholar]
- Manda, G. , Nechifor, M.T. , Neagu, T.-M. , 2009. Reactive oxygen species, Cancer and Anti-Cancer therapies. Curr. Chem. Biol. 3, 22–46. [Google Scholar]
- Masuda, H. , Brewer, T.M. , Liu, D.D. , Iwamoto, T. , Shen, Y. , Hsu, L. , Willey, J.S. , Gonzalez-Angulo, A.M. , Chavez-MacGregor, M. , Fouad, T.M. , Woodward, W.A. , Reuben, J.M. , Valero, V. , Alvarez, R.H. , Hortobagyi, G.N. , Ueno, N.T. , 2014. Long-term treatment efficacy in primary inflammatory breast cancer by hormonal receptor- and HER2-defined subtypes. Ann. Oncol. : Off. J. Eur. Soc. Med. Oncology/ESMO 25, 384–391. [DOI] [PMC free article] [PubMed] [Google Scholar]
- Mufti, A.R. , Burstein, E. , Duckett, C.S. , 2007. XIAP: cell death regulation meets copper homeostasis. Arch. Biochem. Biophys. 463, 168–174. [DOI] [PMC free article] [PubMed] [Google Scholar]
- Mulay, I.L. , Roy, R. , Knox, B.E. , Suhr, N.H. , Delaney, W.E. , 1971. Trace-metal analysis of cancerous and noncancerous human tissues. J. Natl. Cancer Inst. 47, 1–13. [PubMed] [Google Scholar]
- Nguyen, D.M. , Sam, K. , Tsimelzon, A. , Li, X. , Wong, H. , Mohsin, S. , Clark, G.M. , Hilsenbeck, S.G. , Elledge, R.M. , Allred, D.C. , O'Connell, P. , Chang, J.C. , 2006. Molecular heterogeneity of inflammatory breast cancer: a hyperproliferative phenotype. Clin. Cancer Res. : Off. J. Am. Assoc. Cancer Res. 12, 5047–5054. [DOI] [PubMed] [Google Scholar]
- Nose, Y. , Kim, B.E. , Thiele, D.J. , 2006. Ctr1 drives intestinal copper absorption and is essential for growth, iron metabolism, and neonatal cardiac function. Cell Metab. 4, 235–244. [DOI] [PubMed] [Google Scholar]
- Pena, M.M. , Koch, K.A. , Thiele, D.J. , 1998. Dynamic regulation of copper uptake and detoxification genes in Saccharomyces cerevisiae. Mol. Cell. Biol. 18, 2514–2523. [DOI] [PMC free article] [PubMed] [Google Scholar]
- Reeder, N.L. , Kaplan, J. , Xu, J. , Youngquist, R.S. , Wallace, J. , Hu, P. , Juhlin, K.D. , Schwartz, J.R. , Grant, R.A. , Fieno, A. , Nemeth, S. , Reichling, T. , Tiesman, J.P. , Mills, T. , Steinke, M. , Wang, S.L. , Saunders, C.W. , 2011. Zinc pyrithione inhibits yeast growth through copper influx and inactivation of iron-sulfur proteins. Antimicrob. Agents Chemother. 55, 5753–5760. [DOI] [PMC free article] [PubMed] [Google Scholar]
- Rizk, S.L. , Sky-Peck, H.H. , 1984. Comparison between concentrations of trace elements in normal and neoplastic human breast tissue. Cancer Res. 44, 5390–5394. [PubMed] [Google Scholar]
- Robertson, F.M. , Bondy, M. , Yang, W. , Yamauchi, H. , Wiggins, S. , Kamrudin, S. , Krishnamurthy, S. , Le-Petross, H. , Bidaut, L. , Player, A.N. , Barsky, S.H. , Woodward, W.A. , Buchholz, T. , Lucci, A. , Ueno, N.T. , Cristofanilli, M. , 2010. Inflammatory breast cancer: the disease, the biology, the treatment. CA: A Cancer J. clin 60, 351–375. [DOI] [PubMed] [Google Scholar]
- Robinson, J.S. , Klionsky, D.J. , Banta, L.M. , Emr, S.D. , 1988. Protein sorting in Saccharomyces cerevisiae: isolation of mutants defective in the delivery and processing of multiple vacuolar hydrolases. Mol. Cell. Biol. 8, 4936–4948. [DOI] [PMC free article] [PubMed] [Google Scholar]
- Rueth, N.M. , Lin, H.Y. , Bedrosian, I. , Shaitelman, S.F. , Ueno, N.T. , Shen, Y. , Babiera, G. , 2014. Underuse of trimodality treatment affects survival for patients with inflammatory breast cancer: an analysis of treatment and survival trends from the national cancer database. J. Clin. Oncol. : Off. J. Am. Soc. Clin. Oncol. 32, 2018–2024. [DOI] [PMC free article] [PubMed] [Google Scholar]
- Saigal, K. , Hurley, J. , Takita, C. , Reis, I.M. , Zhao, W. , Rodgers, S.E. , Wright, J.L. , 2013. Risk factors for locoregional failure in patients with inflammatory breast cancer treated with trimodality therapy. Clin. Breast Cancer 13, 335–343. [DOI] [PubMed] [Google Scholar]
- Silvera, D. , Arju, R. , Darvishian, F. , Levine, P.H. , Zolfaghari, L. , Goldberg, J. , Hochman, T. , Formenti, S.C. , Schneider, R.J. , 2009. Essential role for eIF4GI overexpression in the pathogenesis of inflammatory breast cancer. Nat. Cel. Biol. 11, 903–908. [DOI] [PubMed] [Google Scholar]
- Singh, S. , Brocker, C. , Koppaka, V. , Chen, Y. , Jackson, B.C. , Matsumoto, A. , Thompson, D.C. , Vasiliou, V. , 2013. Aldehyde dehydrogenases in cellular responses to oxidative/electrophilic stress. Free Radic. Biol. Med. 56, 89–101. [DOI] [PMC free article] [PubMed] [Google Scholar]
- Taminau, J. , Meganck, S. , Lazar, C. , Steenhoff, D. , Coletta, A. , Molter, C. , Duque, R. , de Schaetzen, V. , Weiss Solis, D.Y. , Bersini, H. , Nowe, A. , 2012. Unlocking the potential of publicly available microarray data using inSilicoDb and inSilicoMerging R/Bioconductor packages. BMC Bioinformatics 13, 335 [DOI] [PMC free article] [PubMed] [Google Scholar]
- Trachootham, D. , Alexandre, J. , Huang, P. , 2009. Targeting cancer cells by ROS-mediated mechanisms: a radical therapeutic approach?. Nat. Rev. Drug Discov. 8, 579–591. [DOI] [PubMed] [Google Scholar]
- Van Laere, S.J. , Ueno, N.T. , Finetti, P. , Vermeulen, P. , Lucci, A. , Robertson, F.M. , Marsan, M. , Iwamoto, T. , Krishnamurthy, S. , Masuda, H. , van Dam, P. , Woodward, W.A. , Viens, P. , Cristofanilli, M. , Birnbaum, D. , Dirix, L. , Reuben, J.M. , Bertucci, F. , 2013. Uncovering the molecular secrets of inflammatory breast cancer biology: an integrated analysis of three distinct affymetrix gene expression datasets. Clin. Cancer Res. : Off. J. Am. Assoc. Cancer Res. 19, 4685–4696. [DOI] [PMC free article] [PubMed] [Google Scholar]
- Van Laere, S.J. , Van der Auwera, I. , Van den Eynden, G.G. , Elst, H.J. , Weyler, J. , Harris, A.L. , van Dam, P. , Van Marck, E.A. , Vermeulen, P.B. , Dirix, L.Y. , 2006. Nuclear factor-kappaB signature of inflammatory breast cancer by cDNA microarray validated by quantitative real-time reverse transcription-PCR, immunohistochemistry, and nuclear factor-kappaB DNA-binding. Clin. Cancer Res. : Off. J. Am. Assoc. Cancer Res. 12, 3249–3256. [DOI] [PubMed] [Google Scholar]
- Wang, W. , McLeod, H.L. , Cassidy, J. , 2003. Disulfiram-mediated inhibition of NF-kappaB activity enhances cytotoxicity of 5-fluorouracil in human colorectal cancer cell lines. International journal of cancer. J. Int. du Cancer 104, 504–511. [DOI] [PubMed] [Google Scholar]
- Williams, K.P. , Allensworth, J.L. , Ingram, S.M. , Smith, G.R. , Aldrich, A.J. , Sexton, J.Z. , Devi, G.R. , 2013. Quantitative high-throughput efficacy profiling of approved oncology drugs in inflammatory breast cancer models of acquired drug resistance and re-sensitization. Cancer Lett. 337, 77–89. [DOI] [PMC free article] [PubMed] [Google Scholar]
- Yip, N.C. , Fombon, I.S. , Liu, P. , Brown, S. , Kannappan, V. , Armesilla, A.L. , Xu, B. , Cassidy, J. , Darling, J.L. , Wang, W. , 2011. Disulfiram modulated ROS-MAPK and NFkappaB pathways and targeted breast cancer cells with cancer stem cell-like properties. Br. J. Cancer 104, 1564–1574. [DOI] [PMC free article] [PubMed] [Google Scholar]
Associated Data
This section collects any data citations, data availability statements, or supplementary materials included in this article.
Supplementary Materials
The following are the supplementary data related to this article:
Supplementary Figure 1 Immunoblot analysis of phosphorylation status of indicated proteins in SUM149 and rSUM149 cells treated with DSF (100–300 nM), Cu (10 μM), or DSF‐Cu (100–300 nM, 10 μM) for 24 h. Respective total proteins and GAPDH as loading controls.
Supplementary Figure 2 Viability of (A) SUM190, (B) rSUM190, and (C) MDA‐IBC‐3 IBC cells treated with DSF (0–70 μM, squares), Cu (10 μM) or DSF‐Cu (100–500 nM, 10 μM, circles) measured by trypan blue exclusion assay. DSF‐Cu is not shown for SUM190 and rSUM190, as the combination resulted in 0% cell viability at all doses test (as low as 50 nM DSF, 10 μM Cu).
Supplementary Table 1 List of antibodies, companies, catalog numbers, and dilutions used in this study.
Supplementary Table 2 List of 532 genes differentially expressed between H2O2‐treated and untreated SUM149 cells.
Supplementary Table 3 Statistics for mice used in the in vivo study. Tumor burden was determined by dividing tumor weight by final mouse weight; tumor doubling time was found by fitting a nonlinear regression model to tumor volumes in GraphPad Prism.