Abstract
Objective
To investigate the global functional reorganization of the brain following spinal cord injury with graph theory based approach by creating whole brain functional connectivity networks from resting state-functional magnetic resonance imaging (rs-fMRI), characterizing the reorganization of these networks using graph theoretical metrics and to compare these metrics between patients with spinal cord injury (SCI) and age-matched controls.
Methods
Twenty patients with incomplete cervical SCI (14 males, 6 females; age, 55±14.1 years) and 20 healthy subjects (10 males, 10 females; age, 52.9±13.6 years) participated in this study. To analyze the characteristics of the whole brain network constructed with functional connectivity using rs-fMRI, graph theoretical measures were calculated including clustering coefficient, characteristic path length, global efficiency and small-worldness.
Results
Clustering coefficient, global efficiency and small-worldness did not show any difference between controls and SCIs in all density ranges. The normalized characteristic path length to random network was higher in SCI patients than in controls and reached statistical significance at 12%-13% of density (p<0.05, uncorrected).
Conclusion
The graph theoretical approach in brain functional connectivity might be helpful to reveal the information processing after SCI. These findings imply that patients with SCI can build on preserved competent brain control. Further analyses, such as topological rearrangement and hub region identification, will be needed for better understanding of neuroplasticity in patients with SCI.
Keywords: Spinal cord injuries, Magnetic resonance imaging, Neuronal plasticity
INTRODUCTION
Spinal cord injury (SCI) can partially or fully disconnect the spinal cord from the brain. Recent advances in neuroimaging and brain mapping have enabled the study of neural connectivity changes in the human brain after SCI [1]. Unlike cortical injuries like stroke and traumatic brain injury, the brain structure remains grossly intact after SCI. Spinal cord atrophy, cortical atrophy and cortical reorganization in the sensorimotor cortex are evident in patients with SCI [2,3,4]. The change in the supraspinal level of injury is an important factor for the expected level of recovery, although there are multilevel changes from below to above the site of injury [2,5]. Neuroimaging may be useful in revealing altered functional connectivity in the brain after a distant central nervous system (CNS) injury [1].
In addition to task-evoked functional magnetic resonance imaging (fMRI), resting state-fMRI (rs-fMRI) measures the endogenous or spontaneous brain activity as low-frequency fluctuations in blood oxygen level-dependent (BOLD) signals. Also, it has become an important tool for delineating the functional network architecture of the brain [6].
Recently, using novel graph theory-based approaches, topological organization that support efficient information processing were found in brain network [7]. In graph theory-based approaches, the brain is modeled as a complex network visually presenting with nodes and edges. In the virtual graph,nodes represent anatomical elements, such as brain regions, and edges indicate the relationships between nodes (e.g., connectivity). After the brain network modeling procedure, various kinds of graph theoretical metrics can reveal the brain network organization mechanism [7]. The graph theory-based approach is advantageous in that it quantitatively characterizes the global organization in addition to visualizing the overall connectivity pattern among all the elements of the brain [7]. Moreover, it provides a vital framework to demonstrate the relationship between brain structure and function [8].
Furthermore, utility of graph-theory based techniques has been proven by an increasing number of studies to probe potential mechanisms involved in normal development [9], aging [10], and various brain disorders like Alzheimer's disease [11], schizophrenia [12], epilepsy, and traumatic brain injury [13]. However, no study has explored the connectivity change using rs-fMRI in patients with SCI using a graph-theory based approach.
Here, we investigated the global functional reorganization of the brain following SCI with graph-theory based approach by creating whole brain functional connectivity networks from rs-fMRI data, characterizing the reorganization of these networks using graph theoretical metrics, and comparing these metrics between SCI patients and age matched controls.
MATERIALS AND METHODS
Participants were 20 patients with incomplete cervical SCI (14 males, 6 females; age, 55±14.1 years) and 20 healthy subjects (10 males, 10 females; age, 52.9±13.6 years). The patients fulfilled the following inclusion criteria: (1) a minimum of 3 months post-injury; (2) cervical SCI proven by MRI; (3) incomplete injury based on ASIA impairment Scale (AIS); (4) upper or lower limb impairment; and (5) no head or brain lesion related with the trauma. At the point of study enrollment, bilateral upper and lower extremities motor power was evaluated by AIS. Experiments were conducted with written consent of each participant and the study was approved by the Institutional Review Board of the Kyungpook National University Hospital (IRB No. 2011-09-011).
Acquisition of fMRI data
All MRI data were acquired with a Signa Excite HD 3.0T MR scanner (General Electric, Milwaukee, WI, USA). Resting-state BOLD images were obtained using an echo planar-imaging sequence (repetition time [TR], 2,000 ms; echo time [TE], 30 ms; flip angle, 90; matrix, 64×64; field of view [FOV], 210 mm; and 4 mm thickness with no gap). The subjects had no task to perform but were instructed to stay alert and keep their eyes closed during scanning. Anatomical T1-weighted images were obtained using a 3D-fast spoiled gradient echo sequence (TR, 7.8 ms; TE, 3 ms; flip angle, 20; matrix, 256×256; FOV, 210 mm; and 1.3 mm thickness and no gap).
Preprocessing of rs-fMRI data
The preprocessing of rs-fMRI data was carried out with Analysis of Functional NeuroImages software (http://afni.nimh.nih.gov/afni) [14]. The initial five volumes from each functional image were discarded. The residual functional images were de-spiked and corrected for slice time acquisition differences and head motions [15]. The anatomical image was co-registered to the functional images using the affine registration with the local Pearson correlation cost function [16]. The corrected functional images carried out using the anatomy based correlation corrections (ANATICOR) method [17]. To remove noise from the data, data were regressed out as follows: 1) six parameters obtained by the rigid body correction of head motion, 2) the signal from the eroded large ventricle mask, and 3) signal from a region of the eroded local white matter mask (r=15 mm). Head coil and hardware artifacts were modeled with eroded local white matter and eroded large ventricle masks. To obtain the mask, each registered and non-uniformity corrected anatomical T1 image was classified into white matter, gray matter, cerebrospinal fluid, and background using an advanced neural-net classifier [18]. Additionally, four large ventricles were automatically identified using automated non-linear image matching and anatomical labeling, a well-established non-linear warping algorithm that uses a multi-scale approach to deform one image to match a previously labeled template [19]. To reduce partial volume effects from gray matter on white matter and large ventricle masks, the white matter mask and the large ventricle mask were eroded by one voxel. Subsequently, the data were temporally band-pass filtered (0.009<f<0.08 Hz). The GM mask was applied to reduce the inclusion of unwanted BOLD or other physiological signals that occur due to large draining vessels that tend to course on the outer surface of the gray matter. The images then underwent spatial smoothing with a 6-mm full width at half maximum Gaussian kernel and were normalized to a standard MNI152 template.
Network analysis using graph theoretical approach
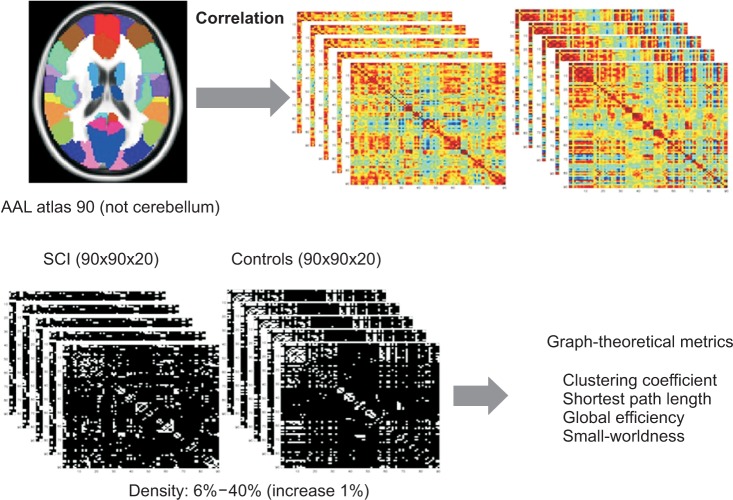
To analyze the characteristics of the whole brain network between normal and SCI patients, we calculated several graph theoretical measures. Graph-theoretical measures were calculated using the Brain Connectivity Toolbox (http://www.brain-connectivity-toolbox.net) [20]. Nodes were defined by 90 regions of interest (ROIs) according to an automated anatomical labeling (AAL) template. In the AAL template, 45 ROIs in each hemisphere, except the cerebellum, were defined [21] (Supplementary Table 1). Then, a cross-correlation symmetry matrix (90×90) was obtained for each subject. The time series in each ROI was averaged and Pearson's correlation coefficients were calculated between every pair of ROIs. These correlation coefficients represent functional connections between nodes. Then, the cross-correlation symmetry matrixes were converted to a z-value using Fisher's r-to-z transformation. Our analysis applied to a simple undirected and unweighted binary matrix. So, the matrix was then transformed into a binary matrix with a fixed density value. We applied a wide range of density (D), (6%≤D≤40%) with an incremental interval of 1%. Then, further network analysis was based on the binarized matrices for each subject (Supplementary Fig. 1).
Four network measures-clustering coefficient, Cp; characteristic path length, Lp; small world-ness parameters, σ; and global efficiency, Eglob were calculated to analyze the differences between normal and SCI patients. Clustering coefficient of a node i (Ci) is defined as the ratio of the number of connections between the neighbors of ROI i and the total number of possible connections between its neighbors. Clustering coefficient for a network (Cp) is defined as the average Ci from entire nodes in the network and characteristic path length (Lp) is the mean the shortest distance between any two nodes in the network [22]. Global efficiency of the network (Eglob) was defined as the average inverse shortest path length for all node-node pairs in the network [23]. To examine the small-world properties, the normalized parameters γ=Cpreal/Cprand and λ=Lpreal/Lprand were computed [22]. A network is considered as a small-world network if it shows much higher Cp (γ>1) while similar Lp (λ≈1) in comparison with the matched random network. That is, small-world index σ=γ/λ is greater than 1 [24]. In the random networks, each edge was rewired 1,000 times and an average of 100. Small-worldness tests were done repeatedly over a range of density (Fig. 1). The comparison of network parameters between controls and SCIs was performed using a two-tailed two-sample t test (p<0.05). We did not make any correction for multiple comparisons because we tried to explore the general trends of between-group differences through the wide range of density level.
Fig. 1. Consecutive steps of functional connectivity analysis using resting state-functional magnetic resonance imaging (rs-fMRI) with graph theoretical approach. The whole brain was parcellated into 90 regions according to automated anatomical labeling (AAL) atlas. The correlations between rs-fMRI time-series were computed. The weighted correlation matrix per subject was constructed for the controls and the spinal cord injuries (SCIs). The weighted correlation matrix was converted into binarized matrix by density thresholding from 0.06 to 0.4 (increase 1%). Random networks were also generated. Graph-theoretical metrics such as clustering coefficient, characteristic path length, global efficiency, small-worldness were measured.
RESULTS
No differences were evident between controls and SCI patients in age (controls: mean±standard deviation [SD], 52.9±13.6 years; SCI patients: mean±SD, 55±14.1 years; p=0.627, obtained by two-tailed two-sample t test) and gender (controls, 10 males; SCI patients, 14 males; p=0.197, obtained by Pearson χ2 analysis). The time since SCI was 58.3±52.0 weeks. Demographic and clinical characteristics of the 20 SCI patients are provided in Table 1. Severity of SCI was defined using the AIS.
Table 1. Demographic data and clinical values of the SCI subjects.
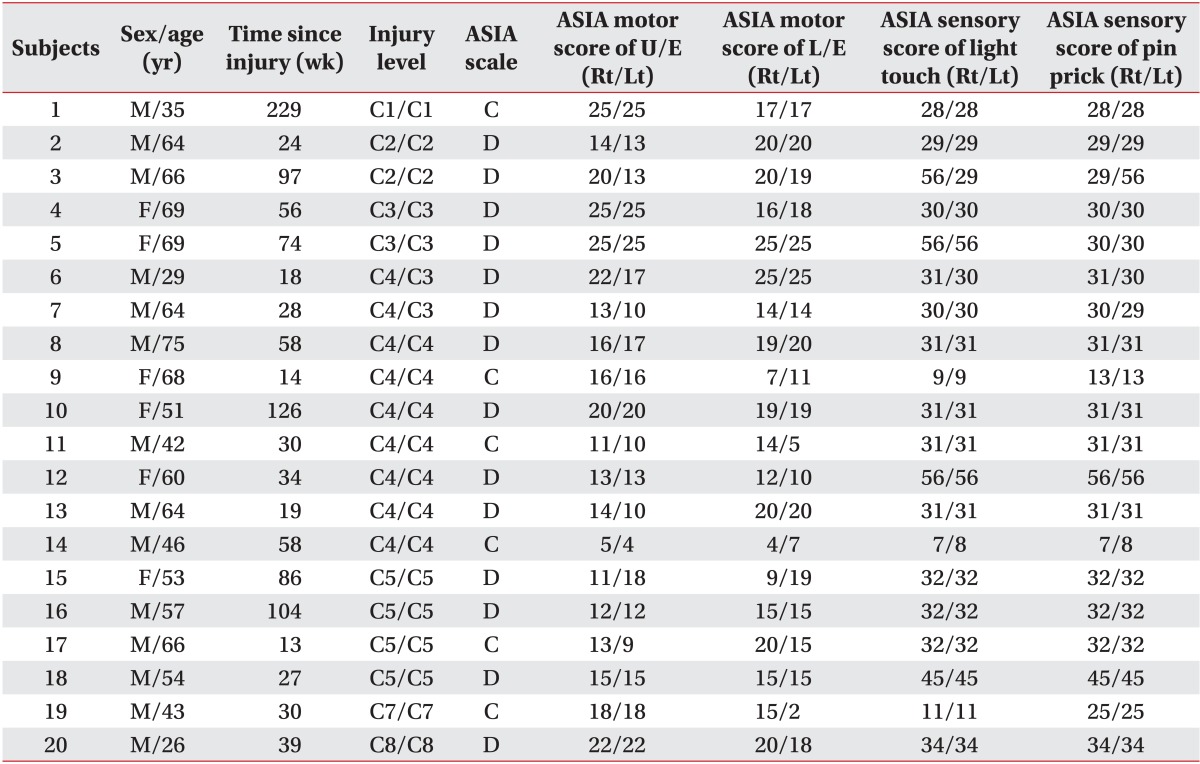
SCI, spinal cord injury; ASIA, American Spinal Injury Association; ASIA motor score, maximum 100 points; U/E, upper extremities; L/E, lower extremities; Rt, right; Lt, left; M, male; F, female; C, cervical; ASIA C, sensorimotor incomplete with half of key muscles below the neurological level have a muscle grade less than 3; ASIA D, at least half of key muscles have a muscle grade of 3 or more.
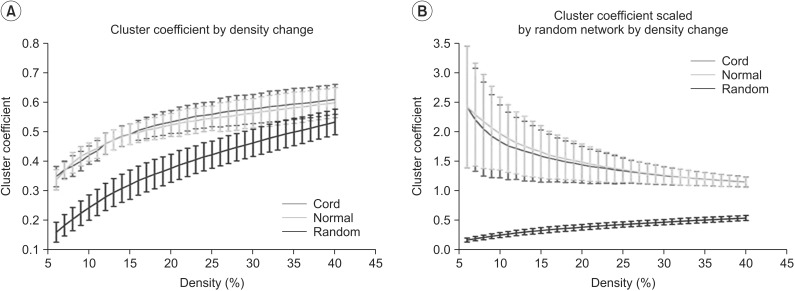
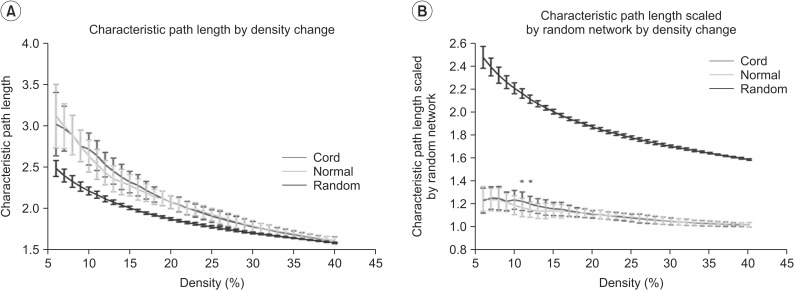
We first examined graph metrics obtained for functional brain networks constructed by thresholding (threshold values ranged from 0.06 to 0.4, with an increment of 0.01). The clustering coefficient in controls and SCI patients was high compared to random network through the density range. The normalized clustering coefficient in SCI was less than that of controls, but with no statistical significance between two groups at all densities. The ratio of clustering coefficient to random networks tended to decrease as density increased (Fig. 2A, 2B). The characteristic path length was longer in controls and SCI patients at all densities compared to the random network. The normalized characteristic path length to random network was higher in SCI patients than controls and reached statistical significance at 12%-13% of density (p<0.05, uncorrected) (Fig. 3A, 3B).
Fig. 2. Results of clustering coefficient (A) and clustering coefficient scaled by random networks (B) in the controls and the spinal cord injuries (SCIs). (A) Clustering coefficient by density change is higher compared to random networks in all density range. (B) Clustering coefficient scaled by random networks did not show statistically significant change between the control and the SCIs at all densities. Green line denotes controls, the red line denotes SCI patients, and the blue line denotes the random networks.
Fig. 3. Results of characteristic path length (A) and characteristic path length scaled by random networks (B) in the controls and the spinal cord injuries (SCIs). (A) Characteristic path length by density change is longer compared with random networks. (B) The characteristic path length scaled by random networks of the SCIs is longer than that of the controls at the range of 12%-13% of density (*p<0.05, uncorrected). Green line denotes the controls, the red line denotes the SCI patients, and blue line denotes the random networks.
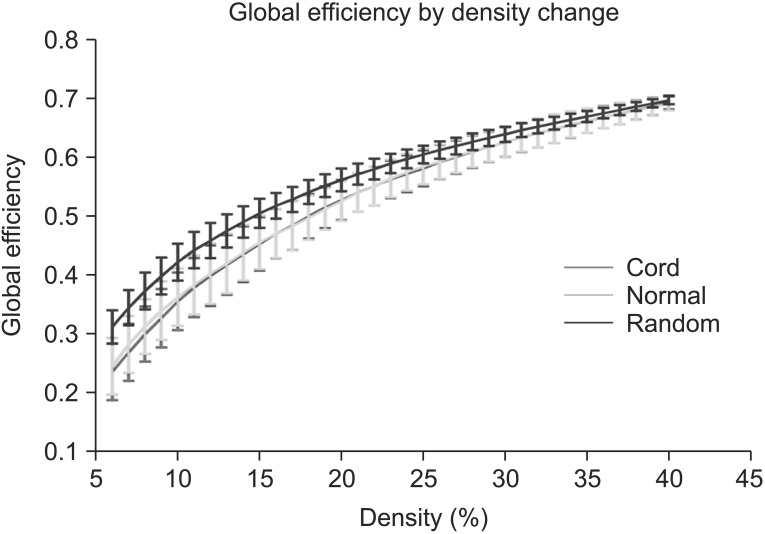
Global efficiency in both of the controls and the SCIs did not show a statistically significant change between the control and the SCIs through the density range. When the density increased, the difference of global efficiency between random network and human network decreased (Fig. 4).
Fig. 4. Results of global efficiency in the controls and the spinal cord injuries (SCIs). Global efficiency in both the controls and the SCIs did not show statistically significant changes at all densities. Green line denotes the controls and the red line denotes the SCIs.
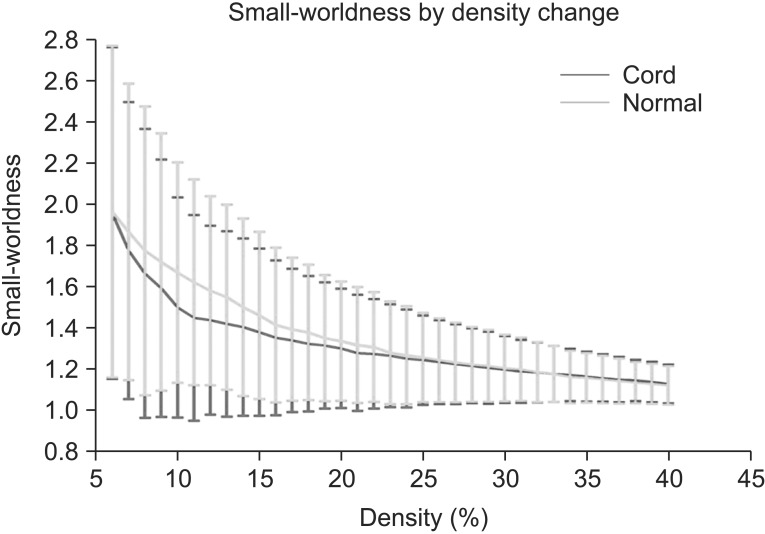
Small-worldness of the network in controls and SCIs exceeded 1 at all densities, indicating that each network had small-world characteristics (Fig. 5).
Fig. 5. Results of small-worldness in the controls and the spinal cord injuries (SCIs). Small-worldness of the network in the controls and the SCIs exceeded 1 throughout the range, indicating the small-worldness characteristic in brain functional networks. Green line denotes the controls and the red line denotes the SCIs.
DISCUSSION
In this study, we demonstrate graph theoretical approaches to reveal the efficiency of information processing of the whole brain network with region based analysis in patients with cervical incomplete SCI using rs-fMRI.
To delineate the pathophysiological mechanisms of brain plasticity following SCI, neuroimaging has been done in experimental models and humans. The results have been contradictory using task-evoked fMRI after SCI. Some fMRI studies revealed an expansion of task related brain activation [25,26]. Ghosh et al. [27] demonstrated increased cortical responses to forepaw stimuli in incomplete cervical SCI model of rats 1 week after using fMRI. Others showed unaltered brain activity during an arm task [28,29] as well as reduced brain activation in patients with SCI with persistent motor deficit [30]. Shoham et al. [28] demonstrated that motor-cortical activation closely follows normal somatotopic organization in the primary and non-primary sensorimotor areas using task-evoked fMRI. These results were compatible with our finding of unaltered local efficiency and global efficiency in general.
Brain connectivity is classified into structural connectivity, which measures anatomical link, and functional connectivity, which is statistically dependent. Functional connectivity using rs-fMRI measures the temporal correlation of spontaneous low frequency fluctuation in brain activity. Various brain networks including motor [6], auditory [31], visual [32], language [33], default mode [34], and attention system [35] have been identified using rs-fMRI. From the perspective of network science, the analysis of brain functional connectivity with graph theory has demonstrated the characteristics of topologically organized brain network that supports efficient information processing. Brain network analysis with graph theoretical approach models the brain as a complex network visually presenting with nodes and edges. In a graph, anatomical elements (e.g., brain regions) are represented by a node, and the connectivity between nodes is represented by edges. After constructing the brain network, various graph theoretical metrics are measured to demonstrate the organization mechanism underlying the relevant networks. In contrast to another methodological approach, such as seed-based functional connectivity and independent component analysis, the graph theoretical approach has an advantage to visualize overall connectivity patterns and to characterize the topology of brain connectivity.
To comprehensively demonstrate the topological properties of network, we analyzed multiple, frequently-used network parameters (i.e., clustering coefficient, shortest path length, global efficiency, and small-worldness) over a range of densities, which revealed the capability of a network in both specialized (or modular) processing in local neighborhoods and integrated (or distributed) processing over the entire network.
In this study, there was no significant difference in patients with SCI compared to controls in measurements of functional segregation, such as clustering coefficient, functional integration, such as global efficiency, and economic efficiency, such as small-worldness. The finding of generally unaltered topological properties of the whole brain network might suggest the relative intact brain information processing after SCI. To our knowledge, there has been no previous report of the functional connectivity in SCI with graph theoretical approach except only one report with electroencephalogram (EEG) analysis. De Vico Fallani et al. [36] demonstrated the increased local efficiency but not in the global efficiency in patients with SCI compared to the controls in their motor network. This finding suggested that the motor networks in SCI tend to have regular configuration. In our study, there was no change in local efficiency measured with clustering coefficient. This discrepancy may be explained several ways. First is the methodological difference between the rs-fMRI and the EEG. Rs-fMRI captures the BOLD signal changes, whereas EEG records a neural electrical activity along the scalp. The different spatial field of signal measurement can be a cause of this discrepancy. Secondly, in the process of analysis, the AAL atlas was used to the whole brain parcellation, whereas the aforementioned study [36] analyzed only motor network constructed with multiple ROIs, which is relevant with the motor network. The difference between whole brain analysis and local brain analysis might influence the result of discrepancy in local efficiency.
We also found the characteristic path length is longer than those of matched random network at the range of density (12%-13%). The characteristic path length measures the distance between any pair of nodes in a network or the extent of overall communication efficiency of a network. A shorter distance characterizes higher efficiency because information exchange can be possible though only fewer steps. This finding might imply that whole brain network after SCI decreases the parallel information processing at the specific density level. However, its effect is minimal and limited. Cautions must be taken to interpret this result. The characteristic path length is inverse of global efficiency however, in this result the global efficiency normalized to matched random networks did not demonstrate the change between two groups in all range of densities. The cause of this discrepancy need to be elucidated in the future study.
Small-worldness is a model that originated from other complex network systems, such as social, economic and biological networks. It characterizes the organization principles with respect to specialized and integrated information processing, and also maximizes the efficiency of information processing at a lower wiring cost [37]. In many complex brain networks, small-world topology has been demonstrated across multiple species in both of healthy and disease states [38]. The small world topology is a robust organizational principal governing the global pattern in spontaneous neural activity, regardless of multiple level scales, such as region level or voxel level [7]. A small-worldness can be described by high local clustering and low minimum path length between any pair of nodes [22]. A network would have the characteristics of small-worldness if it meets the following two conditions: γ=Cpreal/Cprand and λ=Lpreal/Lprand, respectively. These two conditions can also be characterized as a simple quantitative measurement, small-worldness, σ=γ/λ>1 [24]. In this study, small-worldness in SCI and controls exceeded 1 at all densities, which means the whole brain network exhibits economical small-world topology. This result suggests that the economical small-world topology is not disturbed from the distance CNS injury, such as SCI.
Neurological rehabilitation after SCI is challenging in terms of its effectiveness. Other recent treatment options, such as brain-computer interface (BCI) and transcranial direct current stimulation based on neuroplastic recovery, have drawn attention [39]. Neural interface technology is a direct communication pathway between the brain and an external device that has the potential to promote neuroplasticity and functional recovery. In a typical BCI, neural signals that are recorded and decoded can be used to control movement of a computer cursor or other external device, such as a robotic arm or a communication aid (i.e., controlling a computer for typing). Therefore, our study has clinical significance to identify local and global efficiency in brain after SCI. This study might be fundamentally important in revealing the information process in brain in patients with SCI. These findings also imply that patients with SCI can build on preserved competent brain control.
This study has some limitations. First, it included chronic incomplete cervical SCI patients. Therefore, the results cannot be generalized to other types of SCI, such as complete SCI, or other SCI levels. We have plans to compare the difference between complete injury and incomplete injury in terms of the change of brain network after SCI. Second, in this study, we analyzed the whole brain connectivity with parcellating the whole brain into 90 regions using an AAL template. But, it excluded the regions of the cerebellum, which are important for information processing in motor recovery. Previous studies have shown the role of cerebellum of recovery after CNS injury such as stroke [40]. Further studies should include the cerebellum as ROI to reveal the change of information processing after SCI. Third, we applied the region based resting-state brain networks using an AAL template. The result of analysis with intrinsic large scale functional brain networks might be biased by predefined anatomical structures. Therefore, voxel-based network analysis is needed to overcome the potential bias.
In conclusion, the graph theoretical approach in brain functional connectivity might be helpful to reveal information processing after SCI. These findings imply that patients with SCI can build on preserved competent brain control. Further analysis, such as topological rearrangement and hub region identification, are needed for better understanding of the neuroplasticity in patients with SCI in the view of network science.
ACKNOWLEDGMENTS
This work was supported by the National Research Foundation of Korea (NRF) grant funded by the Korea government (MEST) (No. 2011-0028333).
Footnotes
CONFLICT OF INTEREST: No potential conflict of interest relevant to this article was reported.
Supplementary Material
Correlation matrix in both of the control (A) and spinal cord injury (SCI) patients (B). The x-axis and y-axis means specific region of interests according to an automated anatomical labeling template. The sequential order of each axis is represented in Supplementary Table 1. The color bar means z-score. The positive functional connectivity between two regions is represented in red and the negative functional connectivity is represented in blue.
List of the automated anatomical labeling template in each hemisphere
References
- 1.Kokotilo KJ, Eng JJ, Curt A. Reorganization and preservation of motor control of the brain in spinal cord injury: a systematic review. J Neurotrauma. 2009;26:2113–2126. doi: 10.1089/neu.2008.0688. [DOI] [PMC free article] [PubMed] [Google Scholar]
- 2.Lundell H, Barthelemy D, Skimminge A, Dyrby TB, Biering-Sorensen F, Nielsen JB. Independent spinal cord atrophy measures correlate to motor and sensory deficits in individuals with spinal cord injury. Spinal Cord. 2011;49:70–75. doi: 10.1038/sc.2010.87. [DOI] [PubMed] [Google Scholar]
- 3.Jurkiewicz MT, Crawley AP, Verrier MC, Fehlings MG, Mikulis DJ. Somatosensory cortical atrophy after spinal cord injury: a voxel-based morphometry study. Neurology. 2006;66:762–764. doi: 10.1212/01.wnl.0000201276.28141.40. [DOI] [PubMed] [Google Scholar]
- 4.Wrigley PJ, Gustin SM, Macey PM, Nash PG, Gandevia SC, Macefield VG, et al. Anatomical changes in human motor cortex and motor pathways following complete thoracic spinal cord injury. Cereb Cortex. 2009;19:224–232. doi: 10.1093/cercor/bhn072. [DOI] [PubMed] [Google Scholar]
- 5.Freund P, Weiskopf N, Ward NS, Hutton C, Gall A, Ciccarelli O, et al. Disability, atrophy and cortical reorganization following spinal cord injury. Brain. 2011;134:1610–1622. doi: 10.1093/brain/awr093. [DOI] [PMC free article] [PubMed] [Google Scholar]
- 6.Biswal B, Yetkin FZ, Haughton VM, Hyde JS. Functional connectivity in the motor cortex of resting human brain using echo-planar MRI. Magn Reson Med. 1995;34:537–541. doi: 10.1002/mrm.1910340409. [DOI] [PubMed] [Google Scholar]
- 7.Wang J, Zuo X, He Y. Graph-based network analysis of resting-state functional MRI. Front Syst Neurosci. 2010;4:16. doi: 10.3389/fnsys.2010.00016. [DOI] [PMC free article] [PubMed] [Google Scholar]
- 8.Honey CJ, Thivierge JP, Sporns O. Can structure predict function in the human brain? Neuroimage. 2010;52:766–776. doi: 10.1016/j.neuroimage.2010.01.071. [DOI] [PubMed] [Google Scholar]
- 9.Fair DA, Cohen AL, Dosenbach NU, Church JA, Miezin FM, Barch DM, et al. The maturing architecture of the brain's default network. Proc Natl Acad Sci U S A. 2008;105:4028–4032. doi: 10.1073/pnas.0800376105. [DOI] [PMC free article] [PubMed] [Google Scholar]
- 10.Achard S, Bullmore E. Efficiency and cost of economical brain functional networks. PLoS Comput Biol. 2007;3:e17. doi: 10.1371/journal.pcbi.0030017. [DOI] [PMC free article] [PubMed] [Google Scholar]
- 11.Supekar K, Menon V, Rubin D, Musen M, Greicius MD. Network analysis of intrinsic functional brain connectivity in Alzheimer's disease. PLoS Comput Biol. 2008;4:e1000100. doi: 10.1371/journal.pcbi.1000100. [DOI] [PMC free article] [PubMed] [Google Scholar]
- 12.Liu Y, Liang M, Zhou Y, He Y, Hao Y, Song M, et al. Disrupted small-world networks in schizophrenia. Brain. 2008;131:945–961. doi: 10.1093/brain/awn018. [DOI] [PubMed] [Google Scholar]
- 13.Nakamura T, Hillary FG, Biswal BB. Resting network plasticity following brain injury. PLoS One. 2009;4:e8220. doi: 10.1371/journal.pone.0008220. [DOI] [PMC free article] [PubMed] [Google Scholar]
- 14.Cox RW. AFNI: software for analysis and visualization of functional magnetic resonance neuroimages. Comput Biomed Res. 1996;29:162–173. doi: 10.1006/cbmr.1996.0014. [DOI] [PubMed] [Google Scholar]
- 15.Cox RW, Jesmanowicz A. Real-time 3D image registration for functional MRI. Magn Reson Med. 1999;42:1014–1018. doi: 10.1002/(sici)1522-2594(199912)42:6<1014::aid-mrm4>3.0.co;2-f. [DOI] [PubMed] [Google Scholar]
- 16.Saad ZS, Glen DR, Chen G, Beauchamp MS, Desai R, Cox RW. A new method for improving functional-to-structural MRI alignment using local Pearson correlation. Neuroimage. 2009;44:839–848. doi: 10.1016/j.neuroimage.2008.09.037. [DOI] [PMC free article] [PubMed] [Google Scholar]
- 17.Jo HJ, Saad ZS, Simmons WK, Milbury LA, Cox RW. Mapping sources of correlation in resting state FMRI, with artifact detection and removal. Neuroimage. 2010;52:571–582. doi: 10.1016/j.neuroimage.2010.04.246. [DOI] [PMC free article] [PubMed] [Google Scholar]
- 18.Zijdenbos A, Evans A, Riahi F, Sled J, Chui J, Kollokian V. Automatic quantification of multiple sclerosis lesion volume using stereotaxic space. Vis Biomed Comput. 1996;1131:439–448. [Google Scholar]
- 19.Collins DL, Holmes CJ, Peters TM, Evans AC. Automatic 3-D model-based neuroanatomical segmentation. Hum Brain Mapp. 1995;3:190–208. [Google Scholar]
- 20.Rubinov M, Sporns O. Complex network measures of brain connectivity: uses and interpretations. Neuroimage. 2010;52:1059–1069. doi: 10.1016/j.neuroimage.2009.10.003. [DOI] [PubMed] [Google Scholar]
- 21.Tzourio-Mazoyer N, Landeau B, Papathanassiou D, Crivello F, Etard O, Delcroix N, et al. Automated anatomical labeling of activations in SPM using a macroscopic anatomical parcellation of the MNI MRI single-subject brain. Neuroimage. 2002;15:273–289. doi: 10.1006/nimg.2001.0978. [DOI] [PubMed] [Google Scholar]
- 22.Watts DJ, Strogatz SH. Collective dynamics of 'small-world' networks. Nature. 1998;393:440–442. doi: 10.1038/30918. [DOI] [PubMed] [Google Scholar]
- 23.Latora V, Marchiori M. Efficient behavior of small-world networks. Phys Rev Lett. 2001;87:198701. doi: 10.1103/PhysRevLett.87.198701. [DOI] [PubMed] [Google Scholar]
- 24.Humphries MD, Gurney K, Prescott TJ. The brainstem reticular formation is a small-world, not scale-free, network. Proc Biol Sci. 2006;273:503–511. doi: 10.1098/rspb.2005.3354. [DOI] [PMC free article] [PubMed] [Google Scholar]
- 25.Curt A, Bruehlmeier M, Leenders KL, Roelcke U, Dietz V. Differential effect of spinal cord injury and functional impairment on human brain activation. J Neurotrauma. 2002;19:43–51. doi: 10.1089/089771502753460222. [DOI] [PubMed] [Google Scholar]
- 26.Jurkiewicz MT, Mikulis DJ, McIlroy WE, Fehlings MG, Verrier MC. Sensorimotor cortical plasticity during recovery following spinal cord injury: a longitudinal fMRI study. Neurorehabil Neural Repair. 2007;21:527–538. doi: 10.1177/1545968307301872. [DOI] [PubMed] [Google Scholar]
- 27.Ghosh A, Sydekum E, Haiss F, Peduzzi S, Zorner B, Schneider R, et al. Functional and anatomical reorganization of the sensory-motor cortex after incomplete spinal cord injury in adult rats. J Neurosci. 2009;29:12210–12219. doi: 10.1523/JNEUROSCI.1828-09.2009. [DOI] [PMC free article] [PubMed] [Google Scholar]
- 28.Shoham S, Halgren E, Maynard EM, Normann RA. Motor-cortical activity in tetraplegics. Nature. 2001;413:793. doi: 10.1038/35101651. [DOI] [PubMed] [Google Scholar]
- 29.Turner JA, Lee JS, Schandler SL, Cohen MJ. An fMRI investigation of hand representation in paraplegic humans. Neurorehabil Neural Repair. 2003;17:37–47. doi: 10.1177/0888439002250443. [DOI] [PubMed] [Google Scholar]
- 30.Jurkiewicz MT, Mikulis DJ, Fehlings MG, Verrier MC. Sensorimotor cortical activation in patients with cervical spinal cord injury with persisting paralysis. Neurorehabil Neural Repair. 2010;24:136–140. doi: 10.1177/1545968309347680. [DOI] [PubMed] [Google Scholar]
- 31.Cordes D, Haughton V, Carew JD, Arfanakis K, Maravilla K. Hierarchical clustering to measure connectivity in fMRI resting-state data. Magn Reson Imaging. 2002;20:305–317. doi: 10.1016/s0730-725x(02)00503-9. [DOI] [PubMed] [Google Scholar]
- 32.Lowe MJ, Mock BJ, Sorenson JA. Functional connectivity in single and multislice echoplanar imaging using resting-state fluctuations. Neuroimage. 1998;7:119–132. doi: 10.1006/nimg.1997.0315. [DOI] [PubMed] [Google Scholar]
- 33.Hampson M, Peterson BS, Skudlarski P, Gatenby JC, Gore JC. Detection of functional connectivity using temporal correlations in MR images. Hum Brain Mapp. 2002;15:247–262. doi: 10.1002/hbm.10022. [DOI] [PMC free article] [PubMed] [Google Scholar]
- 34.Greicius MD, Krasnow B, Reiss AL, Menon V. Functional connectivity in the resting brain: a network analysis of the default mode hypothesis. Proc Natl Acad Sci U S A. 2003;100:253–258. doi: 10.1073/pnas.0135058100. [DOI] [PMC free article] [PubMed] [Google Scholar]
- 35.Fox MD, Corbetta M, Snyder AZ, Vincent JL, Raichle ME. Spontaneous neuronal activity distinguishes human dorsal and ventral attention systems. Proc Natl Acad Sci U S A. 2006;103:10046–10051. doi: 10.1073/pnas.0604187103. [DOI] [PMC free article] [PubMed] [Google Scholar]
- 36.De Vico Fallani F, Astolfi L, Cincotti F, Mattia D, Marciani MG, Salinari S, et al. Cortical functional connectivity networks in normal and spinal cord injured patients: evaluation by graph analysis. Hum Brain Mapp. 2007;28:1334–1346. doi: 10.1002/hbm.20353. [DOI] [PMC free article] [PubMed] [Google Scholar]
- 37.Sporns O, Chialvo DR, Kaiser M, Hilgetag CC. Organization, development and function of complex brain networks. Trends Cogn Sci. 2004;8:418–425. doi: 10.1016/j.tics.2004.07.008. [DOI] [PubMed] [Google Scholar]
- 38.He Y, Wang J, Wang L, Chen ZJ, Yan C, Yang H, et al. Uncovering intrinsic modular organization of spontaneous brain activity in humans. PLoS One. 2009;4:e5226. doi: 10.1371/journal.pone.0005226. [DOI] [PMC free article] [PubMed] [Google Scholar]
- 39.Rohm M, Schneiders M, Muller C, Kreilinger A, Kaiser V, Muller-Putz GR, et al. Hybrid brain-computer interfaces and hybrid neuroprostheses for restoration of upper limb functions in individuals with high-level spinal cord injury. Artif Intell Med. 2013;59:133–142. doi: 10.1016/j.artmed.2013.07.004. [DOI] [PubMed] [Google Scholar]
- 40.Small SL, Hlustik P, Noll DC, Genovese C, Solodkin A. Cerebellar hemispheric activation ipsilateral to the paretic hand correlates with functional recovery after stroke. Brain. 2002;125:1544–1557. doi: 10.1093/brain/awf148. [DOI] [PubMed] [Google Scholar]
Associated Data
This section collects any data citations, data availability statements, or supplementary materials included in this article.
Supplementary Materials
Correlation matrix in both of the control (A) and spinal cord injury (SCI) patients (B). The x-axis and y-axis means specific region of interests according to an automated anatomical labeling template. The sequential order of each axis is represented in Supplementary Table 1. The color bar means z-score. The positive functional connectivity between two regions is represented in red and the negative functional connectivity is represented in blue.
List of the automated anatomical labeling template in each hemisphere


