

Stem cells can be loaded with DNA-carrying microbubbles, administered and transfected in vivo with ultrasound, and remain alive to express the gene of interest in vivo.
Abstract
Purpose
To determine whether (a) stem cells loaded with DNA-carrying microbubbles (MBs) can be transfected in vivo, (b) the cells remain alive to express the gene, and (c) gene expression is sufficiently robust to be detected in vivo.
Materials and Methods
The study was approved by the Institutional Animal Care and Use Committee. Cationic MBs were prepared, characterized, and loaded with pLuciferase green fluorescent protein (GFP) plasmid. Loading was confirmed with SYBR Gold staining (Life Technologies, Carlsbad, Calif). C17.2 cells were loaded with the DNA-carrying MBs. Two hundred thousand cells suspended in 20 μL phosphate-buffered saline were mixed with 200 μL Matrigel (BD Biosciences, San Jose, Calif) and injected in both flanks of eight nude mice. One of the Matrigel (BD Biosciences) injections contained 50 000 cells pretransfected in vitro by using lipofectamine as a positive control. Nine flanks were exposed to 2.25-MHz ultrasonic pulses at 50% duty cycle for 1 minute at 1 W/cm2 (n = 3) or 2 W/cm2 (n = 6), and six flanks served as the negative control. Two days later, bioluminescent images were acquired in each mouse every 3 minutes for 1 hour after the intraperitoneal injection of d-luciferin (Perkin Elmer, Waltham, Mass). Differences between groups were assessed by using the nonparametric Kruskal-Wallis test with Wilcoxon rank sum tests for follow-up comparisons. Mice were then killed, plugs were explanted, and alternate sections were stained with hematoxylin-eosin or stained for GFP expression.
Results
Mean DNA-loaded MB diameter ± standard deviation was 2.87 μm ± 1.69 with the DNA associated with the MB shell. C17.2 cells were associated with 2–4 MBs each, and more than 90% were viable. Peak background subtracted bioluminescent signal was fourfold higher when cells were exposed to 2 W/cm2 pulses as compared with 1 W/cm2 pulses (P = .02) and negative controls (P = .002). Histologic examination showed cells within the Matrigel (BD Biosciences) with robust GFP expression only after 2 W/cm2 ultrasound exposure and lipofectamine transfection.
Conclusion
Stem cells loaded with DNA-carrying MBs can be transfected in vivo with ultrasonic pulses and remain alive to demonstrate robust gene expression.
© RSNA, 2015
Introduction
Ultrasound-mediated gene delivery has the advantage of being targeted and safe, as compared with viral-based gene therapy strategies (1–3). Numerous studies have demonstrated that ultrasound in the presence of microbubbles (MBs) serves as a more efficient method of gene delivery than ultrasound alone (4–10). Various theories have been proposed regarding the mechanism of MB-mediated gene delivery at a cellular level (11,12), but the exact mechanism of how genes become incorporated within the cell is somewhat variable and often unclear (11,12). What is known is that MBs adjacent to a cell open pores in the cell membrane that remain open for tens of minutes, allowing direct exchange with the cytosol and bypassing the typical phagocytic endosomal pathway that traps and digests its contents (11,12). The two salient hypotheses are that the MB collapse induced by ultrasound produces a water jet as it injects its payload through the cell membrane that causes the observed pores. The other is that streaming caused by MB oscillation induces cell membrane effects to allow the entry of drugs and/or genes attached to the MB surface into the cytosol (11,12). Irrespective of the exact mechanism, since MBs are 1–4 μm in diameter, and since the MB needs to be close to or in direct contact with the cell membrane, ultrasound-mediated gene delivery has been limited to endothelial-cell transfection. Additionally, MBs are short lived, with a blood half-life of only a few minutes. While effective transfection of vascular endothelium has been shown (13–15), the major clinical need and challenge for gene therapy is the transfection of tumor and/or other cells that reside in the extravascular environment.
A promising strategy to ensure the proximity of MBs to the desired cell surface and improve specificity is the engineering of molecularly targeted MBs that bind to the endothelial surface of interest. To reach extravascular targets, investigators have proposed that disrupting capillaries by exposing MBs to higher ultrasound power would not only deliver the MB payload to the extravascular space but could allow other MBs to escape with the extravasated blood to deliver their payload to extravascular sites (11). The limitation of this technique is that there are only a few MBs in the location of the focused ultrasound beam; these few, rare, intact MBs that could escape before the clotting of extravasated plasma when exposed to potent tissue activators minimize the effective payload delivery.
An alternative strategy we are exploring is the use of stem cells that naturally home to tumors and inflamed or infarcted tissues as “vehicles” carrying DNA-loaded MBs in their endosomes. Since stem cells extravasate when they encounter activated endothelial cells, they can carry their MB payload to the tissue of interest. We showed that MB half-life when incorporated in stem cells was prolonged more than 7 days in vitro and at least 5 days in vivo (16), allowing ample time for the cells to home to the desired tissue after their systemic administration. We also showed the extreme sensitivity of ultrasound to MB-loaded stem cells by detecting a single cell in vitro by using a clinical ultrasound scanner with likely similar sensitivity in vivo (16). More important for this study, we showed in vitro that DNA-loaded MBs phagocytosed by stem cells did not express the gene until exposed to ultrasound, indicating that not only was ultrasound necessary to deliver the gene to the cytosol but the cells remained alive to express the gene (16). In this study, we aimed to determine whether (a) stem cells loaded with DNA-carrying MBs can be transfected in vivo, (b) the cells remain alive to express the gene, and (c) gene expression is sufficiently robust to be detected in vivo.
Materials and Methods
Neural Stem Cell (C17.2) Preparation
Mouse origin immortalized neural stem cells (C17.2) were kindly provided by Dr Evan Snyder (Sanford-Burnham Institute, San Diego, Calif). C17.2 cells were cultured in Dulbecco’s modified Eagle’s medium, containing 4.5 g/L glucose and 1 mM (1 mmol/L) sodium pyruvate supplemented with 10% fetal bovine serum, 5% horse serum, 2 mM (2 mmol/L) glutamine, 0.25 g/mL amphotericin B (Fungizone; Life Technologies, Carlsbad, Calif), and antibiotics (100 U/mL penicillin and 100 g/mL streptomycin sulfate). All cells were cultured in a humidified incubator at 37°C with 5% CO2. C17.2 cells were passaged every 2–3 days.
MB Preparation and DNA Loading
MB preparation and characterization.—MBs were prepared according to a previously published technique used by our group (16). Briefly, 2.5 μmol of 1,2-distearoyl-sn-glycero-3-phosphocholine (#850365C; Avanti Polar Lipids, Alabaster, Ala), 1.4 μmol of 1,2-stearoyl-3-trimethylammonium-propane (#890880C; Avanti Polar Lipids), and 1.6 μmol of polyoxyethylene-40 stearate (#P3440; Sigma-Aldrich, St Louis, Mo) were dissolved in 300 μL chloroform in a 2-mL glass vial. The chloroform was evaporated under a stream of nitrogen gas to form a thin film of lipids, which was reconstituted as a suspension in 1 mL of phosphate-buffered saline (PBS) with a pH level of 7.4 with combined heating to 80°C and bath sonication for 2 minutes, followed by cooling on ice. To form MBs, the headspace of the vial that contained the lipid suspension was flooded with decafluorobutane vapor, and probe sonication was applied to the suspension by using a Vibra-cell VCX130 probe sonicator (Sonics, Newtown, Conn) at settings of 70% amplitude for 10 seconds. Generated MBs were transferred to a glass centrifugation tube for washing, which was performed at 50G relative centrifugal force for 2 minutes. Centrifugation caused MBs to float to the meniscus. The infranatant was discarded, and 4 mL of fresh PBS was added to the MBs, followed by repeat centrifugation and wash three times, and MBs were reconstituted to a total volume of 1 mL with PBS. MBs were quantitated and sized by using a MultiSizer 4 Coulter counter (Beckman Coulter, Brea, Calif); however, MBs smaller than 1 μm were ignored, since the counter is inaccurate when sizing particles smaller than 1 μm.
DNA loading.—The plasmid pLuciferase green fluorescent protein (GFP), which expresses both luciferase and GFP under the control of a cytomegalovirus promoter, was kindly provided by Dr Thomas Kipps (Moores Cancer Center, San Diego, Calif). This plasmid was loaded onto MBs by a technique used previously (16). In brief, the plasmid was first amplified in DH5-α Escherichia coli in a 500-mL Luria-Bertani broth culture, and after 16 hours of growth, the plasmid was isolated by means of column maxiprep (QIAfilter Plasmid Giga Kit; Qiagen, Valencia, Calif). DNA quality was assessed by means of agarose gel electrophoresis, and quantitation was performed by using a NanoDrop spectrophotometer. In addition, C17.2 cells were transfected with the plasmid when they reached 80% confluency in T-25 flasks by using a standard lipofectamine kit (Life Technologies). Cells were harvested and assessed for GFP expression by using fluorescence microscopy.
Forty micrograms of plasmid DNA were added to approximately 108 MBs in 1 mL of PBS, followed by incubation at room temperature for 30 minutes to allow DNA adsorption onto the cationic MBs. MBs were washed twice to remove free DNA and were characterized as was done earlier. DNA adsorption to MBs was verified by using fluorescence microscopy after SYBR Gold staining (Life Technologies).
Neural Stem Cell Loading with DNA-carrying MBs
C17.2 cells were plated at a density of 106 C17.2 cells per milliliter in T-75 flasks (BD Biosciences, San Jose, Calif) and cultured for 24 hours when they became 80% confluent. Then, 108 MBs in 1 mL were added to each T-75 flask, and the entire flask was filled with serum-free Dulbecco’s modified Eagle’s medium and inverted to float the MBs against the adherent C17.2 cells. After an 8-hour incubation period at 37°C with 5% CO2, the cells were washed with PBS three times to remove all free MBs. Then, C17.2 cells were harvested 4 minutes after the addition of 0.05% trypsin–ethylenediaminetetraacetic acid solution at 37°C and dissociated mechanically. Trypsin digestion was stopped by adding a double volume of complete medium, and overdigestion was avoided by checking the detachment under a microscope. The cell suspension was then centrifuged for 5 minutes at 4°C and 250G relative centrifugal force. Although MB-loaded C17.2 cells became buoyant and floated to the top, we also collected cell pellets, for which cells contained fewer MBs per cell. Cells were resuspended and counted with a hemocytometer (Fisher Scientific, Waltham, Mass), and viability was assessed with trypan blue dye exclusion. The MB-labeled C17.2 cell suspension was then adjusted to yield approximately 106 live cells per milliliter. Labeling efficiency was assessed with light microscopy.
Mouse Model
This study was approved by the Institutional Animal Care and Use Committee.
A 400-μL cell suspension was prepared by adding 200 000 labeled C17.2 cells in 200 μL of PBS to 200 μL of growth factor–reduced Matrigel at 4°C (Matrix Growth Factor Reduced #3542310; BD Biosciences). Each 400-μL cell suspension was injected in each of both flanks of eight 4–6-week-old nude nu/nu mice (University of California–San Diego in-house breeding vendor) by using isoflurane anesthesia (Forane; Baxter Healthcare, New Providence, NJ). The Matrigel (BD Biosciences) gelled upon injection and shrank when water was resorbed, resulting in small subcutaneous plugs. Additionally, 50 000 C17.2 cells were transfected in vitro by using lipofectamine (Life Technologies), mixed to produce a 400-μL Matrigel (BD Biosciences) suspension and injected in one flank as a positive control. This resulted in one plug with pretransfected cells and 15 plugs with cells loaded with DNA-carrying MBs.
In Vivo Gene Activation
Twenty minutes after cell implantation, mice were reanesthetized with isoflurane and placed prone. The probe of the sonoporation device (SoniGene System; VisualSonics, Toronto, Ontario, Canada) was held by hand with its tip separated from the plug by a 1-cm warm ultrasound gel spacer and directed laterally to avoid the underlying bone. Exposure was for 1 minute at 2.25 MHz by using pulses with a 50% duty cycle. The plugs that contained MB-loaded cells were divided into three groups: no ultrasound exposure (n = 6) as a negative control and 1 W/cm2 (n = 3) or 2 W/cm2 (n = 6) ultrasound exposure.
In Vivo Bioluminescent Imaging
Forty-eight hours after sonoporation, mice were anesthetized with isoflurane. Baseline imaging was performed, and then 150 mg per kilogram of body weight of d-luciferin (Perkin Elmer, Waltham, Mass) was injected intraperitoneally. Imaging was performed for up to 60 minutes with the animals prone in an IVIS-200 system (Caliper Life Sciences, Hopkinton, Mass). Each bioluminescent image was acquired during 3 minutes with the excitation filter blocked and the emission filter open by using large binning and an f-stop of 1. Image analysis was performed by using Living Image 3.0 software (Caliper Life Sciences) by placing a region of interest that encompassed the entire plug, and its size was kept constant for all plugs. The region of interest was placed on the image that showed the highest 3-minute value acquired during the 1-hour observation period, and a background region of interest was placed on the exact same location on the presubstrate baseline image. The plug was assigned the background-subtracted radiance in photons per second per square centimeter per steradian.
Ex Vivo Analysis and Histologic Examination
Immediately after imaging, mice were killed by means of CO2 asphyxiation and cervical dislocation, as per institutional guidelines, and the plugs were excised carefully, fixed in 4% buffered formalin for 30 minutes, dehydrated in 30% sucrose, and placed in plastic molds that contained optimal cutting temperature medium (Tissue-Tek; Fisher Scientific) and frozen in a slurry of dry ice and 2-methyl butane (Sigma-Aldrich). Plugs were cryosectioned in 5-μm sections and placed on histologic slides. Alternating sections were assessed for GFP expression or stained with hematoxylin-eosin to identify the implanted cells in the Matrigel (BD Biosciences) background. GFP expression was assessed with immunohistochemical staining by first applying chicken anti-GFP primary antibody (1:400 dilution, #AB16901; Millipore, Billerica, Mass) to the section and then biotinylated donkey antichicken antibody (#703-065-155; Jackson ImmunoResearch, West Grove, Pa), followed by streptavidin–horseradish peroxidase (#016-030-084; Jackson ImmunoResearch). The section was then developed with chromogen 3-amino-9-ethylcarbazole (#SK4200; Vector Laboratories, Burlingame, Calif) and counterstained with Mayer’s hematoxylin (#MHS32; Sigma-Aldrich). GFP staining with this technique appears reddish brown in color from the horseradish peroxidase–3-amino-9-ethylcarbazole interaction under white light.
Statistical Analysis
Each plug was treated independently. The in vivo maximum radiance was averaged for each of the three groups of plugs, and the standard deviation was calculated. The Kolmogorov-Smirnov test of the data performed by using MATLAB (MathWorks, Natick, Mass) indicated that the data were not normally distributed. Therefore, differences between groups were assessed by using the nonparametric Kruskal-Wallis test with Wilcoxon rank sum tests for follow-up comparisons by using SPSS 22 (IBM, Armonk, NY). Because of multiple comparisons between groups, Bonferonni correction was used; thus, differences were considered significant if P was less than .05/3 or .0167.
Results
MB Characteristics
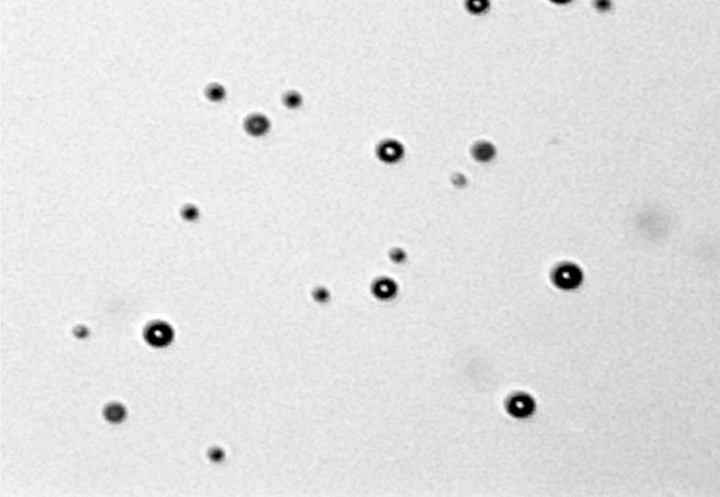
Mean MB diameter ± standard deviation was 2.87 μm ± 1.69 (Fig 1). MB concentration was 3.49 × 10⁸ MBs per milliliter of PBS. Fluorescein channel fluorescence microscopy of DNA-loaded MBs stained with SYBR Gold (Life Technologies) shows fluorescence surrounding each MB, indicating that the DNA is associated with the MB shell (Fig 2, Fig E1 [online]).
Figure 1:

Graph of the size distribution of MBs as measured with the Multisizer 4 Coulter counter (Beckman Coulter). Integrated concentration between 1 and 8 μm was 3.49 × 10⁸ MBs per milliliter. Mean MB diameter was 2.87 μm ± 1.69. MBs smaller than 1 μm were ignored, since the counter is inaccurate when sizing particles smaller than 1 μm.
Figure 2a:
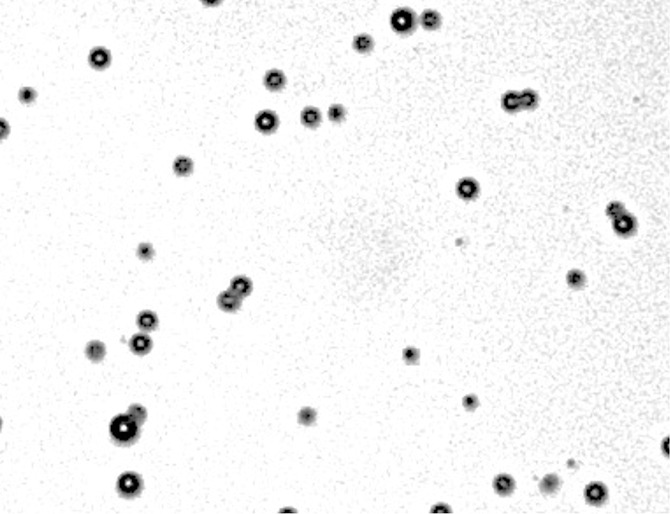
(a) Phase contrast and (b) fluorescence (fluorescein channel) microscopy images (original magnification, ×10) of MBs after DNA loading. SYBR Gold (Life Technologies), a dye that fluoresces in the presence of DNA, was added to both samples. Note the ring enhancement, indicating that DNA has been incorporated in the MB shell.
Figure 2b:
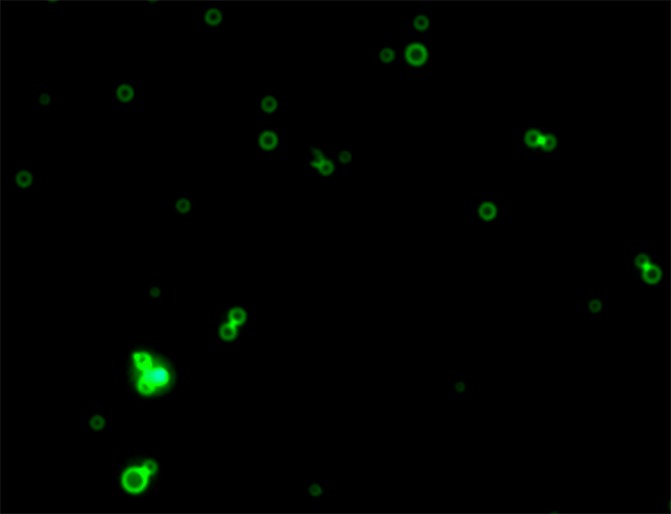
(a) Phase contrast and (b) fluorescence (fluorescein channel) microscopy images (original magnification, ×10) of MBs after DNA loading. SYBR Gold (Life Technologies), a dye that fluoresces in the presence of DNA, was added to both samples. Note the ring enhancement, indicating that DNA has been incorporated in the MB shell.
Neural Stem Cell Labeling
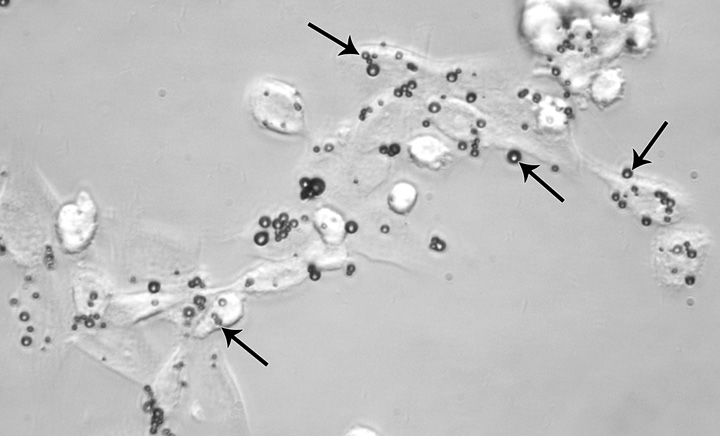
Confocal phase-contrast microscopy was performed after gentle trypsinization of MB-labeled C17.2 cells. On average, 2–4 MBs are seen to be associated with each cell. The association was either MB internalization into the cytoplasm or robust adherence to the cell membrane (Fig 3, Fig E2 [online]). Scattered (negligible) free MBs were observed after the three washes with PBS. Trypan blue staining exclusion demonstrated more than 90% cell viability.
Figure 3:
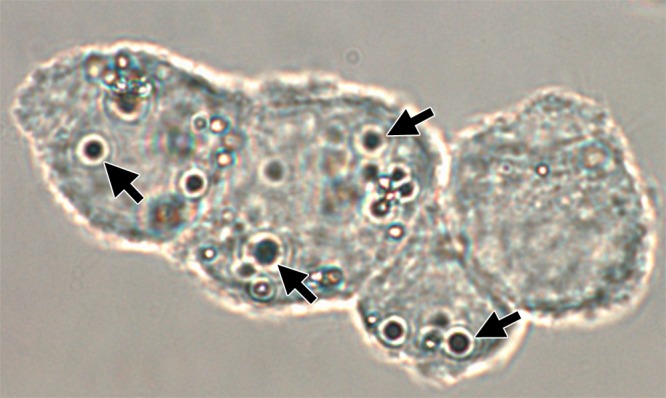
Confocal phase contrast microscopy image (original magnification, ×100) demonstrates C17.2 cells labeled with MBs (arrows). On average, each cell is associated with 2–4 MBs, which are either internalized or strongly adherent to the cell membrane.
In Vivo Luciferase Imaging
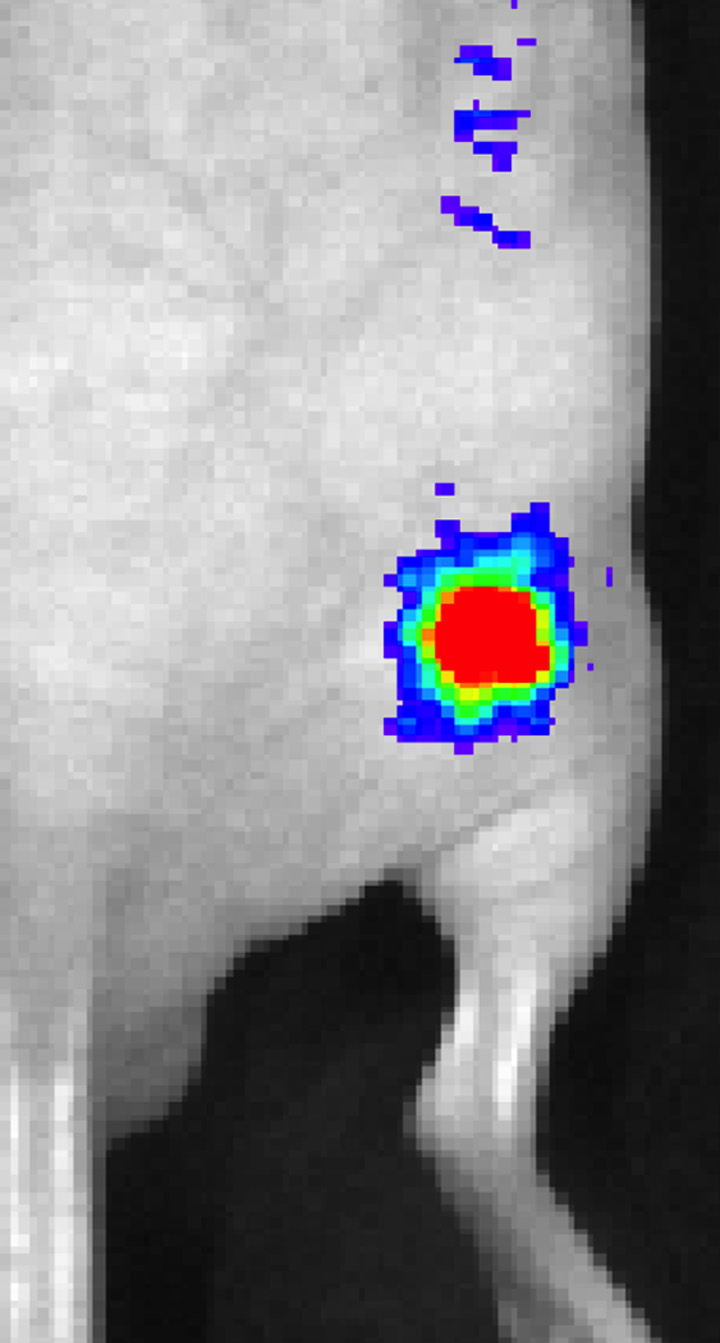
Signal from plugs was only observed in the group exposed to 2 W/cm2 ultrasound pulses and the positive control mouse injected with C17.2 cells pretransfected by using lipofectamine (Fig 4, Fig E3 [online]). The peak bioluminescent signal was observed approximately 35 minutes after the intraperitoneal administration of d-luciferin.
Figure 4a:
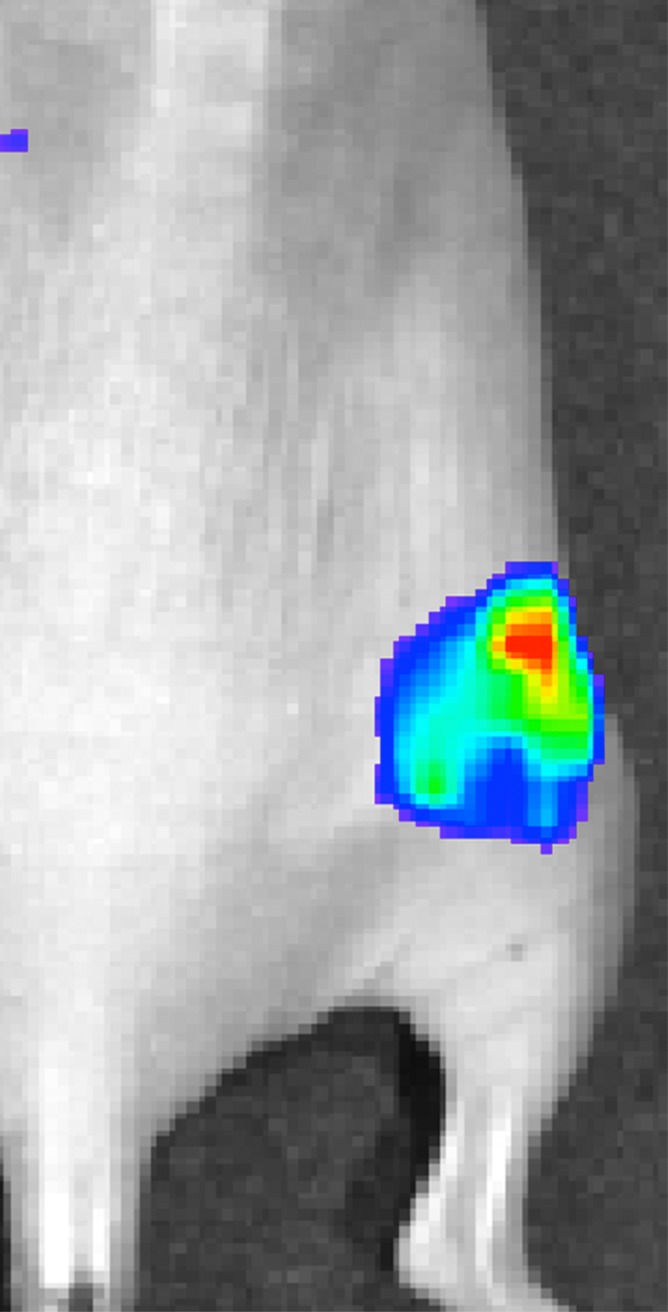
Representative peak luminescence images of in vivo luciferase expression from C17.2 cells evaluated 48 hours posttransfection with (a) 2 W/cm2 ultrasound pulses and (b) no ultrasound as the negative control.
Figure 4b:
Representative peak luminescence images of in vivo luciferase expression from C17.2 cells evaluated 48 hours posttransfection with (a) 2 W/cm2 ultrasound pulses and (b) no ultrasound as the negative control.
Bioluminescent photon counts for each group are shown in Figure 5. Bioluminescence after sonoporation at 2 W/cm2 was fourfold greater than that in the control, no-ultrasound group (1.6 × 10⁴ photons per second per square centimeter per steradian ± 3.6 × 10³ vs [3.8 ± 1.9] × 103 photons per second per square centimeter per steradian, P = .002). Note that although the bioluminescence at 2 W/cm2 was also fourfold higher than in the 1-W/cm2 group ([4 ± 1.3] × 103 photons per second per square centimeter per steradian), it approached (P = .02) but did not reach statistical significance, which had to be less than .0167 as determined with Bonferonni correction.
Figure 5:

Graph demonstrates the mean of background subtracted peak bioluminescent signal ± standard deviation measured 48 hours after sonoporation of C17.2 cells at 2 W/cm2 or 1 W/cm2 or with no ultrasound exposure. * = significant difference (P < .0167). sr = steradian.
Ex Vivo Validation of GFP Expression
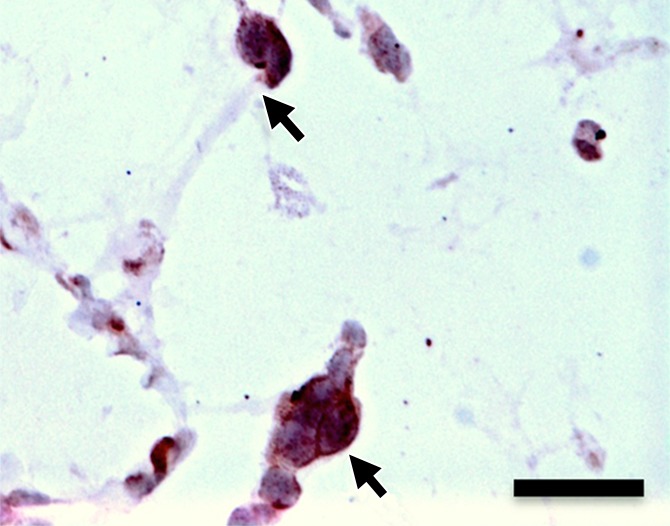
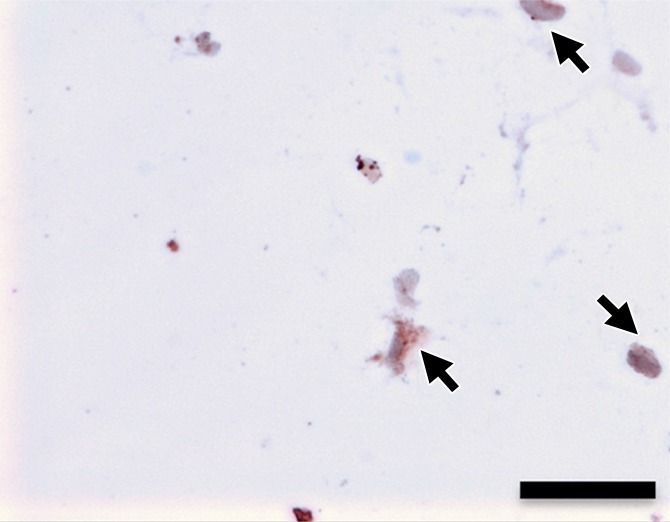
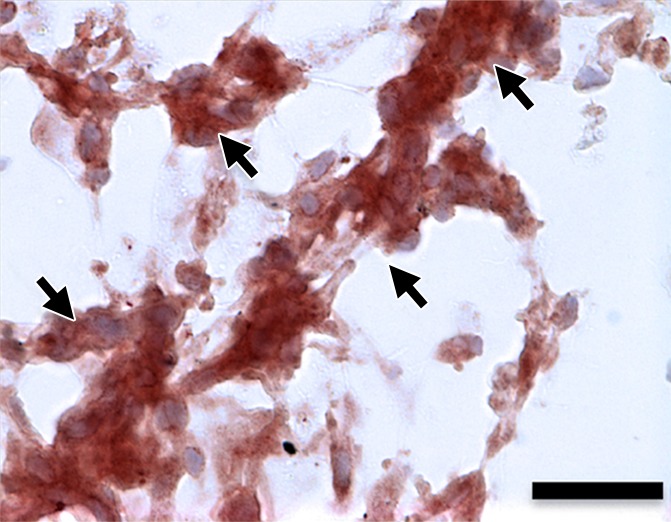
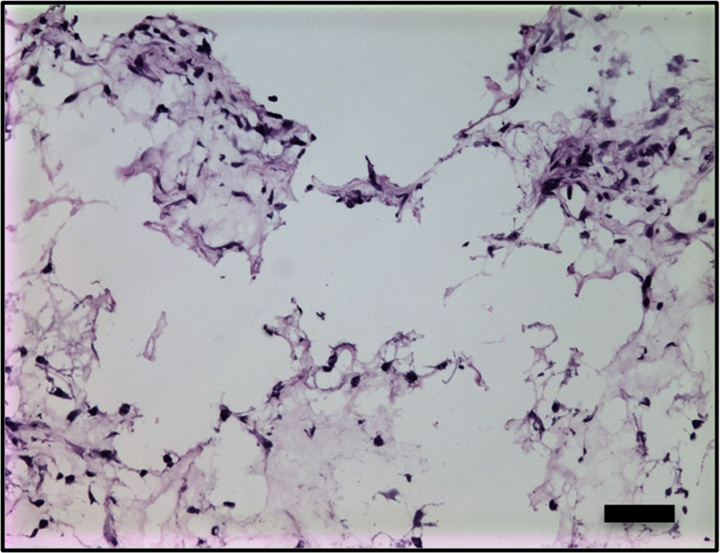
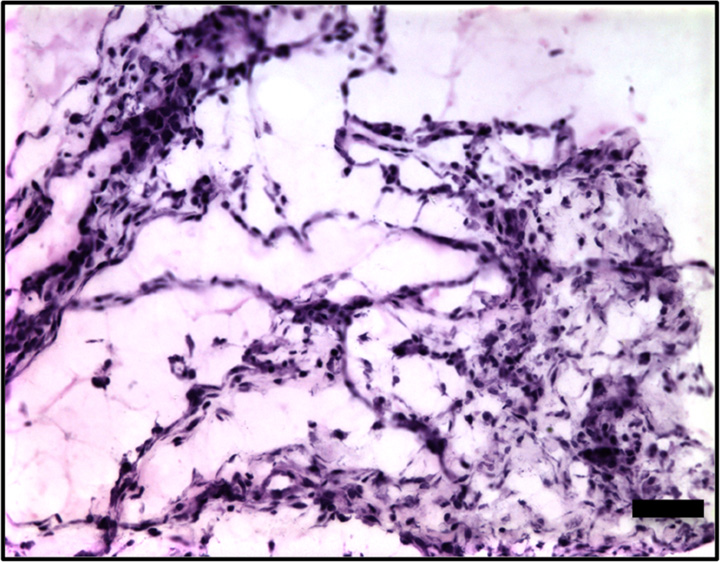
Hematoxylin-eosin and anti-GFP immunohistochemical staining confirmed the presence of C17.2 cells in the explanted Matrigel (BD Biosciences) plugs (Fig 6, Fig E4 [online]). GFP expression (reddish-brown coloration) was robust after pretransfection with lipofectamine and the 2-W/cm2 ultrasound exposure in vivo, with only scattered, weak GFP expression observed without ultrasound or with 1-W/cm2 ultrasound exposure.
Figure 6a:
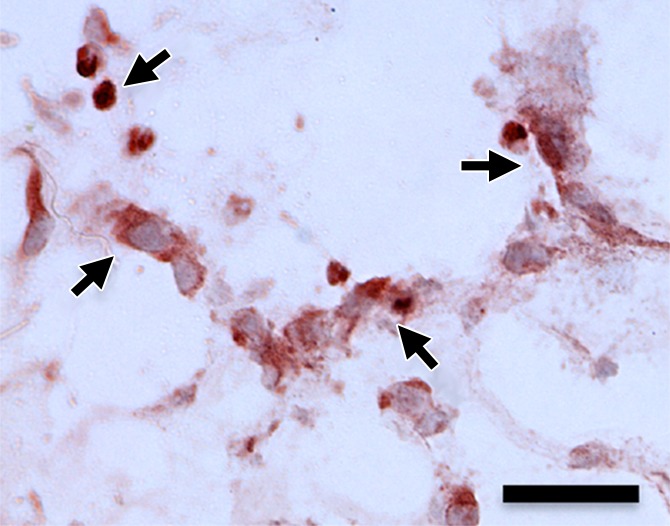
(a–d) Representative bright-field histologic sections (original magnification, ×40) after anti-GFP immunohistochemical staining from plugs exposed to 2 W/cm2 ultrasound (a) and 1 W/cm2 ultrasound (b), exposed to no ultrasound as a negative control (c), and pretransfected by using lipofectamine (d) as shown. GFP expression (reddish-brown product, arrows) is most abundant in the positive control (d) and after 2-W/cm2 ultrasound exposure. Scattered and scant GFP expression is seen after 1-W/cm2 ultrasound application and less if no ultrasound was applied. Scale bar = 10 μm.
Figure 6b:
(a–d) Representative bright-field histologic sections (original magnification, ×40) after anti-GFP immunohistochemical staining from plugs exposed to 2 W/cm2 ultrasound (a) and 1 W/cm2 ultrasound (b), exposed to no ultrasound as a negative control (c), and pretransfected by using lipofectamine (d) as shown. GFP expression (reddish-brown product, arrows) is most abundant in the positive control (d) and after 2-W/cm2 ultrasound exposure. Scattered and scant GFP expression is seen after 1-W/cm2 ultrasound application and less if no ultrasound was applied. Scale bar = 10 μm.
Figure 6c:
(a–d) Representative bright-field histologic sections (original magnification, ×40) after anti-GFP immunohistochemical staining from plugs exposed to 2 W/cm2 ultrasound (a) and 1 W/cm2 ultrasound (b), exposed to no ultrasound as a negative control (c), and pretransfected by using lipofectamine (d) as shown. GFP expression (reddish-brown product, arrows) is most abundant in the positive control (d) and after 2-W/cm2 ultrasound exposure. Scattered and scant GFP expression is seen after 1-W/cm2 ultrasound application and less if no ultrasound was applied. Scale bar = 10 μm.
Figure 6d:
(a–d) Representative bright-field histologic sections (original magnification, ×40) after anti-GFP immunohistochemical staining from plugs exposed to 2 W/cm2 ultrasound (a) and 1 W/cm2 ultrasound (b), exposed to no ultrasound as a negative control (c), and pretransfected by using lipofectamine (d) as shown. GFP expression (reddish-brown product, arrows) is most abundant in the positive control (d) and after 2-W/cm2 ultrasound exposure. Scattered and scant GFP expression is seen after 1-W/cm2 ultrasound application and less if no ultrasound was applied. Scale bar = 10 μm.
Discussion
This study demonstrated that 200 000 C17.2 cells loaded with pLuciferase GFP-carrying MBs can be transfected in vivo by using ultrasound. Luciferase and GFP expression were significantly higher when 2-W/cm2 ultrasound power was applied at 2.25 MHz with a 50% duty cycle for 1 minute, when compared with the control, no-ultrasound group. Although some transfection occurred as observed histologically, the transfection was insufficient to detect luciferase expression in vivo at 1 W/cm2. This finding is consistent with published reports that demonstrated that ultrasound is needed for MB-mediated gene transfection (4–10) and that an acoustic power threshold exists for effective transfection (17). It is likely that intracellular MBs become less responsive to ultrasound because of the dampening effect of the cell membrane, as has been reported previously (16,18,19). The advantage is that the blood half-life of intracellular MBs is prolonged to several days (16). Additionally, although MBs are resistant to destruction, they are still able to behave nonlinearly when exposed to ultrasound and can generate harmonic signals (16,19), which facilitate cell tracking that can allow detection of a single cell (16).
Our ability to transfect stem cells in vivo with ultrasound holds promise for the future of stem cell–based gene therapy strategies. First, it is safer than viral-based gene delivery systems. Second, cationic MBs can be loaded with a spectrum of plasmids that include reporter genes, as shown in our study, but alternatively with therapeutic or “killer” genes, as suggested by Fujii et al (20). They demonstrated that MB-mediated delivery of vascular endothelial growth factor and stem cell factor into ischemic myocardial tissue improved recruitment of vascular endothelial growth factor receptor 2–expressing cells and stem cell factor receptor (c-kit)–expressing cells that increased vascular density and heart function. Mesenchymal stem cells that target tumors have been used to increase the local production of various antitumor cytokines and chemokines like interleukin 2 (21), interleukin 12 (22), tumor necrosis factor–related apoptosis-inducing ligand (23), and interferon-β (24). However, systemic delivery, which would be preferred to target nondetectable tumors, could result in unwanted effects, since these cells accumulate in the lung, liver, and other organs. Our ability to load DNA-carrying MBs within these cells allows us to not only track them and confirm the accumulation in the area of interest by using low-power ultrasound but also induce gene expression in only the location of interest to minimize potential side effects. With localized activation, there will be no need to directly inject pretransfected cells into the site of interest. It should be noted that this approach is not limited to stem cells but can be applied to other cell-based immunotherapy strategies.
The major challenge remaining for our proposed approach is whether a sufficient number of cells loaded with MBs can home to sites of interest. The mouse model did not allow us to administer a large number of cells systemically to achieve sufficient local cell concentrations. The next phase in the development of this approach will require larger animals. Another limitation of this approach is that transfected genes will dilute with cell division, since the probability that the transfecting gene will incorporate in the cells genome is low; however, this dilution is less problematic than intracellular particle labeling. We resorted in this study to placing the stem cells within a Matrigel (BD Biosciences) plug implanted subcutaneously in the flanks as proof of principle. Although this provided a sufficient local concentration of cells, the avascular Matrigel (BD Biosciences) limited the bioavailability of intraperitoneal d-luciferin to cells. We elected to use the intraperitoneal route rather than injecting d-luciferin subcutaneously adjacent to the plug to improve reproducibility and decrease variance to better assess the effect of ultrasound power. Since DNA-loaded MBs internalized by C17.2 cells induced transfection only when exposed to ultrasound (16), this suggests that the DNA-loaded MBs were in endosomes and unable to reach the nucleus. Although we showed that MBs loaded within the C17.2 cells survived for at least 5 days in vivo after intravenous administration (16), we have not determined whether transfection efficiency decreases over time as endosomes mature to lysosomes.
In summary, although much remains to optimize and prove the potential of this approach, this study provides early evidence that stem cells can be loaded with DNA-carrying MBs, administered in vivo, and transfected with ultrasound and remain alive to express the gene. We next plan to evaluate transfection efficiency as MBs remain within cells for an extended period of time prior to transfection to define the maximum time allowed for homing and finally optimize stem cell delivery to tumors and other tissues of interest after local or systemic administration.
Advance in Knowledge
■ Stem cells can be loaded with DNA-carrying microbubbles, administered and transfected in vivo with ultrasound, and remain alive to express the gene of interest in vivo.
Implications for Patient Care
■ The ability to load stem cells that naturally home to tumors and regions of inflammation, infection, and infarction with DNA-carrying microbubbles that can be activated in the region of interest to turn on any desired function provides opportunities to stimulate healing, induce a desired immune response, or produce potent toxins or pro–drug-converting enzymes.
■ Since ultrasound exposure is required for in vivo stem cell transfection and activation that can be accomplished at a specific site, it circumvents the need to administer preactivated stem cells, as is done currently, to avoid the undesired consequences in organs that naturally collect stem cells or in regions in which the stem cells strayed, increasing safety.
SUPPLEMENTAL FIGURES
Acknowledgments
Acknowledgments
We thank Evan Snyder, MD, PhD, at the Sanford-Burnham Medical Research Institute for providing the C17.2 cells and Thomas Kipps, MD, PhD, at the University of California–San Diego Moores Cancer Center for providing the plasmid luciferase GFP. We also thank the University of California–San Diego Moores Cancer Center Microscopy shared facility for equipment.
Received July 30, 2014; revision requested September 15; revision received November 1; accepted December 10; final version accepted January 8, 2015.
Supported in part by the RSNA Resident Research Grant 2010-2011 (RR1019).
Funding: This research was supported by the National Institutes of Health (grant ICMIC P50 CA128346).
Abbreviations:
- GFP
- green fluorescent protein
- MB
- microbubble
- PBS
- phosphate-buffered saline
Disclosures of Conflicts of Interest: S.T. disclosed no relevant relationships. A.V. disclosed no relevant relationships. W.C. disclosed no relevant relationships. R.F.M. disclosed no relevant relationships.
References
- 1.Verissimo LM, Lima LF, Egito LC, de Oliveira AG, do Egito ES. Pharmaceutical emulsions: a new approach for gene therapy. J Drug Target 2010;18(5):333–342. [DOI] [PubMed] [Google Scholar]
- 2.Patil SD, Rhodes DG, Burgess DJ. DNA-based therapeutics and DNA delivery systems: a comprehensive review. AAPS J 2005;7(1):E61–E77. [DOI] [PMC free article] [PubMed] [Google Scholar]
- 3.Yi Y, Noh MJ, Lee KH. Current advances in retroviral gene therapy. Curr Gene Ther 2011;11(3):218–228. [DOI] [PMC free article] [PubMed] [Google Scholar]
- 4.Carson AR, McTiernan CF, Lavery L, et al. Ultrasound-targeted microbubble destruction to deliver siRNA cancer therapy. Cancer Res 2012;72(23):6191–6199. [DOI] [PMC free article] [PubMed] [Google Scholar]
- 5.Lawrie A, Brisken AF, Francis SE, Cumberland DC, Crossman DC, Newman CM. Microbubble-enhanced ultrasound for vascular gene delivery. Gene Ther 2000;7(23):2023–2027. [DOI] [PubMed] [Google Scholar]
- 6.Li HL, Zheng XZ, Wang HP, Li F, Wu Y, Du LF. Ultrasound-targeted microbubble destruction enhances AAV-mediated gene transfection in human RPE cells in vitro and rat retina in vivo. Gene Ther 2009;16(9):1146–1153. [DOI] [PubMed] [Google Scholar]
- 7.Lu QL, Liang HD, Partridge T, Blomley MJ. Microbubble ultrasound improves the efficiency of gene transduction in skeletal muscle in vivo with reduced tissue damage. Gene Ther 2003;10(5):396–405. [DOI] [PubMed] [Google Scholar]
- 8.Noble ML, Kuhr CS, Graves SS, et al. Ultrasound-targeted microbubble destruction-mediated gene delivery into canine livers. Mol Ther 2013;21(9):1687–1694. [DOI] [PMC free article] [PubMed] [Google Scholar]
- 9.Panje CM, Wang DS, Pysz MA, et al. Ultrasound-mediated gene delivery with cationic versus neutral microbubbles: effect of DNA and microbubble dose on in vivo transfection efficiency. Theranostics 2012;2(11):1078–1091. [DOI] [PMC free article] [PubMed] [Google Scholar]
- 10.Wang DS, Panje C, Pysz MA, et al. Cationic versus neutral microbubbles for ultrasound-mediated gene delivery in cancer. Radiology 2012;264(3):721–732. [DOI] [PMC free article] [PubMed] [Google Scholar]
- 11.Sirsi SR, Borden MA. Advances in ultrasound mediated gene therapy using microbubble contrast agents. Theranostics 2012;2(12):1208–1222. [DOI] [PMC free article] [PubMed] [Google Scholar]
- 12.Stride E. Physical principles of microbubbles for ultrasound imaging and therapy. Cerebrovasc Dis 2009;27(Suppl 2):1–13. [DOI] [PubMed] [Google Scholar]
- 13.Ren JL, Wang ZG, Zhang Y, et al. Transfection efficiency of TDL compound in HUVEC enhanced by ultrasound-targeted microbubble destruction. Ultrasound Med Biol 2008;34(11):1857–1867. [DOI] [PubMed] [Google Scholar]
- 14.Xie A, Belcik T, Qi Y, et al. Ultrasound-mediated vascular gene transfection by cavitation of endothelial-targeted cationic microbubbles. JACC Cardiovasc Imaging 2012;5(12):1253–1262. [DOI] [PMC free article] [PubMed] [Google Scholar]
- 15.Suzuki J, Ogawa M, Takayama K, et al. Ultrasound-microbubble-mediated intercellular adhesion molecule-1 small interfering ribonucleic acid transfection attenuates neointimal formation after arterial injury in mice. J Am Coll Cardiol 2010;55(9):904–913. [DOI] [PubMed] [Google Scholar]
- 16.Cui W, Tavri S, Benchimol MJ, et al. Neural progenitor cells labeling with microbubble contrast agent for ultrasound imaging in vivo. Biomaterials 2013;34(21):4926–4935. [DOI] [PMC free article] [PubMed] [Google Scholar]
- 17.Escoffre JM, Zeghimi A, Novell A, Bouakaz A. In-vivo gene delivery by sonoporation: recent progress and prospects. Curr Gene Ther 2013;13(1):2–14. [DOI] [PubMed] [Google Scholar]
- 18.Dayton PA, Chomas JE, Lum AF, et al. Optical and acoustical dynamics of microbubble contrast agents inside neutrophils. Biophys J 2001;80(3):1547–1556. [DOI] [PMC free article] [PubMed] [Google Scholar]
- 19.Lindner JR, Dayton PA, Coggins MP, et al. Noninvasive imaging of inflammation by ultrasound detection of phagocytosed microbubbles. Circulation 2000;102(5):531–538. [DOI] [PubMed] [Google Scholar]
- 20.Fujii H, Sun Z, Li SH, et al. Ultrasound-targeted gene delivery induces angiogenesis after a myocardial infarction in mice. JACC Cardiovasc Imaging 2009;2(7):869–879. [DOI] [PubMed] [Google Scholar]
- 21.Nakamura K, Ito Y, Kawano Y, et al. Antitumor effect of genetically engineered mesenchymal stem cells in a rat glioma model. Gene Ther 2004;11(14):1155–1164. [DOI] [PubMed] [Google Scholar]
- 22.Gao P, Ding Q, Wu Z, Jiang H, Fang Z. Therapeutic potential of human mesenchymal stem cells producing IL-12 in a mouse xenograft model of renal cell carcinoma. Cancer Lett 2010;290(2):157–166. [DOI] [PubMed] [Google Scholar]
- 23.Loebinger MR, Eddaoudi A, Davies D, Janes SM. Mesenchymal stem cell delivery of TRAIL can eliminate metastatic cancer. Cancer Res 2009;69(10):4134–4142. [DOI] [PMC free article] [PubMed] [Google Scholar]
- 24.Ren C, Kumar S, Chanda D, et al. Cancer gene therapy using mesenchymal stem cells expressing interferon-beta in a mouse prostate cancer lung metastasis model. Gene Ther 2008;15(21):1446–1453. [DOI] [PMC free article] [PubMed] [Google Scholar]
Associated Data
This section collects any data citations, data availability statements, or supplementary materials included in this article.