

Abstract
The innate immune system provides the first response to infection and is now recognized to be partially pathogen-specific. Mycobacterium tuberculosis (MTB) is able to subvert the innate immune response and survive inside macrophages. Curiously, only 5–10% of otherwise healthy individuals infected with MTB develop active tuberculosis (TB). We do not yet understand the genetic basis underlying this individual-specific susceptibility. Moreover, we still do not know which properties of the innate immune response are specific to MTB infection. To identify immune responses that are specific to MTB, we infected macrophages with eight different bacteria, including different MTB strains and related mycobacteria, and studied their transcriptional response. We identified a novel subset of genes whose regulation was affected specifically by infection with mycobacteria. This subset includes genes involved in phagosome maturation, superoxide production, response to vitamin D, macrophage chemotaxis, and sialic acid synthesis. We suggest that genetic variants that affect the function or regulation of these genes should be considered candidate loci for explaining TB susceptibility.
The innate immune system provides the first line of defense against microbial pathogens. Broadly speaking, innate immune cells recognize foreign molecules through pattern recognition receptors (PRRs), e.g. Toll-like receptors (TLRs), which bind to highly-conserved pathogenic motifs known as pathogen-associated molecular patterns (PAMPs)1,2. In addition, innate immune cells recognize damage-associated molecular patterns (DAMPs) of host molecules released by infected cells3. The initial innate response involves the release of proinflammatory cytokines and lipids to recruit and activate other immune cells, phagocytosis of the pathogen, and apoptosis4. If the infection persists, the phagocytes stimulate the adaptive immune system by presenting antigens to activate T and B cells. In contrast to the highly specific adaptive immune response, the innate immune response has traditionally been viewed as a general response to infection.
Yet, more recent work revealed that the innate immune system also produces a pathogen-specific response in addition to the general response5,6,7,8. Furthermore, this pathogen-specific innate response can in turn affect the specificity of the adaptive immune response by directing the differentiation of T cells into distinct subtypes9. That said, though we developed an appreciation for the importance of the specific innate immune response, we still do not know the extent to which the innate immune response differs between infections nor fully understand the consequences of specific innate immune responses for fighting pathogens. One of the first challenges is to distinguish the unique immune response to a specific pathogen from the large core more general response.
The pathogen-specific innate immune response is determined, at least in part, by the specificity of the PRRs of the host immune cell. Each PRR binds to its specific targets and activates certain downstream signaling pathways10. For example, treatment of mouse dendritic cells with lipopolysaccharide (LPS), which is found on the outer membrane of gram-negative bacteria, or with PAM3CSK4 (PAM), which is a synthetic lipoprotein that mimics those found on both gram-negative and gram-positive bacteria, induce different transcriptional response programs, because the two antigens are bound by TLR4 and TLR2, respectively11. Different pathogens not only stimulate different PRRs, but they have also evolved different evasion mechanisms to manipulate the innate immune response2,12,13,14. These evasion strategies likely also contribute to the specificity of the response to different pathogens.
In the context of evasion strategies, the case of Mycobacterium tuberculosis (MTB), the causative agent of tuberculosis (TB), is especially interesting. In order to increase its success inside alveolar macrophages - the primary cells that target MTB upon infection - MTB subverts the immune response through various mechanisms. MTB disrupts phagosomal maturation, thus preventing acidification by vesicular proton pumps and lysosomal fusion12,15,16, and delays stimulation of the adaptive immune system by inducing host expression of anti-inflammatory cytokines17,18. In order to achieve these manipulations, MTB must be able to secrete bacterial effectors from the phagosome into the cystosol where they can interact with host factors19. For this reason, the ESX-1 secretion system of MTB is critical for virulence because it permeabilizes the phagosome membrane20,21. Not only does this membrane permeabilization provide a means for bacterial molecules to access the cytosol, but at later timepoints MTB has been observed to have escaped into the cytosol19. One well-studied consequence of phagosomal permeability is the detection of MTB DNA in the cytosol by the host sensor cGAS (MB21D1) and subsequent activation of the STING (TMEM173) pathway22,23,24,25. These signaling events result in immune responses that are both beneficial and detrimental to MTB survival. On the one hand, the expression of anti-viral type I interferons are increased, a response which has been observed to benefit the growth of MTB and other bacteria26. On the other hand, MTB is targeted for destruction via autophagy, a key defense mechanism for fighting intracellular pathogens27. Thus the survival or destruction of MTB inside the macrophage depends on complex interactions between secreted bacterial effectors and host immune factors.
While the adaptive immune system is needed to prevent the spread of MTB and subsequent onset of TB, infected individuals do not become immunized against future MTB infections. This property may be related to the difficulty to develop an effective vaccine for adult TB (the current vaccine, bacillus Calmette–Guérin, BCG, is partly effective in children, much less so in adults)28.
Interestingly from a human genetics viewpoint, there are large inter-individual differences in susceptibility to developing TB. While it is estimated that roughly a third of the human population is latently infected with MTB, only approximately 10% of healthy infected individuals will develop active TB (immunocompromised individuals, e.g. HIV-infected, develop active TB at a much higher frequency)29. Despite an inference for a strong individual genetic component to TB susceptibility, the genetic architecture remains largely unknown30,31,32,33. There have been quite a few reports of candidate-gene associations, but genome wide scans have only identified two weak associations with disease susceptibility34,35,36.
To begin addressing this gap, we have previously investigated genetic variation that is associated with inter-individual differences in the transcriptional response of human phagocytes to infection with MTB37. We found 102 and 96 genes that were associated with an expression QTL (eQTL) only pre- or post-infection, respectively. We refer to these loci as response eQTLs since their association with gene expression is affected by MTB infection. Interestingly, these response eQTLs were enriched for significant signal in a genome wide association study of TB susceptibility34. However, it is unknown if the genes associated with these response eQTLs are induced specifically in response to infection with MTB or are a part of the core innate immune response.
In order to characterize the innate immune response specific to MTB infection and better understand the role of the response eQTL-associated genes in the innate immune response, we infected macrophages isolated from a panel of six healthy individuals with a variety of bacteria. In addition to MTB, we chose both related mycobacteria and more distantly related bacteria.
Results
Bacterial infection induces large changes in gene expression
To learn about the immune response to infection with different bacteria, with a particular emphasis on Mycobacterium tuberculosis (MTB), we investigated the in vitro gene regulatory response of macrophages to infection with multiple MTB stains, related mycobacterial species, and other bacterial species (Table 1). Specifically, we infected cultured macrophages with either MTB H37Rv, which is a common strain often used in laboratory experiments38; MTB GC1237, which is a strain of the highly virulent Beijing family39; bacillus Calmette-Guérin (BCG), which is attenuated Mycobacterium bovis used for vaccinations; Mycobacterium smegmatis, which is non-pathogenic; or heat-killed MTB H37Rv. In order to compare the response to infection with mycobacteria to the response to infection with other bacteria, we also included infection treatments with Yersinia pseudotuberculosis (gram-negative), Salmonella typhimurium (gram-negative), or Staphylococcus epidermidis (gram-positive).
Table 1. Description of bacteria.
| Abbr. | Name | Description | Gram staining* |
|---|---|---|---|
| none | control | Mock infection | N/A |
| Rv | MTB H37Rv | A common laboratory strain of MTB | acid-fast |
| Rv+ | heat-inactivated MTB H37Rv | Dead MTB H37Rv | acid-fast |
| GC | MTB GC1237 | More virulent strain of MTB | acid-fast |
| BCG | bacillus Calmette-Guérin | Vaccine (attenuated M. bovis) | acid-fast |
| Smeg | Mycobacterium smegmatis | Non-pathogenic mycobacterium | acid-fast |
| Yers | Yersinia pseudotuberculosis | Facultative intracellular pathogen | Negative |
| Salm | Salmonella typhimurium | Facultative intracellular pathogen | Negative |
| Staph | Staphylococcus epidermidis | Extracellular pathogen | Positive |
*Mycobacteria are unable to be gram stained due to the low permeability of their cell walls. They are more closely related evolutionarily to gram-positive bacteria than gram-negative. However, their thick cells walls share features of gram-negative bacteria, e.g. a "pseudoperiplasm" similar to the gram-negative periplasm117.
We infected monocyte-derived macrophages from six individuals with the bacteria described above (including a non-infected control) and extracted RNA at 4, 18, and 48 hours post-infection (see Methods; Supplementary Fig. S1). We assessed RNA quality using the Agilent Bioanlyzer (Supplementary Table S6) and sequenced the RNA to estimate gene expression levels. Detailed descriptions of our data processing, quality control analyses, and statistical modeling are available in the Methods section. Briefly, we mapped the short RNA-seq reads to the human genome (hg19) using the Subread algorithm40, discarded reads that mapped non-uniquely, and counted the number of reads mapped to each protein-coding gene. We normalized the read counts using the weighted trimmed mean of M-values algorithm (TMM)41, corrected for confounding "batch" effects (Supplementary Fig. S2), and used limma + voom42,43,44 to test for differential expression (DE) between cultures infected with each bacteria and their time-matched controls (Supplementary Table S2). Using this approach we initially observed the following general patterns: at four hours post-infection, only Y. pseudotuberculosis and S. typhimurium elicited a strong transcriptional response (Fig. 1A); at 18 hours post-infection, all the bacteria had elicited a strong immune response (Fig. 1A,B); and at 48 hours post-infection, all the bacteria continued stimulating the immune response (Fig. 1A), however, many of the DE genes were not shared between the 18 and 48 hour timepoints (Fig. 1C). Of note, at 48 hours post-infection we were unable to collect RNA from macrophages infected with S. epidermidis (see Methods).
Figure 1. Differential expression analysis.

We tested for differentially expressed genes for each bacterial infection by comparing it to its time-matched control. (A) We classified genes with q-value < 5% as differentially expressed. The mycobacteria are labeled in shades of green. (B) As expected, there were large transcriptional changes 18 hours post-infection with MTB H37Rv. Genes with q-value < 5% and absolute log2 fold change greater than 0.5 are labeled green, those with q-value < 5% and absolute log 2 fold change less than 0.5 are labeled grey, and non-differentially expressed genes are labeled black. (C) The overlap in differentially expressed genes identified at 4, 18, and 48 hours post-infection with MTB H37Rv.
Joint analysis identifies bacteria-specific response genes
In order to learn about variation in the innate immune response to bacterial infection, we identified genes whose regulation was altered by treatment with specific bacteria at specific timepoints. We first used a naïve approach whereby we determined all the pairwise overlaps between lists of DE genes across treatments (Supplementary Table S7). The caveat of this strategy is that incomplete power can result in overestimating the difference between treatments. In order to account for incomplete power to detect DE genes when performing multiple pairwise comparisons, we performed a joint Bayesian analysis, which we implemented using the R/Bioconductor package Cormotif45 (see Methods for more details). Using this approach, we classified genes into regulatory patterns based on their expression levels following each of the bacterial infections.
First, we examined the data across all the bacteria-time combinations. Initially we built a model that classified genes into one of 14 separate patterns based on their expression levels after each infection relative to their expression level in the non-infected control (Supplementary Fig. S3). However, we found that a model with only six expression patterns (Fig. 2; Supplementary Tables S3,S4), where a subset of the original 14 patterns are combined, is more intuitive from a biological perspective; thus we proceeded with the reduced model. Broadly speaking, we classified genes as responding in the early, middle, or late stages of infection, and we characterized the response as temporary or sustained. Pattern "non-DE" includes 4,245 genes whose expression levels were unchanged in all the experiments. Pattern "Yers-Salm" includes 1,414 early response genes whose expression levels changed at four hours post-infection with either Y. pseudotuberculosis or S. typhimurium, but not after infection with other bacteria. The genes in this pattern are enriched for gene ontology (GO) annotations related to type I interferon signaling (e.g. SP100, IFI35, STAT2), antigen presentation (HLA-A, PSME1, CTSS), and apoptosis (CASP8, TRADD, FADD) (Supplementary Table S5). Pattern "18 h" includes 3,201 middle response genes whose expression levels changed exclusively at 18 hours post-infection in response to all bacteria and is enriched for GO annotations related to apoptosis (e.g. E2F1, TP53, WWOX). Pattern "48 h" includes 1,204 late response genes whose expression levels changed at 48 hours and is enriched for GO annotations related to phagocytosis (e.g. MFGE8, COLEC12) and tumor necrosis factor-mediated signaling (e.g. STAT1, TRAF2, TNFRSF14). Pattern "18 & 48 h" includes 1,926 middle-sustained response genes whose expression levels changed at 18 and 48 hours and is enriched for GO annotations related to the regulation of phagocytosis (e.g. CD36) and TLR signaling (TLR1, TLR2, MYD88). Lastly, pattern "All" includes 738 early-sustained genes whose expression levels changed after infection with all the bacteria across all three timepoints and is enriched for GO annotations related to type I interferon signaling (e.g. IRF1, SOCS1, IFIT3), cytokine secretion (TNF, IL10, LILRB1), and apoptosis (e.g. IRF7, BCL2A1, MCL1).
Figure 2. Joint Bayesian analysis.

(A) Joint analysis of gene expression data from all three timepoints with Cormotif45 identified six expression patterns: "non-DE", "Yers-Salm", "18 h", "48 h", "18 & 48 h", and "All". The shading of each box represents the posterior probability that a gene assigned to the expression pattern (row) is differentially expressed in response to infection with a particular bacteria (column), with black representing a high posterior probability and white a low posterior probability. (B) Each data point is the mean log2 fold change in expression (absolute value) in response to infection with the given bacteria for all the genes assigned to the particular expression pattern.
Next, we tested for more specific patterns by performing Cormotif separately on the data from the middle (18 h) and late (48 h) stages of infection. At 18 hours post-infection, we identified five separate expression patterns (Fig. 3; Supplementary Tables S3,S4). Pattern "non-DE" includes 5,268 genes whose expression levels were unchanged across all infections. Pattern "All" includes 4,424 genes whose expression levels were affected by all infections (e.g. IL24, IRF2, TLR2). Pattern "MTB" includes 177 genes whose expression levels changed specifically in response to infection with mycobacteria (e.g. NCF2, TNFSF13, CSF1). These genes had a high posterior probability of being DE 18 hours after infection with MTB H37Rv, heat-killed H37Rv, MTB GC1237, and BCG. Furthermore, the gray shading for M. Smegmatis (Fig. 3A) signified an intermediate posterior probability for DE. In essence, this pattern is a merger of two sets of genes that were not large enough to be separated: one set that was DE across all five mycobacteria and another that was only DE after infection with the MTB strains and the closely-related BCG, but not M. Smegmatis. Pattern "Virulent", in contrast, includes 1,165 genes whose expression levels were less strongly changed after infection with heat-inactivated MTB H37Rv or the attenuated vaccine strain BCG compared to the other bacteria (e.g. IL1R1, IRF1, PILRB). Also the genes in this category only have an intermediate probability of responding to the non-pathogenic M. smegmatis. Lastly, pattern "Yers-Salm" includes 1,694 genes whose expression levels changed preferentially after infection with Y. pseudotuberculosis or S. typhimurium (e.g. TLR8, TGFB1, IL18).
Figure 3. Joint Bayesian analysis - 18 hours post-infection.

(A) Joint analysis of gene expression data from 18 hours post-infection with Cormotif identified five expression patterns: "Yers-Salm", "Virulent", "MTB", "non-DE", and "All". (B) Example genes from the different expression patterns.
At 48 hours post-infection, we also discovered five expression patterns (Fig. 4; Supplementary Tables S3,S4). While many of the patterns have similar specificities to those observed at 18 hours post-infection, there is only little overlap across timepoints with respect to the genes comprising the patterns. For example, pattern "Yers-Salm" at 48 hours includes 1,582 genes whose expression levels changed strongly after infection with Y. pseudotuberculosis or S. typhimurium (e.g. HLA-DPB1, IL10RB, CD248), but only 263 of these genes are also in the corresponding pattern when we considered the data from the 18 hour timepoint. Similarly, at the 48 hour timepoint, pattern "MTB" includes 288 genes whose expression levels changed preferentially after infection with mycobacteria (e.g. CCL1, ATP6V1A, IL27RA), but only 33 of these genes are in the corresponding pattern at the 18 hour timepoint. Pattern "Virulent" includes 14 genes whose expression levels were not changed after infection with heat-inactivated MTB H37Rv or the attenuated vaccine strain BCG (e.g. MAP3K4, SEMA4G, BTG1), and only one of these also belongs to the pattern "Virulent" at 18 hours post-infection.
Figure 4. Joint Bayesian analysis - 48 hours post-infection.

(A) Joint analysis of gene expression data from 48 hours post-infection with Cormotif identified five expression patterns: "Yers-Salm", "Virulent", "MTB", "non-DE", and "All". (B) Example genes from the different expression patterns.
Infection-induced response eQTLs are shared across bacterial infections
Using the gene expression patterns we identified by applying the joint analysis approach, we investigated the specificity of previously identified response eQTLs to infection with MTB H37Rv37. Since the response eQTLs were identified at 18 hours post-infection, we investigated the distribution of genes associated with response eQTLs among the five patterns we found at that timepoint (Fig. 5A). Only one gene associated with a response eQTL was also DE specifically in response to MTB (CMAS). Otherwise, most of the response eQTL-associated genes were classified as either DE following infection with all bacteria or not DE in any infection. That a large proportion of the genes associated with response eQTLs were not DE in any of these experiments is likely due to the fact that the eQTL study was performed in dendritic cells whereas our data were collected from macrophages. Overall, our observations suggest that most of the previously identified response eQTLs are genetic variants that affect the human innate immune response to bacterial infection in general, and not specifically the response to MTB H37Rv.
Figure 5. Response eQTLs at 18 hours post-infection.
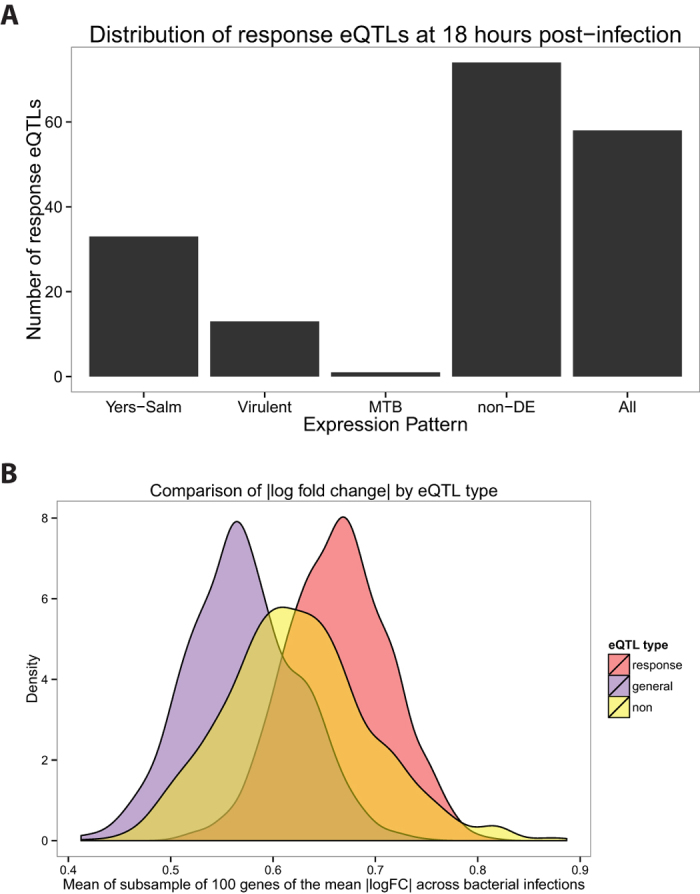
(A) We counted the number of response eQTLs from Barreiro et al.37 (179 out of the 198 were also expressed in our study) in each of the five gene expression patterns at 18 hours post-infection (Fig. 3). (B) We compared the mean log2 fold change in expression across the 8 bacterial infections at the 18 hour timepoint for three classes of genes: response eQTL genes (red), general eQTL genes (purple), and non-eQTL genes (yellow) (see Methods for details).
To provide further broad support for the interpretation that the response eQTL genes are important for the innate response to bacterial infection in general, we considered the log2 fold change in expression values following infection (Fig. 1). For each gene, we calculated the mean log2 fold change in expression level across the eight bacterial infections at the 18 hour timepoint. Next, we compared the absolute values of the log2 fold change in expression between genes associated with response eQTLs, genes associated with general eQTLs (i.e. genes associated with an eQTL pre- and post-infection), and genes not found to be associated with an eQTL. Since there was a large difference in the number of genes in these three classes, we subsampled genes from each and calculated the mean of the absolute values (and repeated this process 1000 times). We found that the expression level of genes associated with response eQTLs is altered to a larger degree (significantly higher effect size; P < 2.2 × e−16; Fig. 5B) following infection compared to the genes in the other two classes.
Discussion
Bayesian analysis identified mycobacteria-specific response genes
In order to identify general and treatment-specific gene regulatory responses, we performed a joint Bayesian analysis of the data using Cormotif45. By jointly analyzing the data, as opposed to comparing overlaps between independent lists of differentially expressed genes generated using an arbitrary cutoff, we minimized the identification of specific responses due to false negatives (i.e. genes that appear to be differentially expressed in response to a subset of bacterial infections when in reality the response is similar across all the infections). Similar to previous observations5,6, we found a large core transcriptional response to infection. However, we also identified a novel subset of genes whose regulation is preferentially altered in response to infection with mycobacteria but not to the other bacteria we tested. Since these responses are unique to infection with mycobacteria (at least in the context of our study design), they may be promising candidates for future studies that focus on the mechanisms by which mycobacteria successfully subvert the human innate immune response. Since this study does not extend to investigation of mechanisms, we do not have empirical data with which to prioritize such possible candidate genes. Yet, the reported functions of many of these genes often suggest mechanisms that are relevant, and often quite specific, to MTB infection. Prioritizing candidate genes in this way is not statistically valid, and one can argue (and indeed, this has been shown46) that any list of genes can be scrutinized to yield "interesting relevant stories". We therefore offer these details in the context of a discussion (rather than "results"), to provide one set of alternative explanations for our findings, and generate ideas for further investigations.
For example, when we focused on the mycobacteria-specific regulatory response 18 hours post-infection, we noticed an intriguing number of genes that are involved in phagosome maturation (Supplementary Fig. S4). Broadly speaking, phagocytosed bacteria are killed by vesicular proton pumps, which lower the pH inside the phagosome, and lysosomal fusion. This process occurs once a phagosome has matured through a series of steps mediated by the exchange of Rab GTPases47,48. A unique property of mycobacteria is their ability to survive inside the macrophage by inhibiting phagosome maturation16. As part of this strategy, the bacterium recruits RAB22A to MTB-containing phagosomes49. Indeed, we found the RAB22A gene to be upregulated in response to infection with mycobacteria (Supplementary Table S4). Similar GTPases whose regulation was altered following mycobacterial infections include RAP2A (upregulated), RAB3A and RAB33A (both downregulated). In addition, the vesicular (v)-ATPase subunit ATP6V1D was exclusively upregulated in response to mycobacterial infection. Thus, the mycobacteria-specific response we identified includes genes putatively involved in mycobacteria-specific survival mechanisms.
An additional intriguing example involves the NCF2 gene. This is a potential candidate gene whose expression level was affected specifically by infection with mycobacteria at 18 hours post-infection. Neutrophil cytosolic factor 2 (NCF2, also known as p67phox) is a subunit of the phagocyte NAPDH oxidase, which is responsible for generating reactive oxygen species used to fight intracellular pathogens50,51,52,53,54,55. These reactive oxygen species may also serve a signaling role in activating other immune cell types to ensure proper granuloma formation and killing of mycobacteria56. Loss-of-function mutations in subunits of the NAPDH oxidase cause chronic granulomatous disease (CGD)55, which is characterized by the formation of granulomas throughout the body due to the inability of phagocytes to kill the ingested pathogens. In contrast to wild type animals, mice with mutations in subunits of the phagocyte NAPDH oxidase develop tuberculosis after infection with the vaccine strain, BCG56. Humans who are administered the vaccine before being diagnosed with CGD also develop the disease55.
At 48 hours post-infection (Fig. 4), the mycobacteria-specific response was enriched with genes annotated (based on GO) as having a role in "response to vitamin D" (Supplementary Table S5; Supplementary Fig. S5). Individuals with low circulating levels of vitamin D are more susceptible to developing tuberculosis57,58, and vitamin D has been investigated as a supplemental therapy for the treatment of tuberculosis, though with mixed results59,60,61,62. Vitamin D has been found to be important for innate immune cells to fight MTB63,64,65; however, it is also an important pathway for generic bactericidal activity66. Consistent with its role in the innate immune response, both the enzyme that converts vitamin D to its active form (CYP27B1) and its receptor (VDR) are upregulated in response to any of the infections (pattern "All"; Fig. 4). Yet, the regulation of other genes involved in the response to vitamin D was only affected by infection with MTB. PIM1, a serine/threonine kinase that binds the VDR and enhances transcription of its target genes67, is upregulated in response to the mycobacteria (pattern "MTB", Fig. 4). Interestingly, the increased expression level of PIM1 in T-cells was successfully used in a six-gene classifier of patients with active versus latent TB infections68. Another gene, the chemokine CXCL10 (also known as interferon gamma-induced protein 10 or IP-10), is also upregulated in response to mycobacterial infection (pattern "MTB", Fig. 4). Discordant with the observed increase in expression of CYP27B1, VDR, and PIM1 in response to infection, treatment with vitamin D usually leads to the reduction of CXCL10 expression and secretion in multiple cell types69,70,71. In fact, supplementation with vitamin D decreased serum levels of CXCL10 in TB patients72. This suggests that the immunosuppresive effect of vitamin D signaling is insufficient to overcome the pro-inflammatory response to mycobacterial infection. This observation is in concordance with past studies which found increased expression of CXCL10, as well as increased secretion level from macrophages, following infection with MTB64,73. Interestingly, a polymorphism in CXCL10 was found to be associated with susceptibility to tuberculosis in a Chinese population74,75. Overall, these observations provide support for the importance of vitamin D signaling for specifically fighting mycobacterial infections.
Another gene of interest from the mycobacteria-specific expression pattern at 48 hours post-infection is chemokine (C-C motif) ligand 1 (CCL1), which stimulates migration of human monocytes76 (Fig. 4B). Thuong et al. identified CCL1 as being induced to a greater extent in MTB-infected macrophages (4 hours post-infection) isolated from individuals with pulmonary TB compared to macrophages from individuals with latent TB infections77. Put together, our observations and those of Thuong and colleagues suggest that CCL1 is involved in the pathogenesis of TB. Further supporting this notion, Thuong et al. also found a genetic association between variants in the CCL1 region and TB susceptibility77. However to date, subsequent genetic association studies investigating CCL1 have reported mixed results78,79.
One caveat of the joint Bayesian analysis is that we were not able to classify genes into unusual patterns (because this approach can only discover expression patterns shared by a large number of genes and, by definition, only few genes fall into "unusual" patterns). For example, unusual patterns of interest include changes in expression specifically in response to some but not all of the mycobacterial infections. One gene that satisfied this pattern is the dual specificity phosphatase 14 (DUSP14). We specifically examined the expression data for this gene because it was previously associated with an MTB infection response eQTL in dendritic cells37, and consequently when the eQTL results were used as a prior - DUSP14 was found to be significantly associated with TB susceptibility. Moreover, knocking down DUSP14 expression via siRNA in murine macrophages resulted in a lower bacterial load 90 hours post-infection with MTB H37Rv80. In our joint Bayesian analysis, DUSP14 was not classified as one of the genes whose regulation was altered in response to infection with mycobacteria. Yet, DUSP14 was upregulated at 18 hours post-infection with MTB H37Rv (q-value: 16%), MTB GC1237 (q-value: 3%), and BCG (q-value: 9%); and downregulated post-infection with S. typhimurium (q-value: 9%) (Supplementary Fig. S6). Thus, our data lends further support for the role of DUSP14 as a TB susceptibility gene.
Little evidence for strain-specific transcriptional response to infection
There are six major families of MTB that differ in their geographic distribution and virulence81,82. Strains from these families are known to differ in their growth rates inside macrophages83, expression levels of bacterial genes84,85, and cell wall lipid composition86. Previous studies have found that different MTB strains induce different innate immune responses in human cell lines and other infection models87. A dominate narrative is that MTB strains from East Asia, referred to as the Beijing family (Gagneux et al. classified it as MTB lineage 281), are more virulent because they induce a lower proinflammatory immune response compared to the common laboratory strains88,89,90,91,92. However, other studies have reported the opposite, namely that Beijing strains induce a larger proinflammatory response93, or a conflicting response in which various pro- and anti-inflammatory cytokines are differentially regulated94,95 compared to laboratory strains.
In our study, albeit with a small sample size, we found no marked differences between the transcriptional response to infection with MTB H37Rv or MTB GC1237, a Beijing strain (Supplementary Fig. S7; Supplementary Table S8). Furthermore, the pro-inflammatory cytokines TNF and IL6 and the anti-inflammatory cytokine IL10 were strongly upregulated in response to both strains of MTB (Supplementary Fig. S8). This observation is in concordance with Wu et al., who also reported no apparent difference in the transcriptional response of THP-1 cells to infection with MTB H37Rv versus multiple Beijing strains96. Thus the increased virulence of the Beijing family of MTB strains may be due to mechanisms not assayed in this study such as post-transcriptional effects, cell-cell signaling, and environmental stimuli. It should be noted, however, that not all Beijing strains are equally virulent97,98 and that MTB H37Rv is a laboratory-adapted strain that has evolved independently in different laboratories99.
Differences in response to virulent versus attenuated pathogens are not mycobacteria-specific
To better understand the interaction between MTB and macrophages, we included in our study both virulent mycobacteria (MTB strains H37Rv and GC1237) and attenuated mycobacteria (heat-inactivated MTB H37Rv and the vaccine strain BCG). Overall, the response to infection with either virulent or attenuated mycobacteria was similar (Figs 3 and 4). This observation was unsurprising because it has been previously demonstrated that infections with inactivated pathogens (in fact, even individual pathogen components) are able to largely recapitulate the transcriptional response to infection5,6,7,8. In other words, as expected, the transcriptional response to infection is largely driven by the antigens present.
Yet, the responses to inactivated pathogens or individual pathogen components in past studies were not identical to the responses to live pathogens, suggesting a potential role for bacterial manipulation of the immune response. For example, it is known that BCG lacks the locus containing the ESX-1 secretion system, which is critical for MTB virulence100,101,102,103. In our study we also observed differences between the response to virulent and attenuated mycobacteria. Specifically, there are 1,165 genes in the expression pattern "Virulent" at 18 hours post-infection (Fig. 3) and 14 genes that comprise of the “Virulent” pattern at 48 hours post-infection (Fig. 4). Importantly, these genes are also differentially expressed in response to the other virulent infections in our study, and thus they are not specifically due to the manipulations of the host cell by virulent mycobacteria.
We attempted to identify a gene expression pattern that specifically represented differences in virulence only in the mycobacteria, yet we never saw such a pattern. It is important to note that had we simply performed a simple pairwise analysis of the overlap of DE genes between MTB and BCG infections, our results would be quite different (Supplementary Table S7). Yet, a pairwise analysis is misleading in the context of the entire study. Indeed, by accounting for incomplete power by using the joint Bayesian model and including other bacterial species, we avoided attributing many differentially expressed genes specifically to the differences in the immune evasion mechanisms used by MTB and BCG. We conclude that either a larger sample size or a different experimental system is required to find specific differences between the response to infection with MTB and BCG.
Previously identified response eQTLs affect response to bacterial infection in general
In a previous study, we identified response eQTLs that were associated with gene expression levels in MTB-infected human dendritic cells. We investigated the expression pattern of genes associated with the response eQTLs in our study. Using the five expression patterns identified by the joint Bayesian analysis at 18 hours post-infection, we examined the distribution of response eQTL genes and discovered that these genes were not enriched in the mycobacteria-specific expression pattern (Fig. 5A). Instead, many were differentially expressed across all the infections (pattern "All"). Thus, response eQTLs modulate the inter-individual response to infection with diverse types of bacteria. That said, one gene was both associated with a response eQTL and specifically differentially expressed following mycobacterial infection. Though this result does not represent a significant enrichment of response eQTL genes among those whose regulation was affected specifically by infection with MTB, the identity of the gene renders the observation intriguing. CMAS (cytidine monophosphate N-acetylneuraminic acid synthetase), is an enzyme that is involved in the processing of sialic acid, which is then added to cell surface glycoproteins and glycolipids. Glycoproteins are known to be important in many functions of the immune response, including initial pathogen detection (e.g. TLRs) and antigen presentation (e.g. major histocompatibility complex (MHC) molecules)104,105,106. We suggest that this gene is an interesting candidate for further understanding both MTB pathogenesis and inter-individual susceptibility to tuberculosis.
Conclusions
By jointly considering data from multiple infection treatments, using a variety of bacteria, we have classified distinct innate immune transcriptional response patterns. The most inclusive pattern was a response to all the bacterial infections, indicating that the receptors that bind the diverse antigens present on the different bacteria converge to largely similar signaling pathways. We also found an expression response pattern specific to mycobacterial infections, the main focus of the current study. At 18 hours post-infection, the mycobacteria response pattern includes genes involved in phagosome maturation and the NAPDH oxidase subunit NCF2. At 48 hours post-infection, it includes genes involved in the response to vitamin D and the chemokine CCL1. We found that the response to infection with different MTB strains was highly similar. Furthermore, the differences we identified between the response to MTB and the vaccine strain BCG were not mycobacteria-specific, but likely represent a difference between the innate immune response to virulent and non-virulent (or attenuated) pathogens. Lastly, we identified a single gene, CMAS, which is both associated with a response eQTL to MTB infection, and whose regulation is altered specifically when we infected the cells with mycobacteria. This gene is thus an especially promising candidate for future studies of TB susceptibility.
Methods
Ethics Statement
Buffy coats were obtained from healthy donors after informed consent. The blood collection protocols were approved by both the French Ministry of Research and a French Ethics Committee under the reference DC-2008-68 collection 2. The blood collection was carried out in accordance with these approved protocols by the Etablissement Français du Sang.
Sample collection and macrophage differentiation
We collected buffy coats (~50 mL) from six healthy donors. Next we isolated peripheral blood mononuclear cells (PBMCs) via Ficoll-Paque centrifugation38 and enriched for monocytes via positive selection with beads containing CD14 antibodies37. Then we differentiated the monocytes into macrophages by culturing for 6–7 days in RPMI buffer supplemented with macrophage colony-stimulating factor (M-CSF)107.
Bacterial infection
For each bacterial infection (Table 1), we treated the macrophages with a multiplicity of infection (MOI) of 2:1. After one hour, we washed the macrophages five times with phosphate-buffered saline (PBS) and treated them with gentamycin (50 μg/μL) to kill all extracellular bacteria. After one hour of antibiotic treatment, we changed the medium to a lower concentration of gentamycin (5 μg/μL), which marked the zero timepoint of the study. We allowed the cells to grow for 4, 18, or 48 hours before lysing them with QIAzol Lysis Reagent and then storing them at −80 °C. We chose these timepoints based on a previous analysis of the human transcriptional response to infection with MTB108. No data is available for 48 hours post-infection with S. epidermidis. After escaping the macrophages upon cell death, sufficient S. epidermidis were able to proliferate in the gentmycin-supplemented medium to contiminate the entire well by 48 hours post-infection.
RNA extraction, library preparation, and sequencing
We extracted RNA using the QIAgen miRNeasy kit. There were a total of 13 batches of 12 samples each (6 individuals ×9 conditions ×3 timepoints, minus 48 hours post-infection with S. epidermidis). We designed the batches to maximally partition the variables of interest (individual, condition, timepoint) in order to minimize the introduction of biases due to batch processing109. To assess RNA quality, we measured the RNA Integrity Number (RIN) with the Agilent Bioanalyzer (Supplementary Table S6). Importantly, there were no significant differences in the RIN (mean of 7.8 ± 2.0) between the bacterial infections or between the timepoints (Supplementary Fig. S9B). In batches of 12 samples, we added barcoded adapters (Illumina TruSeq RNA Sample Preparation Kit v2) and sequenced 50 base pairs single end over multiple flow cells on the Illumina HiSeq 2500.
Mapping, counting, and normalization
We mapped the short reads to the human genome (hg19) using the Subread algorithm40 and discarded those that mapped non-uniquely. Next, we obtained the read counts for each Ensembl protein-coding gene (biotype: “protein_coding”) with the featureCounts algorithm, which sums the reads falling in the union of all exons of a gene and discards reads mapping to more than one gene110. There were no significant differences in the number of mapped exonic reads (mean of 41.8 ± 21.2 million per sample) between the bacterial infections or between the timepoints (Supplementary Fig. S9A). We removed genes with fewer than one count per million exonic reads in fewer than six samples. To account for differences in the read counts at the extremes of the distribution, we normalized the samples using the weighted trimmed mean of M-values algorithm (TMM)41.
Differential expression analysis
To assess the quality of the data, we performed principal components analysis (PCA) of the TMM-normalized log2-transformed counts per million (CPM). PC2 separated the samples by timepoint, but PC1 was associated with the RIN score and the processing batch (Supplementary Fig. S2A). After the effects of RIN score and processing batch were removed with the function removeBatchEffect from the limma package111, PC1 separated the samples by timepoint and PC2 separated the infected and control samples (Supplementary Fig. S2B). We protected the variables of interest (individual, bacteria, timepoint) when regressing the effects of RIN score and processing batch by including them in the linear model used by removeBatchEffect. However, the result was similar if they were not protected since the variables of interest were partitioned across the processing batches (Supplementary Fig. S2C). All figures displaying expression data were generated using the batch-corrected data.
To confirm that the transcriptional response to MTB infection in our study was consistent with previous observations, we compared our MTB infected samples and their time-matched controls to the MTB infected samples and zero timepoint control from Tailleux et al., 2008108. Despite differences in the technology used to assay gene expression (RNA-seq versus microarray) and the method used to isolate the macrophages (positive versus negative selection), we still observed a common transcriptional signature of infection using PCA (Supplementary Fig. S10).
For the standard analysis, we tested for differential expression using limma + voom42,43,44 because it has been shown to perform well with sufficient sample size (n > = 3 per condition)112,113. Based on the PCA results, we included RIN score and processing batch as covariates in the model. We corrected for multiple testing with the Benjamini & Hochberg false discovery rate (FDR)114 and considered genes with q-value less than 5% to be differentially expressed.
Since we were interested in the shared and differential response to infection with the different bacteria, we performed a joint Bayesian analysis using the Cormotif algorithm45. Cormotif shares information across experiments, in this case infections, to identify the main patterns of differential gene expression (which it refers to as correlation motifs) and assigns each gene to one of these gene expression patterns. One caveat of the Cormotif algorithm is that is does not distinguish the direction of the effect across infections. In other words, a gene that is assigned to an expression pattern could be differentially expressed in different directions across the infections. However, in this data set, this was rarely observed (Supplementary Table S9).
In practice, we had to make several modifications when using Cormotif. First, since the method was developed for microarray data, we used the batch-corrected TMM-normalized log2-transformed CPM as input. Second, the method assumes independence between the experiments, and we only have one control per timepoint. However, since this dependence will cause genes to be more likely to be either uniformly differentially expressed across all the infections or uniformly unchanged, this caveat is conservative to our results of gene expression patterns that are specific to subgroups of the bacterial infections. Third, the current version of the method (v1.14.0) does not return the cluster likelihoods, i.e. the likelihood that a gene belongs to each of the gene expression patterns. To facilitate downstream analyses with these sets of genes, we modified the original code to additionally return this information. Lastly, Cormotif is non-deterministic. Thus to obtain consistent results, we ran each test 100 times and kept the result with the largest maximum likelihood estimate.
We tested for enrichment of gene ontology (GO) biological processes among the genes in the gene expression patterns using topGO115. We tested for significance with the Fisher's Exact Test, used the weight01 algorithm from topGO to account for the correlation among GO categories due to its graph structure, and considered significant any category with p-value less than 0.01.
Analysis using previously identified response eQTLs
We downloaded the list of response eQTL genes from Supplementary Table 3 from Barreiro et al.37. Of the 198 response eQTL genes discovered in the dendritic cells in that study, 179 of the genes were also expressed in the macrophages from this study. In order to compare the differential expression results of the response eQTL genes to other genes, we used the log2 fold changes in expression estimated by limma111. First, we calculated the mean log2 fold change at 18 hours post-infection for each gene across the eight bacteria. Second, we converted these mean estimates to their absolute values. Third, we subsampled 100 genes from each of the three categories (response eQTL, general eQTL, and non-eQTL genes) and calculated the mean of the absolute values. We performed this subsampling 1000 times (Fig. 5B). Fourth, we performed t-tests to compare the distribution of response eQTL genes to either that of the general eQTL genes or the non-eQTL genes.
Data and code availability
The data have been deposited in NCBI's Gene Expression Omnibus116 and are accessible through GEO Series accession number GSE67427 (http://www.ncbi.nlm.nih.gov/geo/query/acc.cgi?acc=GSE67427). Supplementary Table S1, which contains the gene expression data, and Supplementary Table S2, which contains the differential expression results from limma, are available from our lab website: http://giladlab.uchicago.edu. The code is available at https://bitbucket.org/jdblischak/tb.
Additional Information
How to cite this article: Blischak, J. D. et al. Mycobacterial infection induces a specific human innate immune response. Sci. Rep. 5, 16882; doi: 10.1038/srep16882 (2015).
Supplementary Material
Acknowledgments
We thank Matthew Stephens and Bryce van de Geijn for advice on the statistical analyses, and all members of the Gilad lab for helpful discussions. This work was supported by grant AI087658 to YG and LT. JDB was partially supported by National Institutes of Health Grant T32 GM007197.
Footnotes
Author Contributions Y.G., L.T. and L.B.B. conceived of the study and designed the experiments. L.T. performed the infection experiments. J.D.B. extracted the RNA and analyzed the data. A.M. prepared the sequencing libraries. L.B.B. and Y.G. supervised the project. J.D.B. and Y.G. wrote the paper with input from all authors.
References
- Hopkins P. A. & Sriskandan S. Mammalian Toll-like receptors: to immunity and beyond. Clinical and experimental immunology 140, 395–407 (2005). [DOI] [PMC free article] [PubMed] [Google Scholar]
- Mogensen T. H. Pathogen recognition and inflammatory signaling in innate immune defenses. Clinical microbiology reviews 22, 240–273, Table of Contents (2009). [DOI] [PMC free article] [PubMed] [Google Scholar]
- Chen G. Y. & Nuñez G. Sterile inflammation: sensing and reacting to damage. Nature reviews. Immunology 10, 826–837 (2010). [DOI] [PMC free article] [PubMed] [Google Scholar]
- Janeway C. A. & Medzhitov R. Innate immune recognition. Annual review of immunology 20, 197–216 (2002). [DOI] [PubMed] [Google Scholar]
- Huang Q. et al. The plasticity of dendritic cell responses to pathogens and their components. Science (New York, N.Y.) 294, 870–875 (2001). [DOI] [PubMed] [Google Scholar]
- Boldrick J. C. et al. Stereotyped and specific gene expression programs in human innate immune responses to bacteria. Proceedings of the National Academy of Sciences of the United States of America 99, 972–7 (2002). [DOI] [PMC free article] [PubMed] [Google Scholar]
- Nau G. J. et al. Human macrophage activation programs induced by bacterial pathogens. Proceedings of the National Academy of Sciences of the United States of America 99, 1503–8 (2002). [DOI] [PMC free article] [PubMed] [Google Scholar]
- Jenner R. G. & Young R. a. Insights into host responses against pathogens from transcriptional profiling. Nature reviews. Microbiology 3, 281–94 (2005). [DOI] [PubMed] [Google Scholar]
- Iwasaki A. & Medzhitov R. Toll-like receptor control of the adaptive immune responses. Nature immunology 5, 987–995 (2004). [DOI] [PubMed] [Google Scholar]
- Kawai T. & Akira S. The roles of TLRs, RLRs and NLRs in pathogen recognition. International Immunology 21, 317–337 (2009). [DOI] [PMC free article] [PubMed] [Google Scholar]
- Amit I. et al. Unbiased reconstruction of a mammalian transcriptional network mediating pathogen responses. Science (New York, N.Y.) 326, 257–63 (2009). [DOI] [PMC free article] [PubMed] [Google Scholar]
- Hornef M. W., Wick M. J., Rhen M. & Normark S. Bacterial strategies for overcoming host innate and adaptive immune responses. Nature immunology 3, 1033–40 (2002). [DOI] [PubMed] [Google Scholar]
- Brodsky I. E. & Medzhitov R. Targeting of immune signalling networks by bacterial pathogens. Nature cell biology 11, 521–6 (2009). [DOI] [PubMed] [Google Scholar]
- Diacovich L. & Gorvel J.-P. Bacterial manipulation of innate immunity to promote infection. Nature reviews. Microbiology 8, 117–28 (2010). [DOI] [PubMed] [Google Scholar]
- Sturgill-Koszycki S. et al. Lack of acidification in Mycobacterium phagosomes produced by exclusion of the vesicular proton-ATPase. Science (New York, N.Y.) 263, 678–681 (1994). [DOI] [PubMed] [Google Scholar]
- Hestvik A. L. K., Hmama Z. & Av-Gay Y. Mycobacterial manipulation of the host cell. FEMS microbiology reviews 29, 1041–50 (2005). [DOI] [PubMed] [Google Scholar]
- VanHeyningen T. K., Collins H. L. & Russell D. G. IL-6 produced by macrophages infected with Mycobacterium species suppresses T cell responses. Journal of immunology (Baltimore, Md.: 1950) 158, 330–337 (1997). [PubMed] [Google Scholar]
- Giacomini E. et al. Infection of human macrophages and dendritic cells with Mycobacterium tuberculosis induces a differential cytokine gene expression that modulates T cell response. Journal of immunology (Baltimore, Md.: 1950) 166, 7033–41 (2001). [DOI] [PubMed] [Google Scholar]
- Stanley S. A. & Cox J. S. Host-pathogen interactions during Mycobacterium tuberculosis infections. Current topics in microbiology and immunology 374, 211–41 (2013). [DOI] [PubMed] [Google Scholar]
- Wel N. van der et al. M. tuberculosis and M. leprae Translocate from the Phagolysosome to the Cytosol in Myeloid Cells. Cell 129, 1287–1298 (2007). [DOI] [PubMed] [Google Scholar]
- Simeone R. et al. Cytosolic access of Mycobacterium tuberculosis: critical impact of phagosomal acidification control and demonstration of occurrence in vivo. PLoS pathogens 11, e1004650 (2015). [DOI] [PMC free article] [PubMed] [Google Scholar]
- Dey B. et al. A bacterial cyclic dinucleotide activates the cytosolic surveillance pathway and mediates innate resistance to tuberculosis. Nature medicine 21, 401–6 (2015). [DOI] [PMC free article] [PubMed] [Google Scholar]
- Collins A. C. et al. Cyclic GMP-AMP Synthase Is an Innate Immune DNA Sensor for Mycobacterium tuberculosis. Cell host & microbe 17, 820–8 (2015). [DOI] [PMC free article] [PubMed] [Google Scholar]
- Watson R. O. et al. The Cytosolic Sensor cGAS Detects Mycobacterium tuberculosis DNA to Induce Type I Interferons and Activate Autophagy. Cell host & microbe 17, 811–9 (2015). [DOI] [PMC free article] [PubMed] [Google Scholar]
- Wassermann R. et al. Mycobacterium tuberculosis Differentially Activates cGAS- and Inflammasome-Dependent Intracellular Immune Responses through ESX-1. Cell host & microbe 17, 799–810 (2015). [DOI] [PubMed] [Google Scholar]
- Stanley S. a., Johndrow J. E., Manzanillo P. & Cox J. S. The Type I IFN response to infection with Mycobacterium tuberculosis requires ESX-1-mediated secretion and contributes to pathogenesis. Journal of immunology (Baltimore, Md.: 1950) 178, 3143–3152 (2007). [DOI] [PubMed] [Google Scholar]
- Watson R. O., Manzanillo P. S. & Cox J. S. Extracellular M. tuberculosis DNA targets bacteria for autophagy by activating the host DNA-sensing pathway. Cell 150, 803–815 (2012). [DOI] [PMC free article] [PubMed] [Google Scholar]
- Wang C. C., Zhu B., Fan X., Gicquel B. & Zhang Y. Systems approach to tuberculosis vaccine development. Respirology (Carlton, Vic.) 18, 412–20 (2013). [DOI] [PubMed] [Google Scholar]
- North R. J. & Jung Y.-J. Immunity to tuberculosis. Annual review of immunology 22, 599–623 (2004). [DOI] [PubMed] [Google Scholar]
- Kallmann F. J. & Reisner D. Twin studies on genetic variations in resistance to tuberculosis. Journal of Heredity 34, 269–276 (1943). [Google Scholar]
- Comstock G. W. Tuberculosis in twins: a re-analysis of the Prophit survey. The American review of respiratory disease 117, 621–624 (1978). [DOI] [PubMed] [Google Scholar]
- Cobat A. et al. High heritability of antimycobacterial immunity in an area of hyperendemicity for tuberculosis disease. The Journal of infectious diseases 201, 15–19 (2010). [DOI] [PubMed] [Google Scholar]
- Möller M. & Hoal E. G. Current findings, challenges and novel approaches in human genetic susceptibility to tuberculosis. Tuberculosis 90, 71–83 (2010). [DOI] [PubMed] [Google Scholar]
- Thye T. et al. Genome-wide association analyses identifies a susceptibility locus for tuberculosis on chromosome 18q11.2. Nature genetics 42, 739–41 (2010). [DOI] [PMC free article] [PubMed] [Google Scholar]
- Yim J.-J. & Selvaraj P. Genetic susceptibility in tuberculosis. Respirology (Carlton, Vic.) 15, 241–56 (2010). [DOI] [PubMed] [Google Scholar]
- Thye T. et al. Common variants at 11p13 are associated with susceptibility to tuberculosis. Nature Publishing Group 44, 257–259 (2012). [DOI] [PMC free article] [PubMed] [Google Scholar]
- Barreiro L. B. et al. Deciphering the genetic architecture of variation in the immune response to Mycobacterium tuberculosis infection. Proceedings of the National Academy of Sciences of the United States of America 109, 1204–9 (2012). [DOI] [PMC free article] [PubMed] [Google Scholar]
- Rivero-Lezcano O. M. In vitro infection of human cells with Mycobacterium tuberculosis. Tuberculosis (Edinburgh, Scotland) 1–7, 10.1016/j.tube.2012.09.002 (2012). [DOI] [PubMed] [Google Scholar]
- Alonso H. et al. Deciphering the role of IS6110 in a highly transmissible Mycobacterium tuberculosis Beijing strain, GC1237. Tuberculosis (Edinburgh, Scotland) 91, 117–26 (2011). [DOI] [PubMed] [Google Scholar]
- Liao Y., Smyth G. K. & Shi W. The Subread aligner: fast, accurate and scalable read mapping by seed-and-vote. Nucleic acids research 41, e108 (2013). [DOI] [PMC free article] [PubMed] [Google Scholar]
- Robinson M. D. & Oshlack A. A scaling normalization method for differential expression analysis of RNA-seq data. Genome biology 11, R25 (2010). [DOI] [PMC free article] [PubMed] [Google Scholar]
- Smyth G. K. Linear models and empirical bayes methods for assessing differential expression in microarray experiments. Statistical applications in genetics and molecular biology 3, Article3 (2004). [DOI] [PubMed] [Google Scholar]
- Smyth G. K., Michaud J. & Scott H. S. Use of within-array replicate spots for assessing differential expression in microarray experiments. Bioinformatics (Oxford, England) 21, 2067–75 (2005). [DOI] [PubMed] [Google Scholar]
- Law C. W., Chen Y., Shi W. & Smyth G. K. Voom: precision weights unlock linear model analysis tools for RNA-seq read counts. Genome biology 15, R29 (2014). [DOI] [PMC free article] [PubMed] [Google Scholar]
- Wei Y., Tenzen T. & Ji H. Joint analysis of differential gene expression in multiple studies using correlation motifs. Biostatistics (Oxford, England) 16, 31–46 (2015). [DOI] [PMC free article] [PubMed] [Google Scholar]
- Pavlidis P., Jensen J. D., Stephan W. & Stamatakis A. A critical assessment of storytelling: Gene ontology categories and the importance of validating genomic scans. Molecular Biology and Evolution 29, 3237–3248 (2012). [DOI] [PubMed] [Google Scholar]
- Vergne I., Chua J., Singh S. B. & Deretic V. Cell biology of mycobacterium tuberculosis phagosome. Annual review of cell and developmental biology 20, 367–394 (2004). [DOI] [PubMed] [Google Scholar]
- Mortellaro A., Robinson L. & Paola R. C. Spotlight on mycobacteria and dendritic cells: will novel targets to fight tuberculosis emerge? EMBO Molecular Medicine 1, 19–29 (2009). [DOI] [PMC free article] [PubMed] [Google Scholar]
- Roberts E. a., Chua J., Kyei G. B. & Deretic V. Higher order Rab programming in phagolysosome biogenesis. Journal of Cell Biology 174, 923–929 (2006). [DOI] [PMC free article] [PubMed] [Google Scholar]
- Ehrt S. et al. Reprogramming of the macrophage transcriptome in response to interferon-gamma and Mycobacterium tuberculosis: signaling roles of nitric oxide synthase-2 and phagocyte oxidase. The Journal of experimental medicine 194, 1123–1140 (2001). [DOI] [PMC free article] [PubMed] [Google Scholar]
- Myers J. T., Tsang A. W. & Swanson J. a. Localized reactive oxygen and nitrogen intermediates inhibit escape of Listeria monocytogenes from vacuoles in activated macrophages. Journal of immunology (Baltimore, Md.: 1950) 171, 5447–5453 (2003). [DOI] [PMC free article] [PubMed] [Google Scholar]
- Babior B. M. NADPH oxidase. Current Opinion in Immunology 16, 42–47 (2004). [DOI] [PubMed] [Google Scholar]
- Bustamante J. et al. Germline CYBB mutations that selectively affect macrophages in kindreds with X-linked predisposition to tuberculous mycobacterial disease. Nature immunology 12, 213–221 (2011). [DOI] [PMC free article] [PubMed] [Google Scholar]
- Kim B.-H. et al. A family of IFN-gamma-inducible 65-kD GTPases protects against bacterial infection. Science (New York, N.Y.) 332, 717–721 (2011). [DOI] [PubMed] [Google Scholar]
- Deffert C., Cachat J. & Krause K.-H. Phagocyte NADPH oxidase, chronic granulomatous disease and mycobacterial infections. Cellular microbiology 16, 1–27 (2014). [DOI] [PubMed] [Google Scholar]
- Deffert C. et al. Bacillus calmette-guerin infection in NADPH oxidase deficiency: defective mycobacterial sequestration and granuloma formation. PLoS pathogens 10, e1004325 (2014). [DOI] [PMC free article] [PubMed] [Google Scholar]
- Zodpey S. P. & Shrikhande S. N. The geographic location (latitude) of studies evaluating protective effect of BCG vaccine and it’s efficacy/effectiveness against tuberculosis. Indian journal of public health 51, 205–210 (2007). [PubMed] [Google Scholar]
- Nnoaham K. E. & Clarke A. Low serum vitamin D levels and tuberculosis: A systematic review and meta-analysis. International Journal of Epidemiology 37, 113–119 (2008). [DOI] [PubMed] [Google Scholar]
- Martineau A. R. et al. A single dose of vitamin D enhances immunity to mycobacteria. American Journal of Respiratory and Critical Care Medicine 176, 208–213 (2007). [DOI] [PubMed] [Google Scholar]
- Lucas R. M., Gorman S., Geldenhuys S. & Hart P. H. Vitamin D and immunity. F1000prime reports 6, 118 (2014). [DOI] [PMC free article] [PubMed] [Google Scholar]
- Xia J., Shi L., Zhao L. & Xu F. Impact of vitamin D supplementation on the outcome of tuberculosis treatment: a systematic review and meta-analysis of randomized controlled trials. Chinese medical journal 127, 3127–3134 (2014). [PubMed] [Google Scholar]
- Kearns M. D., Alvarez J. A., Seidel N. & Tangpricha V. Impact of vitamin D on infectious disease. The American journal of the medical sciences 349, 245–62 (2015). [DOI] [PMC free article] [PubMed] [Google Scholar]
- Liu P. T. et al. Toll-like receptor triggering of a vitamin D-mediated human antimicrobial response. Science (New York, N.Y.) 311, 1770–1773 (2006). [DOI] [PubMed] [Google Scholar]
- Verway M. et al. Vitamin D Induces Interleukin-1β Expression: Paracrine Macrophage Epithelial Signaling Controls M. tuberculosis Infection. PLoS Pathogens 9, (2013). [DOI] [PMC free article] [PubMed] [Google Scholar]
- Xu G., Wang J., Gao G. F. & Liu C. H. Insights into battles between Mycobacterium tuberculosis and macrophages. Protein & Cell 5, 728–736 (2014). [DOI] [PMC free article] [PubMed] [Google Scholar]
- Hewison M. Antibacterial effects of vitamin D. Nature reviews. Endocrinology 7, 337–345 (2011). [DOI] [PubMed] [Google Scholar]
- Maier C. J. et al. PIM-1 kinase interacts with the DNA binding domain of the vitamin D receptor: a further kinase implicated in 1,25-(OH)2D3 signaling. BMC Molecular Biology 13, 18 (2012). [DOI] [PMC free article] [PubMed] [Google Scholar]
- Jacobsen M. et al. Suppressor of cytokine signaling-3 is affected in T-cells from tuberculosis TB patients. Clinical Microbiology and Infection 17, 1323–1331 (2011). [DOI] [PubMed] [Google Scholar]
- Gysemans C. A. et al. 1,25-Dihydroxyvitamin D3 modulates expression of chemokines and cytokines in pancreatic islets: implications for prevention of diabetes in nonobese diabetic mice. Endocrinology 146, 1956–64 (2005). [DOI] [PubMed] [Google Scholar]
- Adorini L. Intervention in autoimmunity: the potential of vitamin D receptor agonists. Cellular immunology 233, 115–24 (2005). [DOI] [PubMed] [Google Scholar]
- Scolletta S., Colletti M., Di Luigi L. & Crescioli C. Vitamin D receptor agonists target CXCL10: New therapeutic tools for resolution of inflammation. Mediators of Inflammation 2013, (2013). [DOI] [PMC free article] [PubMed] [Google Scholar]
- Coussens A. K. et al. Vitamin D accelerates resolution of inflammatory responses during tuberculosis treatment. Proceedings of the National Academy of Sciences of the United States of America 109, 15449–54 (2012). [DOI] [PMC free article] [PubMed] [Google Scholar]
- Zhu X. W. & Friedland J. S. Multinucleate giant cells and the control of chemokine secretion in response to Mycobacterium tuberculosis. Clinical immunology (Orlando, Fla.) 120, 10–20 (2006). [DOI] [PubMed] [Google Scholar]
- Tang N. L. S. et al. Genetic association between a chemokine gene CXCL-10 (IP-10, interferon gamma inducible protein 10) and susceptibility to tuberculosis. Clinica Chimica Acta 406, 98–102 (2009). [DOI] [PMC free article] [PubMed] [Google Scholar]
- Azad A. K., Sadee W. & Schlesinger L. S. Innate immune gene polymorphisms in tuberculosis. Infection and Immunity 80, 3343–3359 (2012). [DOI] [PMC free article] [PubMed] [Google Scholar]
- Miller M. D. & Krangel M. S. The human cytokine I-309 is a monocyte chemoattractant. Proceedings of the National Academy of Sciences of the United States of America 89, 2950–4 (1992). [DOI] [PMC free article] [PubMed] [Google Scholar]
- Thuong N. T. T. et al. Identification of tuberculosis susceptibility genes with human macrophage gene expression profiles. PLoS pathogens 4, e1000229 (2008). [DOI] [PMC free article] [PubMed] [Google Scholar]
- Tang N. L. S., Chan C. Y., Leung C. C., Tam C. M. & Blackwell J. Tuberculosis susceptibility genes in the chemokine cluster region of chromosome 17 in Hong Kong Chinese. Hong Kong medical journal = Xianggang yi xue za zhi/Hong Kong Academy of Medicine 17 Suppl 6, 22–5 (2011). [PubMed] [Google Scholar]
- Özdemir F. A. et al. [Investigation of CCL1 rs159294 T/A gene polymorphism in pulmonary and extrapulmonary tuberculosis patients]. Tüberküloz ve toraks 61, 200–8 (2013). [DOI] [PubMed] [Google Scholar]
- Jayaswal S. et al. Identification of host-dependent survival factors for intracellular Mycobacterium tuberculosis through an siRNA screen. PLoS pathogens 6, e1000839 (2010). [DOI] [PMC free article] [PubMed] [Google Scholar]
- Gagneux S. et al. Variable host-pathogen compatibility in Mycobacterium tuberculosis. Proceedings of the National Academy of Sciences of the United States of America 103, 2869–2873 (2006). [DOI] [PMC free article] [PubMed] [Google Scholar]
- Comas I. & Gagneux S. The past and future of tuberculosis research. PLoS pathogens 5, e1000600 (2009). [DOI] [PMC free article] [PubMed] [Google Scholar]
- Li Q. et al. Differences in rate and variability of intracellular growth of a panel of Mycobacterium tuberculosis clinical isolates within a human monocyte model. Infection and immunity 70, 6489–93 (2002). [DOI] [PMC free article] [PubMed] [Google Scholar]
- Homolka S., Niemann S., Russell D. G. & Rohde K. H. Functional genetic diversity among Mycobacterium tuberculosis complex clinical isolates: delineation of conserved core and lineage-specific transcriptomes during intracellular survival. PLoS pathogens 6, e1000988 (2010). [DOI] [PMC free article] [PubMed] [Google Scholar]
- Rose G. et al. Mapping of genotype-phenotype diversity among clinical isolates of Mycobacterium tuberculosis by sequence-based transcriptional profiling. Genome Biology and Evolution 5, 1849–1862 (2013). [DOI] [PMC free article] [PubMed] [Google Scholar]
- Krishnan N. et al. Mycobacterium tuberculosis lineage influences innate immune response and virulence and is associated with distinct cell envelope lipid profiles. PloS one 6, e23870 (2011). [DOI] [PMC free article] [PubMed] [Google Scholar]
- Coscolla M. & Gagneux S. Does M. tuberculosis genomic diversity explain disease diversity? Drug discovery today. Disease mechanisms 7, e43–e59 (2010). [DOI] [PMC free article] [PubMed] [Google Scholar]
- Manca C. et al. Virulence of a Mycobacterium tuberculosis clinical isolate in mice is determined by failure to induce Th1 type immunity and is associated with induction of IFN-alpha/beta. Proceedings of the National Academy of Sciences of the United States of America 98, 5752–7 (2001). [DOI] [PMC free article] [PubMed] [Google Scholar]
- Manca C. et al. Differential monocyte activation underlies strain-specific Mycobacterium tuberculosis pathogenesis. Infection and immunity 72, 5511–4 (2004). [DOI] [PMC free article] [PubMed] [Google Scholar]
- Reed M. B. et al. A glycolipid of hypervirulent tuberculosis strains that inhibits the innate immune response. Nature 431, 84–7 (2004). [DOI] [PubMed] [Google Scholar]
- Tanveer M., Hasan Z., Kanji A., Hussain R. & Hasan R. Reduced TNF-alpha and IFN-gamma responses to Central Asian strain 1 and Beijing isolates of Mycobacterium tuberculosis in comparison with H37Rv strain. Transactions of the Royal Society of Tropical Medicine and Hygiene 103, 581–7 (2009). [DOI] [PubMed] [Google Scholar]
- Wang C. et al. Innate immune response to Mycobacterium tuberculosis Beijing and other genotypes. PloS one 5, e13594 (2010). [DOI] [PMC free article] [PubMed] [Google Scholar]
- Chacón-Salinas R. et al. Differential pattern of cytokine expression by macrophages infected in vitro with different Mycobacterium tuberculosis genotypes. Clinical and experimental immunology 140, 443–9 (2005). [DOI] [PMC free article] [PubMed] [Google Scholar]
- Rocha-Ramírez L. M. et al. Mycobacterium tuberculosis lipids regulate cytokines, TLR-2/4 and MHC class II expression in human macrophages. Tuberculosis (Edinburgh, Scotland) 88, 212–20 (2008). [DOI] [PubMed] [Google Scholar]
- Koo M.-S., Subbian S. & Kaplan G. Strain specific transcriptional response in Mycobacterium tuberculosis infected macrophages. Cell communication and signaling: CCS 10, 2 (2012). [DOI] [PMC free article] [PubMed] [Google Scholar]
- Wu K. et al. An interferon-related signature in the transcriptional core response of human macrophages to Mycobacterium tuberculosis infection. PloS one 7, e38367 (2012). [DOI] [PMC free article] [PubMed] [Google Scholar]
- Dormans J. et al. Correlation of virulence, lung pathology, bacterial load and delayed type hypersensitivity responses after infection with different Mycobacterium tuberculosis genotypes in a BALB/c mouse model. Clinical and experimental immunology 137, 460–8 (2004). [DOI] [PMC free article] [PubMed] [Google Scholar]
- Sinsimer D. et al. The phenolic glycolipid of Mycobacterium tuberculosis differentially modulates the early host cytokine response but does not in itself confer hypervirulence. Infection and Immunity 76, 3027–3036 (2008). [DOI] [PMC free article] [PubMed] [Google Scholar]
- Ioerger T. R. et al. Variation among genome sequences of H37Rv strains of Mycobacterium tuberculosis from multiple laboratories. Journal of bacteriology 192, 3645–53 (2010). [DOI] [PMC free article] [PubMed] [Google Scholar]
- Behr M. A. et al. Comparative genomics of BCG vaccines by whole-genome DNA microarray. Science (New York, N.Y.) 284, 1520–1523 (1999). [DOI] [PubMed] [Google Scholar]
- Pym A. S., Brodin P., Brosch R., Huerre M. & Cole S. T. Loss of RD1 contributed to the attenuation of the live tuberculosis vaccines Mycobacterium bovis BCG and Mycobacterium microti. Molecular Microbiology 46, 709–717 (2002). [DOI] [PubMed] [Google Scholar]
- Hsu T. et al. The primary mechanism of attenuation of bacillus Calmette-Guerin is a loss of secreted lytic function required for invasion of lung interstitial tissue. Proceedings of the National Academy of Sciences of the United States of America 100, 12420–12425 (2003). [DOI] [PMC free article] [PubMed] [Google Scholar]
- Simeone R., Bottai D. & Brosch R. ESX/type VII secretion systems and their role in host-pathogen interaction. Current Opinion in Microbiology 12, 4–10 (2009). [DOI] [PubMed] [Google Scholar]
- Wolfert M. A. & Boons G.-J. Adaptive immune activation: glycosylation does matter. Nature chemical biology 9, 776–84 (2013). [DOI] [PMC free article] [PubMed] [Google Scholar]
- Johnson J. L., Jones M. B., Ryan S. O. & Cobb B. A. The regulatory power of glycans and their binding partners in immunity. Trends in Immunology 34, 290–298 (2013). [DOI] [PMC free article] [PubMed] [Google Scholar]
- Crespo H. J., Lau J. T. Y. & Videira P. A. Dendritic cells: A spot on sialic acid. Frontiers in Immunology 4, 1–15 (2013). [DOI] [PMC free article] [PubMed] [Google Scholar]
- Tailleux L. et al. Constrained intracellular survival of Mycobacterium tuberculosis in human dendritic cells. Journal of immunology (Baltimore, Md.: 1950) 170, 1939–48 (2003). [DOI] [PubMed] [Google Scholar]
- Tailleux L. et al. Probing host pathogen cross-talk by transcriptional profiling of both Mycobacterium tuberculosis and infected human dendritic cells and macrophages. PloS one 3, e1403 (2008). [DOI] [PMC free article] [PubMed] [Google Scholar]
- Auer P. L. & Doerge R. W. Statistical design and analysis of RNA sequencing data. Genetics 185, 405–16 (2010). [DOI] [PMC free article] [PubMed] [Google Scholar]
- Liao Y., Smyth G. K. & Shi W. featureCounts: an efficient general-purpose program for assigning sequence reads to genomic features. Bioinformatics (Oxford, England) 1–8, 10.1093/bioinformatics/btt656 (2013). [DOI] [PubMed] [Google Scholar]
- Ritchie M. E. et al. limma powers differential expression analyses for RNA-sequencing and microarray studies. Nucleic acids research 1–13, 10.1093/nar/gkv007 (2015). [DOI] [PMC free article] [PubMed] [Google Scholar]
- Rapaport F. et al. Comprehensive evaluation of differential gene expression analysis methods for RNA-seq data. Genome biology 14, R95 (2013). [DOI] [PMC free article] [PubMed] [Google Scholar]
- Soneson C. & Delorenzi M. A comparison of methods for differential expression analysis of RNA-seq data. BMC bioinformatics 14, 91 (2013). [DOI] [PMC free article] [PubMed] [Google Scholar]
- Benjamini Y. & Hochberg Y. Controlling the False Discovery Rate: A Practical and Powerful Approach to Multiple Testing. Journal of the Royal Statistical Society. Series B (Methodological) 57, pp. 289–300 (1995). [Google Scholar]
- Alexa A., Rahnenführer J. & Lengauer T. Improved scoring of functional groups from gene expression data by decorrelating GO graph structure. Bioinformatics (Oxford, England) 22, 1600–7 (2006). [DOI] [PubMed] [Google Scholar]
- Edgar R., Domrachev M. & Lash A. E. Gene Expression Omnibus: NCBI gene expression and hybridization array data repository. Nucleic acids research 30, 207–210 (2002). [DOI] [PMC free article] [PubMed] [Google Scholar]
- Hett E. C. & Rubin E. J. Bacterial growth and cell division: a mycobacterial perspective. Microbiology and molecular biology reviews: MMBR 72, 126–56 (2008). [DOI] [PMC free article] [PubMed] [Google Scholar]
Associated Data
This section collects any data citations, data availability statements, or supplementary materials included in this article.
Supplementary Materials
Data Availability Statement
The data have been deposited in NCBI's Gene Expression Omnibus116 and are accessible through GEO Series accession number GSE67427 (http://www.ncbi.nlm.nih.gov/geo/query/acc.cgi?acc=GSE67427). Supplementary Table S1, which contains the gene expression data, and Supplementary Table S2, which contains the differential expression results from limma, are available from our lab website: http://giladlab.uchicago.edu. The code is available at https://bitbucket.org/jdblischak/tb.