

Abstract
Background
A shared decision-making tool could help elderly advanced chronic kidney disease (CKD) patients decide about initiating dialysis. Since mortality may be high in the first few months after initiating dialysis, incorporating early mortality predictors in such a tool would be important for an informed decision. Our objective is to derive and validate a predictive risk score for early mortality after initiating dialysis.
Study Design
Retrospective observational cohort, with development and validation cohorts.
Setting & Participants
US Renal Data System (USRDS) and claims data from the Centers for Medicare & Medicaid Services for 69,441 (aged ≥67 years) end-stage renal disease (ESRD) patients with previous 2-year Medicare history who initiated dialysis January 1, 2009–December 31, 2010.
Candidate Predictors
Demographics, predialysis care, laboratory data, functional limitations and medical history.
Outcomes
All-cause mortality in the first 3 and 6 months.
Analytical Approach
Predicted mortality via logistic regression.
Results
The simple risk score (total score, 0–9) included age (0–3 points); low albumin, assistance with daily living, nursing home residence, cancer, heart failure, and hospitalization (1 point each), and showed area under the receiver operating characteristic curve (AUROC) =0.69 in the validation sample. A comprehensive risk score with additional predictors was also developed (with AUROC=0.72, high concordance between predicted vs. observed risk). Mortality probabilities were estimated from these models: the median score of 3 indicating 12% risk in 3 months and 20% in 6 months, and the highest scores (≥8) indicating 39% risk in 3 months and 55% in 6 months.
Limitations
Patients who did not choose dialysis and who did not have 2 year Medicare history were excluded.
Conclusions
Routinely available information can be used by CKD patients, families and their nephrologists to estimate risk of early mortality after dialysis initiation, which may facilitate informed decision-making regarding treatment options.
Keywords: end-stage renal disease (ESRD), chronic kidney failure, dialysis initation, conservative care, predictive model, mortality, dialysis initiation, risk score, shared decision-making, treatment decisions, quality of life, Choosing Wisely
Chronic kidney disease (CKD) patients are initiating maintenance dialysis at more advanced ages with a higher prevalence of comorbid conditions increasing their risk of poor outcomes.1 Elderly CKD patients are the fastest growing segment of the incident ESRD population; from 1996 to 2003, the age-adjusted rate of hemodialysis increased 57% for octogenarians and nonagenarians2 (the highest rate of increase among all groups). The burdens and risks of dialysis therapy might be higher in the elderly.3,4 High rates of ‘early mortality’ among dialysis patients – especially among the elderly – have received increased attention.5 Physician and patient groups have called for a better approach to facilitate shared decision-making to determine if dialysis should be initiated.
Recently, in Choosing Wisely, physician specialists identified 5 areas most important for quality care, safety, and reduction of unnecessary services; nephrologists advised not initiating maintenance dialysis “without ensuring a shared decision-making process between patients, their families and their physicians,” given that “data suggest that survival might not differ substantially for older adults with a high burden of comorbidity who initiate chronic dialysis versus those managed conservatively instead.”6 According to the National Kidney Foundation (NKF), conservative therapy is defined as care for chronic kidney failure patients “without dialysis or transplantation.” The Renal Physicians Association echoed this sentiment by publishing a guideline calling for shared decision-making regarding dialysis initiation.7 The NKF has also called for development of a predictive clinical tool to better assess risk in patients with CKD.8
Tools to help patients decide whether to initiate dialysis are needed. Mortality risk expected for patients like me is an important component in decisions on whether to initiate dialysis or choose conservative care. The objective of this study was to develop and validate a simple predictive risk score (PRS) that uses readily available, objective pre-ESRD variables to estimate the risk of early death after dialysis initiation to facilitate shared decision-making on appropriate treatment decisions among elderly patients, their families and their physicians.9,10,11,12
METHODS
Study Population, Setting, and Design
This study used a large, national administrative database, the US Renal Data System (USRDS) that contains a near universe of elderly Medicare-entitled dialysis patients in the United States (~97%).13 Using the most recent data available to researchers, we identified all elderly patients incident to dialysis in 2009–2010. To create a continuum of care for patients transitioning from late-stage CKD to maintenance dialysis, we linked USRDS data with 2 years of pre-ESRD Medicare claims to obtain co-morbid information, severity of illness, health resource utilization, and nephrology care prior to ESRD. The USRDS data provided laboratory data, functional status, alcohol and drug dependency, institutionalization, and dialysis-related information (e.g., primary cause of ESRD, modality, and vascular access used at the time of dialysis initiation). Using patient zip codes, the 2011 American Community Survey (conducted as part of the larger US Census) provided ecologic socioeconomic and urbanicity data.
Specifically, 98,678 patients aged 67 years and older initiated hemodialysis or peritoneal dialysis in the 2-year period January 1, 2009–December 31, 2010. Of these, 22,936 were excluded due to missing Medicare claims history (the majority were Medicare HMO patients whose claims were not available in administrative databases). Another 6,301 were excluded due to one or more missing laboratory values, although we allowed for missing hemoglobin and albumin values. A total of 69,441 patients were included in the analyses (Figure 1). Follow up started from the first date of dialysis initiation to 3 months (primary end point) and 6 months (secondary end points). The study was approved by the Essex Institutional Review Board.
Figure 1.

Flowchart for selection of study population and development and validation cohorts. ESRD indicates end-stage renal disease.
End Points and Risk Factor Predictors
All cause mortality within the first 3 months following ESRD enrollment was the primary end point. It was selected a priori because there is a sharp peak in early mortality among patients aged 65 years and older.1 We selected mortality within the first 6 months as the secondary end point, because it is the time requirement for hospice eligibility and was used in two extant similar risk models.14,15 The date of death was obtained from a cross-match with the ESRD death file.
Variables were chosen as potential predictors of mortality as well as descriptors of patient, environment, and pre-ESRD care based on the literature, 16,17,18,19,20,21,22,23,24,25,26 including age, sex, race, and socioeconomic status. Comorbidities (e.g., cancer, lung disease, peripheral vascular disease, diabetes, cerebrovascular disease, AIDS, chronic liver disease, depression, and dementia) were identified using ICD-9 codes as a primary or secondary cause of hospitalization or 2 outpatient diagnoses, and cardiac events (e.g., stroke, MI, and CHF) and hospitalizations (number and duration) were identified in the year and 6 months prior to dialysis, respectively. The Charlson comorbidity index27 was calculated based on patients’ comorbidities. We created a composite variable for assistance with daily living (defined as needs assistance with daily living, inability to ambulate, or has an amputation), and institutionalization (defined as nursing home, assisted living or other). Variables related to renal care included involvement and timing of nephrologist care prior to ESRD, vascular access placement (graft/fistula vs. catheter), and laboratory data at dialysis initiation (e.g., serum albumin, serum creatinine, eGFR, and hemoglobin).
Statistical Analysis
Patient characteristics at initiation of dialysis were summarized by standard descriptive statistics. We divided the study cohort into two non-overlapping subcohorts—a development cohort (first 18 months) and a validation cohort (last 6 months)—and applied the same set of inclusion/exclusion criteria.
Derivation of Predictive Risk Scores
We aimed to develop two models, where one is a comprehensive model and another is a simple PRS. In practice, either or both models can be used depending on data availability, desired accuracy and purpose. In the first step, all factors listed in Table 1 were included as candidate predictors for the end point of 3 month mortality in the logistic regression, and backward elimination was employed to reach the final comprehensive risk score.28,29 In this process, we were guided by subject matter knowledge and context-based appropriateness combined with statistical criteria (e.g., odds ratio [OR] and p-value). Specifically, we used some variables for describing cohorts but not in prediction modeling, for example, community-level factors, and we selected one variable among highly correlated predictors (e.g., serum creatinine and eGFR). After finalizing the comprehensive risk model, we further reviewed/screened each predictor, categorized the continuous predictors (e.g., age) with intuitive or accepted cutpoints, and assigned the final scores with the goal of developing a simple PRS that can be implemented using pencil and paper, without need of a calculator.
Table 1.
Characteristics of patients by mortality status: development cohort
| Factor | Did not die within 3 mo (N=46,319) | Died within 3 mo (N=6,477) |
|---|---|---|
| Age (y) | 76.7 (6.5) [71–81] | 78.7 (6.7) [73–84] |
| Female sex | 46.4 | 44.5 |
| Race | ||
| White | 74.6 | 80.9 |
| Black | 20.5 | 16.2 |
| Other | 5.0 | 2.9 |
| Hispanic ethnicity | 8.4 | 6.4 |
| Urban, vs rural | 83.2 | 83.0 |
| Dialysis modality: hemodialysis | 95.4 | 98.5 |
| Access at first dialysis: catheter only | 58.1 | 78.1 |
| Time between first nephrologist evaluation and dialysis initiation | ||
| NA** | 16.9 | 18.3 |
| >0 to ≤4 mo | 21.0 | 30.4 |
| >4 to ≤12 mo | 12.9 | 13.1 |
| >12 to 24 mo | 49.3 | 38.1 |
| BMI (kg/m2) | 28.1 (6.9) [23.3–31.5] | 27.5 (7.2) [22.6–30.8] |
| Albumin (g/dl)* | 3.2 (0.65) [2.8–3.6] | 2.9 (0.66) [2.5–3.4] |
| Hemoglobin (g/dl)* | 10.0 (1.5) [9.0–10.9] | 10.0 (1.5) [9.0–10.9] |
| Creatinine (mg/dl) | 5.3 (2.3) [3.8–6.3] | 5.0 (2.3) [3.4–5.9] |
| eGFR (ml/min/1.73 m2) | 12.0 (5.0) [8.5–14.7] | 13.2 (5.7) [9.0–16.6] |
| Current smoker | 3.5 | 3.4 |
| Alcohol problem | 4.5 | 8.2 |
| Drug dependence | 0.1 | 0.1 |
| Need assistance with daily living | 19.2 | 34.3 |
| Institutionalized | 10.4 | 24.4 |
| Cancer | 13.3 | 19.5 |
| COPD | 27.0 | 35.5 |
| PVD | 26.7 | 33.7 |
| Diabetes | 58.8 | 55.7 |
| Depression | 9.7 | 12.1 |
| Dementia | 5.6 | 8.0 |
| Congestive heart failure | 50.8 | 64.4 |
| Coronary heart disease | 50.6 | 59.2 |
| Stroke | 16.5 | 19.9 |
| AIDS | 0.1 | 0.1 |
| Charlson comorbidity index score | 7.6 (3.5) [5–10] | 8.5 (3.6) [6–11] |
| No. of hospitalization | 0.9 (1.3) [0–1] | 1.3 (1.5) [0–2] |
| Total hospital days | 7.5 (13.1) [0–10] | 12.4 (17.8) [0–17] |
| No. of ER visits | 1.3 (1.7) [0–2] | 1.8 (1.9) [0–3] |
Note: Values for categorical variables are given as percentages; values for continuous variables, as mean ± standard deviation [interquartile range]. Conversion factor for serum creatinine in mg/dL to μmol/L, ×88.4.
BMI, body mass index; COPD, chronic obstructive pulmonary disease; eGFR, estimated glomerular filtration rate; ER, emergency room; PVD, peripheral vascular disease; NA, not applicable
About 75% and 91% patients had complete data on albumin and hemoglobin for patients who did not die within 3 months. Corresponding proportions are 73% and 91% for those who died within 3 months. Summary statistics were virtually unchanged without or with imputation (e.g., 2nd decimals differ). All other variables are complete. Health resource utilization (hospitalizations and ER visits) based on 6 months prior to dialysis initiation.
Patient never saw a nephrologist prior to dialysis initiation.
Validation and Comparison of Risk Scores
We estimated the probability of mortality for different risk groups. We computed sensitivity, specificity and predictive values for different cutpoints that may guide risk stratification. We further compared our models with two existing registry-based models (i.e., Couchoud et al. model,14 subsequently referred to as the ‘French’ model derived from a national French database (Renal Epidemiology and Information Network [REIN]), and Wagner et al.,30 subsequently referred to as the UK model derived from a nationwide multicenter cohort study in the United Kingdom [UK Renal Registry]) via area under receiver operator characteristic curve (AUROC) and Akaike information criterion.31,32 Finally, we examined model calibration by comparing expected vs. observed risks in different risk groups defined by risk-deciles. Note that some analyses were conducted in the development cohort as well as validation cohort to check the consistency of the performance.
Secondary and Sensitivity Analyses
In the primary analyses, we imputed the missing albumin data, given its prognostic importance using single imputation by EM algorithm via MI procedure in SAS. In the secondary/sensitivity analysis, we repeated the analysis without imputation and with different imputation runs. In the comparison of the different risk scores, variables included are not identical across the different models and not always available so we implemented different scenarios for checking robustness, e.g., using a proxy that closely – or favorably – matches the numerical performance reported by the authors. We also fitted the final models with the secondary end point of 6 month mortality and evaluated the model discrimination and calibration. All the statistical analyses were carried out by SAS 9.3 (SAS Institute Inc, Cary, NC). Finally, we used the recently published TRIPOD (Transparent Reporting of a Multivariable Prediction Model for Individual Prognosis or Diagnosis) recommendations for ideal reporting of the development and validation of our risk score.33
RESULTS
Cohort Description
The final development and validation cohorts included 52,796 and 16,645 patients, respectively (Table S1, available as online supplementary material). Patients in the development and validation cohorts were similar in demographics, clinical characteristics and laboratory values, comorbidities, health resource utilization and mortality. Baseline characteristics of patients in the development cohort were further disaggregated by mortality status (Table 1). Compared with patients who did not die in the first 3 months, patients who died were more likely to be older, male, or white; to have initiated hemodialysis with a catheter only; to have never or more recently seen a nephrologist; to have had alcohol problems; to have needed assistance with daily living; to have been institutionalized; to have had lower albumin; to have had cancer, COPD, peripheral vascular disease, depression, dementia, congestive heart failure, or coronary heart disease; to have had a higher Charlson co-morbidity index score; and to have higher health resource utilization.
Predictive Risk Scores
In the comprehensive model, multiple regression analysis identified 14 predictors of mortality; in the simple risk score, 7 variables were chosen (Table 2). Despite their relatively large ORs, catheter use was excluded to allow patients with late-stage CKD without a vascular access to use the risk score, and alcohol problems were excluded because of stigma associated with reporting/disclosure.34 The ORs, 95% confidence intervals (CIs) and p-value for predictors were computed (Table 2). Table S2 shows the comprehensive risk score in Table 2 excluding patients with missing albumin to demonstrate the potential impact of missing data and the robustness of the model.
Table 2.
Multiple regression for comprehensive and simple models for 3–month mortality: development cohort
| Predictor | Comprehensive model | Simple model |
|---|---|---|
|
| ||
| Age, per 1-y older | 1.04 (1.03–1.04) | |
|
| ||
| Age category | ||
| 70–74 y | 1.27 (1.15–1.41) | |
| 75–79 y | 1.49 (1.35–1.64) | |
| 80–84 y | 1.74 (1.58–1.92) | |
| 85–89 y | 2.09 (1.87–2.32) | |
| ≥90 y | 2.84 (2.45–3.29) | |
|
| ||
| Male sex | 1.18 (1.12–1.25) | |
|
| ||
| White race | 1.32 (1.23–1.41) | |
|
| ||
| Catheter user | 1.84 (1.73–1.97) | |
|
| ||
| No or late nephrology care before dialysis: <=4 mo in care | 1.29 (1.22–1.37) | |
|
| ||
| Albumin, per 1-g/dl greater | 0.75 (0.72–0.79) | |
|
| ||
| Albumin | ||
| <3.5 g/dl | 1.75 (1.62–1.88) | |
| Unavailable | 1.71 (1.57–1.85) | |
|
| ||
| Serum Creatinine, per 1-mg/dl greater | 0.97 (0.96–0.98) | |
|
| ||
| Needs assistance in daily living or walking | 1.43 (1.34–1.53) | 1.47 (1.38–1.57) |
|
| ||
| Living in nursing home | 1.80 (1.67–1.94) | 1.96 (1.82–2.11) |
|
| ||
| Cancer | 1.48 (1.38–1.59) | 1.56 (1.46–1.68) |
|
| ||
| Peripheral vascular disease | 1.14 (1.07–1.21) | |
|
| ||
| Alcohol problem | 1.66 (1.49–1.84) | |
|
| ||
| Congestive heart failure | 1.33 (1.25–1.41) | 1.41 (1.33–1.50) |
|
| ||
| No. of hospitalizations in 6 mo before dialysis | 1.10 (1.07–1.12) | 1.40 (1.32–1.48) |
|
| ||
| Intercept | −5.10 | −3.40 |
Note: Values shown are OR (95% CI) unless otherwise indicated. n=52,796. Missing data for albumin were imputed by proc MI in SAS for the comprehensive model. For the model fitted without imputation, see Table S2. All p-values are <0.0001. A Simple risk score (in Table 3) was derived from the Simple model.
OR: odds ratio; CI: confidence interval.
The integer scores assigned to each of the final predictors in the simple PRS reflect the magnitude of the OR provided in Tables 2, and serves as a sample risk assessment questionnaire and risk estimate table for use by clinicians and patients (Tables 3 and 4). Given a total score of 0–9, the variables used to predict early mortality include age (0 to 3 points) and low or unknown albumin, assistance with daily living, nursing home residence, cancer, heart failure, and hospitalization (1 point each). A patient’s expected mortality probability can be derived from this PRS (e.g., a score of 0 indicates a 2% probability of mortality in 3 months while a score of 7 indicates a 34% probability). The median score of 3 indicates 12% probability of mortality in 3 months and 20% in 6 months, and the highest scores (≥8) indicate 39% mortality in 3 months and 55% in 6 months.
Table 3.
Sample risk assessment questionnaire for clinicians and patients’ use for those who initiate dialysis
| Patient’s condition | Score if “yes” |
|---|---|
|
| |
| Age category | |
|
| |
| <70 y | 0 |
| 70–74 y | 1 |
| 75–79 y | 1 |
| 80–84 y | 1 |
| 85–89 y | 2 |
| ≥90 y | 3 |
|
| |
| Albumin level is low (<3.5 g/dl) or unknown? | 1 |
|
| |
| Needs assistance in daily living? | 1 |
|
| |
| Lives in nursing home? | 1 |
|
| |
| Had or has cancer? | 1 |
|
| |
| Had or has heart failure? | 1 |
|
| |
| Hospitalized more than once or >1 mo in last year? | 1 |
|
| |
| Total score (range, 0–9) | |
Disclaimer: This risk assessment tool is not intended as medical advice or to suggest treatment. Patients should always consult with their physician or other healthcare professional for advice.
Table 4.
Sample risk assessment chart for clinicians and patients’ use for those who initiate dialysis
| Total score | Estimated probability of dying | Proportion of patients with same score | |
|---|---|---|---|
| Within 3 mo | Within 6 mo | ||
| 0 | 2% | 4% | 2 % |
| 1 | 3% | 7% | 12% |
| 2 | 7% | 12% | 25% |
| 3 | 12% | 20% | 27% |
| 4 | 17% | 27% | 19% |
| 5 | 22% | 35% | 10% |
| 6 | 28% | 44% | 4% |
| 7 | 34% | 49% | 1% |
| ≥8 | 39% | 55% | 0.2% |
Note: Probabilities were calculated from nearly 70,000 end-stage renal disease patients aged 67 years or older who initiated dialysis.
Disclaimer: This risk assessment tool is not intended as medical advice or to suggest treatment. Patients should always consult with their physician or other healthcare professional for advice.
Validation and Comparison With Alternative Risk Scores
The probability of dying within 3 months of initiating dialysis is shown using deciles for the comprehensive model and total scores for the simple PRS (Figure 2). Monotonicity (curvature) in observed risk is clear and a consistent pattern is observed in the development and validation cohorts. Furthermore, the performance of different risk stratification rules of the comprehensive and simple risk scores on the validation cohort are summarized in Table S3. As risk scores increased, sensitivity decreased and specificity increased.
Figure 2.
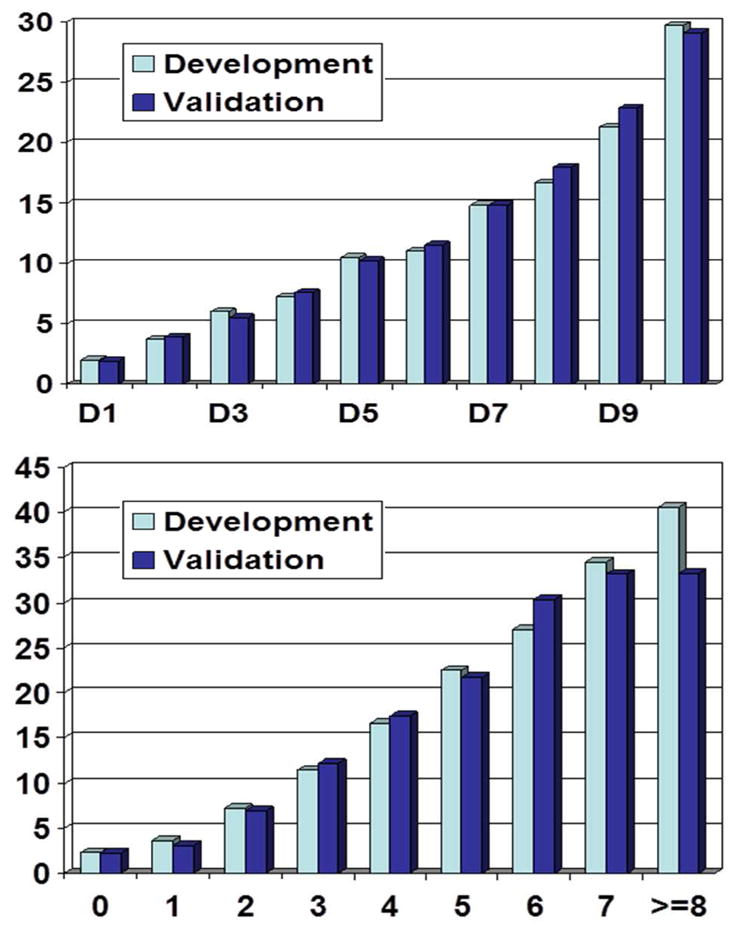
Probability of dying within 3 months for different risk groups for the comprehensive (upper) and simple (lower) risk scores. For the comprehensive risk score, deciles were used and for the simple risk score, total scores were used for x-axis. Scores of 8 and 9 were combined due to very small sample sizes in score 9.
Discrimination capacity and model fit for the newly developed and previously published models are summarized in Table 5, with the corresponding receiver operating characteristic curves in Figure S1. The comprehensive model has the highest AUROC (best discrimination) and lowest Aikike information criterion (best model fit), followed by the simple PRS, the UK model, and then the French model (AUROC range, 0.71–0.62). Accommodations to both registry-based models were necessary to adjust for differences in data availability before we could fairly compare discrimination and model fit in Table 5. In the French model, we used ischemic heart disease (OR, 1.35) in the absence of dysrhythmia in our data (in comparison, OR of 1.2 for dysrhythmia in the French model). In the UK model, we also used a proxy (OR, 2.73) in the absence of calcium by combining assistance needed, hospitalization and using a catheter in our data (in comparison, OR of 2.72 for calcium in the UK model).
Table 5.
Discrimination and model fit measured by AUROC and AIC for new and competing models
| Model | Development cohort | Validation cohort | ||
|---|---|---|---|---|
| AUROC | AIC | AUROC | AIC | |
| Comprehensive risk score | 0.712 | 36132 | 0.715 | 11519 |
| Simple risk score | 0.681 | 36981 | 0.691 | 11753 |
| French model omitting dysrhythmia | 0.665 | 37301 | 0.676 | 11881 |
| French model with proxy | 0.667 | 37270 | 0.679 | 11851 |
| UK model 1 | 0.615 | 38340 | 0.616 | 12280 |
| UK model 2 | 0.626 | 38159 | 0.627 | 12211 |
| UK model 3 omitting calcium | 0.653 | 37643 | 0.654 | 12060 |
| UK model 3 with proxy | 0.679 | 36979 | 0.683 | 11814 |
Note: In our data, dysrhythmia and calcium were unavailable. In the comprehensive model, missing albumin was imputed. For the French model, we used ischemic heart disease that yielded adjusted OR of 1.35 as a proxy of dysrhythmia. To compare, dysrhythmia showed OR of 1.2 in Couchoud et al.14 For UK model 3, we omitted calcium, since this data was not available in the US Renal Data System. In the UK model, we used a proxy (OR, 2.73) in the absence of calcium in our data, by combining assistance needed, hospitalization and having catheter (in comparison, OR of 2.72 for calcium in the UK model, Wagner et al.30). When we further adjusted 3 socioeconomic status variables (regional income, education and poverty), AUROC and AIC were minimally changed (e.g., AUROC= 0.679 to 0.680 and AUROC=36964 to 36966)
Abbreviations and definitions: AUROC: area under ROC curve (higher is better discrimination); AIC: Akaike Information Criterion (lower is better model-fit when used in the same sample); OR, odds ratio; UK, United Kingdom
Next, calibration plots in Figure S2 indicate high agreement between predicted vs. observed risks for 3-month as well as 6-month mortality in the validation set (correlation coefficients, 0.98 and 0.99, respectively). When we fitted the model for 6-month mortality, AUROC values were virtually unchanged (e.g., 0.715 vs. 0.714 for 3 vs. 6 month mortality), which suggests that the single model may be used for both 3- and 6-month mortality in practice. The PRS in cardiovascular studies with traditional risk factors generally showed comparable AUROC values.35,36,37
DISCUSSION
Using observational data from nearly 70,000 elderly US dialysis patients, we derived comprehensive and simple risk scores to predict mortality in the first 3 and 6 months after initiating dialysis. We evaluated these models and compared them with two models that were developed for similar purposes and settings. Our simple risk score may serve as an essential part of a shared decision-making tool used in the late stages of CKD to initiate discussions to inform patients and families of objective/empirical estimates of short-term survival likelihood. A sample questionnaire (Table 3) includes seven easily identifiable variables along with risk estimates. The comprehensive model or risk score can offer higher accuracy and underlying mathematical formulation, possibly with higher educational value, and could be implemented via an online calculator (see equations in Item S1). To illustrate a sample clinical scenario, if we assume a patient is 70 years old with albumin level of 3.4 g/dl, their expected 3-month mortality probability ranges from 1% to 30% depending on other risk factors and the model used. If a patient is 80 years old, the mortality ranges from 3% to 42%.
Accurate information about short-term dialysis prognosis may help elderly patients make treatment decisions in a more rational and well-informed way. The vast majority of CKD patients want information about their life expectancy and prognosis—whether positive or negative38—although many have not discussed these matters with their nephrologists.39,40 In one study, 63% of patients who decided to initiate dialysis regretted this choice, and 52% indicated they initiated dialysis because it was the doctor’s recommendation.41 Patients should be informed of the harms and benefits of dialysis versus nondialysis management, including information about prognosis. To best facilitate the decision regarding whether to initiate dialysis among elderly patients with late-stage CKD, the one page risk assessment questionnaire should be complemented with existing print and video material on the subject of dialysis versus conservative management.42
Among many models that have been developed to predict mortality among patients initiating dialysis, we discuss three. Using the French REIN Registry (n = 4,991), a prognostic score was developed to predict 6-month prognosis among elderly ESRD patients aged 75 years and older in regions which cover 79% of the French population.14 The authors identified 9 risk factors; there is some overlap with our factors (e.g., congestive heart failure, peripheral vascular disease, cancer, serious functional limitations), and others are unique to their model (BMI, diabetes, dysrhythmia, severe behavioral disorders, and unplanned dialysis). Notably, the French model did not find that age was an independent risk factor for mortality. However, its applicability to the US elderly dialysis population may be limited given important differences in practice patterns (e.g., all patients in the French database were seen by nephrologists and rates of peritoneal dialysis among older patients in France are higher43).
The second model, based on a nationwide cohort study in the United Kingdom using UK Renal Registry data (n = 5,447), predicted longer-term 3-year mortality among patients who survived the first three months of dialysis in contrast to our study.30 Wagner et al. included many of the risk factors used in our study (e.g., age, race, primary cause of kidney disease, dialysis modality, diabetes, cardiovascular disease, smoking and laboratory values such as hemoglobin, serum albumin, creatinine and calcium). We did not include calcium since it is not available in the USRDS.
The third model, based on a development cohort of 512 patients at five dialysis clinics, uses 5 variables to predict 6-month mortality at any time during hemodialysis.15 Both the derivation and validation cohorts were drawn from a single geographic area—New England. Including use of a surprise question, “Would I be surprised if this patient died in the next 6 months?,” the Cohen model necessitates clinician or care provider’s input and is impractical or unavailable in non-clinical settings. The concordance of answers to the ‘surprise question’ also inherently varied considerably amongst nephrologists.15,44 Despite its novelty and clinical value (e.g., comprehensive, overall assessment of patient frailty), the Cohen model may not be well suited for joint discussion among patients and clinicians, given the subjective and provocative nature of the surprise question, unless it is deciphered more objectively for patients.
Over eighty randomized trials have demonstrated the efficacy of decision aids for increasing patient engagement in clinical decision making.45 Specifically, in many clinical areas, the use of risk scores or decision aids – particularly when preference-sensitive decisions are being made (i.e., there are multiple options with each having different risks and benefits) – have been shown to be effective in increasing patient knowledge of available treatments and clarifying patient preferences. The effective integration of successful interventions into routine patient care, however, remains a challenge.46 Field testing in the future will be necessary to study various aspects of our PRS, including any unexpected barriers, patient-centeredness, optimal method of delivery and implementation (e.g., clinical settings and self-assessment), and if it leads to better outcomes (e.g., including better quality of life and minimal regret).
Use of prediction scores to choose conservative nondialytic care must be balanced with good clinical judgment. For patients with a high risk of death, the risk score could be useful for physicians in discussing the patients’ treatment expectations and hopes; for patients with a good survival prognosis, it might provide encouragement. Risk scores should not be used to deny care or as the sole criterion to decide whether to initiate dialysis, but rather should be a part of the shared decision-making process between patients and their families and providers. In addition to the risk score, physicians need to discuss the effect of dialysis on daily life, projected changes in functional status and quality of life, and the benefits and risks of nondialytic conservative management, which includes the usual integrated CKD care, palliative care and, possibly, hospice.
There are several limitations to our study. First, our study includes elderly patients, who enroll in the Medicare ESRD program and initiate dialysis, and not younger patients or those who decided to forego dialysis. Since the USRDS registry does not include information on advanced kidney disease patients who do not receive treatment, estimates on the size of this population are unknown;47 therefore small scale studies on outcomes among patients who forego dialysis are the only current source of comparative data. A second, related limitation is that we only included patients with a 2-year previous Medicare history and, to the extent that the excluded patients are different, our results may not be generalized to the entire Medicare elderly dialysis population. Using information from the USRDS available for all patients, we found that compared to our study cohort, patients excluded due to missing Medicare history were somewhat more likely to be male, nonwhite and Hispanic, but had similar age distribution, BMI and laboratory values, and initiated dialysis with similar modality and catheter proportions (Table S4). Third, although we validated our risk scores in an independent sample, further external validation and evaluation of (qualitative) feasibility issues in different settings are warranted, to understand optimal settings for usage and if any improvement is needed. Finally our predictive scores only used data from administrative databases and the inclusion of more detailed clinical and psychosocial data may improve the accuracy. Several strengths of the study are noteworthy. First, this analysis uses a large sample size (N ~70,000, vs. N < 6,000 in French and UK models). Second, our simple PRS includes predictors that may be more easily understood by patients, compared to alternative models that require clinician input or medical judgment. In particular, the calibration of the model was very good.
We have developed and validated predictive risk scores for early mortality for CKD patients who initiate dialysis based on data of nearly all elderly US dialysis patients. The simple risk score is based on commonly available information and can be easily implemented. We envision this simple scoring system could be a useful addition to current dialysis preparation and education programs, as well as facilitate shared decision making regarding a range of treatment options given to patients with late-stage CKD.
Supplementary Material
Summary of patient characteristics: development and validation cohorts
Multiple regression for the comprehensive model for 3-month mortality without imputing albumin in the development cohort (N=39,622, 2nd column) and with imputation in the validation cohort (N=16,645, last column)
Diagnostic characteristics of the comprehensive and simple Predictive Risk Scores using different cutpoints: Validation cohort (N=16,645)
Summary of available patient characteristics at baseline between study cohort and those excluded due to missing Medicare history.
Figure S1. Receiver operating characteristic curves for different models: validation cohort.
Figure S2. Predicted vs. observed mortality probability for the comprehensive risk score: Validation cohort. Circles denote deciles. Correlation coefficient is 0.98 for 3 month and 0.99 for 6 month.
Item S1. Mortality probability calculat
Acknowledgments
The contents of this study do not represent the views of the US Department of Veterans Affairs or the US Government.
Support: This study was funded in part by National Institute of Aging Grant R21 AG043516 (principal investigator, Dr Thamer). Dr Bang was also partly supported by the National Center for Advancing Translational Sciences, National Institutes of Health, through grant UL1 TR 000002. The data reported herein have been supplied by the USRDS and Centers for Medicare & Medicaid Services. The interpretation and reporting of these data are the responsibility of the authors and in no way should be seen as the official policy or interpretation of the US Government.
Footnotes
Financial Disclosure: The authors declare that they have no other relevant financial interests.
Contributions: Research idea and study design: MT, JSK, YZ, HB; data acquisition: DJC; data analysis/interpretation: MT, JSK, YZ, QZ, HB; statistical analysis: HB; supervision or mentorship: MT, HB. Each author contributed important intellectual content during manuscript drafting or revision and accepts accountability for the overall work by ensuring that questions pertaining to the accuracy or integrity of any portion of the work are appropriately investigated and resolved. MT takes responsibility that this study has been reported honestly, accurately, and transparently; that no important aspects of the study have been omitted; and that any discrepancies from the study as planned have been explained.
Table S1: Summary of patient characteristics: development and validation cohorts.
Table S2: Multiple regression for comprehensive model for 3-mo mortality without imputing albumin in development cohort and with imputation in validation cohort.
Table S3: Diagnostic characteristics of comprehensive and simple predictive risk scores using different cut-points: validation cohort.
Table S4: Summary of available baseline patient characteristics: study cohort and those excluded.
Figure S1: Receiver operating characteristic curves for different models: validation cohort.
Figure S2: Predicted vs observed mortality probability for comprehensive risk score: validation cohort.
Item S1: Mortality probability calculators. Note: The supplementary material accompanying this article (doi:_______) is available at www.ajkd.org
Publisher's Disclaimer: This is a PDF file of an unedited manuscript that has been accepted for publication. As a service to our customers we are providing this early version of the manuscript. The manuscript will undergo copyediting, typesetting, and review of the resulting proof before it is published in its final citable form. Please note that during the production process errors may be discovered which could affect the content, and all legal disclaimers that apply to the journal pertain.
Contributor Information
Mae Thamer, Email: mthamer@mtppi.org.
James S. Kaufman, Email: James.Kaufman@va.gov.
Yi Zhang, Email: yz@mtppi.org.
Qian Zhang, Email: joyce@mtppi.org.
Dennis J. Cotter, Email: dcott@mtppi.org.
Heejung Bang, Email: hbang@ucdavis.edu.
References
- 1.US Renal Data System. USRDS 2010 Annual Report. Bethesda, MD: The National Institute of Health, National Institute of Diabetes and Digestive and Kidney Diseases; 2010. [Google Scholar]
- 2.Kurella M, Covinsky KE, Collins AJ, Chertow GM. Octogenarians and nonagenarians starting dialysis in the United States. Ann Intern Med. 2007;146(3):177–83. doi: 10.7326/0003-4819-146-3-200702060-00006. [DOI] [PubMed] [Google Scholar]
- 3.Schmidt RJ. Informing our elders about dialysis: Is an age-attuned approach warranted? Clin J Am Soc Nephrol. 2012;7(1):185–91. doi: 10.2215/CJN.10401011. [DOI] [PubMed] [Google Scholar]
- 4.O'Hare AM, Choi AI, Bertenthal D, Bacchetti P, Garg AX, Kaufman JS, Walter LC, Mehta KM, Steinman MA, Allon M, McClellan WM, Landefeld CS. Age affects outcomes in chronic kidney disease. J Am Soc Nephrol. 2007;18(10):2758–65. doi: 10.1681/ASN.2007040422. [DOI] [PubMed] [Google Scholar]
- 5.US Renal Data System. USRDS 2009 Annual Data Report: Atlas of Chronic Kidney Disease and End-Stage Renal Disease in the United States. Vol. 2. NIH/NIDDK; Bethesda, MD: 2009. Chapter 1: Emerging Issues: Early mortality on hemodialysis. [Google Scholar]
- 6. [Accessed on April 11, 2013]; http://choosingwisely.org/wp-content/uploads/2012/04/5things_12_factsheet_Amer_Soc_Neph.pdf.
- 7.Renal Physicians Association. Clinical Practice Guideline for Shared Decision-Making in the Appropriate Initiation and Withdrawal from Dialysis. 2. Rockville, MD: RPA; 2010. [DOI] [PubMed] [Google Scholar]
- 8.National Kidney Foundation. K/DOQI clinical practice guidelines for chronic kidney disease: evaluation, classification, and stratification. Stratification of Risk for Progression of Kidney Disease and Development of Cardiovascular Disease Guideline 15. Am J Kidney Dis. 2002;39(2 Suppl 1):S1–266. [PubMed] [Google Scholar]
- 9.Carson RC, Juszczak M, Davenport A, Burns A. Is maximum conservative management an equivalent treatment option to dialysis for elderly patients with significant comorbid disease? Clin J Am Soc Nephrol. 2009;4(10):1611–9. doi: 10.2215/CJN.00510109. [DOI] [PMC free article] [PubMed] [Google Scholar]
- 10.Smith C, Da Silva-Gane M, Chandna S, Warwicker P, Greenwood R, Farrington K. Choosing not to dialyze: evaluation of planned nondialytic management in a cohort of patients with end-stage renal disease. Nephron Clin Pract. 2003;95(2):c40–c46. doi: 10.1159/000073708. [DOI] [PubMed] [Google Scholar]
- 11.Wong CF, McCarthy M, Howse ML, Williams PS. Factors affecting survival in advanced chronic kidney disease patients who choose not to receive dialysis. Ren Failure. 2007;29(6):653–59. doi: 10.1080/08860220701459634. [DOI] [PubMed] [Google Scholar]
- 12.Ellam T, El-Kossi M, Prasanth KC, El-Nahas M, Khwaja A. Conservatively managed patients with stage 5 chronic kidney disease--Outcomes from a single center experience. QJM. 2009;102(8):547–54. doi: 10.1093/qjmed/hcp068. [DOI] [PubMed] [Google Scholar]
- 13.P.L. 92–603, Approved October 30, 1972 (86 Stat. 1329) Social Security Amendments Of 1972
- 14.Couchoud C, Labeeuw M, Moranne O, Allot V, Esnault V, Frimat L, Stengel B French Renal Epidemiology and Information Network (REIN) registry. A clinical score to predict 6-month prognosis in elderly patients starting dialysis for end-stage renal disease. Nephrol Dial Transplant. 2009;24(5):1553–61. doi: 10.1093/ndt/gfn698. [DOI] [PMC free article] [PubMed] [Google Scholar]
- 15.Cohen LM, Ruthazer R, Moss AH, Germain MJ. Predicting six-month mortality for patients on maintenance hemodialysis. Clin J Am Soc Nephrol. 2010;5(1):72–9. doi: 10.2215/CJN.03860609. [DOI] [PMC free article] [PubMed] [Google Scholar]
- 16.Hutchinson TA, Thomas CD, MacGibbon B. Predicting survival in adults with end-stage renal disease: an age-equivalence index. Ann Intern Med. 1982;96(4):417–23. doi: 10.7326/0003-4819-96-4-417. [DOI] [PubMed] [Google Scholar]
- 17.Miskulin DC, Meyer KB, Martin AA, Fink NE, Coresh J, Powe NR, Klag MJ, Levey AS Choices for Healthy Outcomes in Caring for End-Stage Renal Disease (CHOICE) Study. Comorbidity and its change predict survival in incident dialysis patients. Am J Kidney Dis. 2003;41(1):149–61. doi: 10.1053/ajkd.2003.50034. [DOI] [PubMed] [Google Scholar]
- 18.Keane WF, Collins AJ. Influence of co-morbidity on mortality and morbidity in patients treated with hemodialysis. Am J Kidney Dis. 1994;24(6):1010–8. doi: 10.1016/s0272-6386(12)81076-6. [DOI] [PubMed] [Google Scholar]
- 19.Soucie JM, McClellan WM. Early death in dialysis patients: Risk factors and impact on incidence and mortality rates. J Am Soc Nephrol. 1996;7(10):2169–75. doi: 10.1681/ASN.V7102169. [DOI] [PubMed] [Google Scholar]
- 20.Barrett BJ, Parfrey PS, Morgan J, Barré P, Fine A, Goldstein MB, Handa SP, Jindal KK, Kjellstrand CM, Levin A, Mandin H, Muirhead N, Richardson RM. Prediction of early death in end-stage renal disease patients starting dialysis. Am J Kidney Dis. 1997;29(2):214–22. doi: 10.1016/s0272-6386(97)90032-9. [DOI] [PubMed] [Google Scholar]
- 21.Obrador GT, Ruthazer R, Arora P, Kausz AT, Pereira BJ. Prevalence of and factors associated with suboptimal care before initiation of dialysis in the United States. J Am Soc Nephrol. 1999;10(8):1793–800. doi: 10.1681/ASN.V1081793. [DOI] [PubMed] [Google Scholar]
- 22.Kinchen KS, Sadler J, Fink N, Brookmeyer R, Klag MJ, Levey AS, Powe NR. The timing of specialist evaluation in chronic kidney disease and mortality. Ann Intern Med. 2002;137(6):479–86. doi: 10.7326/0003-4819-137-6-200209170-00007. [DOI] [PubMed] [Google Scholar]
- 23.Avorn J, Bohn RL, Levy E, Levin R, Owen WF, Jr, Winkelmayer WC, Glynn RJ. Nephrologist care and mortality in patients with chronic renal insufficiency. Arch Intern Med. 2002;162(17):2002–6. doi: 10.1001/archinte.162.17.2002. [DOI] [PubMed] [Google Scholar]
- 24.Ifudu O, Dawood M, Homel P, Friedman EA. Excess morbidity in patients starting uremia therapy without prior care by a nephrologist. Am J Kidney Dis. 1996;28(6):841–5. doi: 10.1016/s0272-6386(96)90383-2. [DOI] [PubMed] [Google Scholar]
- 25.Sehgal AR, Snow RJ, Singer ME, Amini SB, DeOreo PB, Silver MR, Cebul RD. Barriers to adequate delivery of dialysis. Am J Kidney Dis. 1998;31(4):593–601. doi: 10.1053/ajkd.1998.v31.pm9531174. [DOI] [PubMed] [Google Scholar]
- 26.Feldman HI, Kobrin S, Wasserstein A. Haemodialysis vascular access morbidity. J Am Soc Nephrol. 1996;7(4):523–35. doi: 10.1681/ASN.V74523. [DOI] [PubMed] [Google Scholar]
- 27.Charlson ME, Pompei P, Ales KL, MacKenzie CR. A new method of classifying prognostic comorbidity in longitudinal studies: Developlent and validation. J Chronic Dis. 1987;40(5):373–83. doi: 10.1016/0021-9681(87)90171-8. [DOI] [PubMed] [Google Scholar]
- 28.Hosmer D, Lemeshow S. Applied Logistic Regression. 2. New York, NY: John Wiley & Sons; [Google Scholar]
- 29.Bang H, Edwards AM, Bomback AS, Ballantyne CM, Brillon D, Callahan MA, Teutsch SM, Mushlin AI, Kern LM. Development and validation of a patient self–assessment score for diabetes risk. Ann Intern Med. 2009;151(11):775–83. doi: 10.1059/0003-4819-151-11-200912010-00005. [DOI] [PMC free article] [PubMed] [Google Scholar]
- 30.Wagner M, Ansell D, Kent DM, Griffith JL, Naimark D, Wanner C, Tangri N. Predicting mortality in incident dialysis patients: an analysis of the United Kingdom Renal Registry. Am J Kidney Dis. 2011;57(6):894–902. doi: 10.1053/j.ajkd.2010.12.023. [DOI] [PMC free article] [PubMed] [Google Scholar]
- 31.Gonen M. Analyzing receiver operation characteristic curves with SAS. Cary, NC: SAS Institute; 2007. [Google Scholar]
- 32.Shmueli G. To Explain or to Predict? Statistical Science. 2010;25(3):289–310. [Google Scholar]
- 33.Tangri N, Kent DM. Toward a modern era in clinical prediction: The TRIPOD Statement for Reporting Prediction Models. Am J Kidney Dis. 2015;65(4):530–3. doi: 10.1053/j.ajkd.2014.12.005. [DOI] [PubMed] [Google Scholar]
- 34.Embree BG, Whitehead PC. Validity and reliability of self-reported drinking behavior: dealing with the problem of response bias. J Stud Alcohol. 1993;54(3):334–44. doi: 10.15288/jsa.1993.54.334. [DOI] [PubMed] [Google Scholar]
- 35.Grundy SM, D'Agostino RB, Sr, Mosca L, Burke GL, Wilson PW, Rader DJ, Cleeman JI, Roccella EJ, Cutler JA, Friedman LM. Cardiovascular risk assessment based on US cohort studies: findings from a National Heart, Lung, and Blood institute workshop. Circulation. 2001;104(4):491–6. doi: 10.1161/01.cir.104.4.491. [DOI] [PubMed] [Google Scholar]
- 36.D'Agostino RB, Sr, Grundy S, Sullivan LM, Wilson P. CHD Risk Prediction Group. Validation of the Framingham coronary heart disease prediction scores: results of a multiple ethnic groups investigation. JAMA. 2001;286(2):180–7. doi: 10.1001/jama.286.2.180. [DOI] [PubMed] [Google Scholar]
- 37.Nambi V, Hoogeveen RC, Chambless L, Hu Y, Bang H, Coresh J, Ni H, Boerwinkle E, Mosley T, Sharrett R, Folsom AR, Ballantyne CM. Lipoprotein-associated phospholipase A2 and high-sensitivity C-reactive protein improve the stratification of ischemic stroke risk in the Atherosclerosis Risk in Communities (ARIC) study. Stroke. 2009;40(2):376–81. doi: 10.1161/STROKEAHA.107.513259. [DOI] [PMC free article] [PubMed] [Google Scholar]
- 38.Fine A, Fotaine B, Krausher MM, Rich BR. Nephrologists should voluntarily divulge survival data to potential dialysis patients: A questionnaire study. Perit Dial Int. 2005;25(3):269–73. [PubMed] [Google Scholar]
- 39.Holley JL. Palliative care in end-stage renal disease: Illness trajectories, communication, and hospice use. Adv Chronic Kideny Dis. 2007;14:402–8. doi: 10.1053/j.ackd.2007.07.002. [DOI] [PubMed] [Google Scholar]
- 40.Davidson SN. Facilitating advance care planning for patients with end-stage renal disease; the patient perspective. Clin J Am Soc Neprhol. 2006;1(5):1023–8. doi: 10.2215/CJN.01050306. [DOI] [PubMed] [Google Scholar]
- 41.Davidson SN. End of life preferences and needs: Perceptions of patients with chronic kidney disease. Clin J Am Soc Nephrol. 2010;5(2):195–204. doi: 10.2215/CJN.05960809. [DOI] [PMC free article] [PubMed] [Google Scholar]
- 42.National Kidney Foundation. Lesson Plan 5. Choosing the “No Treatment” Option. NKF, Inc; 2010. Chronic Kidney Disease: Your Treatment, Your Choice Implementation Guide for Health Professionals. 02-10-0199_ABA. [Google Scholar]
- 43.Verger C, Ryckelynck JP, Duman M, Veniez G, Lobbedez T, Boulanger E, Moranne O. French peritoneal dialysis registry (RDPLF): outline and main results. Kidney Int Suppl. 2006;70:S12–20. doi: 10.1038/sj.ki.5001911. [DOI] [PubMed] [Google Scholar]
- 44.Dawes RM, Faust D, Meehl PE. Clinical versus actuarial judgment. Science. 1989;243(4899):1668–74. doi: 10.1126/science.2648573. [DOI] [PubMed] [Google Scholar]
- 45.O'Connor AM, Stacey D, Rovner D, Holmes-Rovner M, Tetroe J, Llewellyn-Thomas H, Entwistle V, Rostom A, Fiset V, Barry M, Jones J. Decision aids for people facing health treatment or screening decisions. Cochrane Database Sys Rev. 2011;(3):CD001431. doi: 10.1002/14651858.CD001431. [DOI] [PubMed] [Google Scholar]
- 46.Lin GA, Halley M, Rendle KA, Tietbohl C, May SG, Trujillo L, Frosch DL. An effort to spread decision aids in five California Primary Care Practices yielded low distribution, highlighting hurdles. Health Aff. 2013;32(2):311–20. doi: 10.1377/hlthaff.2012.1070. [DOI] [PubMed] [Google Scholar]
- 47.O’Hare AM, Rodriguez RA, Hailpern SM, Larson EB, Tamura MK. Regional variation in health care intensity and treatment practices for end-stage renal disease in older adults. JAMA. 2010;304(2):180–6. doi: 10.1001/jama.2010.924. [DOI] [PMC free article] [PubMed] [Google Scholar]
Associated Data
This section collects any data citations, data availability statements, or supplementary materials included in this article.
Supplementary Materials
Summary of patient characteristics: development and validation cohorts
Multiple regression for the comprehensive model for 3-month mortality without imputing albumin in the development cohort (N=39,622, 2nd column) and with imputation in the validation cohort (N=16,645, last column)
Diagnostic characteristics of the comprehensive and simple Predictive Risk Scores using different cutpoints: Validation cohort (N=16,645)
Summary of available patient characteristics at baseline between study cohort and those excluded due to missing Medicare history.
Figure S1. Receiver operating characteristic curves for different models: validation cohort.
Figure S2. Predicted vs. observed mortality probability for the comprehensive risk score: Validation cohort. Circles denote deciles. Correlation coefficient is 0.98 for 3 month and 0.99 for 6 month.
Item S1. Mortality probability calculat