Abstract
The use of multi-kinase inhibitors (MKI) in oncology, such as sorafenib, is associated with a cutaneous adverse event called hand-foot skin reaction (HFSR) in which sites of pressure or friction become inflamed and painful, thus significantly impacting quality of life. The pathogenesis of MKI-induced HFSR is unknown, and the only available treatment options involve dose reduction or discontinuation of therapy, which have negative effects on primary disease management. To investigate the underlying mechanisms by which sorafenib promotes keratinocyte cytotoxicity and subsequent HFSR induction, we performed a transporter-directed RNAi screen in human epidermal keratinocytes and identified SLC22A20 (OAT6) as an uptake carrier of sorafenib. Further investigations into the intracellular mechanism of sorafenib activity through in situ kinome profiling identified the mitogen-activated protein kinase MAP3K7 (TAK1) as a target of sorafenib that induces cell death. Finally, we demonstrate that sorafenib induced keratinocyte injury in vivo, and that this effect could be reversed by co-treatment with the OAT6 inhibitor probenecid. Collectively, our findings reveal a novel pathway that regulates the entry of some MKIs into keratinocytes and explains the basis underlying sorafenib-induced skin toxicity, with important implications for the therapeutic management of HFSR.
Keywords: Cutaneous toxicity, Multi-kinase inhibitors, Transporter, MAP Kinase
INTRODUCTION
In oncology, the last two decades have seen a dramatic transition from the use of traditional cytotoxic chemotherapy to the emergence of a new paradigm in rational drug design coupled with an uprising in the development of targeted agents, including the kinase inhibitors. To date, more than 20 different kinase inhibitors have received approval by the U.S. Food and Drug Administration (FDA) for the treatment of a variety of diseases that were previously essentially resistant to standard chemotherapy, and many more can be expected to become available in the future (1). However, despite the success of these agents in specific disease settings, many kinase inhibitors face significant challenges due to their susceptibility to de novo resistance and/or the occurrence of acquired resistance through a myriad of mechanisms leading ultimately to lack of efficacy. Moreover, while kinase inhibitors offer possibly a number of important theoretical advantages over conventional cytotoxic chemotherapy, they are still afflicted by some of the same problems, including an extensive interindividual pharmacokinetic variability, the existence of a rather narrow therapeutic window, and the occurrence of multiple, debilitating adverse events (1).
Cutaneous adverse effects are among the most frequently observed toxicities with many kinase inhibitors, and their intensity can significantly affect both quality of life and health care economics (2). A particularly painful complication seen most frequently during the early weeks of use with multi-kinase inhibitors (MKIs), such as sorafenib, sunitinib, and pazopanib, is called hand-foot skin reaction (HFSR), in which hyperkeratotic plaques develop predominantly over sites of pressure or friction (3, 4). These plaques may have significant inflammation and xerotic hyperkeratosis, often in a bilateral symmetric distribution, causing pain and debilitation that interfere with activities of daily living (2). Sequential biopsy specimens have revealed progressive accumulation of hyperkeratosis with focal parakeratosis. The clinical incidence of HFSR varies among MKIs with a particularly high incidence being observed with sorafenib (4) (Table S1), and does not appear to be related to increased excretion of MKIs through sweat (5). The pathogenesis of MKI-induced HFSR remains currently unknown, and the only demonstrably effective treatment options involve dose reduction or discontinuation of therapy, which have negative effects on disease management (6, 7). Here, we provide evidence that sorafenib can extensively accumulate into human epidermal keratinocytes mediated by the organic anion transporter SLC22A20 (OAT6) and we identified the mitogen-activated protein kinase MAP3K7 (TAK1) as a novel target of sorafenib causing keratinocyte cell death. Finally, we demonstrate that sorafenib induces injury to keratinocytes in vivo, and that this effect can be reversed by co-treatment with the OAT6 inhibitor probenecid.
MATERIALS AND METHODS
Chemicals and reagents
Hemicholinum-3, homovanillic acid, and probenecid were purchased from Sigma-Aldrich. [3H]Ddasatinib [specific activity (SA) = 10.2 Ci/mmol; radiochemical purity 99.7%], [3H]imatinib (SA = 1.7 Ci/mmol; radiochemical purity 99.9%), [3H]nilotinib (SA = 3.9 Ci/mmol; radiochemical purity 99.7%), [3H]pazopanib (SA = 1.0 Ci/mmol; radiochemical purity 99.1%), [3H]sorafenib (SA = 2.2 Ci/mmol; radiochemical purity 97.8%), and [3H]sorafenib-N-oxide (SA = 0.4 Ci/mmol; radiochemical purity 98.7%) were purchased from Moravek Biochemicals. [3H]Sunitinib (SA = 12.5 Ci/mmol; radiochemical purity 99%) was purchased from American Radiolabeled Chemicals. Unlabeled axitinib and regorafenib were purchased from Selleck Chemicals. Dasatinib, sorafenib, regorafenib, pazopanib, and imatinib were from LC Laboratories, and sorafenib N-oxide from Toronto Research Chemicals. All kinase inhibitors were dissolved in dimethyl sulfoxide (DMSO; Sigma-Aldrich). Antibodies against caspase 3 (9662, 9664), phospho-MKK7 (pS271/T275; 4171), phospho-JNK (pT183/Y185; 4668), and JNK (9252) were purchased from Cell Signaling Technology. Antibodies against βactin (sc-47778) and PARP (P7605) were purchased from Santa Cruz Biotechnology and Sigma-Aldrich, respectively. Taqman primer and probe pairs for SLC22A6, SLC22A7, SLC22A8, SLC22A9, SLC22A10, SLC22A11, SLC22A20, and GAPDH were purchased from Life Technologies. GeneChip human genome U133 Plus 2.0 microarrays were purchased from Affymetrix.
Cell culture and viability assays
Human primary keratinocytes [HEKa; Life Technologies, Lot 932013 and Lot 1443683 ] were cultured on collagen-coated flasks in EpiLife medium (Life Technologies) according to the product instructions. Mouse primary epithelial keratinocytes were purchased from CellNTec and propagated using CNT-PR medium according to the product instructions. Cells were maintained at 37°C in humidified air containing 5% CO2. Cell viability was measured using either MTT reagent (Life Technologies) or CellTiter-Glo (Promega) according to the manufacturer’s instructions on a Biotek µQuant microplate spectrophotometer.
Western blot analysis
Cells were lysed in radioimmunoprecipitation assay buffer supplemented with protease and phosphatase inhibitors (Calbiochem). Total cell lysate (30–50 µg) was separated by SDS-polyacrylamide gel electrophoresis according to the manufacturer’s instructions (Life Technologies) and transferred to PVDF membranes followed by Western blot analysis using the indicated antibodies as previously described (8).
Animals and wax-depilation studies
C57BL6 mice (Charles River; 8–12 weeks old) were housed in a climate-controlled facility with a 12-hour light/dark cycle and access to unlimited food and water. Wax depilation (Surgiwax) was performed on the dorsal surface of anesthetized animals according to the manufacturer’s instructions, and mice were randomly assigned a treatment group. The next day treatment was initiated with twice daily oral administration of sorafenib (60 mg/kg; formulated in 50% Cremophor EL and 50% ethanol, then diluted 1:4 with deionized water), imatinib (100 mg/kg; formulated in water), or vehicle and continued for 2 weeks. Sorafenib (60 mg/kg) was also administered once daily with or without probenecid (200 mg/kg; formulated in 0.5% carboxymethylcellulose/0.1% Tween 80) given as an intraperitoneal injection. At the end of treatment, mice were humanely euthanized and fixed in 10% formalin. Blocks of skin tissue were collected from the dorsal surface and sectioned into 4-µm thick sections. Sections were stained with hematoxylin and eosin, and hair follicle morphology was assessed in accordance with the criteria outlined in Muller-Rover et al (9). All procedures were approved by the St. Jude Animal Care and Use Committee under protocol number 479-100245-07/13.
Plasma pharmacokinetic studies
Two separate sorafenib pharmacokinetic studies were performed in 3 to 4 C57BL6 mice following oral administration of sorafenib 60 mg/kg given with or without probenecid 100 mg/kg (intraperitoneal). Serial blood samples were taken from individual mice at 0.5 and 1 h from the submandibular vein, at 2 and 4 h from the retro-orbital sinus, and at 6 h by a terminal cardiac puncture. All blood samples were centrifuged at 3,000×g for 5 min and plasma was stored at −80°C until analysis by high-performance liquid chromatography with tandem mass spectrometry. The area under the plasma concentration-time curve from time zero to 6 hours after drug administration was estimated using WinNonlin 6.3 (Pharsight).
siRNA transfection
The MISSION Human Ion Channel and Transporter siRNA library and siRNA targeting A-RAF were purchased from Sigma-Aldrich. For the transporter screen, siRNA (set of 3 per gene) were suspended in sterile water and pooled. Transient transfection in HEKa cells was performed using Lipofectamine RNAiMax according to the manufacturer’s instructions (Life Technologies). Briefly, cells were plated in collagen-coated 96-well plates. The next day the lipofectamine:siRNA (25 nM) mixture was prepared in OptiMEM media (Gibco) and then added to cells. A sorafenib uptake assay was performed 48 hr later. SMARTpool siRNA was purchased from GE Life Sciences, and transfection of HEKa cells in a 96-well or 12-well format was performed similar to the method reported above.
In vitro transport assays
Cells were plated on 6-well, 12-well, or 96-well plates and incubated with the indicated amount of [3H]-radiolabeled drug for 5–60 min in phenol red-free EpiLife medium without supplements at 37°C. The experiment was terminated by placing the cells on ice and washing 3 times with ice-cold PBS. Cell were then lysed in 1 N NaOH and the solution neutralized with 2 M HCl. Total protein was measured using a Pierce BCA Protein Assay Kit (Thermo Scientific) and total protein content was quantified using a Biotek µQuant microplate spectrophotometer. Intracellular drug accumulation was determined in the remaining cell lysate by liquid scintillation counting using a LS 6500 Multipurpose Scintillation Counter (Beckman).
Kinome analyses
HEKa cells were treated with DMSO or drug for 1 hr, washed in PBS, and pelleted. Samples were analyzed by KiNativ in situ proteomic profiling (ActivX Biosciences) (10, 11). Kinase tree was developed using TREEspot software. Inhibitor activity against purified TAK1 was determined by KinaseProfiler in vitro kinase assay (Millipore).
Quantitative real-time PCR (qPCR) and microarrays
RNA was extracted from cells using Trizol reagent according to the manufacturer’s instructions. RNA was converted to cDNA using the SuperScript III First Strand kit (Life Technologies) according to the manufacturer’s instructions. Gene expression was determined using Taqman primer/probes on a 7900HT Sequence Detection System according to the manufacturer’s instructions. Microarray analysis was performed according to the manufacturer’s instructions.
In vitro antitumor efficacy
Gene expression analyses in human tumors were performed using the Pan Cancer gene expression dataset (9755 samples). This dataset consists of RNA seq data from Illumina Hi-seq analyses (12). The expression values were normalized across cancer types, where the red color represents high gene expression values, values in green represent low gene expression, and black represents average expression. The information of interest was extracted using the UCSC Xena browser (13). Expression of the OAT6 gene SLC22A20 was further evaluated using real-time RT-PCR in the lung adenocarcinoma cell line A549, the renal cell carcinoma cell line 7860, the hepatocellular carcinoma cell line HepG2, and the acute myeloid leukemia (AML) cell line CHRF288-11. The A549, 7860, and HepG2 cell lines were obtained from ATCC; the CHRF288-11 cell line was a kind gift from Dr. Tanja Gruber (St. Jude Children’s Research Hospital). The cell growth inhibitory potential of sorafenib (range, 0.1 – 100 µM) in these cell lines was evaluated in the presence or absence of probenecid (500 µM) using an MTT assay following continuous exposure for 72 hours.
Statistical analyses
All data are presented as mean ± SEM unless otherwise indicated. Prism (GraphPad) software was used for non-linear regression analysis of cell viability dose-response data and Michaelis-Menten enzyme kinetics analysis. Statistical analysis was done using a two-tailed Student’s t-test using a cutoff for statistical significance of P < 0.05.
Results and Discussion
Identification of OAT6 as a sorafenib transporter in keratinocytes
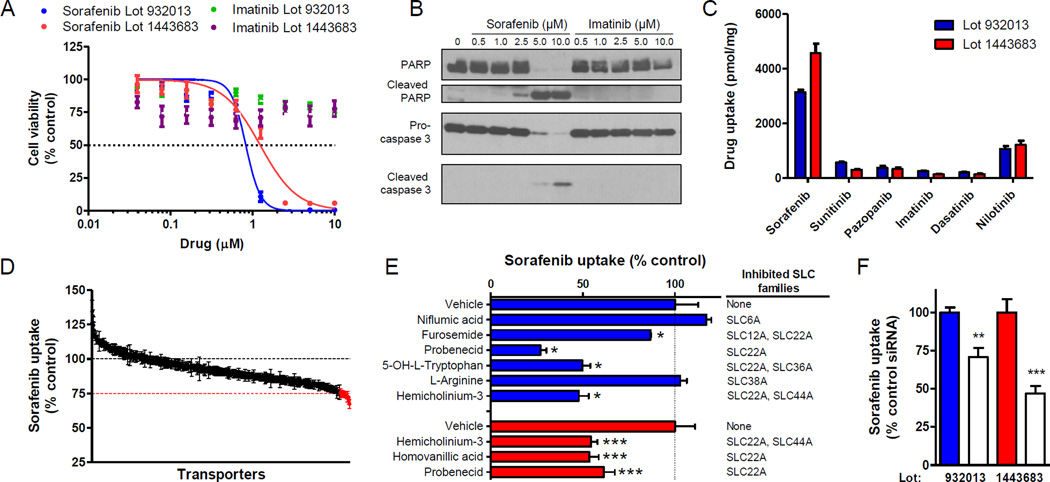
Using primary human epidermal keratinocytes (HEKa) as a model system (14), we observed that sorafenib causes a dose-dependent decrease in viability [IC50 (mean ± SEM) = 0.83 ± 0.04 µM and 0.99 ± 0.05 µM, lot 932013 and lot 1443683, respectively] and an increase in apoptosis (Fig. 1A,B). In contrast, these cells were not sensitive to the Bcr-Abl inhibitor imatinib, the clinical use of which is not associated with HFSR (Supplementary Table S1). We hypothesized that HFSR induction is due to extensive intracellular uptake of MKIs in keratinocytes. In support of this hypothesis, we found that sorafenib highly accumulates in HEKa compared to a panel of other kinase inhibitors, including imatinib (Fig. 1C). The sorafenib uptake process was concentration-, time-, and temperature-dependent with a Michaelis-Menten constant (Km) of 7.0 µM and a maximum velocity (Vmax) of 20,900 pmol/5min/mg protein (Supplementary Fig. S1A–D). Similar to sorafenib, the pharmacologically-active metabolite sorafenib N-oxide also displayed a temperature- and time-dependent transport in and cytotoxicity against HEKa (Supplementary Fig. S1A, C–E).
Fig. 1. OAT6 mediates sorafenib uptake in human primary keratinocytes (HEKa).
(A) HEKa from 2 individual lots were treated with sorafenib or imatinib for 72 h and cell viability was measured in a MTT assay (2–3 experiments, n = 12–18); (B) cleaved PARP and caspase 3 was assessed by Western blot analysis after 24 h. (C) Intracellular accumulation of kinase inhibitors (1 µM, 5 min) in HEKa (2 experiments, n = 6). (D) Intracellular accumulation of sorafenib (1 µM, 15 min) in HEKa 48 h after siRNA (25 nM) transfection, (n = 7). Red line indicates 75% uptake, and red data points indicate ≤75% uptake compared to control conditions. (E) Effect of transporter inhibitors (0.2–1.0 mM) (blue bars) and OAT inhibitors (100 µM) (red bars) on intracellular accumulation of sorafenib (1 µM, 15 min) in HEKa (blue bars; n = 2–6). (F) Intracellular accumulation of sorafenib (1 µM, 15 min) in HEKa 48 hr after transfection with OAT6-targeted siRNA (25 nM) (2–3 experiments, n = 6–9; control siRNA: filled bars; OAT6 siRNA: unfilled bars). Mean gene expression (relative to control siRNA 48 h post-transfection) was 45 ± 1% and 39 ± 3%. Data represent the mean ± SEM (*, P < 0.05; **, P < 0.01; ***, P < 0.001).
Since sorafenib is a poorly permeable compound (15), we next hypothesized that its uptake into keratinocytes is predominantly a transporter-mediated process. To explore this possibility experimentally, we used the MISSION Human Ion Channel and Transporter siRNA library in order to identify outer-membrane localized transporter proteins in HEKa that, when silenced by a short-interfering RNA, cause a decrease in the uptake of sorafenib. In total, we screened 412 transporters in HEKa using an average decrease in sorafenib uptake of 25% following gene silencing as a cutoff for the identification of candidate transporters for further consideration (Supplementary Fig. S2A; Supplementary Table S2). This screen initially yielded 15 genes of putative importance (Fig. 1D; Supplementary Fig. S2B), although transcriptional profiling of HEKa indicated that 6 of these genes (SLC6A18, SLC22A11, SLC25A31, SLC30A4, SLC32A1, and SLC34A1) had very low expression levels (Supplementary Fig. S2C). These 6 genes, as well as SLC35A2, which is known to encode a transporter localized in the mitochondria (16), were excluded from further consideration.
To identify the carrier that transports sorafenib into HEKa, we measured sorafenib uptake in the presence of known inhibitors for the 8 remaining candidate transporters, namely SLC6A11, SLC6A15, SLC6A19, SLC12A6, SLC22A20, SLC36A3, SLC38A1 and SLC44A3. We found that the uptake process was particularly sensitive to inhibitors of the family of organic anion transporters (OATs; SLC22A), including probenecid (Fig. 1E). The sensitivity of sorafenib uptake to the OAT inhibitors probenecid, hemicholinum-3 (HC3), and homovanillic acid (HVA) was further confirmed in HEKa from a second lot (Fig. 1E). There are currently 7 known OATs with confirmed sensitivity to probenecid-mediated inhibition (17), and of these OAT6 showed the highest mRNA expression in HEKa cells (Supplementary Fig. S2D). The only known substrate for the OAT6 murine ortholog mOAT6 is estrone-3-sulfate (18). Interestingly, OATP1B1, a hepatocellular transporter of sorafenib (15), also transports estrone-3-sulfate, suggesting a possible overlapping substrate specificity. Moreover, SMARTpool siRNA-mediated knockdown of the OAT6 gene SLC22A20 in keratinocytes also reduced sorafenib uptake compared to control conditions (Fig. 1F). Taken together, these data demonstrate that OAT6 is, at least in part, responsible for sorafenib uptake into HEKa.
Identification of TAK1 as a sorafenib target in keratinocytes
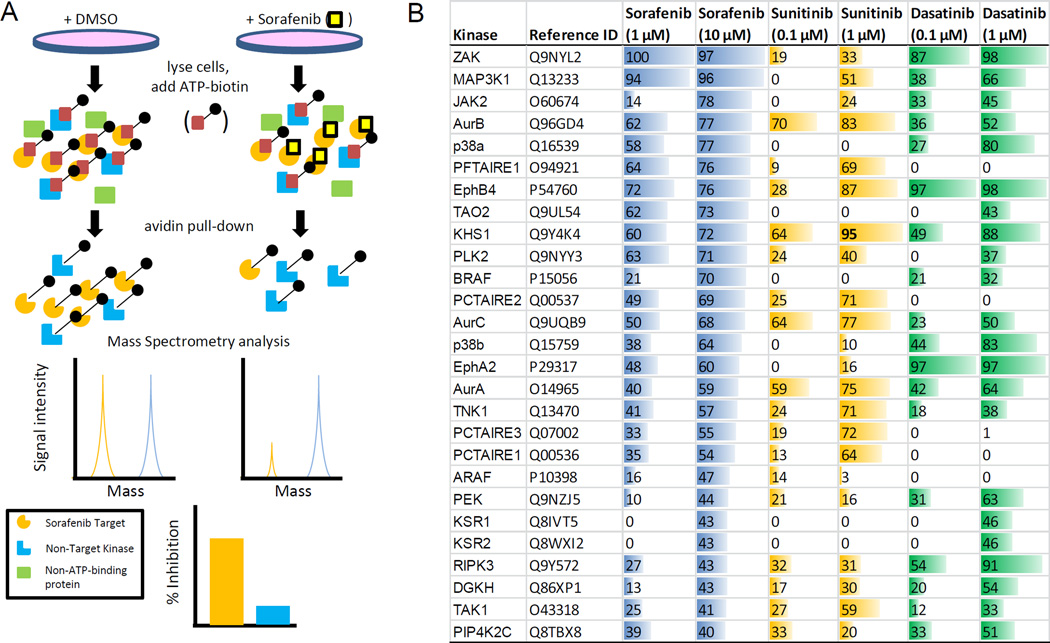
At clinically-achievable concentrations, many MKIs are not selective for their intended target (19), and this ability to non-selectively inhibit kinases is thought to contribute to “off-target” adverse events. In an effort to elucidate the intracellular mechanism of sorafenib-dependent keratinocyte cytotoxicity, we performed KiNativ in situ kinome analyses. Of note, this assay was performed with intact cells and accounted for drug uptake (Fig. 2A) (10). A focused, sorafenib-target signature consisting of 27 kinases was defined by greater than 40% inhibition of kinase-ATP binding following sorafenib treatment, and this list of genes included the putative sorafenib target B-RAF (20) (Fig. 2B).
Fig. 2. Evaluation of sorafenib kinase targets in human primary keratinocytes (HEKa).
(A) Diagram of KiNativ in situ kinome profiling workflow. (B) List of kinases whose ATP-binding was competitively inhibited ≥ 40% in HEKa when treated with 10 µM sorafenib. Inhibition is also shown for these kinases when treated with 1 µM sorafenib, sunitinib (0.1 or 1 µM), and dasatinib (0.1 or 1 µM).
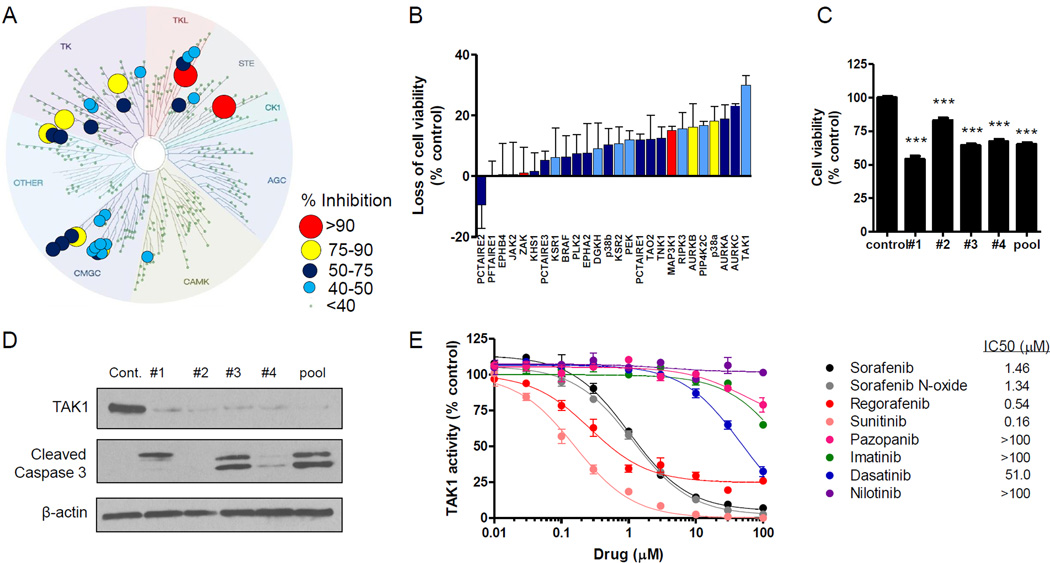
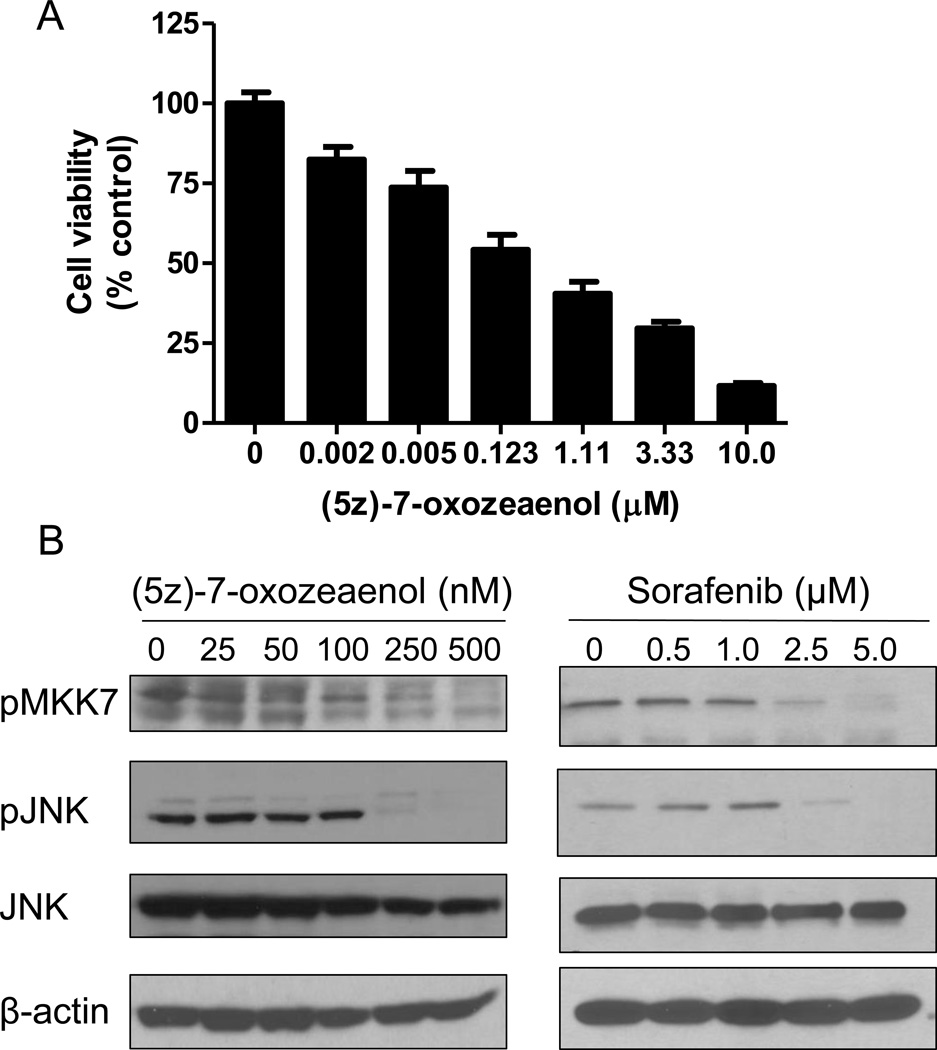
Using a clinically-achievable concentration (3), sorafenib kinase targets in HEKa were found to primarily cluster within the tyrosine kinase, tyrosine kinase-like, STE, and GMGC subfamilies (Fig. 3A). To determine whether these kinases are important for cell survival, HEKa were transfected with SMARTpool or MISSION siRNA followed by an assessment of cell viability. We found that knockdown of the mitogen-activated protein kinase MAP3K7 (TAK1) led to the greatest loss in cell viability (30 ± 5.5%, Z-score = −3.6; Fig. 3B). We next performed KiNativ in situ kinome analyses with sunitinib, a MKI that causes HFSR and induces cytotoxicity against HEKa (Supplementary Fig. S3A), as well as with dasatinib, a Bcr-Abl inhibitor that is not associated with HFSR in patients (Supplementary Table S1). When profiled at a clinically-relevant inhibitor concentration, we found that 11 kinases were inhibited by sorafenib and sunitinib more strongly as compared with dasatinib, including TAK1 (Fig. 2B; Supplementary Table S3). Interestingly, previous reports have demonstrated that TAK1-deficient keratinocytes show elevated basal apoptosis and are hypersensitive to TNFα-induced cell death (21, 22). Likewise, we observed a loss in cell viability and an increase in cleaved caspase by transfecting cells with the deconstructed SMARTpool TAK1-targeting siRNA (Fig. 3C,D). Finally, treatment with the TAK1-selective inhibitor (5z)-7-oxozeaenol dose-dependently reduced cell viability and TAK1 signaling through MKK7/JNK (23), which was similar to the effects observed with sorafenib (Fig. 4). Collectively, these findings demonstrate that HEKa are sensitive to genetic and pharmacological inhibition of TAK1.
Fig. 3. TAK1 is targeted by sorafenib in human primary keratinocytes (HEKa), leading to cell death.
(A) Kinase tree illustration showing the sorafenib (10 µM) kinase target signature in HEKa using a KiNativ in situ kinase assay. (B) HEKa were transfected with siRNA (25 nM) against the top 27 kinases identified a KiNativ in situ assay, and cell viability was measured 72 h later using CellTiter-Glo (3 experiments, n = 3). (C and D) HEKa were transfected with TAK1-targeted siRNA (25 nM, individual or pooled), and 72 h later (C) cell viability was measured using CellTiter-Glo (2 experiments, n = 16) and (D) Western blot analysis was performed using the indicated antibodies. (E) Inhibition of in vitro TAK1 kinase activity by various kinase inhibitors as determined using the Millipore KinaseProfiler assay (n = 2). Data represent the mean ± SEM (***, P<0.001).
Fig. 4. The selective TAK1 inhibitor 5z-7-oxozeaenol inhibits viability and TAK1 signaling of human primary keratinocytes (HEKa).
(A) HEKa were treated with increasing concentrations of 5z-7-oxozeaenol for 72 h and cell viability was measured using MTT (3 experiments, n = 18). Data represent the mean ± SEM. (B) HEKa were treated with increasing concentrations of 5z-7-oxozeaenol or sorafenib for 1 h and Western blot analysis was performed using the indicated antibodies.
In agreement with our in vitro data, sorafenib was demonstrated to potently inhibit TAK1 kinase activity (IC50 = 1.5 µM) (Fig. 3E). Additionally, other MKIs associated with HFSR were found to be active against TAK1 (IC50 range = 0.16–1.3 µM). In contrast, Bcr-Abl inhibitors did not inhibit TAK1 under the conditions tested, with the exception of dasatinib (IC50 = 51 µM) (Fig. 3E). However, at a clinically-achievable concentration (24), dasatinib displayed only low affinity for TAK1 in HEKa as assessed by in situ kinome profiling (Fig. 2B). In addition, the MKI sunitinib, which potently inhibited TAK1 activity (IC50 = 0.16 µM; Fig. 3E), displayed high affinity for TAK1 in situ (Fig. 2B). Both the in situ binding in keratinocytes and TAK1 kinase inhibition data are consistent with publically-available data for dissociation constants (Kd; Supplementary Fig. S3B) (19), and further suggest that the targeting of TAK1 may underlie the propensity of certain MKIs to cause HFSR.
Sorafenib-mediated keratinocyte toxicity in vivo
Recent studies have uncovered a role for TAK1 in the maintenance of keratinocyte homeostasis, with the most compelling evidence coming from mice with an epidermis-specific TAK1 deficiency. These mice display a phenotype characterized by hard, inflexible skin with widespread scaling (25). Likewise, inducible deletion of epidermal TAK1 in mice shows a phenotype of hyperkeratotic, scaling skin, the histopathology of which is similar to that observed in patients experiencing MKI-mediated HFSR (22). Moreover, TAK1-deficient mice show reduced hair follicle morphogenesis and hair follicle regrowth after depilation (26).
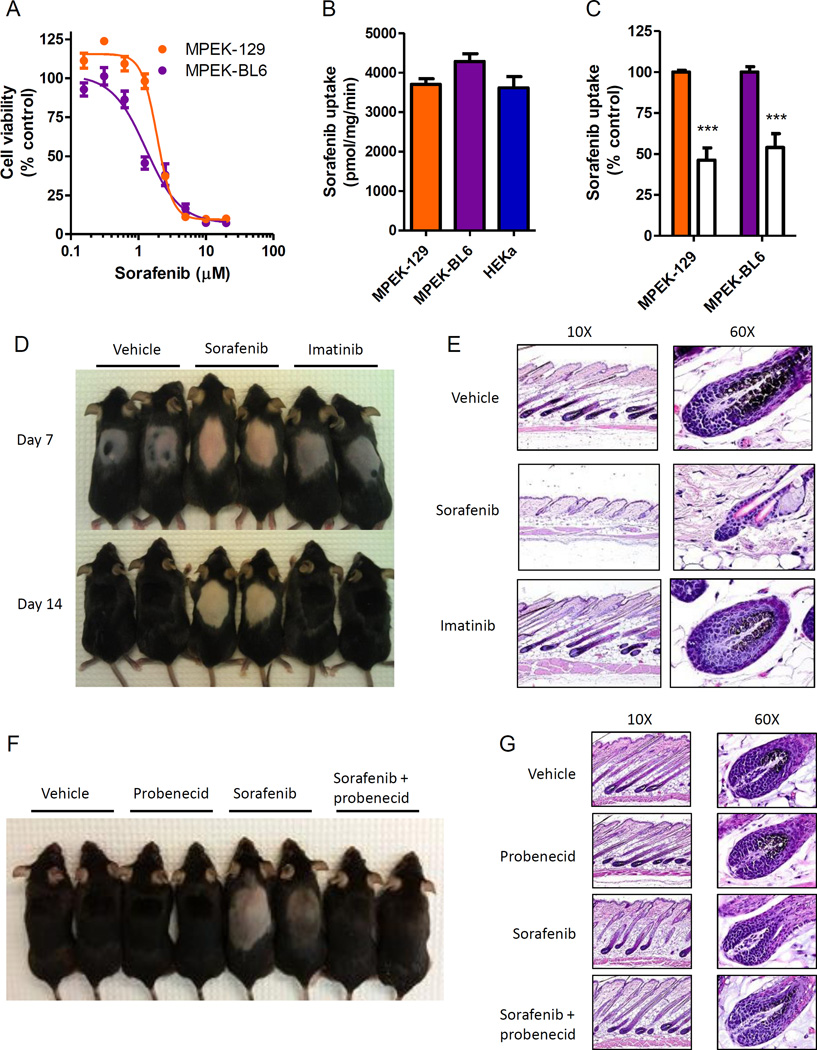
Similar to our observations in HEKa in vitro, we observed that mouse primary epithelial keratinocytes (MPEKs) are sensitive to sorafenib-induced cell death with an IC50 similar to that observed in HEKa [IC50 (mean ± SEM): 2.2 ± 0.02 and 1.5 ± 0.05 µM, MPEK-129 and MPEK-BL6 cells, respectively] (Fig. 5A). MPEK accumulate sorafenib to a similar extent compared to HEKa, and through a mechanism that is sensitive to probenecid (Fig. 5B,C). We next tested whether sorafenib can induce keratinocyte injury in vivo by determining its effects on hair follicle growth in mice after depilation. The hair follicle is a specialized mini-organ that is critically dependent on programmed keratinocyte differentiation (27, 28), and disruption of hair follicle cycling or morphology is indicative of keratinocyte toxicity. We hypothesized that this could be useful model for MKI-induced HFSR since immunostaining of biopsies from patients receiving sorafenib has shown loss of cytokeratin 10 (CK10) and increased cytokeratin 14 (CK14) expression, suggesting an effect on keratinocyte differentiation. Wax depilation of the dorsal hair of C57Bl/6 mice was performed to stimulate and synchronize hair follicle growth. Mice were then administered sorafenib or imatinib under treatment schedules that produce a clinically-relevant drug exposure (29, 30). One week after depilation, hair growth was delayed in sorafenib-treated animals, and at two weeks hair was less dense and lacked pigmentation in sorafenib-treated animals compared to control animals (Fig. 5D). In contrast to sorafenib, hair growth and pigmentation in imatinib-treated animals was similar to that of vehicle-treated animals (Fig. 5D). Histological assessment revealed that the skin of sorafenib-treated mice contained hair follicles that had reduced melanin and a gross disruption in morphology, including a reduced hair bulb diameter and enlarged outer root sheath, compared to the skin of vehicle- or imatinib-treated mice (Fig. 5E). However, under the applied conditions, no differences in the keratin and granular cell layers were observed in each of the 3 treatment groups (Supplementary Fig. S4). Both of these layers were increased in thickness in areas of skin with active hair growth (anagen), but the granular layer was absent in all inactive areas (telogen). Currently ongoing studies are focused on more prolonged treatment regimens to confirm the presence of such phenotypes.
Fig. 5. Sorafenib induces keratinocyte toxicity in vivo.
(A) Mouse primary epithelial keratinocytes (MPEK) derived from 129 (MPEK-129) and C57BL6 (MPEK-BL6) strains were treated with sorafenib for 72 h and cell viability was measured in a MTT assay (3 experiments, n = 18). (B) Intracellular accumulation of sorafenib (1 µM, 5 min) in MPEK or human primary keratinocytes (HEKa; 2 experiments, n = 4–6). (C) MPEK were incubated with probenecid (100 µM, 15 min) followed by co-incubation with sorafenib (1 µM, 15 min) and intracellular accumulation of sorafenib was measured (2 experiments, n = 6) (filled bars: without probenecid). Data represent the mean ± SEM (***, P < 0.001). (D and E) Hair depilation was performed on female C57BL6 mice and mice were treated with twice daily oral administration of sorafenib (60 mg/kg), imatinib mesylate (100 mg/kg), or vehicle. (D) Representative mice are shown. (E) Longitudinal skin sections on day 14. H&E stain (representative images, 10× and 60× magnification). (F and G) Mice were treated with once daily oral administration of sorafenib (60 mg/kg) with or without intraperitoneal probenecid (100 mg/kg), or vehicle. (F) Representative mice are shown. (G) Longitudinal skin sections on day 14. H&E stain (representative images, 10× and 60× magnification).
To test whether inhibition of OAT6 can prevent the effects of sorafenib on hair follicle regrowth and morphology in vivo, depilated mice were treated with sorafenib and probenecid, and this co-treatment reversed the effects of sorafenib on hair follicle regrowth (Fig. 5F). Both hair follicle pigmentation and hair follicle morphology in mice that received sorafenib in combination with probenecid were similar to vehicle-treated mice (Fig. 5G). Pharmacokinetic studies were performed following administration of sorafenib with or without probenecid to ensure that probenecid did not alter the concentrations of sorafenib in plasma. The area under the plasma concentration-time curve (mean ± SEM) of sorafenib was 32.5 ± 10.9 µg×h/mL following single-agent sorafenib administration and 33.0 ± 17.0 µg×h/mL when sorafenib was co-administered with probenecid. This finding indicates that the observed toxicity phenotypes are not the result of a reduced systemic exposure of sorafenib caused by probenecid.
Probenecid as adjunct therapy during sorafenib treatment
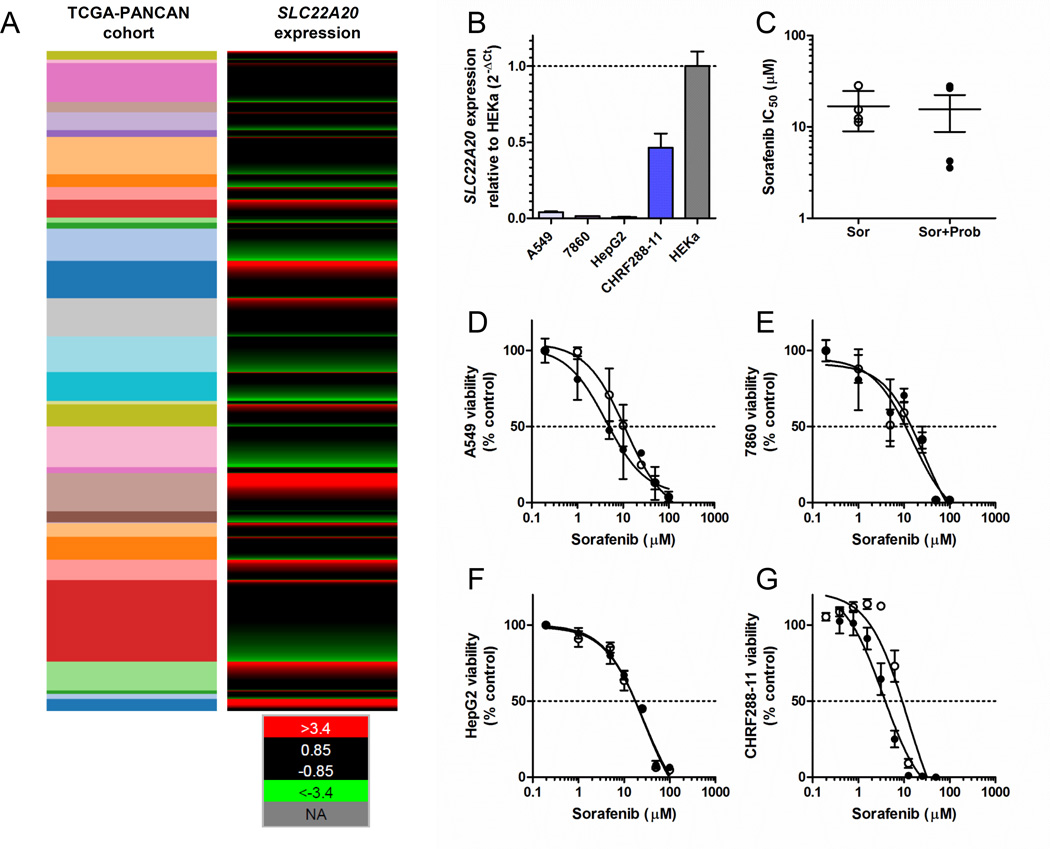
Combining sorafenib with OAT6 inhibitors such as probenecid could possibly reduce the incidence and severity of HFSR during anti-cancer therapy. However, it is important to establish that the anti-cancer efficacy of sorafenib is not reduced by probenecid. The success of such a combination therapy would most likely depend on two crucial factors, namely dosing/scheduling strategy and expression status of OAT6 in cancer cells. To gain preliminary insights, we first evaluated the OAT6 gene expression profile in 9755 human tumor specimens using normalized RNAseq data from 31 individual cancer cohorts from The Cancer Genome Atlas (TCGA). This analysis indicated that OAT6 is expressed at low or undetectable levels in samples associated with the main sorafenib indications, namely renal cell, hepatocellular, and thyroid carcinomas (Fig. 6A), whereas OAT6 is detectable in the majority of samples only in a single disease type, namely AML (Fig. 6A). A similar OAT6 expression pattern was observed in replicating cell lines representative of lung adenocarcinoma (A549), renal cell carcinoma (7860), hepatocellular carcinoma (HepG2), and AML (CHRF288-11) (Fig 6B), although in each cell line the expression was substantially lower than that observed in HEKa (Fig. 6B). Most importantly, in vitro experiments where cells were treated with the combination sorafenib-probenecid followed by MTT assays at 72 hours indicated that probenecid did not antagonize the cytotoxic effects of sorafenib under these conditions (Fig. 6C–G). This finding suggests that sorafenib can be taken up into cancer cells by one or more distinct carriers independently of OAT6, and that these presently unknown carriers are insensitive to probenecid-mediated inhibition. Although in vivo confirmation is required, these initial observations suggest that combining sorafenib with OAT6 inhibitors has the potential to reduce toxicities without compromising anticancer effects on tumor cells.
Fig. 6. The OAT6 inhibitor does not antagonize sorafenib-mediated cell death.
(A) Expression of the OAT6 gene SLC22A20 in 9755 human tumor specimens using normalized RNAseq data from 31 individual pan-cancer (PANCAN) cohorts from The Cancer Genome Atlas (TCGA). The expression values were normalized across cancer types, where the red color represents high gene expression values, values in green represent low gene expression, and black represents average expression. The cohorts shown (top to bottom) include: thymoma, uterine carcinosarcoma, thyroid cancer, testicular cancer, sarcoma, rectal cancer, prostate cancer, pheochromocytoma, pancreatic cancer, ovarian cancer, ocular melanoma, mesothelioma, melanoma, lung cancer (squamous), lung cancer (adeno), glioma, liver cancer, large B-cell lymphoma, kidney cancer (papillary), kidney cancer (clear cell), kidney chromophobe, head and neck cancer, glioblastoma, endometroid cancer, colon cancer, cervical cancer, breast cancer, bladder cancer, bile-duct cancer, adrenocortical cancer, and acute myeloid leukemia (AML). (B) OAT6 gene expression pattern in replicating cell lines representative of lung adenocarcinoma (A549), renal cell carcinoma (7860), hepatocellular carcinoma (HepG2), and AML (CHRF288-11) relative to expression in human keratinocytes. (C) Influence of probenecid (500 µM) on sorafenib-induced cytotoxicity (IC50) in the same cell lines using MTT assay. Individual growth curves are shown for A549 (D), 7860 (E), HepG2 (F), and CHRF288-11 (G). Bars or symbols represent the mean ± SEM (error bars) from 2 or 3 independent experiments (n = 8–18).
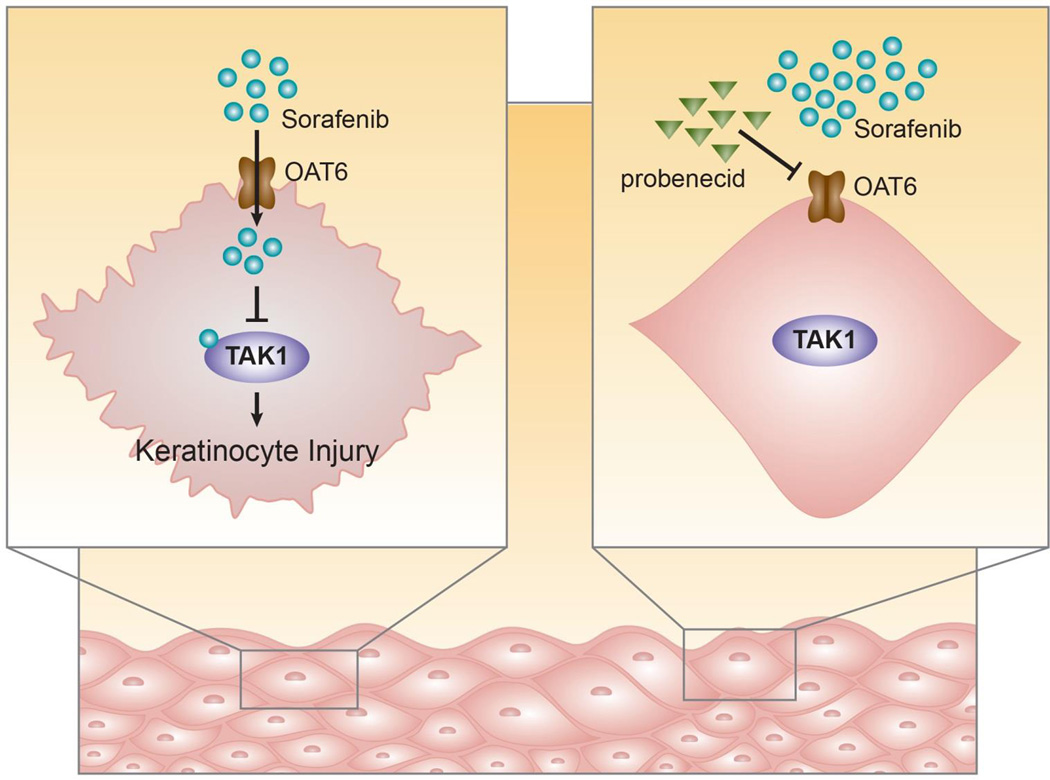
In summary, we identified OAT6 as a transporter regulating the uptake of sorafenib in keratinocytes, which resulted in cytotoxicity in vitro by a TAK1-dependent mechanism (Fig. 7). In vivo, sorafenib-dependent keratinocyte toxicity was observed as reduced hair follicle regrowth, loss of hair pigmentation, and altered hair follicle morphology. These findings not only shed light on the etiology of sorafenib-induced skin toxicity, but provide a rationale for the future development of new targeted interventions using transporter inhibitors to mitigate a debilitating side effect associated with MKIs.
Fig. 7. Proposed model of sorafenib-induced keratinocyte injury.
Schematic showing that sorafenib enters the keratinocyte through OAT6 and subsequently inhibits TAK1, leading to cytotoxicity and keratinocyte injury. These effects are blocked by the OAT6 inhibitor probenecid.
Supplementary Material
Acknowledgment
We thank Navjotsingh Pabla for helpful discussions.
Research support: This study was supported by the American Lebanese Syrian Associated Charities (ALSAC), National Institutes of Health Cancer Center Support Grants P30 CA021765, and R01 CA138744 (to S.D. Baker).
Footnotes
Disclosure of Potential Conflict of Interest
The authors declared no conflict of interest. The content is solely the responsibility of the authors and does not necessarily represent the official views of the funding agencies.
Authors’ Contributions
Conception and design: A. Sparreboom, S.D. Baker
Development of methodology: G. Du, S.S. Ong, T. Chen
Acquisition of data: E. Zimmerman, A.A. Gibson, S. Hu, A. Vasilyeva, S.J. Orwick, G. Mascara
Analysis and interpretation of data: E. Zimmerman, P. Vogel, H. Inaba, M.L. Maitland, A. Sparreboom. S.D. Baker
Writing, review, and/or revision of the manuscript: E. Zimmerman, M.L. Maitland, A. Sparreboom. S.D. Baker
Administration, technical, or material support: A.A. Gibson, S.J. Orwick
Study supervision: S.D. Baker
REFERENCES
- 1.Drenberg CD, Baker SD, Sparreboom A. Integrating clinical pharmacology concepts in individualized therapy with tyrosine kinase inhibitors. Clin Pharmacol Ther. 2013;93:215–219. doi: 10.1038/clpt.2012.247. [DOI] [PubMed] [Google Scholar]
- 2.Macdonald JB, Macdonald B, Golitz LE, LoRusso P, Sekulic A. Cutaneous adverse effects of targeted therapies: Part I: Inhibitors of the cellular membrane. J Am Acad of Dermatol. 2015;72:203–218. doi: 10.1016/j.jaad.2014.07.032. [DOI] [PubMed] [Google Scholar]
- 3.Inaba H, Rubnitz JE, Coustan-Smith E, Li L, Furmanski BD, Mascara GP, et al. Phase I pharmacokinetic and pharmacodynamic study of the multikinase inhibitor sorafenib in combination with clofarabine and cytarabine in pediatric relapsed/refractory leukemia. J Clin Oncol. 2011;29:3293–3300. doi: 10.1200/JCO.2011.34.7427. [DOI] [PMC free article] [PubMed] [Google Scholar]
- 4.Lipworth AD, Robert C, Zhu AX. Hand-foot syndrome (hand-foot skin reaction, palmar-plantar erythrodysesthesia): focus on sorafenib and sunitinib. Oncology. 2009;77:257–271. doi: 10.1159/000258880. [DOI] [PubMed] [Google Scholar]
- 5.Jain L, Gardner ER, Figg WD, Chernick MS, Kong HH. Lack of association between excretion of sorafenib in sweat and hand-foot skin reaction. Pharmacotherapy. 2010;30:52–56. doi: 10.1592/phco.30.1.52. [DOI] [PMC free article] [PubMed] [Google Scholar]
- 6.Anderson R, Jatoi A, Robert C, Wood LS, Keating KN, Lacouture ME. Search for evidence-based approaches for the prevention and palliation of hand-foot skin reaction (HFSR) caused by the multikinase inhibitors (MKIs) Oncologist. 2009;14:291–302. doi: 10.1634/theoncologist.2008-0237. [DOI] [PubMed] [Google Scholar]
- 7.Lacouture ME, Wu S, Robert C, Atkins MB, Kong HH, Guitart J, et al. Evolving strategies for the management of hand-foot skin reaction associated with the multitargeted kinase inhibitors sorafenib and sunitinib. Oncologist. 2008;13:1001–1011. doi: 10.1634/theoncologist.2008-0131. [DOI] [PubMed] [Google Scholar]
- 8.Baker SD, Zimmerman EI, Wang YD, Orwick S, Zatechka DS, Buaboonnam J, et al. Emergence of polyclonal FLT3 tyrosine kinase domain mutations during sequential therapy with sorafenib and sunitinib in FLT3-ITD-positive acute myeloid leukemia. Clin Cancer Res. 2013;19:5758–5768. doi: 10.1158/1078-0432.CCR-13-1323. [DOI] [PMC free article] [PubMed] [Google Scholar]
- 9.Muller-Rover S, Handjiski B, van der Veen C, Eichmuller S, Foitzik K, McKay IA, et al. A comprehensive guide for the accurate classification of murine hair follicles in distinct hair cycle stages. J Invest Dermatol. 2001;117:3–15. doi: 10.1046/j.0022-202x.2001.01377.x. [DOI] [PubMed] [Google Scholar]
- 10.Patricelli MP, Nomanbhoy TK, Wu J, Brown H, Zhou D, Zhang J, et al. In situ kinase profiling reveals functionally relevant properties of native kinases. Chem Biol. 2011;18:699–710. doi: 10.1016/j.chembiol.2011.04.011. [DOI] [PMC free article] [PubMed] [Google Scholar]
- 11.Patricelli MP, Szardenings AK, Liyanage M, Nomanbhoy TK, Wu M, Weissig H, et al. Functional interrogation of the kinome using nucleotide acyl phosphates. Biochemistry. 2007;46:350–358. doi: 10.1021/bi062142x. [DOI] [PubMed] [Google Scholar]
- 12.Goldman M, Craft B, Swatloski T, Cline M, Morozova O, Diekhans M, et al. The UCSC Cancer Genomics Browser: update 2015. Nucleic Acids Res. 2015;43:D812–D817. doi: 10.1093/nar/gku1073. [DOI] [PMC free article] [PubMed] [Google Scholar]
- 13. [Accessed: June 3, 2015];UCSC Xena. see: https://genome-cancer.soe.ucsc.edu/proj/site/xena/heatmap/
- 14.Yamamoto K, Mizumoto A, Nishimura K, Uda A, Mukai A, Yamashita K, et al. Association of toxicity of sorafenib and sunitinib for human keratinocytes with inhibition of signal transduction and activator of transcription 3 (STAT3) PloS One. 2014;9:e102110. doi: 10.1371/journal.pone.0102110. [DOI] [PMC free article] [PubMed] [Google Scholar]
- 15.Zimmerman EI, Hu S, Roberts JL, Gibson AA, Orwick SJ, Li L, et al. Contribution of OATP1B1 and OATP1B3 to the disposition of sorafenib and sorafenib-glucuronide. Clin Cancer Res. 2013;19:1458–1466. doi: 10.1158/1078-0432.CCR-12-3306. [DOI] [PMC free article] [PubMed] [Google Scholar]
- 16.Li FY, Nikali K, Gregan J, Leibiger I, Leibiger B, Schweyen R, et al. Characterization of a novel human putative mitochondrial transporter homologous to the yeast mitochondrial RNA splicing proteins 3 and 4. FEBS Lett. 2001;494:79–84. doi: 10.1016/s0014-5793(01)02319-5. [DOI] [PubMed] [Google Scholar]
- 17.VanWert AL, Gionfriddo MR, Sweet DH. Organic anion transporters: discovery, pharmacology, regulation and roles in pathophysiology. Biopharm Drug Dispos. 2010;31:1–71. doi: 10.1002/bdd.693. [DOI] [PubMed] [Google Scholar]
- 18.Schnabolk GW, Youngblood GL, Sweet DH. Transport of estrone sulfate by the novel organic anion transporter Oat6 (Slc22a20) Am J Physiol Renal Physiol. 2006;291:F314–F321. doi: 10.1152/ajprenal.00497.2005. [DOI] [PMC free article] [PubMed] [Google Scholar]
- 19.Davis MI, Hunt JP, Herrgard S, Ciceri P, Wodicka LM, Pallares G, et al. Comprehensive analysis of kinase inhibitor selectivity. Nat Biotechnol. 2011;29:1046–1051. doi: 10.1038/nbt.1990. [DOI] [PubMed] [Google Scholar]
- 20.Lyons JF, Wilhelm S, Hibner B, Bollag G. Discovery of a novel Raf kinase inhibitor. Endocr Relat Cancer. 2001;8:219–225. doi: 10.1677/erc.0.0080219. [DOI] [PubMed] [Google Scholar]
- 21.Lam CR, Tan MJ, Tan SH, Tang MB, Cheung PC, Tan NS. TAK1 regulates SCF expression to modulate PKBalpha activity that protects keratinocytes from ROS-induced apoptosis. Cell Death Differ. 2011;18:1120–1129. doi: 10.1038/cdd.2010.182. [DOI] [PMC free article] [PubMed] [Google Scholar]
- 22.Omori E, Morioka S, Matsumoto K, Ninomiya-Tsuji J. TAK1 regulates reactive oxygen species and cell death in keratinocytes, which is essential for skin integrity. J Biol Chem. 2008;283:26161–26168. doi: 10.1074/jbc.M804513200. [DOI] [PMC free article] [PubMed] [Google Scholar]
- 23.Ninomiya-Tsuji J, Kishimoto K, Hiyama A, Inoue J, Cao Z, Matsumoto K. The kinase TAK1 can activate the NIK-I kappaB as well as the MAP kinase cascade in the IL-1 signalling pathway. Nature. 1999;398:252–256. doi: 10.1038/18465. [DOI] [PubMed] [Google Scholar]
- 24.Demetri GD, Lo Russo P, MacPherson IR, Wang D, Morgan JA, Brunton VG, et al. Phase I dose-escalation and pharmacokinetic study of dasatinib in patients with advanced solid tumors. Clin Cancer Res. 2009;15:6232–6240. doi: 10.1158/1078-0432.CCR-09-0224. [DOI] [PubMed] [Google Scholar]
- 25.Omori E, Matsumoto K, Sanjo H, Sato S, Akira S, Smart RC, et al. TAK1 is a master regulator of epidermal homeostasis involving skin inflammation and apoptosis. J Biol Chem. 2006;281:19610–19617. doi: 10.1074/jbc.M603384200. [DOI] [PMC free article] [PubMed] [Google Scholar]
- 26.Sayama K, Hanakawa Y, Nagai H, Shirakata Y, Dai X, Hirakawa S, et al. Transforming growth factor-beta-activated kinase 1 is essential for differentiation and the prevention of apoptosis in epidermis. J Biol Chem. 2006;281:22013–22020. doi: 10.1074/jbc.M601065200. [DOI] [PubMed] [Google Scholar]
- 27.Botchkarev VA, Paus R. Molecular biology of hair morphogenesis: development and cycling. J Exp Zool B Mol Dev Evol. 2003;298:164–180. doi: 10.1002/jez.b.33. [DOI] [PubMed] [Google Scholar]
- 28.Cotsarelis G. Epithelial stem cells: a folliculocentric view. J Invest Dermatol. 2006;126:1459–1468. doi: 10.1038/sj.jid.5700376. [DOI] [PubMed] [Google Scholar]
- 29.Hu S, Niu H, Inaba H, Orwick S, Rose C, Panetta JC, et al. Activity of the multikinase inhibitor sorafenib in combination with cytarabine in acute myeloid leukemia. J Natl Cancer Inst. 2011;103:893–905. doi: 10.1093/jnci/djr107. [DOI] [PMC free article] [PubMed] [Google Scholar]
- 30.Paniagua RT, Sharpe O, Ho PP, Chan SM, Chang A, Higgins JP, et al. Selective tyrosine kinase inhibition by imatinib mesylate for the treatment of autoimmune arthritis. J Clin Invest. 2006;116:2633–2642. doi: 10.1172/JCI28546. [DOI] [PMC free article] [PubMed] [Google Scholar]
Associated Data
This section collects any data citations, data availability statements, or supplementary materials included in this article.


