Abstract
Purpose
Diffusion Spectrum Imaging (DSI) has been shown to be an effective tool for non-invasively depicting the anatomical details of brain microstructure. Existing implementations of DSI sample the diffusion encoding space using a rectangular grid. Here we present a different implementation of DSI whereby a radially symmetric q-space sampling scheme for DSI (RDSI) is used to improve the angular resolution and accuracy of the reconstructed Orientation Distribution Functions (ODF).
Methods
Q-space is sampled by acquiring several q-space samples along a number of radial lines. Each of these radial lines in q-space is analytically connected to a value of the ODF at the same angular location by the Fourier slice theorem.
Results
Computer simulations and in vivo brain results demonstrate that RDSI correctly estimates the ODF when moderately high b-values (4000 s/mm2) and number of q-space samples (236) are used.
Conclusion
The nominal angular resolution of RDSI depends on the number of radial lines used in the sampling scheme, and only weakly on the maximum b-value. In addition, the radial analytical reconstruction reduces truncation artifacts which affect Cartesian reconstructions. Hence, a radial acquisition of q-space can be favorable for DSI.
Keywords: Diffusion Spectrum Imaging, RDSI, radial q-space acquisition, angular resolution
Introduction
Diffusion Spectrum Imaging (DSI) [1] characterizes the three-dimensional diffusion displacement of water molecules in a model-independent manner [1, 2] for each voxel of a 3D multislice MR scan. This model-free approach allows the direct determination of the Orientation Distribution Function (ODF) of the diffusion displacement [1] through sampling of the ODFs Fourier transform in the diffusion encoding space, also dubbed q-space [1]. DSI has been shown to non-invasively and accurately reflect the anatomical details of the microstructure of the brain, including the complex distributions of intravoxel fiber orientations desired for tractography [3, 4].
In addition to DSI, a range of other methods have been developed to characterize diffusion MR signals; these methods include Diffusion Tensor Imaging (DTI) [5–7], High Angular Resolution Diffusion Imaging (HARDI) [8] and Q-ball imaging [9]. Some of these methods rely on models characterizing the diffusion MR signals as originating from single (e.g. DTI [5–7]) or multiple fibers (e.g. [8]), whilst others, such as DSI and Q-ball imaging, do not make prior assumptions on the intravoxel fiber orientations. Although less demanding in terms of scantime and gradient performance, simpler models such as DTI, which mainly define the dominant fiber orientation of a voxel, cannot reflect the complex fiber patterns found in voxels of the human brain. These voxels can contain two but also more crossing fibers, dominant fiber bundles combined with smaller differently orientated fibers or ”kissing” fibers [7–10]. Such complex fiber distributions can be more accurately, albeit still incompletely, measured with methods such as DSI and Q-ball imaging. These approaches lead to highly detailed visualization of brain neural connectivity [2,3,11]. However, this comes at the cost of acquiring hundreds of q-space samples.
In identifying fiber crossings when studying intravoxel fiber distributions, the angular resolution (or the smallest crossing angle that can be resolved between two fibers) of the sampling geometry is crucial [2]. Current DSI implementations sample q-space on a rectangular grid. In this setting, the angular resolution is proportional to the spatial resolution of the ODF in the diffusion displacement space, or in practice, to the ratio of the q-space grid step size to the largest q-value sampled during data acquisition [2]. As a result, increased angular resolution requires larger q-space radii and a larger sampling matrix, resulting in a cubic increase of the number of required samples and acquisition time. Furthermore, for clinical applications, which are heavily constrained by scan time and gradient performance, the optimum maximum q-value is a trade-off between SNR and angular resolution [12].
Here we present a new methodology based on a radially symmetric q-space sampling scheme for DSI, dubbed Radial DSI (RDSI), which allows improving the angular resolution in a more efficient fashion than conventional Cartesian DSI. In this sampling scheme, a number nshell of q-space samples (nshell = number of shells) are acquired along a number of radial lines Nl. This has the advantage that every radial line sampled in q-space is directly connected to a value of the ODF at the same angular location in the spatial domain via the Fourier slice theorem (Figure 1a). As a result, for a given maximum q-value the nominal angular resolution is primarily determined by the number of radial lines along which samples are acquired rather than by the total number of shells. Hence, in theory, the angular resolution is less dependent on the number of shells (above a certain threshold). This can result in improved DSI reconstructions using a lower number of q-space samples, which, in turn might lead to shorter DSI acquisition times.
Figure 1.
a) Radially sampled DSI acquires several q-space samples S (e.g. 4) along several radial lines. Each of these radial lines in q-space (qx, qy, qz) can be transformed to the value of the PDF p at the same radial line in the displacement space (Rx, Ry) using the Fourier slice theorem. b) The directions of the these radial lines are evenly distributed on a number of circles separated by an angle α enveloping a half sphere.
The radial sampling of q-space also has the benefit that it reduces the effects of truncation artifacts present in the conventional rectangular sampling of q-space for DSI. These artifacts include truncation artifacts in the Fourier transform which often require the use of a Hanning Filter to smooth the diffusion Probability Distribution Function (PDF) [12, 13] and possible artifacts introduced in the mapping between cartesian and spherical coordinates when extracting the ODF from the PDF [9]. In contrast, RDSI has the advantage that both sampling and reconstruction are performed in spherical coordinates, thereby bypassing the need to convert from a cartesian to a spherical grid. In addition, possible Fourier truncation artifacts in RDSI occur equally in all radial directions, hence avoiding the creation of false peaks. The RDSI reconstruction scheme is also different from multi-shell q-ball imaging approaches [14, 15], since the ODF is reconstructed exactly rather than approximated as in the standard q-ball approach [16].
In this paper we present and demonstrate the theoretical framework that allows the exact computation of the RDSI ODF from the measured q-space data and illustrate the advantageous scaling of the nominal angular resolution with the number of acquired samples. We also demonstrate salient features of this method using Monte Carlo simulations and in vivo brain studies.
Methods
Theory
Diffusion Spectrum Imaging
Diffusion weighted MRI images W(r⃗, q⃗) sample the average propagator pΔ(r⃗, R⃗), which indicates the probability that within the diffusion time Δ a water proton would diffuse a distance R⃗ within the voxel at location r⃗, [1]
| (1) |
with ρ the spin density, q⃗ = γG⃗δ/ 2π the q-space diffusion weighting, γ the gyromagnetic ratio and G⃗ and δ the strength and duration of the diffusion-encoding gradient. The Probability Density Function (PDF) pΔ(r⃗, R⃗), inferred from images W(r⃗, q⃗) for different q-values, can be compiled across a range of displacement distances L to the Orientation Distribution Function (ODF) [2]
| (2) |
with L the diffusion sampling length and û the unit vector in the direction specified by (θ, ϕ). Hence, the ODF is the weighted integral of the values of the water displacement function along a line through the origin in the direction of û. As such, the maxima of the ODF point in the preferential directions of diffusion in the voxel, i.e. the fiber directions. When these preferential diffusion directions are combined, they can be tracked across space to provide an estimate of the fiber architecture. Note that both PDF and ODF lend themselves naturally to be expressed in spherical coordinates (θ, ρ), particularly the ODF which thus points to the underlying fiber directions within the voxel. In traditional cartesian sampled DSI, diffusion weighted images W are acquired with the q-space diffusion weighting q⃗ sampled on a cartesian grid and the PDF is calculated in a similar cartesian grid in the displacement space R⃗ using the Fourier transform (Eq. (1)). This necessitates an interpolation step in the calculation of the ODF from the PDF (Eq. (2)).
Radial Diffusion Spectrum Imaging
Since q-space is sampled along radial lines in RDSI, the three-dimensional Fourier transform in Eq. (1) can be exchanged for the one-dimensional Fourier transform of the Radon transform, according to the Fourier slice theorem (also known as the Projection slice theorem [17]). The one-dimensional simplification to line projections [18] and a numerical approach missing the L2-weighting [19] were previously studied, though an analytic formulation was not derived. Using the Fourier slice theorem, Eq. (1) can be rewritten as (Appendix A)
| (3) |
where S(r⃗, q⃗) equals W(r⃗, q⃗) with ρ(r⃗) normalized out, û = q⃗/‖q⃗‖, ξû is substituted for q⃗ and R3D is the three-dimensional radon transform
| (4) |
with δ(t) the Dirac delta function. Substituting equations (3) and (4) in the ODF calculation (2), it can be shown that (Appendix B, [20])
| (5) |
with F(q⃗, û) the geometric encoding matrix
| (6) |
and Rm the maximum displacement distance being probed (Rm = 1/(Δq) with Δq the stepsize along the radial line). Equation (5) allows the analytical calculation of the ODF from the normalized measured images S(r⃗, q⃗) through a direct matrix multiplication with the geometric encoding matrix F(q⃗, û). This formula is mathematically equivalent to the L2 weighted basis function described by Yeh et al. [21] as an alternative for Generalized Q-sampling Imaging (GQI). The RDSI approach, however, differs from GQI in that it is based on an exact and direct analytical derivation of the ODF for a radially symmetric distribution of q-space samples. In this setting, the sharpness of the ODF-contour can be controlled by changing the maximum displacement distance Rm [21]. An increased Rm will produce sharper contours and vice versa.
Filtering
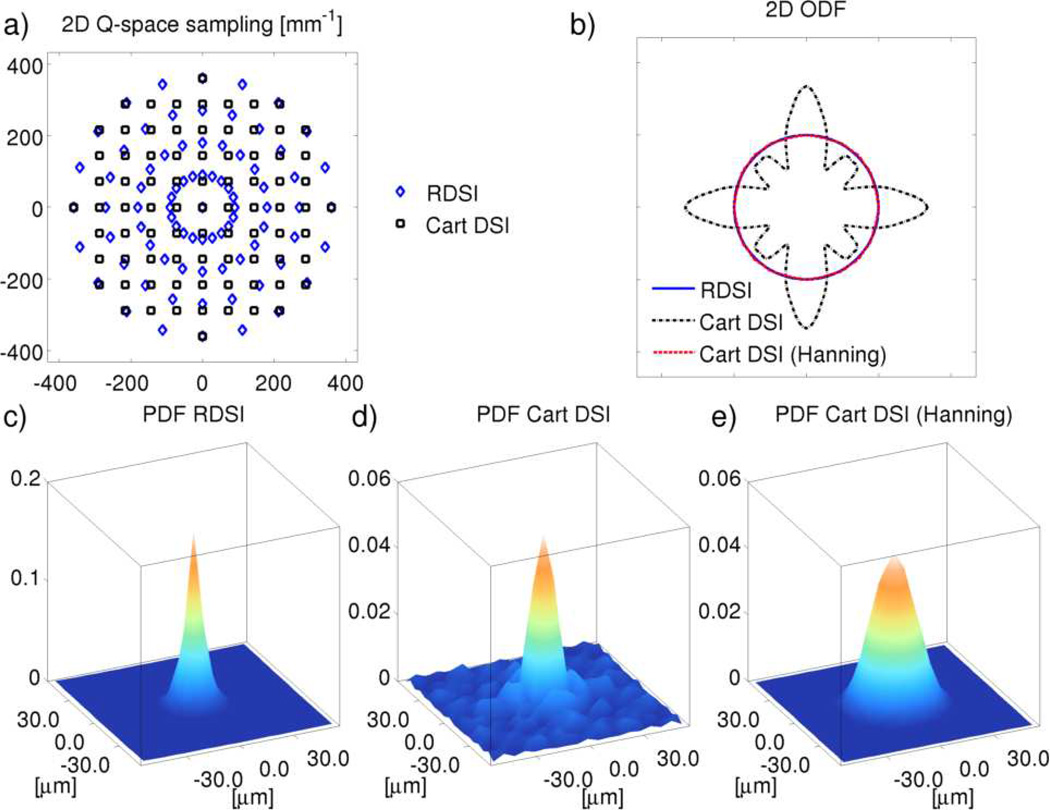
In Cartesian DSI it is common to apply a Hanning Filter to the acquired q-space [2] to avoid truncation artifacts [12, 13] which become more prevalent for smaller grid sizes. This is illustrated in two dimensions in Figure 2 which shows the response of DSI reconstructions to an impulse PDF signal. The impulse PDF represents a voxel with extremely low isotropic diffusion, giving rise to a uniform q-space measurement. As such, the resulting ODF and PDF can be seen as the Point Spread Function (PSF)-response of the reconstruction methods. The effect of the truncation artifacts is easily understood by looking at their origin, the Gibbs ringing artifacts [22–24] of the Discrete Fourier Transforms (DFT) used in DSI. In Cartesian DSI, the 3D-DFT Gibbs ringing artifacts appear unevenly throughout the Cartesian PDF (Figure 2d) giving rise to spurious peaks in the ODF (Figure 2b). These effects are usually mitigated by applying a Hanning Filter (Figure 2e) at the cost of blurring the PDF [12, 13]. On the other hand, Gibbs ringing artifacts of the 1D-DFT in RDSI, which is analytically calculated along the radial direction, are less harmfull as they appear along the radial direction. Consequently, these artifacts do not advantage any particular direction, preserving the directionality of the PDF (Figure 2c) and the ODF (Figure 2b). In addition, the 1D-DFT in RDSI is calculated analytically (Appendix B), replacing the discrete sum of 1D-DFT with a convolution with an analytic function further reducing the impact of Gibbs ringing.
Figure 2.
Illustrative calculated two-dimensional ODFs (b) and PDFs (c–e) of an impulse PDF measured (a: q-space sampling) and reconstucted by RDSI (b,c) and traditional Cartesian DSI (b,d,e). The Cartesian DSI reconstruction suffers from truncation (Gibbs ringing) artifacts of the 3D-DFT (b,d; 2D-FFT in this illustration), which are usually mitigated by applying a Hanning filter (b,e). In Radial DSI the truncation artifacts of the 1D-DFT, if present, manifest in the radial direction, not affecting the directionality of the ODF and PDF.
Angular Resolution
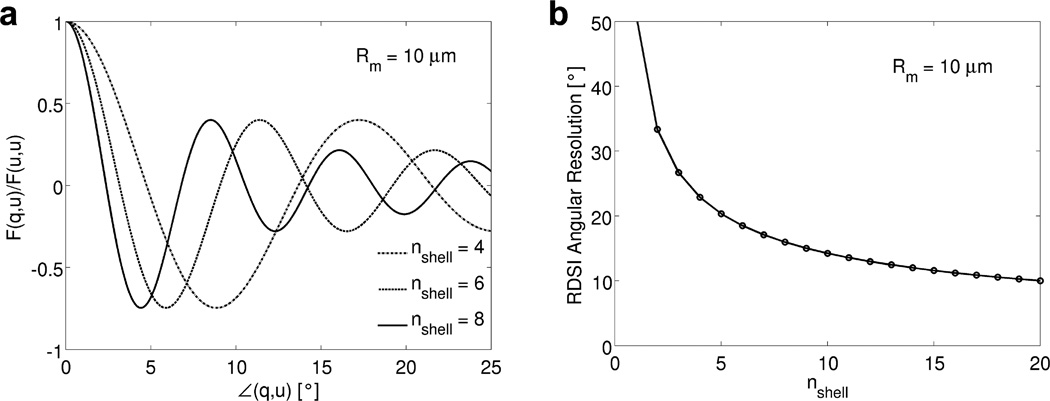
The angular resolution of a fiber-tracking experiment, the smallest crossing angle that can be resolved between two fibers, is commonly estimated to be on the order of the width of the peak of the ODF(r⃗, θ, ϕ) assessed by its full width at half maximum (FWHM) value [16]. For RDSI, the ODF of an ideal single fiber bundle which only exhibits signal in one direction and has Quantitative Anisotropy (QA, [21]) 1 is the geometric encoding matrix F(q⃗, û) (Equation (6), plotted in Figure 3a) and its FWHM can be evaluated as the solution of [16]
| (7) |
where θmax and θmin are the angles of the ODF peak and its minimum value. Using equation (7) the effective angular resolution can be calculated (Figure 3b) illustrating that the resolution of a fiber-tracking experiment is limited by the maximum b-value that can be measured. However, when the b-value is larger than a threshold, the relative gain in angular resolution decreases as the b-value is further increased. From Figure 3b it can also be seen that at clinically feasible b-values, e.g. 4000–8000 s/mm2 (i.e. 4–8 shells in q-space), 50–90 radial lines suffice for RDSI to fully sample q-space at the highest clinically feasible b-values. For example, with 4-shells and a maximum b-value of 4000 s/mm2, the RDSI angular resolution is 22.9° necessitating at least 4π/ (angular resolution)2 or 79 radial lines to sample a whole sphere or 40 radial lines for a half sphere in q-space.
Figure 3.
(a) The normalized reconstruction kernel F (Equation (6)), or geometric encoding matrix, of the RDSI reconstruction with nshell shells probing a displacement distance Rm = 10µm (or Δq = 1/Rm = 100mm−1, i.e. for nshell = 4 the qmax is 400mm−1) as a function of the angle ∠(q, u) between an ideal single fiber bundle, along q⃗, and the ODF direction û for different b-values. (b) Angular resolution of the Radial DSI reconstruction, estimated as the FWHM of the ODF peak (Equation (7)).
ODF normalization
To emphasize the structure of the ODFs, the ODFs reconstructed using the relation in Equation (5) are min-max normalized [9] to nODFs
| (8) |
after discarding the few negative values in ODF(r⃗, θ, ϕ) caused by noise and misestimates of the q-values (negative values are replaced by 0). This normalization amplifies the diffusion peaks of the ODF which would otherwise be relatively small with respect to the baseline. Fiber directions are identified as the local maxima of the nODFs [21]. For each fiber direction a⃗ identified in the nODFs, the Quantitative Anisotropy (QA, [21])
| (9) |
is calculated. This normalization of the QA relates each fiber direction to the whole resolved fiber population rather than only to the fiber directions in the same voxel unlike the FA or the Generalized Fractional Anisotropy (GFA, [9]).
Radial line distribution
The endpoints of the radial lines can be distributed on a sphere using a number of methods, similar to the selection of diffusion directions in DTI, Q-ball or other diffusion sampling methods [25]. Here the directions of the Nl radial lines are evenly distributed on a number of circles centering on the same axis enveloping a half sphere. These circles are separated by the spherical angle and each contains round(2π sin(γ)/α) equidistantly spaced radial line endpoints with γ the polar angle between the central axis and the circle (i.e. γ is a multiple of α) (Figure 1b).
Experimental details
RDSI datasets were acquired of in vivo brain tissue of healthy volunteers using a single-shot twice-refocused spin echo sequence [26] under the auspices of an Institudional Review Board approved protocol. The radial sampling scheme applied here acquires 236/344 samples arranged on 59/86 radial lines distributed on a radius 4 half sphere as discussed in the Theory section. The RDSI acquisitions were performed on a clinical 3T scanner (Skyra, Siemens, Erlangen) with a 32-channel head coil using sequence parameters: bmax = 4000 s/mm2, qmax = 360 mm−1, Δq = 89 mm−1, TE/TR = 114/4500 ms, 2.3×2.3×2.3 mm resolution, field of view 220×220 mm, 46 slices, multiband acceleration of 2 [27], one b0 acquisition, 1 average, 18:16min/26:37min. qmax is in the range of literature values for DSI (100 mm−1 [2], 328 mm−1 [12]) whilst Δq falls in the range of Δq-values and q-values used for single shell acquisitions (20 mm−1 [2], 52.5 mm−1 [9], 60 mm−1 [15] and 640/750 mm−1 [13]). Reconstructions were performed offline using custom-made software (Matlab, Mathworks) and displayed using Matlab and DSI Studio [21]. For tractography, a modified streamline tracking algorithm was used as implemented in DSI Studio (http://dsi-studio.labsolver.org). This algorithm was modified from [28] to use multiple fiber orientations at each voxel. Seeding points were uniformly distributed in the whole brain or in user-defined seeding regions (a circular region in the superior region of the internal capsule) until a predetermined number of fibers was generated (500000 and 50000 respectively). The fiber propagation process ended when either the turning angle became larger than 60° or the anisotropy value fell below a threshold value (QA < 0.1) in that voxel. Fibers shorter than 30 mm were discarded.
Simulations
ODFs of a single fiber and two crossing fibers (angle set at 60° or chosen randomly) and a water pool (10%) were simulated [8, 21] as measured with RDSI at different b-values (number of q-space shells adapted to the b-value with one q-space shell per 1000 s/mm2, e.g. 4 q-space shells for b = 4000 s/mm2; b = 3 – 16 103 s/mm2, qmax = 312 – 720 mm−1, Δq = 104 – 45 mm−1) and with different numbers of radial lines Nl (28 – 533) (q-space samples = nshell × Nl radial lines, 10000 ODFs for each sampling scheme). Additionally, q-space was also sampled in a Cartesian fashion (half sphere, number of q-space shells so that number of q-space samples ≥ number of radial q-space samples for equal b-value). For each ODF Rician noise was added to give the desired SNR in the non-diffusion-attenuated signal [9] and an RDSI or Cartesian DSI reconstruction was performed evaluating the ODFs on 642 points uniformly distributed on a sphere. In order to reconstruct radially sampled q-space data with Cartesian DSI, q-space was interpolated using a thin plate spline Radial Basis Function. RDSI reconstruction of Cartesian data was performed without interpolation. Reconstruction results of simulated crossing fiber ODFs with random directions and set crossing angle were compared using the normalized RMSE error (NRMSE) and the Jensen-Shanon Divergence (JSD) [29] relative to the mean ODFs of highest b-value simulation. In addition, 95% Confidence Intervals [30] were calculated for the first and second identified fiber directions. The reconstruction performance in the case of crossing fibers with random crossing angles is evaluated using the indices angular precision and angular dispersion [12]. The latter assesses the uncertainty of mapping fiber orientations or angular accuracy [12]. In a last analysis, the detected angles of the randomly oriented crossing pairs of fibers are compared to the simulated angles between the crossing fibers. In order to avoid picking up on small spurious peaks when the two crossing fibers are too close to distinguish as separate peaks, a QA-threshold of 0.002 was used.
Results
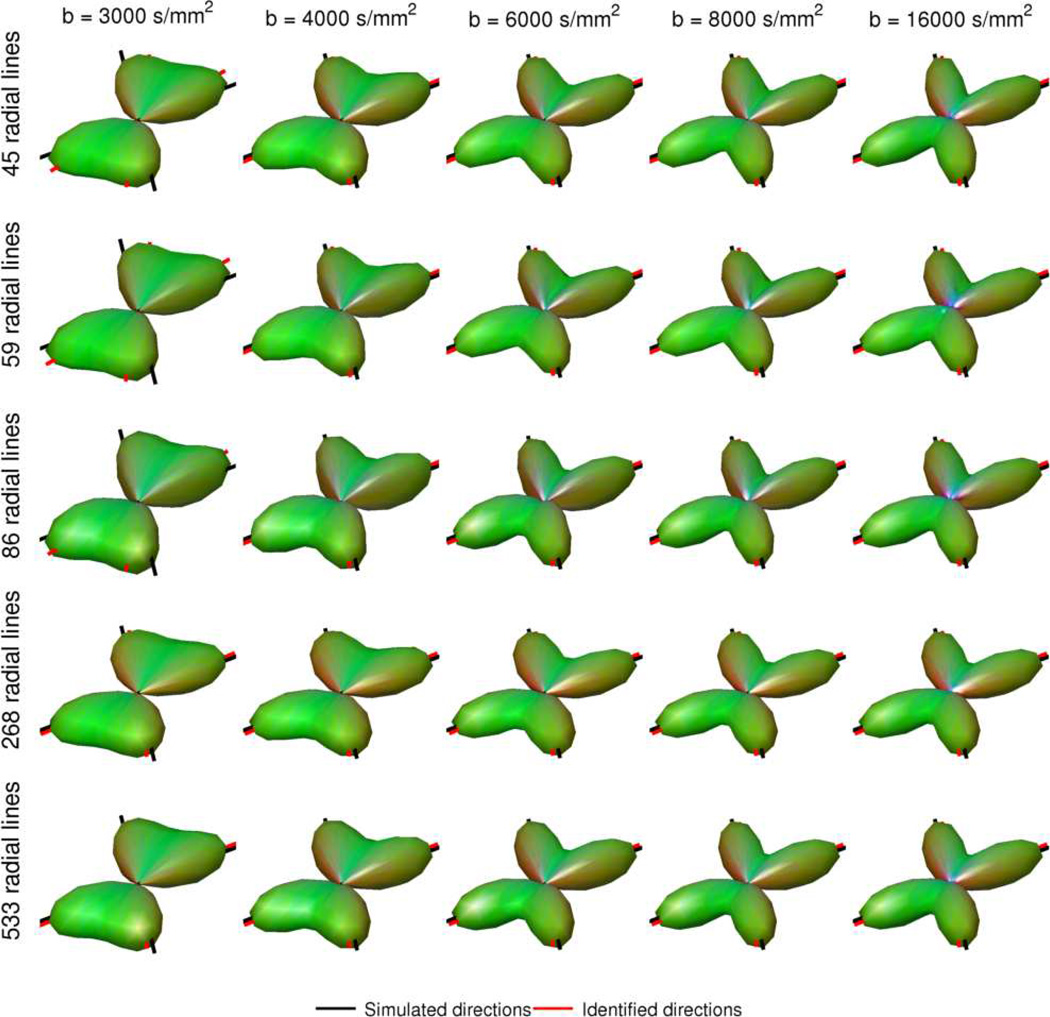
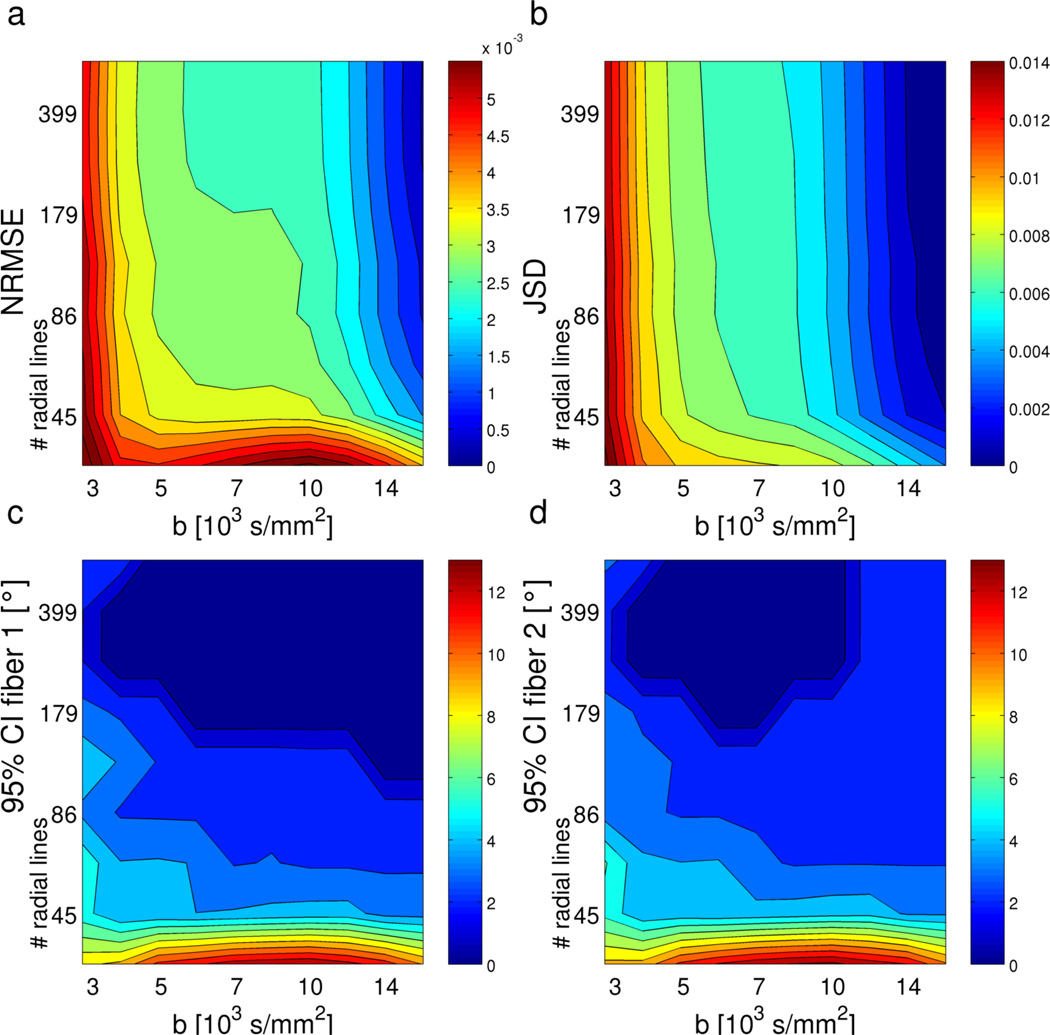
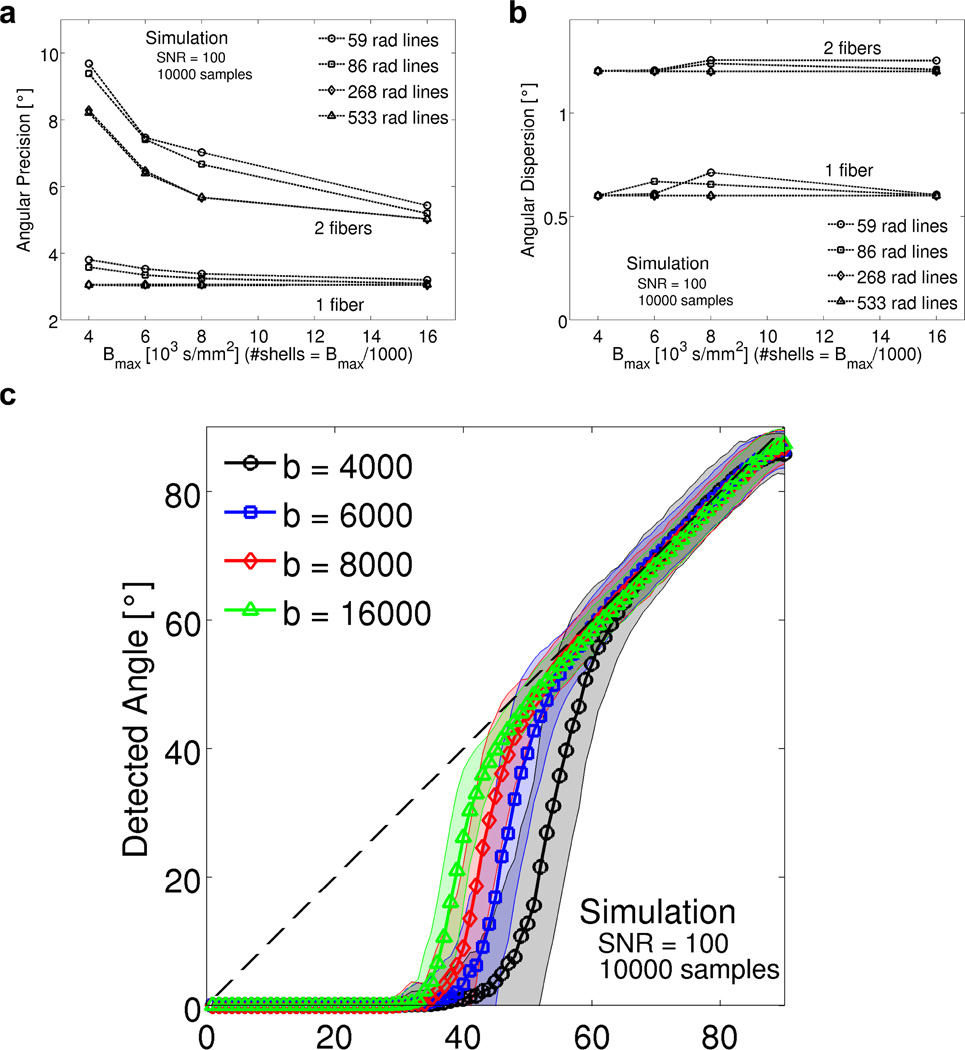
RDSI reconstruction simulation results are displayed in figures 4, 5 and 6. The reconstructed ODFs at different b-values using different numbers of radial lines (Figure 4) illustrate the ability of RDSI to correctly identify two crossing fibers (angle 60°) using the different sampling schemes. This ability increases slightly with b-value, but is less dependent on the number of radial lines acquired as suggested in the Theory section. The group analysis (Figure 5), using metrics such as the NRMSE, JSD and 95% confidence intervals supports these observations, further demonstrating the ability of RDSI to correctly sample crossing fibers at clinically feasible b-values of 4000 s/mm2. In a second simulation setup, one or two fibers were randomly generated in order to estimate angular precision (Figure 6a) and angular dispersion (Figure 6b) of the RDSI sampling scheme. Where angular dispersion, which can be seen as a measure of the angular accuracy, is independent of the b-value, the angular precision for the case of crossing fibers decreases as the b-value increases. Another view of the results of this simulation compares the angle detected in the ODF with the simulated crossing fiber angle (Figure 6c). As expected, the simulated angle is correctly identified when the fibers cross perpendicular or nearly perpendicular and the identification precision decreases as the crossing fiber angle decreases. From Figure 6c, the increase in angular resolution with increasing b-value can be intuitively understood.
Figure 4.
Simulated RDSI reconstructed ODFs of two crossing fibers (angle 60°) sampled at several b-values (nshell = b-values/1000) and at different numbers of radial lines Nl. (SNR = 33) (q-space samples = nshell × Nl).
Figure 5.
Simulated RDSI reconstruction performance of two crossing fibers (angle 60°) at different b-values (number of shells nshell = b-values/1000) and with different numbers of radial lines Nl (10000 simulated ODFs per sampling scheme). The reconstruction performance is indicated by the mean normalized RMSE error (NRMSE) and the mean Jensen-Shannon divergence (JSD) of the ODFs relative to the highest b-value simulation, and the 95% confidence intervals (CI) of the identified first and second fiber directions. (SNR = 33).
Figure 6.
a) Angular precision and b) angular dispersion of simulated RDSI reconstructions of one and two fibers (random angle) as a function of the b-values (number of shells nshell = b-values/1000) and number of radial lines Nl used. c) Detected versus simulated crossing fiber angle for 10000 randomly oriented pairs of fibers; the solid line indicates the mean detected angle at each simulated angle, whilst the interval indicates the standard deviation. (SNR = 100).
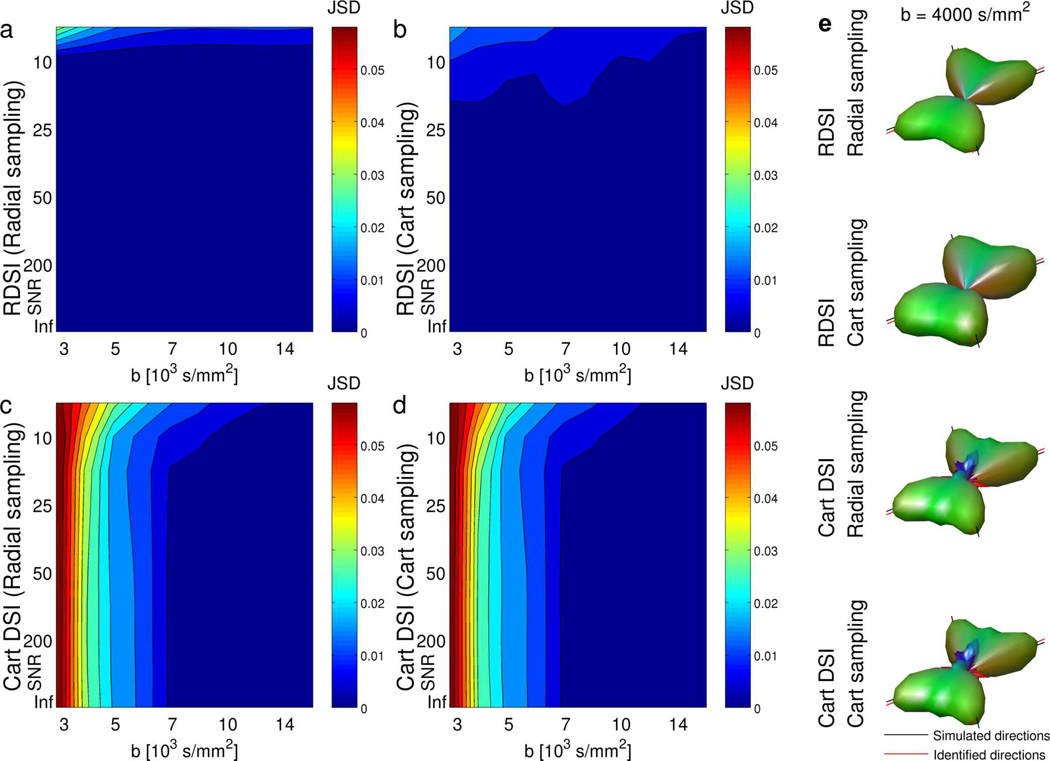
The RDSI ODF calculation as presented here constists of two components, radial sampling of q-space and the RDSI reconstruction (eq. (5)). The beneficial properties of both components are additive. Figure 7 shows that RDSI reconstruction of radially sampled q-space leads to better results than RDSI reconstruction of Cartesian sampled q-space. For Cartesian reconstruction, where the radially sampled data has to be interpolated to a Cartesian grid, the results are similar for both q-space sampling schemes, showing some additional smaller peaks due to the radial integration of the Cartesian sampled PDF. The latter interpolation is avoided in the purely radial RDSI reconstructions.
Figure 7.
Performance of simulated RDSI (a,b) and Cartesian DSI (c,d) reconstructions of Radial (a,c) and Cartesian (b,d) sampled q-spaces of two crossing fibers (angle 60°) at different b-values (number of shells nshell = b-values/1000, Radial q-space samples = nshell × 59 radial lines Nl, number of Cartesian shells so that number of q-space samples ≥ Radial samples, both half sphere) and different levels of SNR (10000 simulated ODFs per data point) as measured by the mean Jensen-Shannon divergence (JSD) of the ODFs relative to the highest b-value simulation. (e) Example ODFs from the same simulation reconstructed by RDSI and Cartesian DSI from Radial and Cartesian sampled q-spaces (SNR = 33,Radial: 236 q-space samples on 59 radial lines, Cartesian: 257 q-space samples on 4 shells, both half sphere).
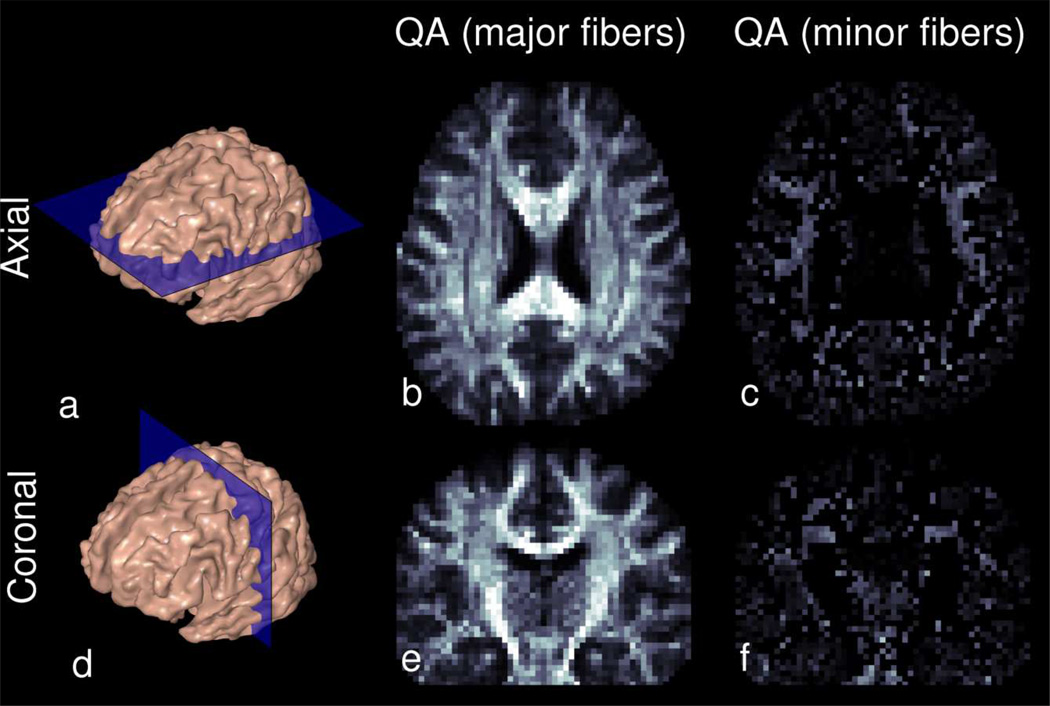
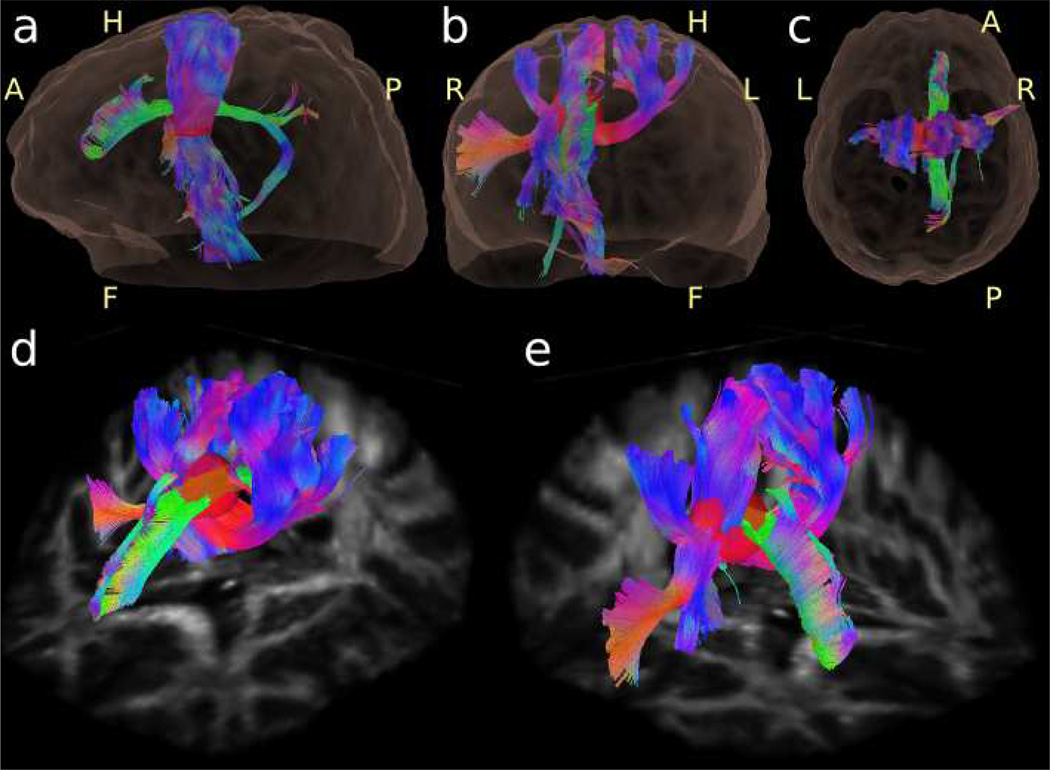
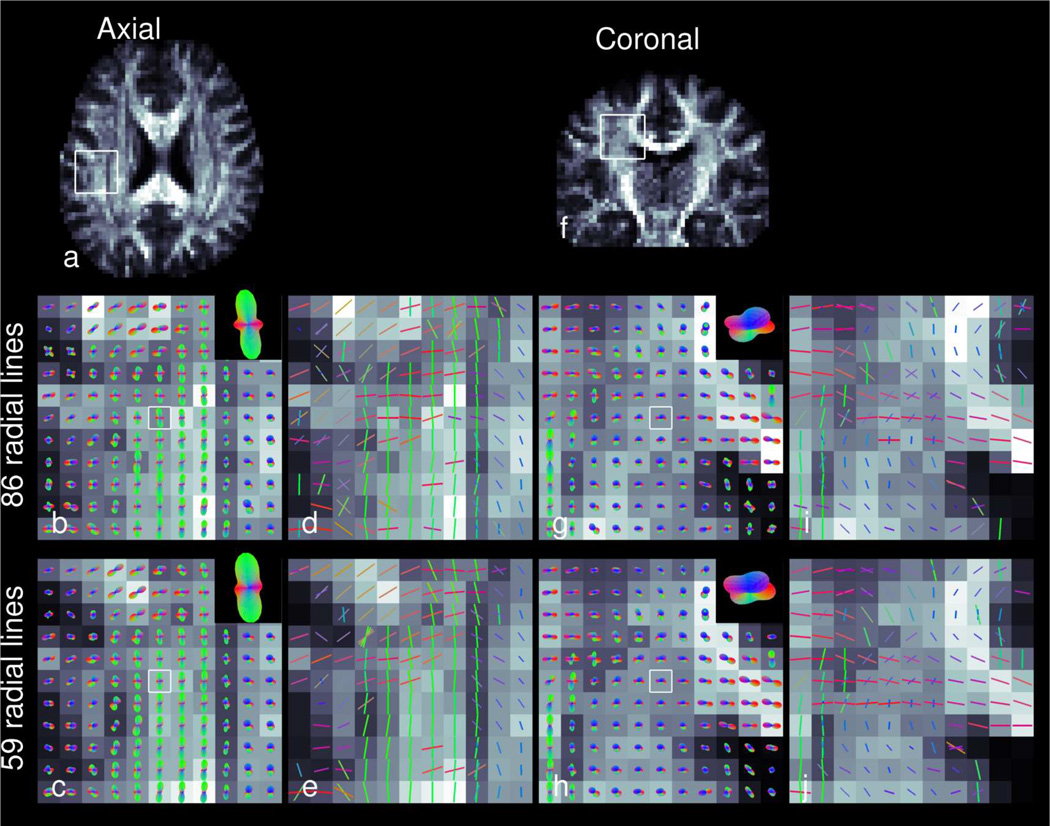
Figures 8 – 10 show RDSI reconstruction results of in vivo healthy brain. For these acquisitions, q-space was sampled at 236 (59 radial lines) and 344 (86 radial lines) locations and the resulting dataset was reconstructed using equation (5). In vivo Quantitative Anisotropy (QA) maps of the identified major fibers in the brain (Figure8b and 8e) reveal the main areas of the brain with a predominant fiber tract. Complementing this information, the QA maps of the minor fibers (Figure8c and 8f) reveal regions with crossing fibers. The ODFs and identified dominant fiber directions in the in vivo brain are shown in Figure 9 which zooms in on axial and coronal sections of the centrum semiovale where three fiber bundles cross. In Figure 9, the ODFs acquired with 59 radial lines are similar to those acquired with 86 radial lines (see enlarged insets). In the next step, the identified fiber directions in Figure 9 are used in tractography reconstructions. Whole brain tractography (Supporting Figure S1) identifies all major fiber tracts while localized tractography (Figure 10) finds all tracts passing through an ovoid seed region. In the latter figure, fibers crossing in a circular region of the internal capsule (right hemisphere) are clearly identified, as shown in two oblique views (Figure 10d and 10e).
Figure 8.
Axial (a,b,c) and Coronal (d,e,f) Quantitative Anisotropy (QA) maps of the major (b,e) and minor (c,f) fibers in the RDSI reconstruction (59 radial lines) of a healthy human volunteer. The QA maps of the minor fibers highlight the regions with crossing fibers; if voxels have no minor fibers, the QA value is assigned 0.
Figure 10.
Tractography of an RDSI reconstruction of a healthy human volunteer with the seed region placed in the superior region of internal capsule. The fibers are shown from two oblique views (d,e) as referenced in the lateral (a), frontal (b) and superior (c) views. Right (R), Left (L), Anterior (A), Posterior (P), Head (H) and Feet (F) directions have been added.
Figure 9.
ODFs (b,c,g,h) and resolved fiber directions (d,e,i,j) of RDSI reconstructions using 86 (b,d,g,i) and 59 (c,e,h,j) radial lines Nl in axial (a) and coronal (f) slices through the centrum semiovale. The directions of the ODF and fiber directions are colored red in the left-right direction, green in the anterior-posterior direction and blue in the axial direction. In the ODF-panels, the central ODF is enlarged in the insets.
Discussion
In this paper, we introduce a radially symmetric sampling scheme for DSI acquisitions, RDSI. The results, both simulations and in vivo measurements, demonstrate that radial sampling in q-space is ideally suited for exploiting the radial symmetry of the ODF. Indeed, as shown in the analytical derivation of the reconstruction framework (Equation (5)) the q-space samples situated on each radially outward line are directly connected to the value of the ODF at the same angle by the Fourier Slice Theorem. This direct analytical reconstruction and the radial nature of RDSI minimize truncation artifacts and avoid the interpolation necessary for the reconstruction of q-space samples acquired on a conventional rectangular grid [9, 12, 21].
The angular resolution of the DSI sampling scheme is crucial in accurately identifying fiber crossings [2]. For RDSI, the maximum attainable angular resolution depends on the width of the reconstruction kernel, the geometric encoding matrix F (Equation (6)). Hence, the nominal angular resolution can easily be calculated (Figure 3b) to be 22.9° at a b-value of 4000 s/mm2 and 16.0° at 8000 s/mm2. As a consequence, acquisition of q-space samples along 40 radial lines Nl suffices at a b-value of 4000 s/mm2 (81 radial lines at 8000 s/mm2) assuming that the radial lines are evenly spaced on a half sphere. Hence, the need to acquire samples on radial lines, i.e. leading to a non-uniform distribution of samples when projecting all samples on a unit sphere, does not limit the angular resolution as in other multi-shell imaging approaches where it is recommended to distribute the projections of the q-space samples on the unit sphere uniformly [15]. In practice, the effective angular resolution is approximately the root-mean-square sum of the nominal experimental angular resolution, discussed above, and the resolution of the diffusion contrast in the displacement space under the experimental conditions [1, 31]. The simulations in Figure 6c illustrate that this effective angular resolution is closer to 45° at 4000 s/mm2 and 35° at 8000 s/mm2 when the b0 SNR is 100. Thus, the effective angular resolution improves as b-values increase. However, the gain in angular resolution is limited due to increasing width of the diffusion contrast [31] and decreasing SNR at higher b-values. In addition, for the radial sampling scheme the nominal experimental angular resolution, which is proportional to the spatial resolution of the PDF in the diffusion displacement space, depends on the number of radial lines rather than on the largest q-value sampled as when using a rectangular sampling scheme. These considerations illustrate that in practice the effective angular resolution of RDSI is still primarily limited by the maximum b-value which can be measured with sufficient SNR. However, this is less limiting than when using a cartesian q-space sampling scheme given that the nominal experimental angular resolution of the radial scheme depends less on the b-value.
Computer simulations of RDSI reconstructions show that the ODF can be accurately estimated at relatively low b-values of 4000 s/mm2 with q-space sampled along a limited number of radial lines, e.g. 59 or even 45. This is evident from both the individual ODFs (Figure 4) and the aggregated ODF metrics (Figure 5). In the latter category, the NRMSE and JSD metrics quantify the deviation of the ODFs from the ideal high b-value ODF. Both metrics register increased ODF differences with decreasing b-values mainly when the b-value drops below 4000 s/mm2. In addition, NRMSE also points to insufficient reconstructions when the number of radial lines drops below 45, an observation confirmed by the confidence interval calculations (Figure 5c–d). Furthermore, the confidence intervals predict good performance of RDSI within the limits discussed above. They indicate good tractography performance as they gauge fiber direction identification. Similarly, the simulations of random one or two fiber ODFs point to beneficial angular precision and dispersion for most experimental settings (Figure 6a–b). It is noteworthy that the angular precision of RDSI at b= 4000 s/mm2 is smaller (236 samples, 1 / 2 fibers: 3.80°/ 9.68°) than those published for Q-ball imaging (253 samples, 1 / 2 fibers: 12.15°/ 34.81°) and DSI with a rectangular grid (203 samples, 1 / 2 fibers: 3.91°/ 23.09°) [12]. On the other hand, the angular dispersion for DSI of crossing fibers is slightly higher than previously published values (at b= 4000 s/mm2: 1.204° vs 0.628° and 0.758° respectively) [12]. These computer simulations indicate that precise ODF estimations can be performed at b-values of 4000 s/mm2 with 59 radially outward lines of each 4 samples, confirming earlier observations on the optimum b-max and number of q-space samples [12].
The RDSI analytical reconstruction is computationally similar to Generalized Q-sampling Imaging (GQI) [21] when a L2 weighting is used for the basis function. However, the GQI reconstruction will only yield comparable results if the q-space sampling is radially symmetric. Indeed, sampling q-space on radially symmetric lines forms the analytical basis of the direct connection between the q-space samples on these lines and the ODF values at the same angle. By contrast, the approach of Yeh et al. [21] is meant as a different means of weighting the q-space samples during reconstruction, without regard to the q-space sampling scheme and the mathematical relationship between the sampling pattern and the reconsturction formalism. Whilst both methods, GQI and RDSI avoid the Discrete Fourier transform and the subsequent interpolation on a grid, RDSI benefits from the direct connection between q-space and the ODF mentioned above. The RDSI sampling scheme is also different from the multi-shell Q-ball imaging approximation, since the latter reconstruction does not follow the mathematical relationship between the measured data and its Radon transform [14,15]. As a result, when multi-shell Q-ball imaging is used the benefit of a uniform distribution of samples on the unit sphere [15] is limited by the much broader point-spread function of the associated reconstruction kernel [16].
In conclusion, our results demonstrate that radial q-space sampling with direct analytical reconstruction via the projection slice theorem is an accurate approach for in vivo DSI with good angular resolution at lower b-values. The robustness of this approach stems from its ability to directly calculate the ODF at the same angular direction where the radial lines are sampled in q-space. These findings could have important implications for the design of DSI imaging protocols that can be used routinely in a clinical setting.
Supplementary Material
Acknowledgments
This project is supported in part by NIH (R01CA111996, R01NS082436 and R01MH00380). The authors would like to thank Fang-Cheng (Frank) Yeh for his help in integrating the RDSI-reconstruction and the visualization of our results in DSI Studio.
Abbreviations
- DFT
Discrete Fourier Transform
- DSI
Diffusion Spectrum Imaging
- DTI
Diffusion Tensor Imaging
- FWHM
Full Width at Half Maximum
- GQI
Generalized Q-sampling Imaging
- HARDI
High Angular Resolution Diffusion Imaging
- JSD
Jensen-Shannon Divergence
- NMRSE
Normalized Root Mean Square Error
- ODF
Orientation Distribution Function
Probability Distribution Function
- PSF
Point Spread Function
- QA
Quantitative Anisotropy
- RDSI
Radial Diffusion Spectrum Imaging
Appendix A
In rewriting equation (1) using the Fourier Slice Theorem or Projection slice theorem [17], equation (1) is first rewritten as
| (10) |
where S(r⃗, q⃗) equals W(r⃗, q⃗) with ρ(r⃗) normalized out. Subsequently, the Fourier Slice Theorem which replaces the three-dimensional Fourier transform of a function f(s⃗) with the one-dimensional Fourier transform of the Radon transform (R3Df)(sû) of that function
| (11) |
| (12) |
with û a unit vector, s the norm of s⃗ and ω the norm of ω⃗ is applied to equation (10)
| (13) |
with q⃗ = ξû and R⃗ = Lû (û is a unit vector).
Appendix B
For the derivation of equations (5) and (6), equations (3) and (4) are substituted in the ODF calculation (2)
| (14) |
which is easily simplified to
| (15) |
and can be rewritten as (substituting q⃗ for ζ⃗)
| (16) |
This is (5), which leaves the derivation of the geometric encoding matrix (Equation (6))
| (17) |
integrating symmetrically along the radial line to the maximum displacement distance probed Rm. The integral in (17) is mathematically equivalent to the second partial derivative with respect to q⃗ of a simpler integral (Leibniz integral rule for differentiation under the integral sign), namely
| (18) |
The latter is easily integrated to
| (19) |
| (20) |
which finally leads to equation (6)
| (21) |
when considering that
| (22) |
References
- 1.Callaghan PT. Principles of Nuclear Magnetic Resonance Microscopy. Oxford: Oxford University Press; 1993. [Google Scholar]
- 2.Wedeen VJ, Hagmann P, Tseng WY, Reese TG, Weisskoff RM. Mapping complex tissue architecture with diffusion spectrum magnetic resonance imaging. Magn Reson Med. 2005;54:1377–1386. doi: 10.1002/mrm.20642. [DOI] [PubMed] [Google Scholar]
- 3.Wedeen VJ, Rosene DL, Wang R, Dai G, Mortazavi F, Hagmann P, Kaas JH, Tseng WY. The geometric structure of the brain fiber pathways. Science. 2012;335:1628–1634. doi: 10.1126/science.1215280. [DOI] [PMC free article] [PubMed] [Google Scholar]
- 4.Fernandez-Miranda JC, Pathak S, Engh J, Jarbo K, Verstynen T, Yeh FC, Wang Y, Mintz A, Boada F, Schneider W, Friedlander R. High-definition fiber tractography of the human brain: neuroanatomical validation and neurosurgical applications. Neurosurgery. 2012;71:430–453. doi: 10.1227/NEU.0b013e3182592faa. [DOI] [PubMed] [Google Scholar]
- 5.Basser PJ, Mattiello D. Estimation of the Effective Self-Diffusion Tensor from the NMR Spin Echo. J Magn Reson B. 1994;103:247–254. doi: 10.1006/jmrb.1994.1037. [DOI] [PubMed] [Google Scholar]
- 6.Basser PJ, Pierpaoli C. Microstructural and Physiological Features of Tissues Elucidated by Quantitative-Diffusion-Tensor MRI. J Magn Reson Imaging Series B. 1996;111:209–219. doi: 10.1006/jmrb.1996.0086. [DOI] [PubMed] [Google Scholar]
- 7.Mori S, Kaufmann WE, Davatzikos C, Stieltjes B, Amodei L, Fredericksen K, Pearlson GD, Melhem ER, Solaiyappan M, Raymond GV, Moser HW, Zijl PC. Imaging cortical association tracts in the human brain using diffusion-tensor-based axonal tracking. Magn Reson Med. 2002;47:215–223. doi: 10.1002/mrm.10074. [DOI] [PubMed] [Google Scholar]
- 8.Tuch DS, Reese TG, Wiegell MR, Makris N, Belliveau JW, Wedeen VJ. High angular resolution diffusion imaging reveals intravoxel white matter fiber heterogeneity. Magn Reson Med. 2002;48:577–582. doi: 10.1002/mrm.10268. [DOI] [PubMed] [Google Scholar]
- 9.Tuch DS. Q-ball imaging. Magn Reson Med. 2004;52:1358–1372. doi: 10.1002/mrm.20279. [DOI] [PubMed] [Google Scholar]
- 10.Wiegell MR, Larsson HBW, Wedeen VJ. Fiber Crossing in Humagn Brain Depicted with Diffusion Tensor MR Imaging. Radiology. 2000;217:897–903. doi: 10.1148/radiology.217.3.r00nv43897. [DOI] [PubMed] [Google Scholar]
- 11.Reese TG, Benner T, Wang R, Feinberg DA, Wedeen VJ. Halving imaging time of whole brain diffusion spectrum imaging and diffusion tractography using simultaneous image refocusing in EPI. J Magn Reson Imaging. 2009;29:517–522. doi: 10.1002/jmri.21497. [DOI] [PMC free article] [PubMed] [Google Scholar]
- 12.Kuo LW, Chen JH, Wedeen VJ, Tseng WY. Optimization of diffusion spectrum imaging and q-ball imaging on clinical MRI system. Neuroimage. 2008;41:7–18. doi: 10.1016/j.neuroimage.2008.02.016. [DOI] [PubMed] [Google Scholar]
- 13.Hagmann P, Jonasson L, Deffieux T, Meuli R, Thiran JP, Wedeen VJ. Fibertract segmentation in position orientation space from high angular resolution diffusion MRI. Neuroimage. 2006;32:665–675. doi: 10.1016/j.neuroimage.2006.02.043. [DOI] [PubMed] [Google Scholar]
- 14.Aganj I, Lenglet C, Sapiro G, Yacoub E, Ugurbil K, Harel N. Reconstruction of the orientation distribution function in single- and multiple-shell q-ball imaging within constant solid angle. Magn Reson Med. 2010;64:554–566. doi: 10.1002/mrm.22365. [DOI] [PMC free article] [PubMed] [Google Scholar]
- 15.Caruyer E, Lenglet C, Sapiro G, Deriche R. Design of multishell sampling schemes with uniform coverage in diffusion MRI. Magn Reson Med. 2013;69:1534–1540. doi: 10.1002/mrm.24736. [DOI] [PMC free article] [PubMed] [Google Scholar]
- 16.Barnett A. Theory of Q-ball imaging redux: Implications for fiber tracking. Magn Reson Med. 2009;62:910–923. doi: 10.1002/mrm.22073. [DOI] [PubMed] [Google Scholar]
- 17.Kak AC, Slaney M. Principles of Computerized Tomoraphic Imaging. IEEE Press; 1988. [Google Scholar]
- 18.Pickalov V, Basser PJ. IEEE Int Symp on Biomedical Imaging. Vol. 3. Arlington, VA, USA: 2006. 3-D Tomographic Reconstruction of the average propagator from MRI data; pp. 710–713. [Google Scholar]
- 19.Wu Y-C, Field AS, Alexander AL. Computation of Diffusion Function Measures in q-Space Using Magnetic Resonance Hybrid Diffusion Imaging. IEEE Trans Med Imaging. 2008;27:858–865. doi: 10.1109/TMI.2008.922696. [DOI] [PMC free article] [PubMed] [Google Scholar]
- 20.Boada FE, Yutzy S. Proc. Intl. Soc. Magn. Res. Med. Vol. 21. Salt Lake City, Utah, USA: 2013. Improving the Efficiency of Diffusion Spectrum MRI Through Radial Acquisitions in q-space. [Google Scholar]
- 21.Yeh FC, Wedeen VJ, Tseng WY. Generalized q-Sampling Imaging. IEEE Trans Med Imaging. 2010;29:1626–1635. doi: 10.1109/TMI.2010.2045126. [DOI] [PubMed] [Google Scholar]
- 22.Wilbraham H. On a certain periodic function. Cambridge and Dublin Math J. 1848;3:198–201. [Google Scholar]
- 23.Gibbs JW. Fourier’s series. Nature. 1898;59:200. [Google Scholar]
- 24.Harris FJ. On the Use of Windows for Harmonic Analysis with the Discrete Fourier Transform. Proc IEEE. 1978;66:51–83. [Google Scholar]
- 25.Jones DK. Diffusion MRI - Theory, Methods, and Applications. Oxford: Oxford University Press; 2010. [Google Scholar]
- 26.Reese TG, Heid O, Weisskoff RM, Wedeen VJ. Reduction of eddy-current-induced distortion in diffusion MRI using a twice-refocused spin echo. Magn Reson Med. 2003;49:177–182. doi: 10.1002/mrm.10308. [DOI] [PubMed] [Google Scholar]
- 27.Setsompop K, Cohen-Adad J, Gagoski BA, Raij T, Yendiki A, Keil B, Wedeen VJ, Wald LL. Improving diffusion MRI using simultaneous multi-slice echo planar imaging. Neuroimage. 2012;63:569–580. doi: 10.1016/j.neuroimage.2012.06.033. [DOI] [PMC free article] [PubMed] [Google Scholar]
- 28.Basser PJ, Pajevic S, Pierpaoli C, Duda J, Aldroubi A. In Vivo Fiber Tractography Using DT-MRI Data. Magn Reson Med. 2000;55:625–632. doi: 10.1002/1522-2594(200010)44:4<625::aid-mrm17>3.0.co;2-o. [DOI] [PubMed] [Google Scholar]
- 29.Cohen-Adad J, Descoteaux M, Wald LL. Quality assessment of high angular resolution diffusion imaging data using bootstrap on Q-ball reconstruction. J Magn Reson Imaging. 2011;33:1194–1208. doi: 10.1002/jmri.22535. [DOI] [PMC free article] [PubMed] [Google Scholar]
- 30.Jones DK. The effect of gradient sampling schemes on measures derived from diffusion tensor MRI: a Monte Carlo study. Magn Reson Med. 2004;51:807–815. doi: 10.1002/mrm.20033. [DOI] [PubMed] [Google Scholar]
- 31.Wedeen VJ, Wang RP, Schmahmann JD, Benner T, Tseng WY, Dai G, Pandya DN, Hagmann P, D’Arceuil H, Crespigny AJ. Diffusion spectrum magnetic resonance imaging (DSI) tractography of crossing fibers. Neuroimage. 2008;41:1267–1277. doi: 10.1016/j.neuroimage.2008.03.036. [DOI] [PubMed] [Google Scholar]
Associated Data
This section collects any data citations, data availability statements, or supplementary materials included in this article.


