Abstract
Bone degenerative pathologies like osteoporosis may be initiated by age-related shifts in anabolic and catabolic responses that control bone homeostasis. Here we show that sulforaphane (SFN), a naturally occurring isothiocyanate, promotes osteoblast differentiation by epigenetic mechanisms. SFN enhances active DNA demethylation via Tet1 and Tet2 and promotes preosteoblast differentiation by enhancing extracellular matrix mineralization and the expression of osteoblastic markers (Runx2, Col1a1, Bglap2, Sp7, Atf4, and Alpl). SFN decreases the expression of the osteoclast activator receptor activator of nuclear factor-κB ligand (RANKL) in osteocytes and mouse calvarial explants and preferentially induces apoptosis in preosteoclastic cells via up-regulation of the Tet1/Fas/Caspase 8 and Caspase 3/7 pathway. These mechanistic effects correlate with higher bone volume (∼20%) in both normal and ovariectomized mice treated with SFN for 5 weeks compared with untreated mice as determined by microcomputed tomography. This effect is due to a higher trabecular number in these mice. Importantly, no shifts in mineral density distribution are observed upon SFN treatment as measured by quantitative backscattered electron imaging. Our data indicate that the food-derived compound SFN epigenetically stimulates osteoblast activity and diminishes osteoclast bone resorption, shifting the balance of bone homeostasis and favoring bone acquisition and/or mitigation of bone resorption in vivo. Thus, SFN is a member of a new class of epigenetic compounds that could be considered for novel strategies to counteract osteoporosis.
Keywords: bone, epigenetics, osteoblast, osteoclast, osteoporosis
Introduction
Bone loss disorders like osteoporosis are often multifactorial diseases due to dysregulation of bone metabolism or homeostasis. To maintain bone density and integrity, complex networks and numerous interactions between different bone cell types and their environment assure that bone remodeling is balanced during growth and adulthood (1–3). These processes are orchestrated by many distinct regulators of gene expression like specific transcription factors, microRNAs, and epigenetic chromatin modulators (4, 5). These gene regulatory processes are controlled by paracrine events involving a variety of secreted ligands that affect both bone-forming osteoblasts (e.g. parathyroid hormone, bone morphogenetic proteins, and wingless-type murine mammary tumor virus integration site family members (WNTs)), bone-resorbing osteoclasts (e.g. RANKL4/TNSF11), or both such as members of the serum amyloid A family (6, 7). Both cell types are targeted by a number of different therapeutic approaches that counteract bone degeneration in aging patients and other disorders provoking bone loss.
Bisphosphonates, which are potent inhibitors of osteoclastic bone resorption, are widely prescribed and very effective at limiting bone loss. However, there is considerable debate about the efficacy versus the potential adverse effects of these compounds. In mice, the bisphosphonate ibandronate was reported to strongly reduce bone formation by decreasing osteoblast numbers and to disturb the bone marrow plasma cell niche, thus negatively affecting bone remodeling (8). Use of bisphosphonates is also associated with a higher risk of atypical femoral fractures in women (9, 10) with partly elevated bone mineralization patterns (11, 12) and with significantly longer union times of distal radius fractures (13). Current therapeutic strategies to promote osteoblastogenesis in osteoporosis aim to increase osteoblast number and/or increase osteoblast activity by the administration of bone anabolic molecules like intermittent parathyroid hormone treatment or bone morphogenetic proteins (14). However, there are only a limited number of bone anabolic strategies that have shown promise in clinical applications.
Sulforaphane (SFN) is an organosulfur compound belonging to the isothiocyanate group. Its precursor molecule, glucoraphanin, naturally occurs at high concentrations in cruciferous vegetables like broccoli and cabbages. Highest concentrations are found in sprouts of broccoli and cauliflower (15). SFN is generated from glucoraphanin by the enzyme myrosinase upon damage to the plant (16) such as from chewing. Due to its antioxidative potential, its ability to selectively induce activating phase II enzymes (17), and inhibit histone deacetylase activity (18–20), SFN is predominantly studied for its anticarcinogenic and antimicrobial properties. Furthermore, recent studies suggest that SFN has potential beneficial effects for the treatment of diabetes type 1 and type 2 (21–23) as well as osteoarthritis (24, 25) and rheumatoid arthritis. In the latter context, SFN was found to inhibit synovial hyperplasia and T-cell activation (26). In addition, SFN represses matrix-degrading proteases and protects cartilage from destruction in vitro and in vivo (27). SFN also may have effects on bone resorption because it inhibits the RANKL-dependent differentiation of osteoclasts in vitro by suppressing nuclear factor-κB (28) and activation of the transcription factor NRF2 (Nfe2l2) (29).
SFN shares molecular properties with the cryopreservant dimethyl sulfoxide (DMSO). As we and others have previously shown, DMSO causes phenotypic changes and supports differentiation of several cell types such as erythroid and embryonic stem cells as well as osteoblasts by epigenetic mechanisms (30–36). Epigenetic reprogramming of osteoblastic differentiation or of other bone-related cells may represent a novel approach to effectively regulate bone remodeling and homeostasis in certain disorders. Indeed, an increasing number of studies emphasize the central role of epigenetic regulatory mechanisms in bone biology (4). Based on the molecular similarities of SFN and DMSO as well as their bone-related biological properties, we hypothesized that SFN would exhibit bone anabolic effects. Our results show that SFN has beneficial effects on bone and may act through an epigenetic mechanism that promotes ten-eleven translocation 1 (Tet1)/Tet2-dependent hydroxymethylation of DNA, reactivating gene expression.
Experimental Procedures
Cell Culture
The following murine cell lines were used: MC3T3-E1, a clonal preosteoblastic cell line derived from newborn mouse calvaria (kindly provided by Dr. Kumegawa, Department of Oral Anatomy, Meikai University, Sakado, Japan); the osteocyte-like MLO-Y4 cell line (kindly provided by Lynda Bonewald, University of Missouri-Kansas City); and the preosteoclastic, macrophage-like RAW 264.7 cell line (ATCC, Manassas, VA).
All cell lines were cultured in a humidified atmosphere with 5% CO2 at 37 °C and were subcultured twice per week using 0.001% Pronase E (Roche Applied Science) and 0.02% EDTA in Ca2+- and Mg2+-free PBS before achieving confluence. MC3T3-E1 and MLO-Y4 cells were cultured in α-minimum essential medium (α-MEM; Biochrom, Berlin, Germany) containing 10 μg/ml gentamicin (Sigma-Aldrich); for MC3T3-E1 culture, medium was supplemented with 10% heat-inactivated fetal calf serum (FCS; Biochrom), and MLO-Y4 cells were cultured on rat tail-derived collagen type I (Roche Applied Science)-coated dishes (final concentration of 0.15 mg/ml), and culture medium was supplemented with 2.5% FCS (Hyclone, GE Healthcare) and 2.5% calf serum (Hyclone).
Differentiation of MC3T3-E1 cells was induced with 50 μg/ml ascorbic acid (Sigma-Aldrich) and 5 mm β-glycerophosphate (Sigma-Aldrich) in medium containing 5% FBS. RAW 264.7 cells were cultured in Dulbecco's modified Eagle's medium (DMEM; Invitrogen) supplemented with 10% fetal bovine serum (Hyclone) and 2 mm glutamine (Gibco). Cells were seeded in culture dishes at a density of 20,000 cells/cm2 and cultured overnight unless stated otherwise. Before cells were treated with compounds, the culture medium was changed.
Primary Cells and Tissues
Primary mouse tissues or cells were obtained according to procedures that conform to the regulatory guidelines of the Institutional Animal Care and Use Committee of the Medical University of Vienna. Primary mouse osteoclasts were harvested from 8-week-old C57BL/6 mice that were sacrificed, and bone marrow cells were isolated from tibiae and femora under aseptic conditions and cultured in α-MEM (Biochrom) containing 10% FCS (Biochrom), 10 mg/ml gentamycin (Sigma-Aldrich), and macrophage colony-stimulating factor 1 (30 ng/ml). After 24 h, non-adherent cells were seeded onto sterile, 300-μm-thick dentin slices (elephant ivory) at 700,000 cells/cm2 in α-MEM supplemented with 10% FBS, 2 mm l-glutamine, 30 μg/ml gentamycin, 20 ng/ml macrophage colony-stimulating factor, and 2 ng/ml RANKL (R&D Systems, Minneapolis, MN). Culture medium was changed twice per week, and cells were cultured for 14 days.
Mouse bone marrow mesenchymal stem cells were isolated from aseptically dissected long bones of 6-week-old C57BL/6 mice. The marrow cavities were flushed with sterile medium using a 25-gauge needle, and the culture was established in α-MEM supplemented with 10% FCS and 10 mg/ml gentamycin. After 48 h of culture at 5% CO2 and 37 °C, the non-adherent cells were removed by gentle rinsing with PBS. At confluence, cells were harvested and seeded at a density of 3,000/cm2 for cell experiments. For osteogenic differentiation, cells were cultured in α-MEM supplemented with 10% FBS, 10 mg/ml gentamycin, 100 nm dexamethasone, 10 mm β-glycerophosphate, and 50 μg/ml ascorbic acid with or without l-, d-, or dl-SFN. Culture medium was renewed twice a week, and cells were cultured for the periods indicated under “Results.”
Calvariae from 2–3-day-old and from 7-week-old C57BL/6 mice were dissected aseptically. The calvarial bone explants were cultured in 48-well plates in α-MEM (Biochrom) containing 10% FCS (Biochrom), 50 μg/ml ascorbic acid (Sigma-Aldrich), 5 mm β-glycerophosphate (Sigma-Aldrich), and 10 μg/ml gentamicin (Sigma-Aldrich). The day after dissection, medium was changed, and a part of the explants was treated with 3 μm l- or dl-SFN for 12 days. Thereafter, one part of the calvariae was fixed for 1 h in 4% paraformaldehyde, and mineralization was measured by Alizarin Red S stain (Sigma-Aldrich). For this purpose, Alizarin Red S dye was extracted using 10% cetylpyridinium chloride in 10 mm sodium phosphate, pH 7.0, for 45 min at room temperature. Alizarin Red S absorbance was measured at 562 nm in a multiplate reader (Tecan, Maennedorf, Switzerland) and normalized to total protein amount measured by bicinchoninic acid assay (Thermo Fisher Scientific, Waltham, MA). From the other part of the calvariae, total RNA was extracted (see below).
Histomorphometric Measurements/Assessment of Osteoclastic Resorption
After culturing the primary mouse osteoclasts for 14 days on dentin slices in the presence or absence of 3 μm l- or dl-SFN, substrates were put into water, sonicated for 10 min to remove living cells, and air-dried. Photographs were obtained by reflected light microscopy (objective, 20×) of the entire substrate surface, and resorption trails and pits were analyzed and quantified with standard image analysis software (ImageJ, rsbweb.nih.gov/ij/). Resorption is shown as percent area resorbed to total area of the dentin slice.
Cell Metabolic Activity
To assess cell metabolic activity, a commercially available 3-(4,5-dimethylthiazol-2-yl)-2,5-diphenyltetrazolium bromide-like assay (EZ4U, Biomedica, Vienna, Austria) was used. For this purpose, the cell lines were incubated with increasing concentrations of l- or dl-SFN. After a comparable doubling time for all three cell lines, the assay was performed following the protocol of the supplier.
Cell Counts
Cell lines were seeded in 24-well culture dishes at a density of 20,000/cm2 and either left untreated (controls) or treated with l-, d-, or dl-SFN at the indicated concentrations for up to 48 h. Thereafter, cells were detached with 0.001% Pronase E, and the number of viable cells was assessed with a Casy cell counter (Schaerfe Systems, Reutlingen, Germany). Each experiment was performed in biological quadruplicates, and experiments were repeated twice. For long term experiments, cell number was determined using DNA amount as surrogate. Cell layers were washed with PBS and fixed for 20 min with 4% paraformaldehyde. Thereafter, Hoechst 33258 dye (1 μg/ml; Polysciences, Warrington, PA) was added, and after an incubation of 15 min at room temperature, the fluorescence was measured (excitation, 360 nm; emission, 465 nm). The amount of DNA was estimated using a standard curve prepared from calf thymus DNA (Roche Applied Science).
Measurement of Caspase Activity
Caspase 3/7 and Caspase 8 activities were measured using the Caspase-Glo 3/7 and Caspase-Glo 8 assay kits (Promega, Madison, WI) following the manufacturer's instructions. Briefly, after treatments, cells were lysed, and substrate cleavage by Caspases was measured by the generated luminescence signal with a 96-multiwell luminometer (Glomax, Promega). Each experiment was performed in quintuplicate, and experiments were carried out twice.
Tet1 and Tet2 siRNA Transfections
For Tet1 and Tet2 depletion by siRNA, cells were seeded at 20,000 cells/cm2 in 6-well culture plates. Six hours after seeding, cells were transfected with 40 pmol of Tet1 or Tet2 siRNA (Sigma-Aldrich) using X-tremeGENE siRNA Transfection Reagent (Roche Applied Science) as described by the supplier. One day after transfection, a medium change was performed, and one part of the cells was treated with medium containing 3 μm dl-SFN, whereas the other part was left untreated. After an incubation time of 24 h, proteins or nucleic acids were isolated as described below and subjected to reverse transcription-quantitative polymerase chain reaction (RT-qPCR), Western blotting, or cell count determination.
Isolation of RNA and RT-qPCR
Total RNA was extracted using the SV Total RNA Isolation kit (Promega) following the supplier's instructions. cDNA was synthesized from 0.5 μg of RNA using the First Strand cDNA Synthesis kit (Roche Applied Science) as described by the supplier. The resulting cDNAs were subjected to quantitative PCR amplification with a real time cycler using the QuantiTect SYBR Green PCR kit (Qiagen, Hilden, Germany) for the genes Alpl, Fas, Lox, Tet1, and Tet2 and TaqMan Gene Expression Master Mix (Applied Biosystems, Foster City, CA) for measuring Runx2, Bglap2, Col1a1, Tnfsf11, and 18S rRNA expression (for primers, see Table 2). SYBR Green RT-qPCR was started with an initial denaturation step at 95 °C for 10 min and then continued with 45 cycles consisting of 30-s denaturation at 95 °C, 30-s annealing at primer-specific temperatures, and extension at 72 °C. For measurement of the TaqMan assays, we applied an initial denaturation at 95 °C for 10 min followed by 45 cycles alternating 60 s at 60 °C and 15 s at 95 °C (primers or TaqMan probe references are listed in Table 1). All RT-qPCR assays were performed in triplicates, and expression was evaluated using the comparative quantification method (37).
TABLE 2.
Examination of changes in BMDD parameters CaMean, CaPeak, CaWidth, CaLow, and CaHigh, which reflect bone turnover, mineralization kinetics, and average bone matrix age by qBEI
Two-way analysis of variance of CaPeak and CaWidth of trabecular bone between all treatment groups is shown (n = 5).
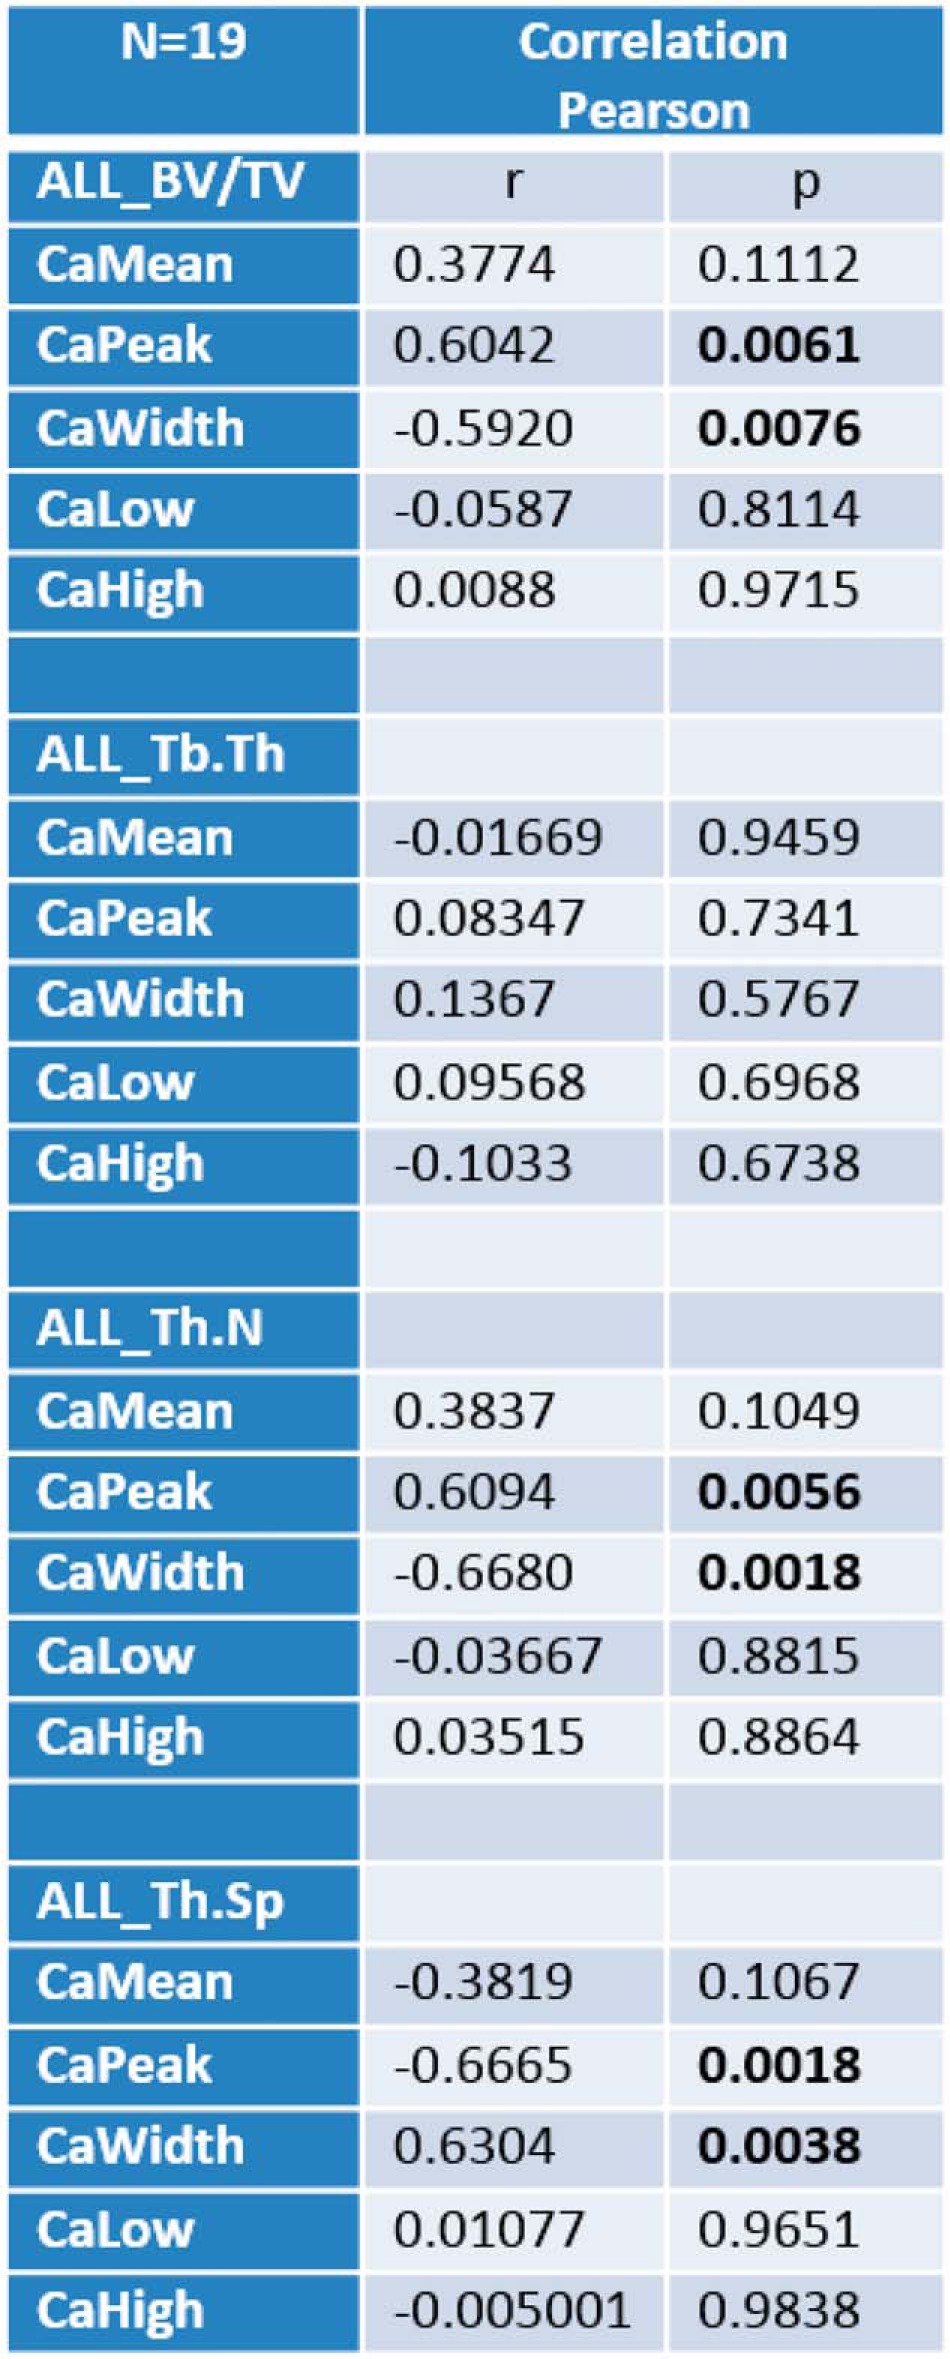
TABLE 1.
RT-qPCR primer list
IP, immunoprecipitation.
| Gene | Primers (5′–3′) |
Tm | GenBank accession no. | |
|---|---|---|---|---|
| Forward | Reverse | |||
| °C | ||||
| SYBR Green | ||||
| Alpl | CCAACTCTTTTGTGCCAGAGA | GGCTACATTGGTGTTGAGCTTTT | 62 | NM_007431 |
| Atf4 | CCTGAACAGCGAAGTGTTGG | TGGAGAACCCATGAGGTTTCAA | 60 | NM_009716 |
| Fas | TATCAAGGAGGCCCATTTTGC | TGTTTCCACTTCTAAACCATGCT | 62 | NM_007987 |
| Sp7/Osx | GGCTTTTCTGCGGCAAGAGGTT | CGCTGATGTTTGCTCAAGTGGTC | 60 | NM_130458 |
| Tet1 | ATTTCCGCATCTGGGAACCTG | GGAAGTTGATCTTTGGGGCAAT | 60 | NM_027384 |
| Tet2 | CCCGTTAGCAGAGAGACCTCA | CTGACTGTGCGTTTTATCCCT | 62 | NM_001040400 |
| TaqMan | ||||
| 18S rRNA | Hs00917508_m1; Applied Biosystems | 60 | ||
| Bglap2 | Mm03413826_mH; Applied Biosystems | 60 | ||
| Col1a1 | Mm00801666_g1; Applied Biosystems | 60 | ||
| Lox | Mm00495386_m1; Applied Biosystems | 60 | ||
| Runx2 | Mm00501578_m1; Applied Biosystems | 60 | ||
| Tnfsf11 | Mm00441906_m1; Applied Biosystems | 60 | ||
| 5hmC IP | ||||
| Atf4 Region 1 | GCGCTAGGGTTGGGTTGTA | CCCTCACTGCCGGTTTGTAT | 60 | CH466550 |
| Atf4 Region 2 | CTGAACAGCGAAGTGTTGGC | TGGCCAAGCCATCATCCATA | 60 | CH466550 |
Protein Isolation and Immunoblotting
Whole cell protein extracts were prepared using SDS sample buffer (2% SDS, 100 mm β-mercaptoethanol, and 125 mm Tris-HCl, pH 6.8) and heated at 95 °C for 5 min.
For immunoblotting analysis, 15 μg of protein extracts were separated on 10% SDS polyacrylamide gels and transferred to nitrocellulose membranes (Millipore), and equal protein loading was confirmed by Ponceau Red staining. Subsequently, membranes were blocked overnight with 10% blocking reagent (Roche Applied Science) in TN buffer (50 mm Tris and 125 mm NaCl, pH 8.0). The following primary antibodies were used: rabbit anti-Runx2 (sc-10758, Santa Cruz Biotechnology, Santa Cruz, CA) rabbit anti-Tet1 (catalog number 61741, Active Motif, Carlsbad, CA), and rabbit anti-Tet2 (sc-136926, Santa Cruz Biotechnology). Washing was performed with TN buffer containing 0.01% Tween. Binding of the secondary antibody (anti-rabbit IgG/anti-mouse IgG horseradish peroxidase-coupled) (Roche Applied Science) diluted 1:10,000 in 10% blocking solution followed by detection with the BM chemiluminescence immunoblotting kit (Roche Applied Science) was carried out as described by the supplier. Chemiluminescence was measured with an image acquisition system (Vilber Lourmat, Marne-la-Vallée, France). Measurements are given as means of three immunoblots normalized to total protein loading, and representative blots are shown.
Immunostaining and Quantifications of Global Cytosine 5-Hydroxymethylation
Cells were fixed with 4% paraformaldehyde in PBS for 20 min at room temperature and permeabilized with 0.2% Triton in 4% paraformaldehyde in PBS. Thereafter cell layers were blocked for 20 min with 10% blocking reagent and incubated for a further 1 h with 0.5 μg/ml anti-5-hydroxymethylcytosine (5hmC) antibody (Abgent). Afterward, the cells were washed three times with PBS and incubated for a further 1 h with an Alexa Fluor 488-labeled secondary antibody (Invitrogen) diluted 1:300 in blocking buffer. Finally, nuclei were stained with Hoechst 33258 dye.
For immunostaining, cell slides were mounted with Vectashield mounting medium, and immunofluorescence was visualized on a Leica laser-scanning microscope. For better visualization of the small and faint 5hmC spots in the nuclei, gain for nuclear visualization (Hoechst; blue) was strongly reduced to facilitate 5hmC visualization in euchromatin (black spots in low gain representation) and gain for 5hmC signals (Alexa Fluor 488; green) was strongly enhanced. Still, under this conditions, no background signal and no signal was found by using only the Alexa Fluor 488-labeled secondary antibody as a negative control (Invitrogen). For quantification of global cytosine 5hmC, the fluorescence in the plates was measured with a multiwell plate reader (Tecan). The amount of DNA (nuclei signal) was estimated using a standard curve prepared from calf thymus DNA. The signal of the fluorescence of the 5hmC staining was normalized to the amount of DNA. Also in this case, no signals were found when only the Alexa Fluor 488-labeled secondary antibody (Invitrogen) was used.
Specific Promoter Hydroxymethylation Analysis
To analyze the 5hmC content in the Atf4 proximal promoter/first untranslated exon, appropriate fragments of the targeted promoter regions were generated by digestion of 3 μg of genomic DNA from cells cultured for 16 h or for 1 day with 3 μm dl-SFN with 30 units of BstBI and XmaI for 1 h at 37 °C. Subsequently, the enzyme was heat-inactivated at 65 °C for 20 min, and DNA was cleaned up with the QIAquick DNA purification kit (Qiagen). Digestion of non-5mC DNA with the mentioned enzymes results in two fragments that overspan a CpG-rich region in the proximal promoter/first untranslated exon of the Atf4 gene (see Fig. 9D; GenBankTM accession number CH466550). After DNA purification, hydroxymethylated DNA fragments were extracted by immunoprecipitation as described previously (30). In brief, hydroxymethylated DNA of three independent biological experiments was captured by a specific hydroxymethylcytosine antibody (Active Motif catalog number 39769) coupled to magnetic beads to separate the 5hmC-containing DNA fragments. DNA was eluted from the magnetic beads with 75 μl of 2 m NaCl solution. Finally, the mean methylation or hydroxymethylation status of the fragments was determined by amplifying the fragments by quantitative real time PCR. Amplification ratios of the bound (hydroxymethylated) DNA fraction to unbound (non-hydroxymethylated) DNA fraction were calculated (for primers, see Table 1). For assessment of the specificity of the 5hmC antibody, either 40 ng of non-methylated, fully methylated, or fully hydroxymethylated DNA standards (Zymo Research) were run in parallel and amplified by real time PCR using the supplied PCR Primers.
FIGURE 9.
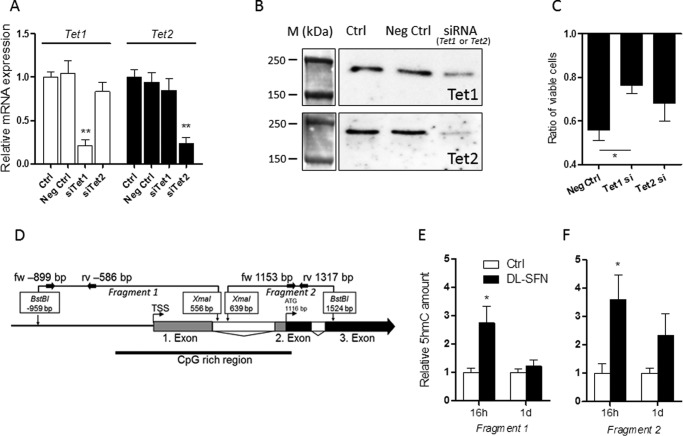
Effects of SFN-induced active DNA demethylation in osteoblasts. Validation of mRNA (A) and protein (B) knockdown by specific siRNAs against Tet1 and Tet2 in MC3T3-E1 cells is shown. The effect of Tet1 and Tet2 knockdown on the cytostatic effect induced by dl-SFN in MC3T3-E1 cells is shown in C. In the schematic representation of the Atf4 proximal promoter/gene region, untranslated exons, translated exons, and introns are represented by gray, black, and white boxes, respectively. Analyzed fragments that overspan a CpG-rich region (bold black line) are shown. Small black arrows represent primer binding sites to quantify the selected fragments (D). Relative 5hmC amounts on Fragment 1 (E) and Fragment 2 (F) of the Atf4 proximal promoter/first exon in MC3T3-E1 cells after 16 h and 1 day of 3 μm dl-SFN treatment are shown. In A, E, and F, n = 3. In C, n = 4. A representative image is shown in B. M, protein marker. For RT-qPCR analysis, Tet1 and Tet2 gene expressions are referred to 18S rRNA expression. Cell proliferation in C is measured by cell count. In all bar charts, Ctrl is set to 1, and treatments are referred to as -fold change to Ctrl. Values are represented as the mean ± S.D.; error bars represent S.D. *, p ≤ 0.05; **, p ≤ 0.01. Neg, negative; fw, forward; rv, reverse; TSS, transcription start site.
In Vivo Analysis of SFN Effects on Bone
Analysis of SFN in mice was based on a protocol published previously by Kong et al. (26). In our experimental setting, 8-week-old sham-operated or ovariectomized (OVX) C57BL6/J female mice were purchased from Charles River Laboratories. Mice were injected with 7.5 mm dl-SFN (200 μl of SFN at a concentration of 63.8 mg/ml/kg dissolved in ethanol and further diluted in PBS) intraperitoneally every other day for 5 weeks. Control mice received vehicle alone. As described by Kong et al. (26), the injection of this dose of dl-SFN does not show apparent adverse effects, including weight loss, alterations in physical appearance, or changes in behavior in the treated mice.
Microcomputed Tomography (μCT) Analysis
Images from proximal tibiae fixed in 4% formaldehyde were acquired in a SkyScan 1174 with a resolution of 6 μm (x-ray voltage, 50 kV). Image reconstruction was performed by applying a modified Feldkamp algorithm using the SkyScan NRecon software. Three-dimensional and two-dimensional morphometric parameters were calculated for the trabecular bone (350 consecutive slides; 6 μm thick) starting from 300 μm from the growth plate. Threshold values were applied for segmenting trabecular bone corresponding to bone mineral density values of 0.6/cm3 calcium hydroxyapatite. Three-dimensional parameters were based on analysis of a Marching Cubes type model with a rendered surface. Calculation all of two-dimensional areas and perimeters was based on the Pratt algorithm (38). Bone structural variables and nomenclature were those suggested in Bouxsein et al. (39).
Quantitative Backscattered Electron Imaging (qBEI)
Undecalcified distal femora from 13-week-old mice (sham/Ctrl (n = 5), sham/dl-SFN (n = 5), OVX/Ctrl (n = 4), and OVX/dl-SFN (n = 5)) were fixed and dehydrated in alcohol, embedded in polymethylmethacrylate, and prepared for backscattered electron imaging as described previously. Briefly, qBEI is based on backscattering of electrons from the surface layer (i.e. the initial ∼1.5 μm) of a bone section. The rate of these backscattered electrons is proportional to the weight concentration of mineral (hydroxyapatite) and thus of that of calcium in bone. Details of the method have been published elsewhere (11, 40, 41). A scanning electron microscope (DSM 962, Zeiss, Oberkochen, Germany) equipped with a four-quadrant semiconductor backscattered electron detector was used. The accelerating voltage of the electron beam was adjusted to 20 kV, the probe current was set to 110 pA, and the working distance was 15 mm. The cancellous and cortical bone areas were imaged at 200× nominal magnification (corresponding to a pixel resolution of 1 μm/pixel). The backscattered electron signal (grayscale) was calibrated using the “atomic number contrast” between carbon (Z = 6) and aluminum (Z = 13) as reference materials. From the calibrated digital images, frequency distribution of mineral concentration, the so-called bone mineralization density distribution (BMDD), was derived. The BMDD was characterized by five parameters: weighted mean calcium content (CaMean), mode calcium content (CaPeak; peak position), full width at half-maximum of the BMDD peak (CaWidth; reflecting the heterogeneity in matrix mineralization), the percentage of low mineralized bone area (CaLow; below 17.68 weight % calcium), the percentage of highly mineralized bone area (CaHigh; above the 95th percentile value of the corresponding control animal BMDD).
Statistical Analysis
Statistical analyses were performed using analysis of variance or Student's t test in Prism 4.03 (GraphPad Software, La Jolla, CA). Values of p ≤ 0.05 were considered significant. Each experiment consisted of at least three biological replicates. For RT-qPCR data, results from technical triplicates were averaged, and the mean value was treated as a single, biological statistical unit. Results are presented as means ± S.D.
Results
SFN Affects Cell Viability of Bone-related Cells
Our group and others have shown previously that the widely used cryopreservant DMSO triggers differentiation of MC3T3-E1 osteoblasts. Although use of DMSO is restricted in medical applications, there are intriguing analogies in the chemical structures of DMSO and plant secondary metabolites. As deduced from the IUPAC nomenclature, DMSO (methanesulfinylmethane) and the natural food compound SFN (1-isothiocyanato-4-methylsulfonylbutane) share striking molecular similarities. SFN carries an additional pentane group with terminal isothiocyanate (Fig. 1A). These structural similarities predict similarities in the biological effects of DMSO and SFN. Therefore, we tested the effects of DMSO and SFN on MC3T3-E1 differentiation by assessing the extent of extracellular matrix (ECM) mineralization. Under our conditions, staining for the late osteoblast biomarker Alizarin Red is not observed in our cultures for the first 2 weeks of culture but typically is evident after 3–4 weeks (42). Our results show that both DMSO and SFN have similar biological effects as revealed by increased matrix mineralization as early as 14 days of treatment (Fig. 1B). Strikingly, SFN is at least 4 orders of magnitude more potent than DMSO in stimulating matrix mineralization, suggesting that the methanesulfonyl group of DMSO is important but not sufficient for full biological activity.
FIGURE 1.
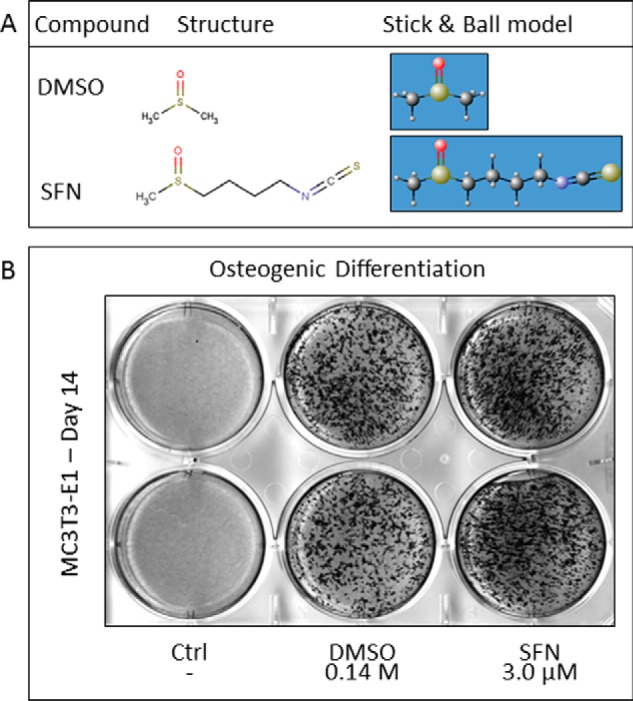
DMSO and SFN show structural similarities and analogous biological effects. DMSO and SFN contain a polar sulfoxide functional group. SFN carries an additional butane group with a terminal isothiocyanate group (A). DMSO and SFN increase matrix mineralization in MC3T3-E1 cells at 14 days of differentiation as revealed by Alizarin Red staining (B).
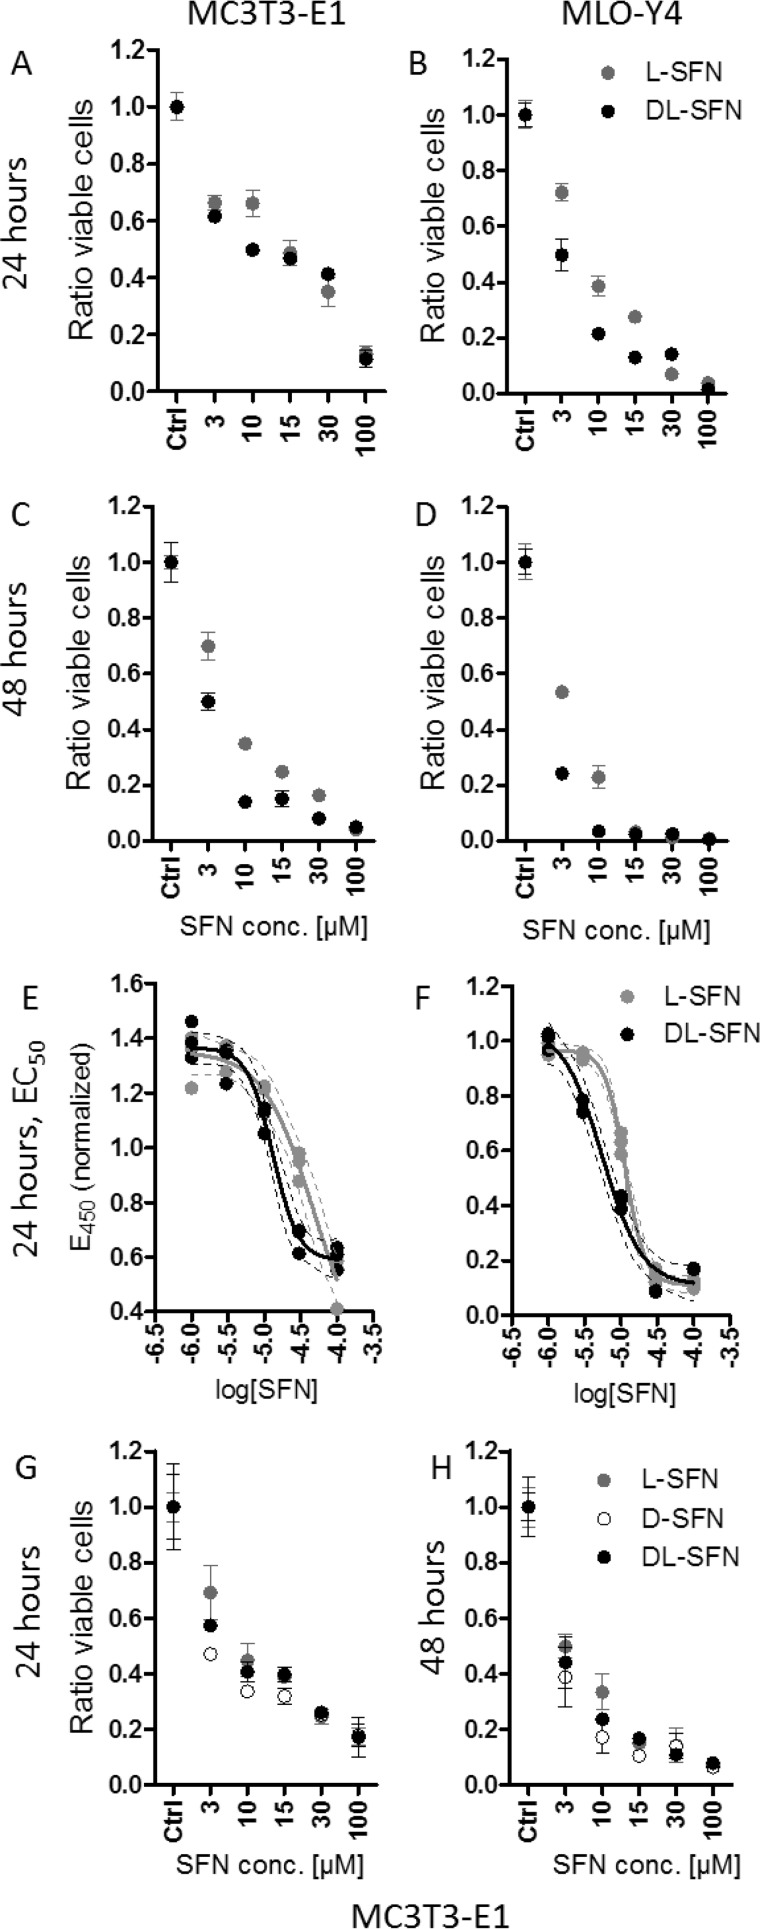
Because SFN has cell growth-suppressive effects (43–45), we evaluated the impact of SFN on cell proliferation and viability of bone-related immortalized cell lines. MC3T3-E1 osteoblasts and MLO-Y4 osteocytes were treated with increasing concentrations of SFN for up to 48 h (Fig. 2). Because SFN is a chiral molecule, we tested three different preparations: l-, d-, and dl-SFN, which is a mixture of both d and l enantiomers. Both l-SFN and dl-SFN have modest effects (<50%) on cell number in MC3T3-E1 and in MLO-Y4 after 24 h of treatment at a concentration of 3 μm (Fig. 2, A and B). At higher concentrations, both the l enantiomer and the dl mixture compromise cell viability with the greatest decrease in cell number observed for MLO-Y4 cells (Fig. 2B). Furthermore, dl-SFN has a somewhat stronger effect on cell survival compared with l-SFN in MLO-Y4 cells at most concentrations. Effects of l-SFN or dl-SFN on cell viability are slightly more pronounced after 48-h treatment in both MC3T3-E1 and MLO-Y4 cell lines (Fig. 2, C and D).
FIGURE 2.
SFN shows cell growth-suppressive effects in cells of the osteoblastic lineage. l-SFN and dl-SFN effects on proliferation/viability in MC3T3-E1 cells (A) and MLO-Y4 cells (B) after 24 and 48 h of SFN treatment (C and D) are shown. The EC50 for l-SFN is ∼48 μm and for dl-SFN is ∼13 μm in MC3T3-E1 cells (E) and ∼11 μm for l-SFN and ∼6 μm for dl-SFN in MLO-Y4 cells (F). A comparison of l-, d-, and dl-SFN on proliferation/viability in MC3T3-E1 cells after 24 (G) and 48 h (H) is shown. Cell proliferation in A–D, G, and H is measured by cell count; EC50 in E and F is measured by a 3-(4,5-dimethylthiazol-2-yl)-2,5-diphenyltetrazolium bromide-like assay; n = 4. Bars represent mean ± S.D.; error bars represent S.D.
To assess whether SFN affects cellular metabolic activity after 24 h of treatment, we performed an EZ4U assay, a 3-(4,5-dimethylthiazol-2-yl)-2,5-diphenyltetrazolium bromide-like assay that measures the capability of living cells to reduce tetrazolium salts in the mitochondria into formazan derivatives that absorb at 450 nm. Titration curves for both l-SFN and dl-SFN using either cell line revealed that the half-maximal effective concentration (EC50) of l-SFN is ∼48 μm and of dl-SFN is ∼13 μm in MC3T3-E1 cells (Fig. 2E), whereas lower doses are needed in MLO-Y4 cells (i.e. ∼11 μm for l-SFN and ∼6 μm for dl-SFN) (Fig. 2F). Hence, SFN has fewer metabolic effects on MC3T3-E1 osteoblasts than on MLO-Y4 osteocytes.
Remarkably, the preparation with both enantiomers (l- and dl-SFN) shows stronger biological effects compared with the sole l enantiomer, suggesting that the biological potency of SFN depends on steric considerations. Indeed, direct comparison of the effects of l-, dl-, and d-SFN enantiomers on cell proliferation in MC3T3-E1 cells shows that the d isoform most strongly affects cell proliferation after 24 (Fig. 2G) or 48 h (Fig. 2H) at the most concentrations tested. Taken together, the results show that 3 μm SFN is a relatively non-toxic dose (Fig. 2) that is biologically effective (see Fig. 1).
SFN Induces Extrinsic Apoptosis in Cells of the Osteoblastic Lineage
As we have shown previously, DMSO induces the extrinsic pathway of apoptosis (30), suggesting that the growth-suppressive action of SFN (as reflected by a decrease in cell proliferation and metabolic activity; see Fig. 1) may be caused by programmed cell death in both MC3T3-E1 osteoblasts and MLO-Y4 osteocytes. To test this possibility, we monitored expression levels and activity of apoptotic biomarkers. We found that Fas mRNA expression is not affected by either l- or dl-SFN in MC3T3-E1 and MLO-Y4 cells after 8 h of treatment (Fig. 3A). However, after 16 h of treatment, Fas mRNA expression is significantly increased in both cell types by dl-SFN treatment (Fig. 3B). Corroborating these results, the activity of Caspase 8 is significantly increased by l-SFN and dl-SFN after 24 h (Fig. 3C). Furthermore, we observed a significant increase in the activities of Caspase 3/7 upon dl-SFN treatment of MC3T3-E1 cells and MLO-Y4 cells for 24 h (Fig. 3D). These data indicate that SFN induces the extrinsic apoptotic pathway in osteogenic cells.
FIGURE 3.
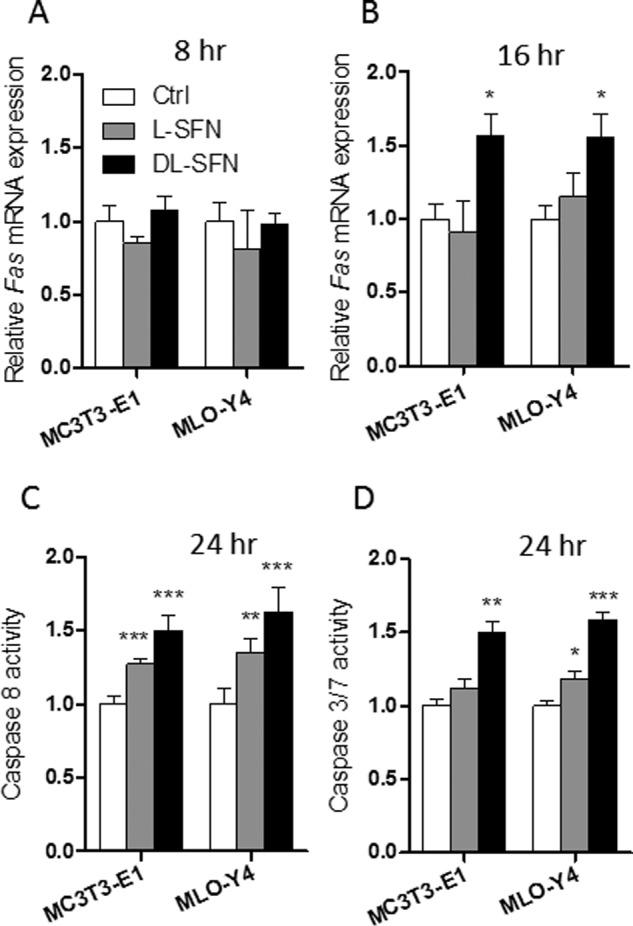
SFN induces extrinsic apoptosis in cells of the osteoblastic lineage. Fas mRNA expression after 3 μm l- or dl-SFN treatment in MC3T3-E1 and MLO-Y4 cells after 8 (A) and 16 h (B) is shown. Caspase 8 activity after 3 μm l-SFN and dl-SFN treatment at 24 h in both cell lines is shown in C. The effect of 3 μm dl-SFN treatment in MC3T3-E1 cells and of 3 μm l-SFN and dl-SFN in MLO-Y4 cells on the activities of Caspase 3/7 after 24 h is shown in D. For RT-qPCR analysis, Fas expression is referred to as 18S rRNA expression (A and B). In all graphs, Ctrl is set to 1, and treatments are referred to as -fold change to Ctrl. Values are represented as the mean ± S.D.; error bars represent S.D. For A and B, n = 3, and for C and D, n = 5. *, p ≤ 0.05; **, p ≤ 0.01; ***, p ≤ 0.001.
Osteogenic Long Term Effects of SFN
Beyond effects on cell growth and survival, SNF may affect osteoblast differentiation and activity. Therefore, we investigated the long term effects (>20 days) of l-SFN and dl-SFN on mineralization of osteoblasts, bone marrow stromal/stem cell (BMSC) cultures, and neonatal calvarial explants maintained in osteogenic medium. Treatment of MC3T3-E1 cells or BMSCs (Fig. 4A) significantly increases ECM mineralization, the principal marker for mature osteoblast function. Because l-SFN and dl-SFN have mild effects on cell survival (at 3 μm) in non-confluent MC3T3-E1 osteoblasts (see Fig. 2, A and C), we assessed cell number of both MC3T3-E1 cells and BMSCs in response to both enantiomer preparations. As anticipated, MC3T3-E1 and BMSC cultures treated with either SFN type exhibit modest lower cell numbers but higher mineral content per DNA unit after long term treatment, indicating that SFN-treated cells are more active in mineralization. To evaluate whether this bone anabolic effect occurs in explants that are rich in postproliferative mature osteoblasts, we measured ECM mineralization of newborn calvarial explants treated with 3 μm l- or dl-SFN for 14 days. As in the two-dimensional cell culture models, l- and dl-SFN each significantly increase ECM mineralization in calvarial explants (Fig. 4A). These data indicate that SFN is capable of biologically stimulating mineralization of neonatal bone tissue in culture. Next, we assessed whether SFN selectively modulates mRNA expression of differentiation-related genes that support mineralization in MC3T3-E1 cells. Treatment with increasing dl-SFN concentrations (1–30 μm) shows that the strongest up-regulating effects are induced at a concentration of 3 μm dl-SFN for the ECM-related genes Alpl, Bglap2, Col1a1, and Lox after 14 days of treatment. dl-SFN concentrations higher than 10–15 μm result in inhibition of cell proliferation and thus in poor RNA yields for RT-qPCR analysis (Fig. 4B). Furthermore, we were interested in the effects of the different SFN enantiomers on the expression of these genes at day 14 and at day 28 in MC3T3-E1 cells. Therefore, we directly compared the three SFN enantiomer preparations, d-, dl-, and l-SFN. At day 14, Alpl expression is significantly up-regulated by dl- and l-SFN preparations (Fig. 4C), and the racemic dl-SFN mixture significantly increases Lox mRNA expression at this time point (Fig. 4F). Bglap2 (Fig. 4D) and Col1a1 (Fig. 4E) are significantly up-regulated by d-SFN as well as by dl-SFN at day 14. Furthermore, at day 28, Bglap2 is the only gene that is still significantly up-regulated by d-SFN (Fig. 4D). Taken together, our results indicate that SFN promotes the expression of osteoblastic genes and mineralization.
FIGURE 4.
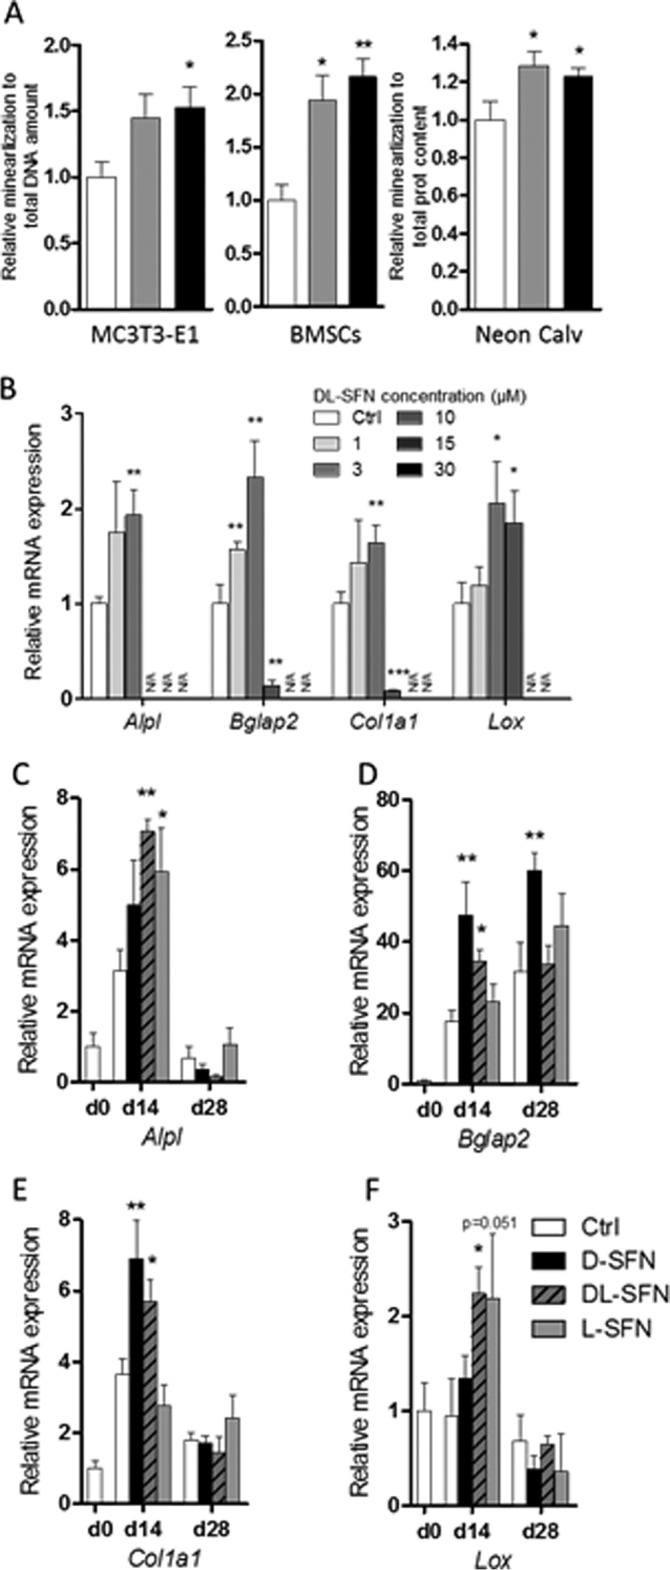
SNF enhances osteoblast differentiation and activity. ECM mineralization of MC3T3-E1 cells (day 21), BMSCs (day 21), or neonatal calvarial explants (day 14) as measured by Alizarin Red staining is shown in A. Concentration-dependent effects on mRNA expression of ECM-related genes by dl-SFN in MC3T3-E1 cells after 14 days is shown in B. mRNA expression of Alpl (C), Bglap2 (D), Col1a1 (E), and Lox (F) after treatment with 3 μm d-, dl-, or l-SFN in MC3T3-E1 cells for 14 or 28 days is shown. In A, for MC3T3-E1 and BMSCs, n = 3, and for neonatal calvariae, n = 9. For RT-qPCR analysis, gene expression is referred to 18S RNA expression. In B–E, n = 3. In B, very low, non-measurable expression values are referred to as N/A. In all graphs, Ctrl is set to 1, and treatments are referred to as -fold change to Ctrl. Values are represented as the mean ± S.D.; error bars represent S.D. *, p ≤ 0.05; **, p ≤ 0.01.
The Bone Anabolic Effects of SFN Are Reflected by Enhanced Expression of Primary Osteoblastic Transcription Factors
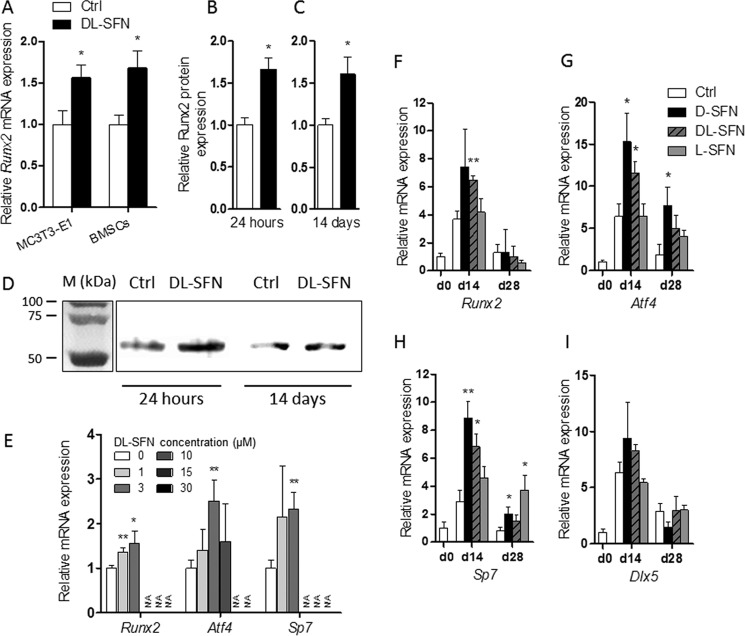
SFN may play a role in cellular differentiation by selectively modulating mRNA expression of osteogenic transcription factors. Therefore, we examined whether SFN affects the mRNA and protein expression of the bone-related master regulator Runx2 in mouse MC3T3-E1 cells or BMSCs. Treatment of cells with dl-SFN stimulates Runx2 mRNA expression in both cell types (Fig. 5A). Immunoblotting analysis of dl-SFN-treated MC3T3-E1 cells shows a significant increase in Runx2 protein expression after both 24 h (Fig. 5B) and 14 days (Fig. 5C) of treatment, thus validating the pro-osteogenic effects of SFN (see Fig. 4). Representative immunoblots of Runx2 protein expression are shown in Fig. 5D.
FIGURE 5.
SFN enhances expression of the osteoblastic master transcription factors. Treatment with 3 μm dl-SFN stimulates Runx2 mRNA expression in MC3T3-E1 cells and in BMSCs (A). In MC3T3-E1 cells, 3 μm dl-SFN significantly increases Runx2 protein expression after both 24 h (B) and 14 days (C) of treatment. Representative immunoblots of Runx2 protein expression are shown in D. M, protein marker. Concentration-dependent mRNA regulation of osteoblastic transcription factors by dl-SFN in MC3T3-E1 cells after 14 days is shown in E. mRNA expression of Runx2 (F), Atf4 (G), Sp7 (H), and Dlx5 (I) after treatment with 3 μm d-, dl-, or l-SFN in MC3T3-E1 cells for 14 (d14) or 28 days (d28) is shown. In A and E–I, for RT-qPCR analysis gene expression is referred to 18S rRNA expression. In B, Runx2 protein expression is referred to total protein expression. In E, very low, non-measurable expressions values are referred to as N/A. In A–C and E–I, n = 3. In all graphs, Ctrl is set to 1, and treatments are referred to as -fold change to Ctrl. Values are represented as the mean ± S.D.; error bars represent S.D. *, p ≤ 0.05; **, p ≤ 0.01.
After 14 days of treatment, similar to the ECM-related genes (see Fig. 4) as well as for the osteoblastic transcription factors Runx2, Atf4, and Sp7/Osx, 3 μm dl-SFN shows the strongest positive effect in MC3T3-E1 cells (Fig. 5E). In regard to the potency of the different SFN isomers, comparison of the three SFN preparations shows that for Runx2 (Fig. 5F), Atf4 (Fig. 5G), and Sp7/Osx (Fig. 5H) the strongest effects are induced by the d- or dl-SFN mixture at day 14. At day 28, significant up-regulations are still observed for Atf4 and Sp7/Osx genes by the d- or l-SFN preparations. In contrast to DMSO (30), SFN does not increase the expression of the osteoblastic transcription factor Dlx5 at the times measured (Fig. 5I).
SFN Attenuates RANKL/Tnfsf11 Expression in Mouse Calvarial Explants
Runx2 expressed in osteoblastic cells mediates biological feedback by promoting osteoclast differentiation via up-regulation of Tnfsf11 (RANKL) (46). Tnfsf11 promotes osteoclast formation and survival by binding to the osteoclastic receptor Tnfrsf11a (alias RANK), which in turn activates nuclear factor-κB (47). Furthermore, osteocyte-derived Tnfsf11 controls bone remodeling during postnatal development and in adult mammals. In osteocyte-like MLO-Y4 cells, dl-SFN reduces Tnfsf11 mRNA expression at both 3 and 8 days after treatment, although changes in expression are only significant at the latter time point (Fig. 6A). More importantly, SFN decreases Tnfsf11 expression in mouse calvarial explants from neonatal mice and to a greater extent in explants from adult mice after 12 days of treatment with dl-SFN ex vivo (Fig. 6B). These results suggest that SFN may potentially promote net bone accumulation by suppressing RANKL/Tnfsf11-induced osteoclast formation.
FIGURE 6.
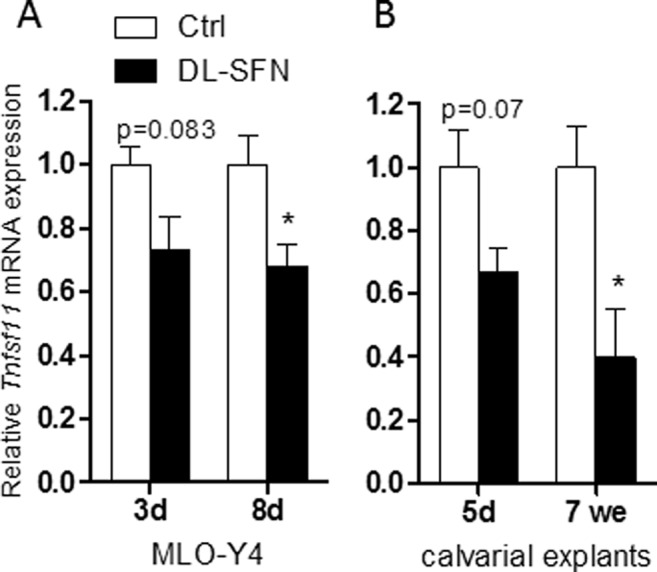
SFN attenuates RANKL/Tnfsf11 expression in MLO-Y4 cells and mouse calvarial explants. Tnfsf11 expression in osteocyte-like MLO-Y4 cells upon 3 μm dl-SFN treatment at 3 and 8 days of treatment is shown in A. In mouse calvarial explants from neonatal (5 days (d)) and from adult mice (7 weeks (we)), 3 μm dl-SFN decreases Tnfsf11 expression after 12 days of treatment (B). Tnfsf11 gene expression is referred to 18S rRNA expression; n = 3. In all graphs Ctrl is set to 1, and treatments are referred to as -fold change to Ctrl. Values are represented as the mean ± S.D.; error bars represent S.D. *, p ≤ 0.05.
SFN Induces Global DNA Hydroxymethylation Changes
As we have shown previously, DMSO dramatically induces active DNA demethylation in preosteoblastic MC3T3-E1 cells within less than 1 day of treatment (<16 h) through formation of 5hmC (30). Due to the structural and biological similarities between DMSO and SFN, we analyzed whether SFN alters the level of active DNA demethylation in cells of the osteogenic linage. Indeed, we measured a significant global increase in 5hmC as a marker for ongoing active DNA demethylation upon treatment with either l- or dl-SFN in MC3T3-E1 cells at 16 h after treatment based on immunofluorescence laser-scanning microscopy (Fig. 7A) and spectrophotometry (Fig. 7B). As expected, 5hmC spots are observed in the looser euchromatic regions (dark nuclear parts in the low gain picture version in Fig. 7A), demonstrating opening of chromatin by active DNA demethylation after SFN treatment. Interestingly, in MLO-Y4 osteocytes that are differentiated beyond the osteoblastic stage, both l- and dl-SFN do not elevate 5hmC levels (Fig. 7B). These findings collectively suggest that SFN selectively induces active DNA demethylation in osteoblastic cells that are at early rather than at late stages of osteogenic differentiation.
FIGURE 7.
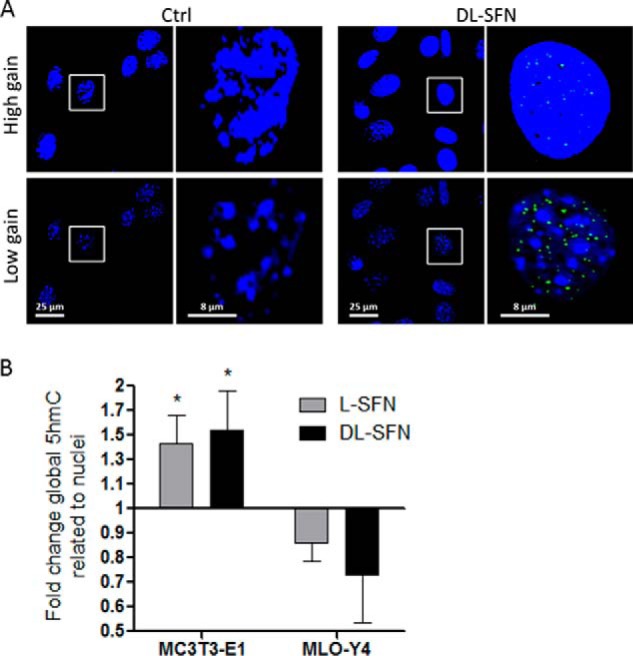
SFN affects global DNA hydroxymethylation status. MC3T3-E1 nuclei were stained by Hoechst dye and are represented at high and low gain by confocal microscopy. Global nuclear 5hmC levels (green dots) in MC3T3-E1 cells after 16 h of treatment with 3 μm dl-SFN are shown. The gain for nuclear visualization is strongly reduced to facilitate 5hmC visualization in euchromatin (black spots in low gain representation) (A). Global DNA hydroxymethylation at 16 h after treatment with 3 μm l- and dl-SFN in MC3T3-E1 cells and in MLO-Y4 cells was analyzed spectrophotometrically (B). In A, representative images are shown. In B, n = 4. Ctrl is set to 1, and treatments are referred to as -fold change to Ctrl. Values are represented as the mean ± S.D.; error bars represent S.D. *, p ≤ 0.05.
SFN Transiently Enhances Expression of Tet1 in Osteoblastic Cells
Global changes in 5hmC levels are mediated by enzymes that control DNA hydroxymethylation and are encoded by Tet genes. All three Tet genes (Tet1–3) are expressed in MC3T3-E1 cells, and expression of Tet1 and Tet2 decreases whereas expression of Tet3 increases within the first 8 days of MC3T3-E1 osteoblast differentiation (Fig. 8A). However, the levels of the Tet genes are distinctly regulated during early stages in MLO-Y4 cells. Tet1 is much more rapidly down-regulated in MLO-Y4 cells compared with MC3T3-E1 cells, whereas Tet2 and Tet3 levels are steadily up-regulated (Fig. 8B). We next examined mRNA expression of Tet genes in the absence or presence of dl-SFN in both MC3T3-E1 and MLO-Y4 cells. Beyond the modulations in Tet1 and Tet2 levels in response to biological induction of differentiation, we found that expression of Tet1 and Tet2 increases to a limited degree (between 20 and 40%) by dl-SFN at 8 and 16 h after treatment in MC3T3-E1 cells; albeit these values reach statistical significance only for Tet1 at the 16-h time point (Fig. 8C). dl-SFN does not positively change mRNA expression of Tet1 or Tet2 in MLO-Y4 cells (Fig. 8D) or Tet3 in both cell lines (Fig. 8, C and D). We conclude that mRNA levels of the hydroxylation enzymes Tet1 and Tet2 are modestly regulated by SFN during bone cell differentiation and may perhaps contribute to dl-SFN-induced changes in global hydroxymethylation.
FIGURE 8.
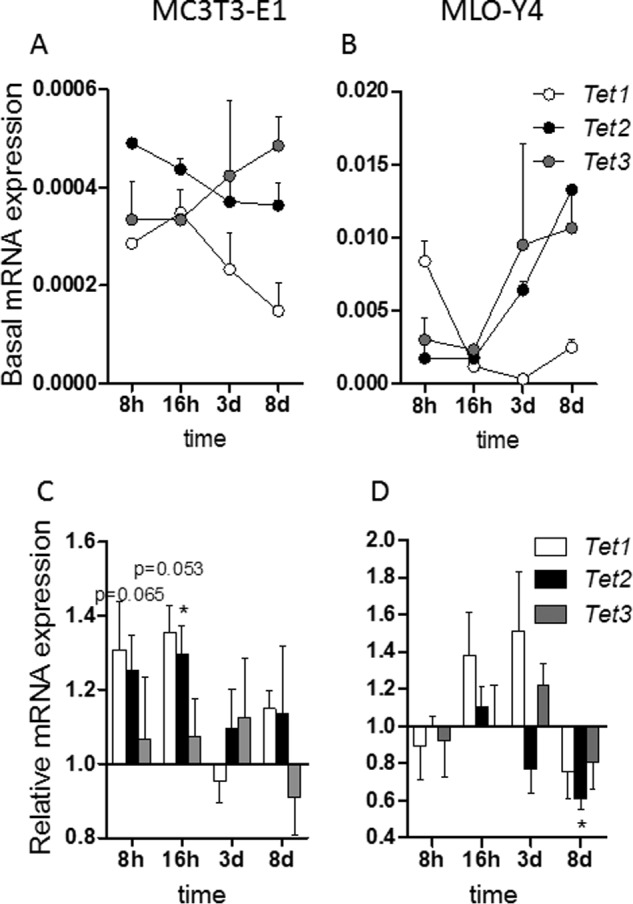
SFN transiently enhances expression of Tet1 in osteoblastic cells. Time-dependent Tet1, Tet2, and Tet3 expression patterns in MC3T3-E1 cells (A) and MLO-Y4 cells (B) are shown. d, days. Expression of Tet1, Tet2, and Tet3 by 3 μm dl-SFN at 8 and 16 h after treatment in MC3T3-E1 cells is shown in C. 3 μm dl-SFN does not significantly increase mRNA expression of Tet1, Tet2, or Tet3 in MLO-Y4 cells (D). For RT-qPCR analysis, Tet1, Tet2, and Tet3 gene expressions are referred to 18S rRNA expression; n = 3. In C and D, Ctrl is set to 1, and treatments are referred to as -fold change to Ctrl. Values are represented as the mean ± S.D.; error bars represent S.D. *, p ≤ 0.05.
Effects of SFN-induced Active DNA Demethylation in MC3T3-E1 Osteoblasts
The results presented here are consistent with the idea that Tet-dependent hydroxymethylation may compromise cell survival as shown previously by our group (30). To test this hypothesis, we treated MC3T3-E1 cells with non-silencing RNA (negative control) or siRNA against either Tet1 or Tet2 (Fig. 9, A and B) prior to treatment with 3 μm dl-SFN. Depletion of Tet1 but not Tet2 significantly reduces the cytostatic effect of dl-SFN (Fig. 9C) in MC3T3-E1 cells, concurring with our previous results with DMSO (30).
The early effect of SFN on osteoblastic gene expression (e.g. Runx2; Fig. 5B) suggests that SFN, similarly to DMSO (30), promotes osteoblastic differentiation by active DNA demethylation. The Runx2 P1 promoter, which is active in osteoblasts (48, 49), is not CpG methylation-sensitive (not shown), which may indicate an indirect or active DNA demethylation-independent effect of SFN on Runx2 expression. However, a CpG-rich region is present in the Atf4 proximal promoter/first exon region of the gene (Fig. 9D). As shown in Fig. 9, E and F, already after 16 h and partially after 1 day of treatment, 3 μm dl-SFN treatment significantly increases the 5hmC levels in the selected fragments of the proximal promoter region/first-second exon of the Atf4 gene by 3–4-fold. In summary, these results indicate that dl-SFN-induced active DNA demethylation affects primary cellular functions in MC3T3-E1 cells.
Effects of SFN on Osteoclast Resorption and Apoptosis
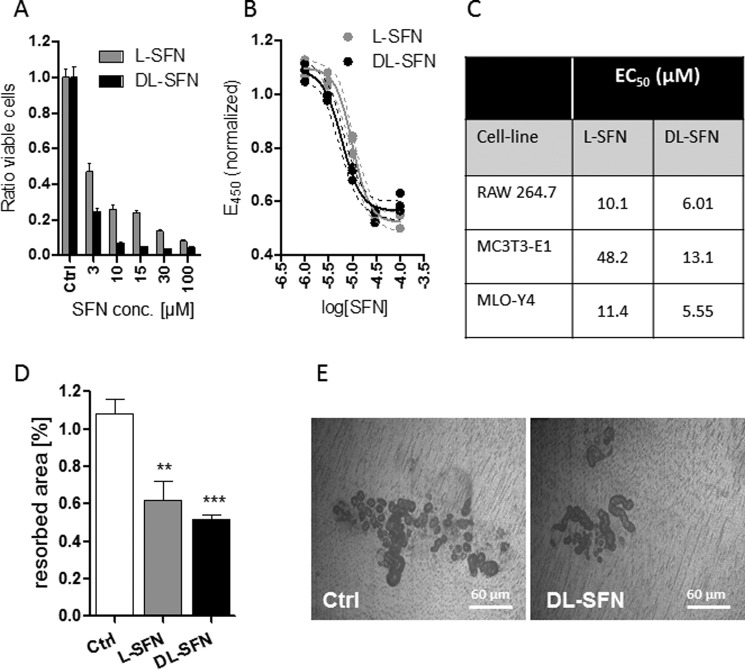
Because SFN has been shown to inhibit osteoclastogenesis by suppressing nuclear factor-κB (28) and it also has an antiproliferative effect in bone anabolic MC3T3-E1 and MLO-Y4 cells, we examined whether SFN affects proliferation and activity of RAW 264.7 cells. Treatment of these cells with increasing concentrations of SFN for 24 h with the two different preparations of SFN (i.e. l-SFN and dl-SFN) reduces the number of viable cells at doses of 3 μm and higher (Fig. 10A). This inhibitory effect appears more pronounced compared with observations made with osteogenic cell lines (see Fig. 2). Furthermore, SFN strongly reduces the cellular metabolic activity of RAW 264.7 cells in EZ4U assays (Fig. 10B). Also for this parameter, a stronger effect in the RAW 264.7 cells is observed when compared with the osteogenic cell lines (Fig. 10C). We next assessed whether these negative effects alter the functional capacity of osteoclasts in bone resorption. Treatment with SFN significantly reduces the area resorbed by primary mouse osteoclast cultures on ivory discs (Fig. 10, D and E). We also investigated whether SFN alters progression of osteoclastic differentiation in RAW 264.7 cells upon induction with RANKL and macrophage colony-stimulating factor by monitoring the temporal expression of classical osteoclastic markers (e.g. Acp5, Clcr, and Ctsk). However, we did not observe appreciable changes in the expression of these genes upon co-treatment with SFN (data not shown). Hence, SFN primarily affects activity of osteoclastic cells via its cytostatic effects.
FIGURE 10.
SFN strongly inhibits viability and resorption of osteoclasts. l-SFN and dl-SFN effects on RAW 264.7 cells on proliferation/viability after 24 h of treatment are shown in A. For RAW 264.7 cells, the EC50 for l-SFN is ∼10.10 μm and for dl-SFN is ∼6.01 μm (B). SFN affects cell metabolic activity most strongly in RAW 264.7 cells when compared with cells of the osteoblastic lineage (C). The effect of 3 μm l- or dl-SFN on dentin resorption by primary mouse osteoclast cultures is shown in D. A representative image of osteoclast resorption trails and pits on dentin is shown in E. Cell proliferation in A is measured by cell count. EC50 in B is measured by a 3-(4,5-dimethylthiazol-2-yl)-2,5-diphenyltetrazolium bromide-like assay. For A and B, n = 4, and for C, n = 9. Bars represent mean ± S.D.; error bars represent S.D. **, p ≤ 0.01; ***, p ≤ 0.001.
SFN Induces FAS-dependent Extrinsic Apoptosis in Preosteoclastic Cells
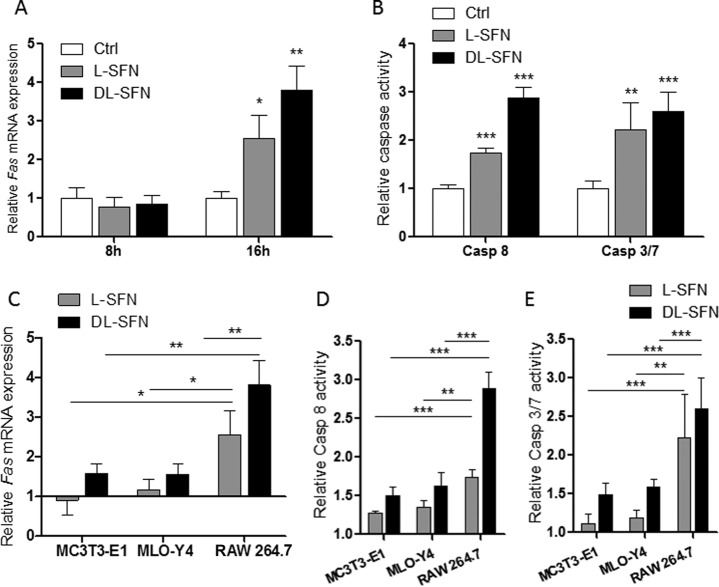
Because SFN induces apoptotic markers in MC3T3-E1 osteoblasts and MLO-Y4 osteocytes (see Fig. 3), we examined whether RAW 264.7 are sensitive to programmed cell death. Similar to MC3T3-E1 and MLO-Y4 cells, the results show that treatment of RAW 264.7 preosteoclastic cells with 3 μm l- or dl-SFN up-regulates expression of the proapoptotic gene Fas at 16 h but not at 8 h (Fig. 11A). In addition, either SFN preparation stimulates Caspase 8 and Caspase 3/7 activity (Fig. 11B), indicating that SFN induces the Fas-Caspase 8-Caspase 3/7 pathway that defines extrinsic apoptosis. Similar to findings with MC3T3-E1 osteoblasts and MLO-Y4 osteocytes (see Fig. 3), the dl-SFN mixture is more potent than the pure l-SFN enantiomer in inducing apoptosis (Fig. 11, A and B). More importantly from a biological perspective, we observed that bone-resorbing RAW 264.7 osteoclasts are twice as sensitive to apoptotic induction as the bone anabolic MC3T3-E1 osteoblasts and MLO-Y4 osteocytes (Fig. 11, C–E). These findings suggest that SFN may positively affect bone homeostasis in vivo by preferentially inducing apoptosis in osteoclasts.
FIGURE 11.
SFN induces FAS-dependent extrinsic apoptosis pathway in preosteoclastic cells. mRNA expression of Fas in RAW 264.7 preosteoclastic cells after treatment with 3 μm l- or dl-SFN for 16 h is shown in A. An increase of Caspase 8 and Caspase 3/7 activity in RAW 264.7 cells is seen after treatment with a 3 μm concentration of either SFN preparation after 24 h of treatment (B). A comparison for Fas induction (C) activation of Caspase (Casp) 8 (D) and Caspase 7 (E) activity by SFN between RAW 264.7 osteoclasts, MC3T3-E1 osteoblasts, and MLO-Y4 osteocytes is shown. For RT-qPCR analysis, Fas expression is referred to 18S rRNA expression. In all graphs, Ctrl is set to 1, and treatments are referred to as -fold change to Ctrl. Values are represented as the mean ± S.D.; error bars represent S.D. For A, n = 3, and for B, n = 5. *, p ≤ 0.05; **, p ≤ 0.01; ***, p ≤ 0.001.
SFN Induces Global DNA Hydroxymethylation and Controls Tet1-dependent Cell Death in Osteoclasts
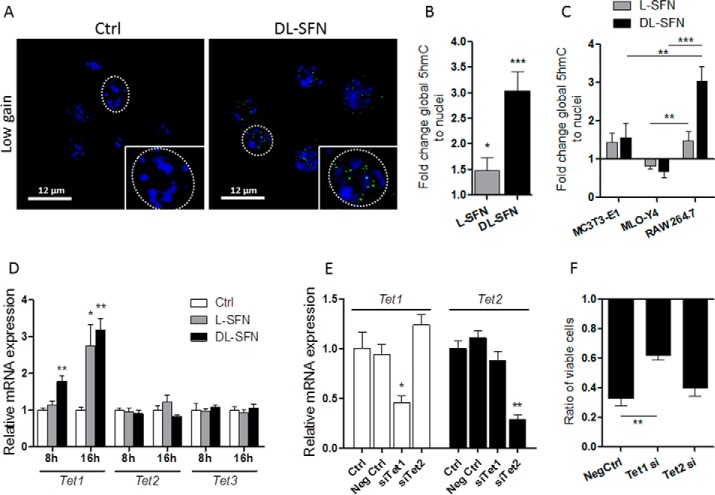
Similar to MC3T3-E1 preosteoblasts, we tested whether SFN alters active DNA demethylation through formation of 5hmC in RAW 264.7 preosteoclasts. Treatment of these cells with 3 μm dl-SFN for 16 h strongly increases the global levels of 5hmC (∼3-fold) as measured by immunofluorescence microscopy (Fig. 12A) and spectrophotometry (Fig. 12B). The l-SFN enantiomer that has lower biological activity exhibits a less pronounced effect (<2-fold) (Fig. 12B). The observed changes in 5hmC levels are most prominent in RAW 264.7 cells compared with MC3T3-E1 and MLO-Y4 cells (Fig. 12C). The mRNA levels of the hydroxymethylation-related gene Tet1 but not of Tet2 or Tet3 are up-regulated after dl-SFN treatment in RAW 264.7 cells, which becomes evident at 8 h but is more pronounced at 16 h (Fig. 12D). Therefore, to test whether the strong cytostatic effects induced by SFN are dependent on the up-regulation of Tet1 similar to MC3T3-E1 preosteoblasts, we pretreated RAW 264.7 cells with non-silencing RNA (negative control) or siRNA for either Tet1 or Tet2 (Fig. 12E). Again depletion of Tet1 but not Tet2 reduced the cytostatic effect of dl-SFN (Fig. 12F), concurring with the data from the MC3T3-E1 cells and with our previous results (30).
FIGURE 12.
SFN induces global DNA hydroxymethylation and induces Tet1-dependent cell death in RAW 264.7 preosteoclasts. Global nuclear (blue) 5hmC levels (green dots) in RAW 264.7 cells after 16 h of treatment with 3 μm dl-SFN are shown. Nuclear gain settings are strongly reduced to facilitate 5hmC visualization in euchromatin (black spots in low gain representation). The original nuclear frame, as seen at high gain in confocal microscopy, is delineated by a dotted line for the enlarged nucleus (A). Quantitative analysis of global 5hmC by treatment with 3 μm l-SFN and dl-SFN in RAW 264.7 cells after 16 h is shown in B. A comparison of changes in global 5hmC levels among RAW 264.7, MC3T3-E1, and MLO-Y4 cells upon 3 μm dl-SFN treatment after 16 h is shown in C. The effect of 3 μm l- or dl-SFN on Tet1, Tet2, and Tet3 mRNA expression after 8 and 16 h of treatment in RAW 264.7 cells is shown in D. Validation of mRNA expression knockdown by specific siRNAs against Tet1 and Tet2 in RAW 264.7 cells is shown in E. The effect of Tet1 and Tet2 knockdown on the cytostatic effect induced by dl-SFN in RAW 264.7 cells is shown in F. In A, representative images are shown. In B, n = 4. For RT-qPCR analysis, Tet1, Tet2, and Tet3 gene expressions are referred to 18S rRNA expression; n = 3. Cell proliferation in F is measured by cell count; n = 4. In all graphs. Ctrl is set to 1, and treatments are referred to as -fold change to Ctrl. Values are represented as the mean ± S.D.; error bars represent S.D. *, p ≤ 0.05; **, p ≤ 0.01; ***, p ≤ 0.001. Neg, negative.
Taken together, our results show that the two organosulfur compounds DMSO (30) and SFN induce active DNA demethylation via up-regulation of the Tet genes in vitro. This epigenetic reprogramming of the chromatin leads to apoptosis of preosteoclasts but only to a lower extent of preosteoblasts. More importantly, SFN leads to enhanced osteoblast differentiation without promoting osteoclast differentiation. Furthermore, in osteocytes and bone tissue explants, SFN decreases the expression of RANKL/Tnfsf11, a major activator of osteoclastogenesis. Although the mechanism of this modulation remains to be investigated, it could be associated with reduced reactive oxygen species required for osteoclast differentiation (50) (Fig. 13).
FIGURE 13.
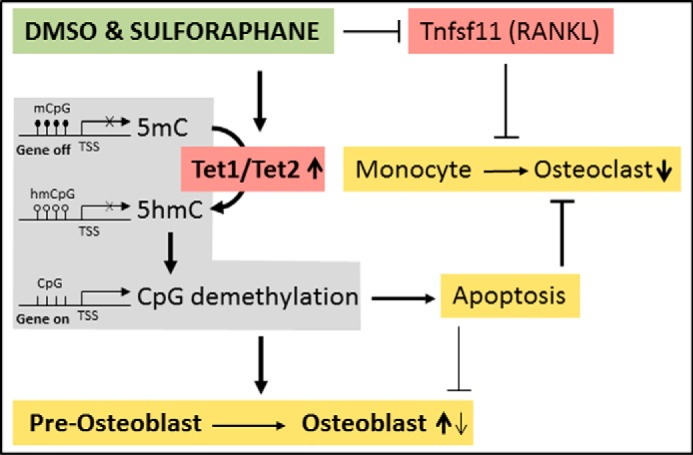
Schematic overview of the effects of SFN/DMSO on bone cells. DMSO and SFN induce active DNA demethylation via up-regulation of the Tet genes in vitro. This leads to apoptosis of preosteoclasts and to a lesser extent of preosteoblasts. Active DNA demethylation also enhances osteoblast differentiation. SFN further decreases the expression of RANKL/Tnfsf11 by a yet undefined mechanism. mCpG, methylated cytosines; hmCpG, hydroxymethylated cytosines; CpG, unmethylated CpGs; TSS, transcriptional start site.
SFN Has Anabolic and Antiresorptive Effects on Bone Homeostasis in Vivo
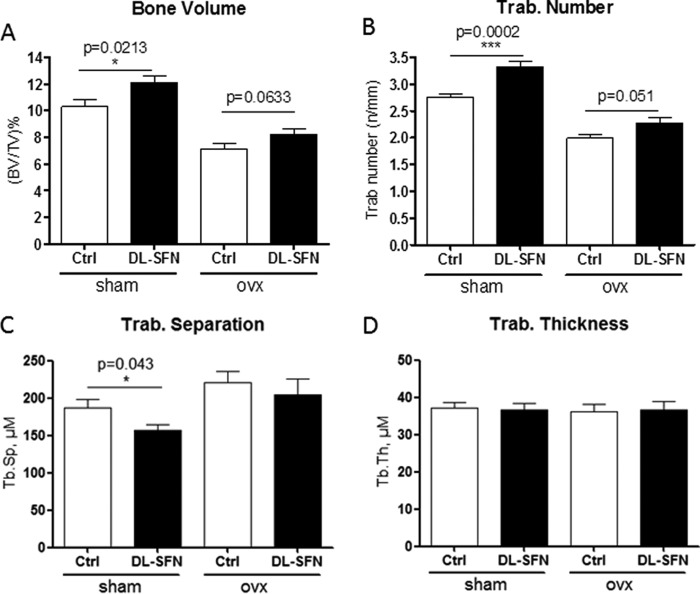
Our in vitro results show that SFN stimulates osteogenic differentiation as well as acts as an antiresorptive agent by blocking osteoclastogenesis and increasing osteoclast apoptosis. Therefore, the attractive possibility arises that SFN may affect bone homeostasis in vivo. As shown by Kong et al. (26), SFN treatment of young mice for 5 weeks with 7.5 mm dl-SFN (which results in a serum concentration of 24 μm and lower 4 h postinjection) every other day has no side effects on the animals. We investigated the biological effects of SFN in OVX mice that exhibit bone loss due to estrogen deficiency (Fig. 14). Treatment of sham-operated young adult mice (8 weeks old) with dl-SFN for 5 weeks shows significantly higher metaphyseal cancellous bone volume per tissue volume (BV/TV) (Fig. 14A) and trabecular number (Tb.N) (Fig. 14B) in proximal tibiae, decreased trabecular separation (Tb.Sp) (Fig. 14C), and no effect on trabecular thickness (Tb.Th) (Fig. 14D) in these same samples. Furthermore, dl-SFN treatment for 5 weeks does not affect cortical thickness in any of the treated groups (data not shown). Thus, the relatively higher BV/TV values found in the dl-SFN-treated animal groups are reflected by changes in trabecular number and not due to a thickening of the trabeculae by enhanced bone apposition. Importantly, SFN treatment of OVX mice reduces bone loss due to estrogen deficiency as reflected by mitigation of the observed OVX-dependent decrease of trabecular number (Fig. 14, A and B).
FIGURE 14.
SFN has an anabolic effect on bone homeostasis in C57BL/6 mice. Effects of treatment of sham-operated and ovx young adult mice (8 weeks old) with 7.5 mm dl-SFN for 5 weeks on BVTV (A), Tb.N in proximal tibial bone (B), Tb.Sp (C), and Tb.Th (D) are shown. n = 9 for the sham group, n = 7 for the Ctrl OVX group, and n = 8 for the dl-SFN group. Values are represented as the mean ± S.D.; error bars represent S.D. *, p ≤ 0.05; ***, p ≤ 0.001.
To complement the μCT results on bone microstructural indices, we measured the mineralization status of the bone matrix by assessing local mineral content and distribution using qBEI. Mice were examined for changes in BMDD parameters CaMean, CaPeak, CaWidth, CaLow, and CaHigh reflecting bone turnover, mineralization kinetics, and average bone matrix age (40, 51) (Table 2 and Fig. 15). Two-way analysis of variance of CaPeak and CaWidth of trabecular bone revealed significant differences between control (sham) and estrogen-depleted (OVX) mice but no effects for treatment with dl-SFN. The parameters CaPeak and CaWidth correlate significantly with the corresponding μCT parameters BV/TV, Tb.N, and Tb.Sp (Table 2 and Fig. 15, A–F). Independently of the treatment, it appears that mice with a higher trabecular number have higher matrix mineralization (CaPeak; Fig. 15C) that is less heterogeneous (CaWidth; Fig. 15D), whereas mice with a low trabecular number have a less mineralized matrix that tends to be more heterogenous. Notably, the correlations between structural indices and BMDD parameters show a clear separation between the sham and OVX groups. Consistent with the expected lower bone turnover rates in sham versus OVX mice, the sham group has higher CaPeak and lower CaWidth values than the OVX group. Taken together, our data suggest that dl-SFN has a beneficial effect on bone volume by mitigating loss in trabecular bone number due to both anabolic and antiresorptive cellular effects without altering bone matrix mineralization content and distribution.
FIGURE 15.
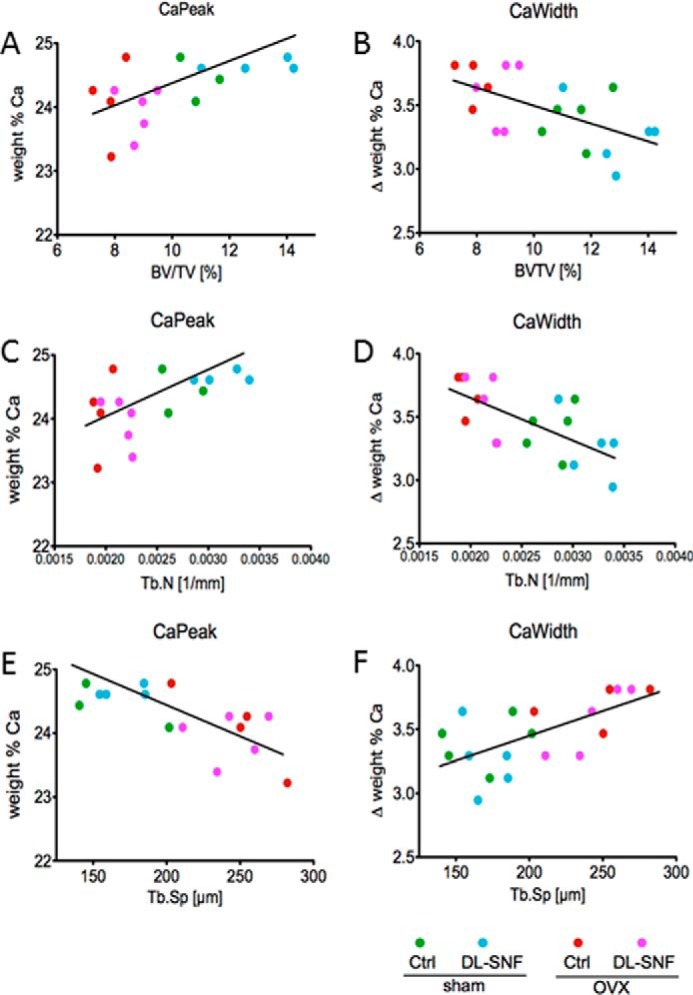
Evidence of correlations of matrix mineralization parameters (qBEI) with structural parameters (μCT). The parameters CaPeak (the most frequent calcium content) and CaWidth (the width of the calcium content distribution) correlate significantly with the corresponding μCT parameters BV/TV (A and B), Tb.N (C and D), and Tb.Sp (E and F). Trab, trabecular.
Discussion
In this study, we show that the broccoli-derived natural compound SFN has very similar osteoblast stimulatory effects as the structurally related organic solvent DMSO, which is known to promote osteoblast differentiation (30, 36). Compared with DMSO, SFN contains an aliphatic isothiocyanate moiety instead of a methyl group, and this modification apparently increases its biological potency in stimulating osteoblast differentiation by >10,000-fold. We tested whether SFN has anabolic effects on bone in vivo and found that SFN increases bone volume by increasing trabecular number albeit not cortical thickness. In addition, SFN mitigates bone loss induced by estrogen depletion. Thus, SFN exhibits promising efficacy as a possible treatment modality for bone loss-related pathologies like osteoporosis.
Alteration of the epigenome by nutritional habits or specific food compounds is associated with promoting or repressing specific gene expression and pathologic conditions (52–55). SFN has previously been shown to inhibit histone deacetylase activity (18, 45, 56). In human volunteers, a single ingestion of a small amount of broccoli sprouts (∼70 g), which contain particularly high amounts of SFN, inhibits histone deacetylase activity in circulating peripheral blood mononuclear cells and consequently induces histone H3 and H4 acetylation a few hours after intake (56). The epigenetic landscape of cells can also be modified by other food compounds and secondary plant metabolites, including the short-chain fatty acid butyrate, which is abundant in rancid butter; resveratrol (57), a natural phenol that is enriched in grapes and peanuts; and organosulfur compounds (58, 59), which are enriched in garlic. Our results define SFN as an epigenetic bone anabolic agent.
A number of studies that assessed the role of SFN as a tumor cell inhibitor have recognized its epigenetic potential (60–64). The results of this work show that SFN, besides possible effects on DNA demethylation patterns from ascorbic acid occurring in the culture medium (65), promotes Tet-mediated hydroxymethylation, which is a key mechanistic step in the derepression of gene transcription silenced by CpG methylation, and demethylation of FAS promoter frequently activates the expression of this gene as shown in tumor treatment (66). Because loss of CpG methylation decreases the gene-repressive histone mark H3K27me3 (67), SFN may indirectly increase formation of transcriptionally active acetylated histones H3 and H4. Hence, our findings suggest that SFN may be an indirect histone deacetylase inhibitor via direct effects on hydroxymethylation.
Our findings indicate that SFN potentially has a two-pronged effect on bone formation and homeostasis by acting differently on osteoblasts and osteoclasts. Although matrix mineralization is remarkably enhanced during osteoblast differentiation, SFN does not promote osteoclastogenesis, reflecting lineage-specific effects in cellular differentiation. Furthermore, osteoclast viability is rather sensitive to escalating doses of SFN; however, osteoblasts are more refractory to the cytotoxic effects of SFN, and they are fairly resistant to apoptosis (via the Fas-Caspase 8-Caspase 3/7 pathway) at a bone anabolic dose (3 μm) that induces apoptosis in osteoclasts. These divergent and potentially cooperating biological effects of SFN may be of immediate clinical interest because of adverse effects observed for some bisphosphonate-based therapies, which are a first line of defense against bone loss (68). The bone-stimulatory effects of SFN render this natural food compound a viable candidate for alternative therapeutic strategies to promote bone formation.
SFN-dependent enhancement of Tet1-mediated apoptosis may exert a net bone anabolic effect by selective attrition of osteoclasts relative to osteoblasts. Furthermore, SFN has a positive effect on osteoblast activity by inducing bone matrix mineralization in in vitro cell culture (e.g. primary osteocytes) and ex vivo tissue culture (e.g. calvarial explants of both newborn and adult mice). These biological effects are linked to the up-regulation of genes involved in matrix mineralization and enhanced expression of osteoblastic transcription factors like Runx2, Sp7, and Atf4. Although the Runx2 P1 promoter or the Sp7 promoter are not CpG methylation-sensitive by SFN treatment, we measured a significant increase in 5hmC levels in the Atf4 promoter with a concomitant increase in Atf4 gene expression, demonstrating a mechanistic link between active DNA demethylation and enhanced osteoblastic differentiation. Interestingly, as we have shown before, early modulation of epigenetic marks like inhibition of histone acetylation or methylation (69, 70) and, as shown here, an increase of active DNA demethylation show long term effects on osteoblastic differentiation, suggesting that SFN may specifically support epigenetic chromatin reprogramming at early differentiation stages.
SFN significantly decreases the expression of the osteoclast activator Tnfsf11 (RANKL) in osteocytes. This diminished expression cannot be directly accredited to SFN-dependent mechanisms affecting hydroxymethylation. However, because osteocytes represent a main systemic source for Tnfsf11/RANKL, changes in the expression of this osteoclastogenic ligand may perhaps contribute to the antiresorptive effects of SFN. Furthermore, SFN was shown to activate the transcription factor NRF2 (Nfe2l2), which promotes the expression of the two key antioxidant genes peroxiredoxin-1 and NAD(P)H dehydrogenase quinone 1, thus activating a sustained antioxidant response in osteoclast progenitors. The inhibition of osteoclast differentiation might thus also be associated with a down-regulation in RANKL-dependent intracellular reactive oxygen species levels in preosteoclastic cells (50). Thus, the effects observed by SFN in osteoclasts and in osteoblasts might also partially be attributed to its antioxidative proprieties.
From a clinical perspective, bisphosphonates (e.g. ibandronate) not only block osteoclast formation but may also inhibit osteoblastic differentiation and negatively affect bone remodeling (8). Patients with distal radius fractures administered bisphosphonates show a significantly longer union time compared with controls (13). Furthermore, use of bisphosphonates is associated with a higher risk of atypical femoral fractures in women (9, 10, 68). Widely used bisphosphonates may reduce bone turnover rates and increase the degree of mineralization beyond normal physiological values (11, 12). Our studies show that SFN inhibits osteoclastogenesis but additionally promotes osteoblastic differentiation and bone matrix mineralization, which may account for the net anabolic effect of SFN we observed in vivo in which SFN augments bone volume by increasing trabecular number but not shifting the local, physiological distribution of mineral in the bone matrix. A limitation of our study is the relatively young age of the mice (8 weeks old) used. To better address the potential beneficial effects of SFN for the treatment of e.g. osteoporosis, the use of older/adult mice might be more appropriate. Nevertheless, these encouraging findings provide the impetus for considering SFN and related compounds as candidates for new therapies with food-derived epigenetic compounds.
Author Contributions
R. T., F. V., H. K., N. R., A. T., J. Z., K. K., and A. J. v. W. designed the study. R. T., A. M., P. R., I. S., F. K., S. S., M. R., and A. D. performed the experiments. R. T., A. J. v. W., and F. V. wrote the paper with comments and contributions from all authors.
Acknowledgments
We thank our colleagues at Mayo Clinic and the Ludwig Boltzmann Institut fuer Osteologie, especially Markus Schreiner, Paul Siegert, Florian Haider, David Neidhart, Eric Lewallen, Jennifer Westendorf, and David Deyle, for support, reagents, equipment use, and/or stimulating discussions. We also thank Dr. Masayoshi Kumegawa (Meikai University, Japan) and Lynda Bonewald (University of Missouri-Kansas City) for generously providing cell lines.
This work was supported by NIAMS, National Institutes of Health Grant AR049069 (to A. J. v. W.), a fellowship grant from the Center of Regenerative Medicine at Mayo Clinic (to R. T.), the Austrian Science Fund (FWF; Project P24370-B19 to F. V. and K. K.), Austrian Social Insurance for Occupational Risks (AUVA; to F. V. and K. K.), Social Health Insurance Vienna (WGKK; to F. V. and K. K.), and generous philanthropic support of William H. and Karen J. Eby and the charitable foundation in their names. The authors declare that they have no conflicts of interest with the contents of this article. The content is solely the responsibility of the authors and does not necessarily represent the official views of the National Institutes of Health.
- RANKL
- receptor activator of nuclear factor-κB ligand
- SFN
- sulforaphane
- DMSO
- dimethyl sulfoxide
- α-MEM
- α-minimum essential medium
- qPCR
- quantitative polymerase chain reaction
- OVX
- ovariectomized
- μCT
- microcomputed tomography
- qBEI
- quantitative backscattered electron imaging
- Ctrl
- control
- BMDD
- bone mineral density distribution
- ECM
- extracellular matrix
- EC50
- half-maximal effective concentration
- BMSC
- bone marrow stromal/stem cell
- 5hmC
- 5-hydroxymethylcytosine
- Tet
- ten-eleven translocation
- BV/TV
- bone volume per tissue volume
- Tb.N
- trabecular number
- Tb.Sp
- trabecular separation
- Tb.Th
- trabecular thickness
- CaMean
- weighted mean calcium content
- CaPeak
- mode calcium content
- CaWidth
- full width at half-maximum of the BMDD peak
- CaLow
- percentage of lowly mineralized bone area
- CaHigh
- percentage of highly mineralized bone area.
References
- 1. Li X., and Cao X. (2006) BMP signaling and skeletogenesis. Ann. N.Y. Acad. Sci. 1068, 26–40 [DOI] [PubMed] [Google Scholar]
- 2. Hadjidakis D. J., and Androulakis I. I. (2006) Bone remodeling. Ann. N.Y. Acad. Sci. 1092, 385–396 [DOI] [PubMed] [Google Scholar]
- 3. Kong Y. Y., Yoshida H., Sarosi I., Tan H. L., Timms E., Capparelli C., Morony S., Oliveira-dos-Santos A. J., Van G., Itie A., Khoo W., Wakeham A., Dunstan C. R., Lacey D. L., Mak T. W., et al. (1999) OPGL is a key regulator of osteoclastogenesis, lymphocyte development and lymph-node organogenesis. Nature 397, 315–323 [DOI] [PubMed] [Google Scholar]
- 4. Gordon J. A., Stein J. L., Westendorf J. J., and van Wijnen A. J. (2015) Chromatin modifiers and histone modifications in bone formation, regeneration, and therapeutic intervention for bone-related disease. Bone 81, 739–745 [DOI] [PMC free article] [PubMed] [Google Scholar]
- 5. van Wijnen A. J., van de Peppel J., van Leeuwen J. P., Lian J. B., Stein G. S., Westendorf J. J., Oursler M. J., Im H. J., Taipaleenmäki H., Hesse E., Riester S., and Kakar S. (2013) MicroRNA functions in osteogenesis and dysfunctions in osteoporosis. Curr. Osteoporos. Rep. 11, 72–82 [DOI] [PMC free article] [PubMed] [Google Scholar]
- 6. Thaler R., Sturmlechner I., Spitzer S., Riester S. M., Rumpler M., Zwerina J., Klaushofer K., van Wijnen A. J., and Varga F. (2015) Acute-phase protein serum amyloid A3 is a novel paracrine coupling factor that controls bone homeostasis. FASEB J. 29, 1344–1359 [DOI] [PMC free article] [PubMed] [Google Scholar]
- 7. Thaler R., Zwerina J., Rumpler M., Spitzer S., Gamsjaeger S., Paschalis E. P., Klaushofer K., and Varga F. (2013) Homocysteine induces serum amyloid A3 in osteoblasts via unlocking RGD-motifs in collagen. FASEB J. 27, 446–463 [DOI] [PubMed] [Google Scholar]
- 8. Teufel S., Grötsch B., Luther J., Derer A., Schinke T., Amling M., Schett G., Mielenz D., and David J. P. (2014) Inhibition of bone remodeling in young mice by bisphosphonate displaces the plasma cell niche into the spleen. J. Immunol. 193, 223–233 [DOI] [PubMed] [Google Scholar]
- 9. Schilcher J., Koeppen V., Aspenberg P., and Michaëlsson K. (2015) Risk of atypical femoral fracture during and after bisphosphonate use. Acta Orthop. 86, 100–107 [DOI] [PMC free article] [PubMed] [Google Scholar]
- 10. Schilcher J., Michaëlsson K., and Aspenberg P. (2011) Bisphosphonate use and atypical fractures of the femoral shaft. N. Engl. J. Med. 364, 1728–1737 [DOI] [PubMed] [Google Scholar]
- 11. Roschger P., Misof B., Paschalis E., Fratzl P., and Klaushofer K. (2014) Changes in the degree of mineralization with osteoporosis and its treatment. Curr. Osteoporos. Rep. 12, 338–350 [DOI] [PubMed] [Google Scholar]
- 12. Misof B. M., Roschger P., Gabriel D., Paschalis E. P., Eriksen E. F., Recker R. R., Gasser J. A., and Klaushofer K. (2013) Annual intravenous zoledronic acid for three years increased cancellous bone matrix mineralization beyond normal values in the HORIZON biopsy cohort. J. Bone Miner. Res. 28, 442–448 [DOI] [PubMed] [Google Scholar]
- 13. Molvik H., and Khan W. (2015) Bisphosphonates and their influence on fracture healing: a systematic review. Osteoporos. Int. 26, 1251–1260 [DOI] [PubMed] [Google Scholar]
- 14. Marie P. J. (2015) Osteoblast dysfunctions in bone diseases: from cellular and molecular mechanisms to therapeutic strategies. Cell. Mol. Life Sci. 72, 1347–1361 [DOI] [PMC free article] [PubMed] [Google Scholar]
- 15. Liang H., Yuan Q., and Liu M. (2013) Simultaneous determination of glucoraphanin and sulforaphane in Brassica oleracea seeds by high-performance liquid chromatography with evaporative light-scattering detector. Nat. Prod. Res. 27, 194–197 [DOI] [PubMed] [Google Scholar]
- 16. Fahey J. W., Zhang Y., and Talalay P. (1997) Broccoli sprouts: an exceptionally rich source of inducers of enzymes that protect against chemical carcinogens. Proc. Natl. Acad. Sci. U.S.A. 94, 10367–10372 [DOI] [PMC free article] [PubMed] [Google Scholar]
- 17. Zhang Y., Talalay P., Cho C. G., and Posner G. H. (1992) A major inducer of anticarcinogenic protective enzymes from broccoli: isolation and elucidation of structure. Proc. Natl. Acad. Sci. U.S.A. 89, 2399–2403 [DOI] [PMC free article] [PubMed] [Google Scholar]
- 18. Rajendran P., Kidane A. I., Yu T. W., Dashwood W. M., Bisson W. H., Löhr C. V., Ho E., Williams D. E., and Dashwood R. H. (2013) HDAC turnover, CtIP acetylation and dysregulated DNA damage signaling in colon cancer cells treated with sulforaphane and related dietary isothiocyanates. Epigenetics 8, 612–623 [DOI] [PMC free article] [PubMed] [Google Scholar]
- 19. Clarke J. D., Hsu A., Yu Z., Dashwood R. H., and Ho E. (2011) Differential effects of sulforaphane on histone deacetylases, cell cycle arrest and apoptosis in normal prostate cells versus hyperplastic and cancerous prostate cells. Mol. Nutr. Food Res. 55, 999–1009 [DOI] [PMC free article] [PubMed] [Google Scholar]
- 20. Myzak M. C., Karplus P. A., Chung F. L., and Dashwood R. H. (2004) A novel mechanism of chemoprotection by sulforaphane: inhibition of histone deacetylase. Cancer Res. 64, 5767–5774 [DOI] [PubMed] [Google Scholar]
- 21. Jiang X., Bai Y., Zhang Z., Xin Y., and Cai L. (2014) Protection by sulforaphane from type 1 diabetes-induced testicular apoptosis is associated with the up-regulation of Nrf2 expression and function. Toxicol. Appl. Pharmacol. 279, 198–210 [DOI] [PubMed] [Google Scholar]
- 22. Zhang Z., Wang S., Zhou S., Yan X., Wang Y., Chen J., Mellen N., Kong M., Gu J., Tan Y., Zheng Y., and Cai L. (2014) Sulforaphane prevents the development of cardiomyopathy in type 2 diabetic mice probably by reversing oxidative stress-induced inhibition of LKB1/AMPK pathway. J. Mol. Cell. Cardiol. 77, 42–52 [DOI] [PubMed] [Google Scholar]
- 23. Xue M., Qian Q., Adaikalakoteswari A., Rabbani N., Babaei-Jadidi R., and Thornalley P. J. (2008) Activation of NF-E2-related factor-2 reverses biochemical dysfunction of endothelial cells induced by hyperglycemia linked to vascular disease. Diabetes 57, 2809–2817 [DOI] [PMC free article] [PubMed] [Google Scholar]
- 24. Ko J. Y., Choi Y. J., Jeong G. J., and Im G. I. (2013) Sulforaphane-PLGA microspheres for the intra-articular treatment of osteoarthritis. Biomaterials 34, 5359–5368 [DOI] [PubMed] [Google Scholar]
- 25. Facchini A., Stanic I., Cetrullo S., Borzì R. M., Filardo G., and Flamigni F. (2011) Sulforaphane protects human chondrocytes against cell death induced by various stimuli. J. Cell. Physiol. 226, 1771–1779 [DOI] [PubMed] [Google Scholar]
- 26. Kong J. S., Yoo S. A., Kim H. S., Kim H. A., Yea K., Ryu S. H., Chung Y. J., Cho C. S., and Kim W. U. (2010) Inhibition of synovial hyperplasia, rheumatoid T cell activation, and experimental arthritis in mice by sulforaphane, a naturally occurring isothiocyanate. Arthritis Rheum. 62, 159–170 [DOI] [PubMed] [Google Scholar]
- 27. Davidson R. K., Jupp O., de Ferrars R., Kay C. D., Culley K. L., Norton R., Driscoll C., Vincent T. L., Donell S. T., Bao Y., and Clark I. M. (2013) Sulforaphane represses matrix-degrading proteases and protects cartilage from destruction in vitro and in vivo. Arthritis Rheum. 65, 3130–3140 [DOI] [PMC free article] [PubMed] [Google Scholar]
- 28. Kim S. J., Kang S. Y., Shin H. H., and Choi H. S. (2005) Sulforaphane inhibits osteoclastogenesis by inhibiting nuclear factor-κB. Mol. Cells 20, 364–370 [PubMed] [Google Scholar]
- 29. Hyeon S., Lee H., Yang Y., and Jeong W. (2013) Nrf2 deficiency induces oxidative stress and promotes RANKL-induced osteoclast differentiation. Free Radic. Biol. Med. 65, 789–799 [DOI] [PubMed] [Google Scholar]
- 30. Thaler R., Spitzer S., Karlic H., Klaushofer K., and Varga F. (2012) DMSO is a strong inducer of DNA hydroxymethylation in pre-osteoblastic MC3T3-E1 cells. Epigenetics 7, 635–651 [DOI] [PMC free article] [PubMed] [Google Scholar]
- 31. Friend C., Scher W., Holland J. G., and Sato T. (1971) Hemoglobin synthesis in murine virus-induced leukemic cells in vitro: stimulation of erythroid differentiation by dimethyl sulfoxide. Proc. Natl. Acad. Sci. U.S.A. 68, 378–382 [DOI] [PMC free article] [PubMed] [Google Scholar]
- 32. Marks P. A., and Breslow R. (2007) Dimethyl sulfoxide to vorinostat: development of this histone deacetylase inhibitor as an anticancer drug. Nat. Biotechnol. 25, 84–90 [DOI] [PubMed] [Google Scholar]
- 33. Iwatani M., Ikegami K., Kremenska Y., Hattori N., Tanaka S., Yagi S., and Shiota K. (2006) Dimethyl sulfoxide has an impact on epigenetic profile in mouse embryoid body. Stem Cells 24, 2549–2556 [DOI] [PubMed] [Google Scholar]
- 34. Dinsmore J., Ratliff J., Deacon T., Pakzaban P., Jacoby D., Galpern W., and Isacson O. (1996) Embryonic stem cells differentiated in vitro as a novel source of cells for transplantation. Cell Transplant. 5, 131–143 [DOI] [PubMed] [Google Scholar]
- 35. Bonser R. W., Siegel M. I., McConnell R. T., and Cuatrecasas P. (1981) The appearance of phospholipase and cyclo-oxygenase activities in the human promyelocytic leukemia cell line HL60 during dimethyl sulfoxide-induced differentiation. Biochem. Biophys. Res. Commun. 98, 614–620 [DOI] [PubMed] [Google Scholar]
- 36. Stephens A. S., Stephens S. R., Hobbs C., Hutmacher D. W., Bacic-Welsh D., Woodruff M. A., and Morrison N. A. (2011) Myocyte enhancer factor 2c, an osteoblast transcription factor identified by dimethyl sulfoxide (DMSO)-enhanced mineralization. J. Biol. Chem. 286, 30071–30086 [DOI] [PMC free article] [PubMed] [Google Scholar]
- 37. Pfaffl M. W. (2001) A new mathematical model for relative quantification in real-time RT-PCR. Nucleic Acids Res. 29, e45. [DOI] [PMC free article] [PubMed] [Google Scholar]
- 38. Pratt A. J., Gander R. E., and Brandell B. R. (1991) Real-time digital median frequency estimator for surface myoelectric signals. IEEE Trans. Biomed. Eng. 38, 306–309 [DOI] [PubMed] [Google Scholar]
- 39. Bouxsein M. L., Boyd S. K., Christiansen B. A., Guldberg R. E., Jepsen K. J., and Müller R. (2010) Guidelines for assessment of bone microstructure in rodents using micro-computed tomography. J. Bone Miner. Res. 25, 1468–1486 [DOI] [PubMed] [Google Scholar]
- 40. Roschger P., Fratzl P., Eschberger J., and Klaushofer K. (1998) Validation of quantitative backscattered electron imaging for the measurement of mineral density distribution in human bone biopsies. Bone 23, 319–326 [DOI] [PubMed] [Google Scholar]
- 41. Roschger P., Paschalis E. P., Fratzl P., and Klaushofer K. (2008) Bone mineralization density distribution in health and disease. Bone 42, 456–466 [DOI] [PubMed] [Google Scholar]
- 42. Fratzl-Zelman N., Fratzl P., Hörandner H., Grabner B., Varga F., Ellinger A., and Klaushofer K. (1998) Matrix mineralization in MC3T3-E1 cell cultures initiated by β-glycerophosphate pulse. Bone 23, 511–520 [DOI] [PubMed] [Google Scholar]
- 43. Gamet-Payrastre L., Li P., Lumeau S., Cassar G., Dupont M. A., Chevolleau S., Gasc N., Tulliez J., and Tercé F. (2000) Sulforaphane, a naturally occurring isothiocyanate, induces cell cycle arrest and apoptosis in HT29 human colon cancer cells. Cancer Res. 60, 1426–1433 [PubMed] [Google Scholar]
- 44. Singh S. V., Herman-Antosiewicz A., Singh A. V., Lew K. L., Srivastava S. K., Kamath R., Brown K. D., Zhang L., and Baskaran R. (2004) Sulforaphane-induced G2/M phase cell cycle arrest involves checkpoint kinase 2-mediated phosphorylation of cell division cycle 25C. J. Biol. Chem. 279, 25813–25822 [DOI] [PubMed] [Google Scholar]
- 45. Gamet-Payrastre L. (2006) Signaling pathways and intracellular targets of sulforaphane mediating cell cycle arrest and apoptosis. Curr. Cancer Drug Targets 6, 135–145 [DOI] [PubMed] [Google Scholar]
- 46. Enomoto H., Shiojiri S., Hoshi K., Furuichi T., Fukuyama R., Yoshida C. A., Kanatani N., Nakamura R., Mizuno A., Zanma A., Yano K., Yasuda H., Higashio K., Takada K., and Komori T. (2003) Induction of osteoclast differentiation by Runx2 through receptor activator of nuclear factor-κB ligand (RANKL) and osteoprotegerin regulation and partial rescue of osteoclastogenesis in Runx2−/− mice by RANKL transgene. J. Biol. Chem. 278, 23971–23977 [DOI] [PubMed] [Google Scholar]
- 47. Shiotani A., Takami M., Itoh K., Shibasaki Y., and Sasaki T. (2002) Regulation of osteoclast differentiation and function by receptor activator of NFκB ligand and osteoprotegerin. Anat. Rec. 268, 137–146 [DOI] [PubMed] [Google Scholar]
- 48. Barutcu A. R., Tai P. W., Wu H., Gordon J. A., Whitfield T. W., Dobson J. R., Imbalzano A. N., Lian J. B., van Wijnen A. J., Stein J. L., and Stein G. S. (2014) The bone-specific Runx2-P1 promoter displays conserved three-dimensional chromatin structure with the syntenic Supt3h promoter. Nucleic Acids Res. 42, 10360–10372 [DOI] [PMC free article] [PubMed] [Google Scholar]
- 49. Liu J. C., Lengner C. J., Gaur T., Lou Y., Hussain S., Jones M. D., Borodic B., Colby J. L., Steinman H. A., van Wijnen A. J., Stein J. L., Jones S. N., Stein G. S., and Lian J. B. (2011) Runx2 protein expression utilizes the Runx2 P1 promoter to establish osteoprogenitor cell number for normal bone formation. J. Biol. Chem. 286, 30057–30070 [DOI] [PMC free article] [PubMed] [Google Scholar]
- 50. Gambari L., Lisignoli G., Cattini L., Manferdini C., Facchini A., and Grassi F. (2014) Sodium hydrosulfide inhibits the differentiation of osteoclast progenitor cells via NRF2-dependent mechanism. Pharmacol. Res. 87, 99–112 [DOI] [PubMed] [Google Scholar]
- 51. Fratzl-Zelman N., Roschger P., Misof B. M., Pfeffer S., Glorieux F. H., Klaushofer K., and Rauch F. (2009) Normative data on mineralization density distribution in iliac bone biopsies of children, adolescents and young adults. Bone 44, 1043–1048 [DOI] [PubMed] [Google Scholar]
- 52. Meeran S. M., Ahmed A., and Tollefsbol T. O. (2010) Epigenetic targets of bioactive dietary components for cancer prevention and therapy. Clin. Epigenetics 1, 101–116 [DOI] [PMC free article] [PubMed] [Google Scholar]
- 53. Thaler R., Karlic H., Rust P., and Haslberger A. G. (2009) Epigenetic regulation of human buccal mucosa mitochondrial superoxide dismutase gene expression by diet. Br. J. Nutr. 101, 743–749 [DOI] [PubMed] [Google Scholar]
- 54. Yara S., Lavoie J. C., and Levy E. (2015) Oxidative stress and DNA methylation regulation in the metabolic syndrome. Epigenomics 7, 283–300 [DOI] [PubMed] [Google Scholar]
- 55. Asher G., and Sassone-Corsi P. (2015) Time for food: the intimate interplay between nutrition, metabolism, and the circadian clock. Cell 161, 84–92 [DOI] [PubMed] [Google Scholar]
- 56. Dashwood R. H., and Ho E. (2007) Dietary histone deacetylase inhibitors: from cells to mice to man. Semin. Cancer Biol. 17, 363–369 [DOI] [PMC free article] [PubMed] [Google Scholar]
- 57. Venturelli S., Berger A., Böcker A., Busch C., Weiland T., Noor S., Leischner C., Schleicher S., Mayer M., Weiss T. S., Bischoff S. C., Lauer U. M., and Bitzer M. (2013) Resveratrol as a pan-HDAC inhibitor alters the acetylation status of histone [corrected] proteins in human-derived hepatoblastoma cells. PLoS One 8, e73097. [DOI] [PMC free article] [PubMed] [Google Scholar]
- 58. Nian H., Delage B., Pinto J. T., and Dashwood R. H. (2008) Allyl mercaptan, a garlic-derived organosulfur compound, inhibits histone deacetylase and enhances Sp3 binding on the P21WAF1 promoter. Carcinogenesis 29, 1816–1824 [DOI] [PMC free article] [PubMed] [Google Scholar]
- 59. Nian H., Delage B., Ho E., and Dashwood R. H. (2009) Modulation of histone deacetylase activity by dietary isothiocyanates and allyl sulfides: studies with sulforaphane and garlic organosulfur compounds. Environ. Mol. Mutagen. 50, 213–221 [DOI] [PMC free article] [PubMed] [Google Scholar]
- 60. Do D. P., Pai S. B., Rizvi S. A., and D'Souza M. J. (2010) Development of sulforaphane-encapsulated microspheres for cancer epigenetic therapy. Int. J. Pharm. 386, 114–121 [DOI] [PubMed] [Google Scholar]
- 61. Balasubramanian S., Chew Y. C., and Eckert R. L. (2011) Sulforaphane suppresses polycomb group protein level via a proteasome-dependent mechanism in skin cancer cells. Mol. Pharmacol. 80, 870–878 [DOI] [PMC free article] [PubMed] [Google Scholar]
- 62. Balasubramanian S., Kanade S., Han B., and Eckert R. L. (2012) A proteasome inhibitor-stimulated Nrf1 protein-dependent compensatory increase in proteasome subunit gene expression reduces polycomb group protein level. J. Biol. Chem. 287, 36179–36189 [DOI] [PMC free article] [PubMed] [Google Scholar]
- 63. Fan H., Zhang R., Tesfaye D., Tholen E., Looft C., Hölker M., Schellander K., and Cinar M. U. (2012) Sulforaphane causes a major epigenetic repression of myostatin in porcine satellite cells. Epigenetics 7, 1379–1390 [DOI] [PMC free article] [PubMed] [Google Scholar]
- 64. Watson G. W., Wickramasekara S., Palomera-Sanchez Z., Black C., Maier C. S., Williams D. E., Dashwood R. H., and Ho E. (2014) SUV39H1/H3K9me3 attenuates sulforaphane-induced apoptotic signaling in PC3 prostate cancer cells. Oncogenesis 3, e131. [DOI] [PMC free article] [PubMed] [Google Scholar]
- 65. Blaschke K., Ebata K. T., Karimi M. M., Zepeda-Martínez J. A., Goyal P., Mahapatra S., Tam A., Laird D. J., Hirst M., Rao A., Lorincz M. C., and Ramalho-Santos M. (2013) Vitamin C induces Tet-dependent DNA demethylation and a blastocyst-like state in ES cells. Nature 500, 222–226 [DOI] [PMC free article] [PubMed] [Google Scholar]
- 66. Thaler R., Spitzer S., Karlic H., Berger C., Klaushofer K., and Varga F. (2013) Ibandronate increases the expression of the pro-apoptotic gene FAS by epigenetic mechanisms in tumor cells. Biochem. Pharmacol. 85, 173–185 [DOI] [PMC free article] [PubMed] [Google Scholar]
- 67. Lindahl Allen M., Koch C. M., Clelland G. K., Dunham I., and Antoniou M. (2009) DNA methylation-histone modification relationships across the desmin locus in human primary cells. BMC Mol. Biol. 10, 51. [DOI] [PMC free article] [PubMed] [Google Scholar]
- 68. Reid I. R. (2015) Short-term and long-term effects of osteoporosis therapies. Nat. Rev. Endocrinol. 11, 418–428 [DOI] [PubMed] [Google Scholar]
- 69. Dudakovic A., Camilleri E. T., Xu F., Riester S. M., McGee-Lawrence M. E., Bradley E. W., Paradise C. R., Lewallen E. A., Thaler R., Deyle D. R., Larson A. N., Lewallen D. G., Dietz A. B., Stein G. S., Montecino M. A., et al. (2015) Epigenetic control of skeletal development by the histone methyltransferase Ezh2. J. Biol. Chem. 290, 27604–27617 [DOI] [PMC free article] [PubMed] [Google Scholar]
- 70. Dudakovic A., Camilleri E. T., Lewallen E. A., McGee-Lawrence M. E., Riester S. M., Kakar S., Montecino M., Stein G. S., Ryoo H. M., Dietz A. B., Westendorf J. J., and van Wijnen A. J. (2015) Histone deacetylase inhibition destabilizes the multi-potent state of uncommitted adipose-derived mesenchymal stromal cells. J. Cell. Physiol. 230, 52–62 [DOI] [PMC free article] [PubMed] [Google Scholar]


