

Abstract
While being long in range and therefore weakly specific, electrostatic interactions are able to modulate the stability and folding landscapes of some proteins. The relevance of electrostatic forces for steering the docking of proteins to each other is widely acknowledged, however, the role of electrostatics in establishing specifically funneled landscapes and their relevance for protein structure prediction are still not clear. By introducing Debye‐Hückel potentials that mimic long‐range electrostatic forces into the Associative memory, Water mediated, Structure, and Energy Model (AWSEM), a transferable protein model capable of predicting tertiary structures, we assess the effects of electrostatics on the landscapes of thirteen monomeric proteins and four dimers. For the monomers, we find that adding electrostatic interactions does not improve structure prediction. Simulations of ribosomal protein S6 show, however, that folding stability depends monotonically on electrostatic strength. The trend in predicted melting temperatures of the S6 variants agrees with experimental observations. Electrostatic effects can play a range of roles in binding. The binding of the protein complex KIX‐pKID is largely assisted by electrostatic interactions, which provide direct charge‐charge stabilization of the native state and contribute to the funneling of the binding landscape. In contrast, for several other proteins, including the DNA‐binding protein FIS, electrostatics causes frustration in the DNA‐binding region, which favors its binding with DNA but not with its protein partner. This study highlights the importance of long‐range electrostatics in functional responses to problems where proteins interact with their charged partners, such as DNA, RNA, as well as membranes.
Keywords: protein folding, binding, protein−protein interactions, energy landscape theory, long‐range electrostatics, Debye‐Hückel potentials, electrostatically induced frustration
Introduction
Electrostatic interactions play an important role in the recognition between proteins. By having appropriately charged amino acids placed into the structure, binding partners can employ electrostatic interactions to guide their approach prior to making physical contact.1, 2, 3, 4 The importance of such electrostatic guidance in folding dynamics, however, is unclear, since folding is mainly guided by water mediated interactions, both hydrophobic and hydrophilic.5, 6 Nevertheless, there is evidence that the folding funnel is sculpted by both electrostatics and shorter range forces. In the case of the ribosomal protein S6, for example, excess surface charges on the protein not only play the role of structural gatekeepers in protein‐protein interactions, but also modulate protein stability and the choice of dominant folding route.7, 8 It has also been demonstrated that, for HIV protease, correlated electrostatic mutations can provide additional stability to the protein. This increased stability can compensate for destabilizing effects that would arise from selected mutations that confer drug resistance.9 These examples highlight the role that electrostatics plays in folding at least for some special monomeric proteins that have peculiarly asymmetric distributions of charged amino acids.
When proteins associate with molecules including DNA, the electrostatic interactions can facilitate the recognition of the appropriate binding sites. Barstar, an inhibitor of barnase, binds quickly to the enzyme through complementarily charged amino acids.3, 4, 10 For many intrinsically disordered proteins (IDP's), folding and binding are coupled. Many IDPs are highly charged and their charge distribution dictates the ensemble of disordered structures from which recognition commences.11, 12 The mechanism of folding and binding is often described as “induced fit,”13 “population shift,”14 “conformational selection,”15 or “conformationally and mutually induced fit”.16 In those cases, the electrostatic interactions can introduce conformational changes when the partners come into close proximity. Given the ubiquitous role of electrostatics in functional protein dynamics, then, it is worth revisiting the role of electrostatics in shaping both folding funnels and binding landscapes.
Electrostatic effects can be treated using models with varying levels of descriptions, at varying levels of computational cost. Electrostatic interactions can be incorporated into all‐atom simulations with explicit solvent. The Ewald summed Coulomb potential can be used to avoid the errors that would result from truncating Coulomb interactions.17, 18, 19, 20 In many implicit solvent models, the electrostatic component of the solvation free energy can be computed by solving the Poisson Boltzmann equation.21 A further level of approximations employs the Generalized Born solvation model.22 The results of the generalized Born model often agree with those found using explicit solvent treatments but can be achieved at much less computational expense.23 All‐atom models, while appearing complete, need to be carefully tuned in order to fold proteins properly.24, 25 Fully atomistic models are also difficult to sample extensively. Fortunately, these days there are coarse‐grained (CG) protein models that already possess good structural prediction accuracy that can be sampled more efficiently than fully atomistic models.26, 27, 28, 29, 30 Coarse‐grained models whose parameters are learned from a database using energy landscape theory have been shown to capture many of the key physical forces underlying folding despite their reduction in atomistic detail at the outset. In this study, we start with one such model, the associative memory, water mediated, structure and energy model (AWSEM).26 AWSEM provides a transferable, coarse‐grained, non‐additive force field that incorporates physically motivated potentials, along with knowledge‐based information using the principle of minimal frustration. The parameters in this force field are learned using energy landscape theory.31, 32, 33, 34, 35 AWSEM is able to predict the native structures of many proteins from sequence alone with accuracy comparable to direct homology prediction.26 Furthermore, the predictions made by AWSEM for protein binding interfaces in dimeric protein assemblies are excellent.28
The forces in the AWSEM code already involve local electrostatic interactions with the solvent but do not account for long range electrostatic interactions. In this article, we incorporate long‐range electrostatic interactions into the AWSEM package. These interactions are introduced by adding Debye‐Hückel terms.36 These terms average over the ionic atmosphere that arises from a linear approximation to the Poisson‐Boltzmann equation, which is ordinarily adequate when the ionic strength is low. To highlight the role of long‐range electrostatic forces in structure prediction, protein stability, and dimer formation, we investigate the predictions from the model using varying strengths of this term relative to the usual AWSEM forces. We find that electrostatics plays a more significant role in shaping the binding landscape of dimers than for the folding landscape of monomeric proteins. For monomeric proteins, unless the protein has a peculiar distribution of charged amino acids (e.g., the charge variants of protein S6), the addition of long‐range electrostatic interactions does not significantly improve the quality of structure prediction. The problem of the mechanism of binding of proteins is more subtle, as highlighted in several recent works.37, 38, 39 We show that the addition of long range electrostatics does influence the binding mechanism even when the final structure is not changed. Sometimes long range electrostatic interactions not only provide charge−charge stabilization that funnels the landscape for binding but also help steer the docking of intrinsically disordered proteins before structure formation is completed. For other systems, on the other hand, long‐range electrostatic interactions cause frustration in the landscape and would seem to impede protein dimer formation. This frustration is localized in regions that are targeted specifically to other charged partners, such as the surfaces of DNA molecules. Presumably the landscape of the entire multimeric protein‐DNA assembly is funneled by removing this frustration.
Results
To systematically assess the effects of long‐range electrostatic forces on the accuracy of structure prediction of proteins and protein assemblies, we surveyed a set of monomers and then proceeded to investigate several dimer systems. In this work, 13 monomers and 4 dimers were studied. The monomers studied include twelve α‐helical proteins that were previously studied using the AWSEM to assess its structure prediction capabilities26 while an additional α/β protein, the protein S6, was also chosen for study because its charge variants exhibit interesting changes in their thermodynamics and kinetics of folding.8 The dimers selected for study generally display folding and binding that are coupled.28 The native structures of all the proteins and their assemblies are shown in Figure 1. Table 1 recounts the overall electrostatic characteristics of the proteins found under native pH and physiological temperatures.
Figure 1.
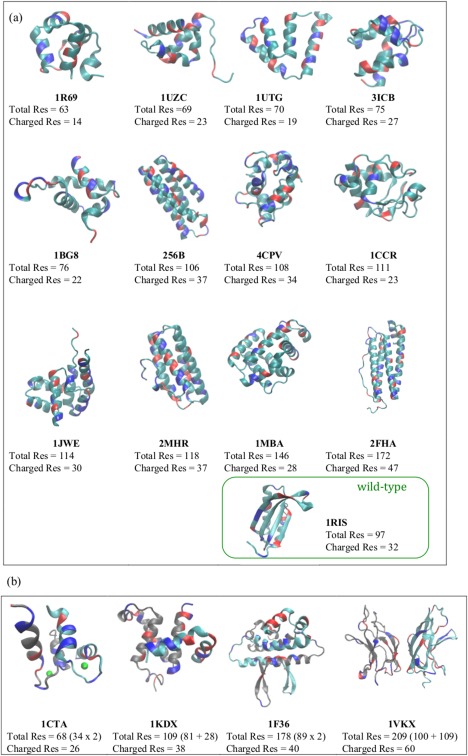
The native structures of the 13 monomers and 4 dimers used in the study are shown, as well as their PDB IDs, total number of residues, and total number of charged residues. (a) Monomers. (b) Dimers. The positively charged residues are colored in red and the negatively charged residues are colored in blue. There are 12 α proteins and 1 α/β protein in (a). In (b), two individual monomers of a dimer are colored in gray and cyan, respectively. Note that 1CTA has two calcium ions bound to it (green spheres).
Table 1.
General and Electrostatic Properties of Proteins
| Code | Length | Charged Res | Pos/Neg (Net) |
|
|
|---|---|---|---|---|---|
| Monomer | |||||
| 1R69 | 63 | 14 | +9/−5 (+4) | 0.74 | |
| 1UZC | 69 | 23 | +15/−8 (+7) | −1.90 | |
| 1UTG | 70 | 19 | +9/−10 (−1) | −2.76 | |
| 3ICB | 75 | 27 | +10/−17 (−7) | 2.32 | |
| 1BG8 | 76 | 22 | +9/−13 (−4) | −2.69 | |
| 256B | 106 | 37 | +17/−20 (−3) | −3.38 | |
| 4CPV | 108 | 34 | +14/−20 (−6) | −0.56 | |
| 1CCR | 111 | 23 | +13/−10 (+3) | −2.76 | |
| 1JWE | 114 | 30 | +11/−19 (−8) | −1.38 | |
| 2MHR | 118 | 37 | +17/−20 (−3) | −2.91 | |
| 1MBA | 146 | 28 | +15/−13 (+2) | −5.28 | |
| 2FHA | 172 | 47 | +19/−28 (−9) | −1.18 | |
| 1RISS6,wt | 97 | 32 | +16/−16 (0) | −4.68 | |
| 1RISS6,sc | 97 | 16 | 0/−16 (−16) | 7.08 | |
| Dimer | |||||
| 1CTA | 68 | 26 | +8/−18 (−10) | 1.05/0.75 (2.45)a | |
| 1KDX | 109 | 38 | +20/−18 (+2) | −4.13/0.67 (−0.99) | |
| 1F36 | 178 | 40 | +22/−18 (+4) | 3.31/3.36 (−2.31) | |
| 1VKX | 209 | 60 | +27/−33 (−6) | −4.23/−3.11 (0.03) | |
Charged Res, total number of charged residues (positively charged residues, Lys/Arg; negatively charged residues, Glu/Asp).
Pos/Neg, total number of positively or negatively charged residues; the number shown in the parentheses refers to net charge.
: The electrostatic energy (in kcal/mol) in the native state of a monomeric protein, calculated at ε r = 80 (water); the number shown in the parentheses for dimers refers to the energy for intermolecular binding.
The electrostatic energies for 1CTA were calculated without calcium ions.
Adding electrostatic interactions does not improve structure prediction of monomeric proteins
To assess the importance of long‐range electrostatic forces in structure prediction, we first predicted de novo the structure of the monomeric proteins using AWSEM. We used a homologues excluded (HE) fragment memory library. This library explicitly avoids introducing homology information inadvertently by using a database of sequences all having less than 20% sequence identity with the target sequence. In this way the simulation resembles the prediction of a novel, never before seen fold! The addition of a long range electrostatic term with a tunable coefficient (see Eq. (2) in Methods) into the existing AWSEM code allows us to manipulate the strength of the Debye‐Hückel (DH) potential by varying the dielectric constant, ɛ r. We performed simulated annealing (see Methods) using this augmented force field for a range of different ɛ r values in order to understand the specific effects of electrostatics on folding. For each protein (see Fig. 1 for their native structures), 30 annealing runs were conducted, and the best Q (fraction of native contacts) values for each run were collected and sorted in descending order. In Figure 2, the resulting annealing profiles for the twelve α‐helical proteins found using different strengths of electrostatics are shown. The Q values of the predicted protein structures ranged between 0.3 and 0.7. The profiles for three different ɛ r values are overlaid for comparison. In most cases, increasing the electrostatic strength (decreasing the value of ɛ r) does not significantly improve the annealing profiles. Some differences in the pattern of variations of the best Q were found for three of the proteins: 1R69, 3ICB, and 256B. 1R69 does show a small improvement in Q when the strength increases; in contrast the variation of electrostatic forces for 3ICB seems to show little change on varying ɛ r; 256B does show some improvement in prediction quality when ɛ r is decreased to the value of 6. These variations are not large enough to suggest that, in practical terms, there is any significant positive effect of incorporating electrostatic interactions on the quality of predicted structures for these monomers: adding electrostatic interactions does not greatly influence structure prediction of monomeric proteins. Structural specificity in folding is not primarily governed by charge‐charge interactions.8
Figure 2.
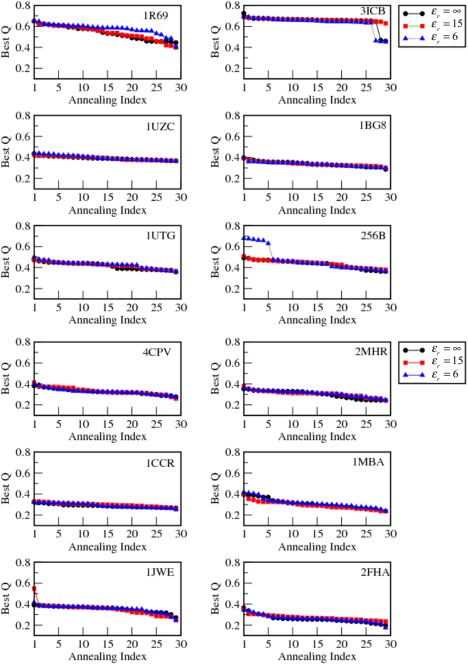
The effect of electrostatic interactions on the quality of structure prediction for 12 monomeric proteins is shown. A total number of 30 simulated annealing runs were conducted for each protein with different electrostatic strengths (ε r = ∞, 15, and 6). Best Q refers to the largest Q, the fraction of native contacts, obtained during a single annealing run. The 30 Best Qs were used and sort the result in a descending order of prediction quality. The “Annealing Index” is used to denote the resulting order. We observed that introducing electrostatic interactions does not appear to improve the quality of the predicted structures of these proteins substantially.
Electrostatic effects on folding stability of charge variants of protein S6
The protein S6 is of particular interest for investigating the role of long range electrostatic forces because there have been extensive laboratory studies of how its folding thermodynamics and kinetics are modulated by electrostatic interactions. Although wild type S6 has no net charge, it is in fact rich in charges that, however, have opposite signs. There is a total of 32 charged residues (16 positive and 16 negative). In experiment, the engineered charge‐depleted variant nevertheless maintains a native‐like solution structure, showing folding can successfully proceed without having any charges at all.8 Surface charge‐charge interactions do not appear to be essential to establishing the specificity of folding funnel. Nevertheless electrostatic effects do play a role in modulating the folding landscape.40 We simulated electrostatic effects on the wild‐type protein and on two of its charge variants: a super‐charged (SC) mutant in which all the Lys and Arg of the wild‐type are mutated to Ser and a charge‐depleted (CD) mutant in which the remaining negatively charged side‐chain residues of the SC are neutralized by protonation (mimicking the acidic condition at pH 2.3). First, we performed simulated annealing to assess the electrostatic effects on predicting the native structure itself. As we found for the α‐helical proteins, long range electrostatics does not significantly influence the quality of the predicted native structure (see Supporting Information Fig. S2). There are some significant changes in the annealing profiles (see Supporting Information Fig. S2), however, suggesting that the folding funnel is modulated by electrostatics. The annealing results show for the electrostatically augmented AWSEM that the wild‐type has the highest fraction of proper folding events among all the three proteins; more often being correctly predicted than is the charge‐depleted form which is again more often successfully predicted than the super‐charged form.
We also carried out free energy calculations for the wild‐type and the two variants (charge‐ depleted and super‐charged) by using umbrella sampling (see Methods). The heat capacity (C v) of each variant is plotted in Figure 3(left), Peaks in the C v signal major conformational transitions, so the position of the peak in a scan indicates the melting temperature T m, which quantifies the thermal stability of the protein. For the wild‐type, we compute the T m's for two strengths, both with electrostatics (ɛ r = 66.5) and without (ɛ r = ∞). The T m's with electrostatic augmentation are higher than those found without electrostatics. In other words, thermal stability is increased by the long range electrostatic interactions. As electrostatic strength continues to increase (up to ɛ r = 16.6) T m continues to increase as well (see Supporting Information Fig. S2). The electrostatics of the wild‐type contributes to a strong stabilization due to charge−charge interactions of the charged residues. In the case of the super‐charged variant, which has an excess of negative net charges (−16); however, the C v curve peaks at a lower temperature, a demonstration that stability is diminished by mutation of charged residues to neutral ones (Lys, Arg→Ser). Interestingly, the peak for the charge‐depleted variant, whose charges are in fact completely removed, shifts by only ∼1 K. These observations agree with Oliveberg's experimental results8 for the trends for the stability of the wild‐type and its charged variants. We also analyzed the free energy profiles for folding these proteins (F vs Q) at constant temperature. They are shown in Figure 3(right). The corresponding free energy surfaces are properly overlaid (with the same energy reference at Q = 0.22) in order to highlight the free energy change of individual folding basins of each protein. The locations of the basins do not shift significantly in Q value among the wild‐type and the other charge variants. Yet the free energy of the folded basin does vary, in agreement with the stability changes (the wild‐type being more stable than the charge‐depleted variant, which is, in turn, more stable than the super‐charged variant) inferred from the Cv curves. All these results suggest that while electrostatic interactions among charged residues are not necessary for maintaining the native structure of the protein, protein stability is indeed modulated by long range electrostatic interactions.
Figure 3.
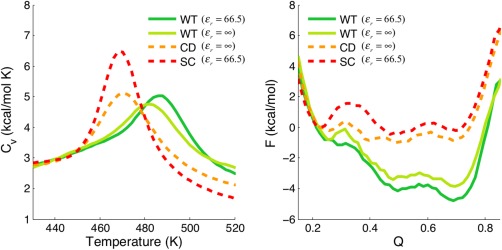
(left) The heat capacity (Cv) of protein S6 (1RIS) is shown as a function of temperature. The melting temperature of the wild‐type (WT) is higher than that of the charge‐depleted (CD) and the super‐charged (SC), indicating that the native state of the wild‐type is more stable, as illustrated in the free energy plot on the right. The melting temperature decreases from: wild‐type, as highest to the charge‐depleted form, as intermediate, and the super‐charged form the lowest. (right) The corresponding free energies are shown as a function of the fraction of the native contacts.
Electrostatic interactions assist binding for one out of four dimers
AWSEM has proved quite successful in predicting the binding interfaces of proteins.28 We next investigate the effects of electrostatic interactions on protein binding. Four protein dimers were chosen for study: Troponin C site III (1CTA), KIX‐pKID (1KDX), FIS protein,41 a homo dimer that also associates with DNA, (1F36), and NF‐κB p50/p65 (1VKX). Among these, two systems are homo dimers (1CTA and 1F36), while the other two are hetero dimers (1KDX and 1VKX). Table 1 summarizes some general properties of the dimers. In particular, the table displays , which is the total long range electrostatic energy within the native context. Starting from two monomers being pulled apart from their dimer structures at high temperatures, thirty annealing runs were performed for each dimer with a range of ɛr values (ɛ r = ∞, 33.2, 16.6, 8.3). The Q of the binding interface (Q I) is used to monitor the accuracy of binding prediction, and for each run an average is taken over the last 100 snapshots of the run ( ). is used to measure quality of the final annealing result; the higher the value, the greater the similarity to the native structure and thus the more accurately the interface is predicted. All thirty 's were collected and sorted in a descending order much as we did for monomer annealing profiles which, however were sorted based on total Q. The annealing results of all four dimers with different electrostatic strengths are presented in Figure 4. As the electrostatic strength increases (decreasing ɛ r), the annealing profiles for the binding of different dimers show two distinct trends.
Figure 4.
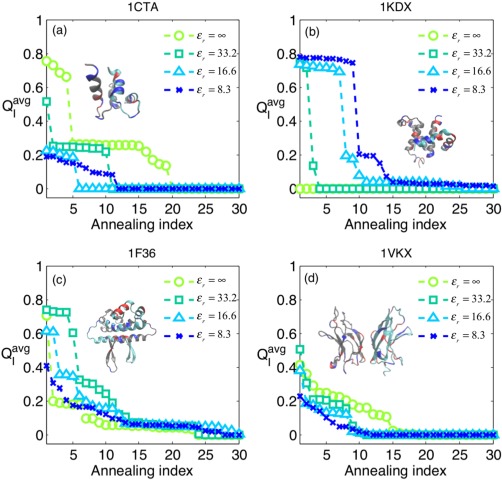
The effect of electrostatic interactions on binding of four dimers is shown. A total number of 30 simulated annealing runs were conducted for each dimer with different electrostatic strengths (ε r = ∞, 33.2, 16.6, and 8.3). refers to the Q interface ( ) that is averaged over the last 100 snapshots of a single annealing trajectory. For each set of annealing, the 30 s were collected and sorted in a descending order. The corresponding native structures of the dimers are also shown above the annealing curves. (a) Troponin C site III (without calcium ions). (b) KIX‐pKID. (c) Factor for inversion stimulation (FIS). (d) NFκB P50/P65. We find that the binding of the KIX‐pKID is electrostatically assisted while the binding of the other three dimers is not.
For 1CTA, 1F36, and 1VKX, the binding site prediction is not electrostatically assisted since their 's show a general decrease in the fraction of proper binding events when the strength increases. For 1F36, the decrease in the fraction of binding events is monotonic except for the case where ɛ r = ∞. This shift in the order suggests there is electrostatic frustration in the binding of this dimer. This result will be further examined below. Another interesting profile is found for 1CTA which again is not improved. The annealing profiles we have generated however correspond to the situation where calcium ion is absent. We therefore examined the specific ionic effect of calcium by considering how the ion binds to the protein complex. Instead of adding an explicit calcium ion into the protein simulation, we adopted a mean‐field approach. The excess divalent charge was split equally into its four neighboring charged residues. Each of the residues thus shares one quarter of the neutralizing charge (+0.5 for each), as shown schematically in Figure 5(a). Figure 5(b) shows a comparison between the two annealing profiles: one with the calcium charge treated in the mean‐field way and the other without treating the specific binding of the calcium ion. The result shows that for 1CTA the presence of calcium ions improves the binding of the dimer, suggesting the importance of electrostatic interactions when modulated by the calcium ion, for binding. In contrast, the binding of 1KDX (which has no additional divalent metal ions) is always significantly improved by the long range electrostatic interactions, as its annealing profile shows an increase in the fraction of proper binding events upon increasing the electrostatic strength (decreasing ɛr). The thermodynamic consequences for the electrostatically assisted binding will be analyzed below.
Figure 5.
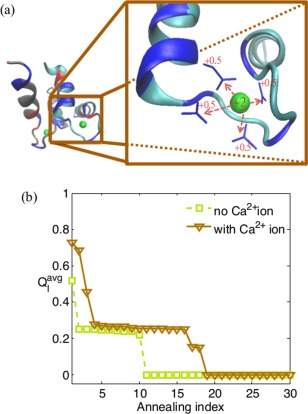
The ionic effect of calcium on the binding of the Troponin C site III (PDB code: 1CTA) is plotted. is plotted against annealing index. (a) The protein with calcium ion. In the simulations, the +2 charge is treated as four separated +0.5 charges added to neighboring negatively charged residues (blue sticks) according to a mean‐field notion. (b) Comparison of the results of the annealing simulations, with and without calcium ion, respectively. Note that the annealing simulations were conducted with the dielectric constant ε r = 33.2.
Thermodynamic stabilization of KIX‐pKID by electrostatic interactions
When the long range electrostatic interactions improve binding prediction, it is interesting to look further into the binding mechanism. Among all the dimers studied, 1KDX is the only system that showed any significant improvement in binding prediction when the electrostatic effects were included. We therefore analyze this dimer in greater detail. 1KDX is a heterodimer complex having one large monomer [81 a.a., gray in Fig. 1(b)] docked to a relatively small binding partner [28 a.a., cyan in Fig. 1(b)]. We examined the free energy surfaces of 1KDX using two different order parameters, Q of the interface region (Q I) and the center of mass distance (d COM) between the binding partners. These collective coordinates represent, respectively, short‐range and long‐range reaction coordinates for the binding process. The free energy surfaces found with increasing electrostatic strengths (ɛr = ∞ to 8.3) are compared and shown in Figure 6. The plot of F vs Q I is presented in Figure 6(a) (left). A significant thermodynamic stabilization near the binding basin (Q I ∼ 0.7) can be observed as the strength increases, indicating there is direct charge‐charge stabilization of the dimer (for charged residues typically within ∼10 Å in distance), consistent with the dimer's native electrostatic energy contribution calculated as −0.99 (kcal/mol) from Table 1. On the other hand, some stabilization due to electrostatics can also be observed at long range, as can be seen from Figure 6(a) (right). Upon increasing the electrostatic strength one sees stabilization, starting even around 30 Å in separation. Such a long‐range stabilization effect is called electrostatic “steering”. This effect is also important for protein‐DNA recognition.42, 43 How the steering effect couples with the “folding upon binding” mechanism will be described below. Electrostatic interactions perturb the stability of both the unbound state and bound state in a correlated way. As a result, the binding landscape is funneled, as shown in Figure 6(b). From our free energy analysis of the dimer (1KDX), we can distinguish two distinct electrostatic effects: (1) Direct charge‐charge interactions. (2) Long‐range steering effects. Both these effects together contribute to funneling the binding landscape of 1KDX.
Figure 6.
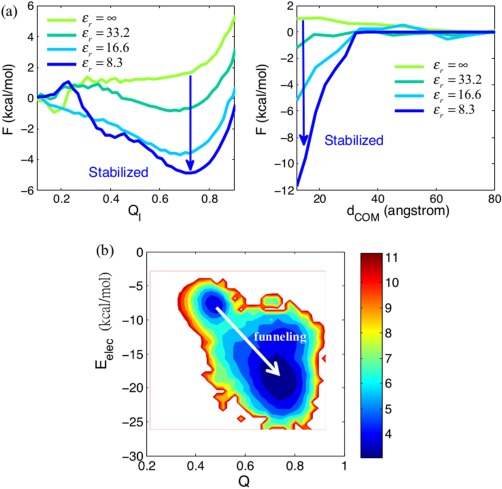
The thermodynamic stabilization of the binding of the KIX‐pKID (PDB code: 1KDX) is modulated by electrostatic interactions. (a) (left) The free energy profile as a function of Q interface (short‐range regime). (right) The free energy profile as a function of the center of mass distance between the two monomers (d COM). As the electrostatic strength increases (ε r = ∞ to 8.3), both the (left) and the (right) panels show significant thermodynamic stabilization (illustrated by blue arrows). (b) A two dimensional free energy surface as function of both the fraction of native contacts (Q) and the electrostatic energy (E elec). E elec helps the formation of the dimer structure by funneling its free energy landscape for binding, as shown by a white arrow pointing all the way from the basin at low Q (∼0.47) with E elec∼ −7.5 (kcal/mol) to that at high Q (∼0.74) with E elec∼ −18 (kcal/mol). Note that the plot is made for simulation having ε r = 16.6.
Figure 7 displays a global free energy surface for the binding of 1KDX using the two dimensions of the free energy of intermolecular contacts Q I and intramolecular Q B contacts. These two order parameters clearly distinguish the formation of structure within the monomer B (a small piece of binding fragment) from the act of docking. Note that since the larger binding partner, monomer A, is rather rigid, it does not undergo any significant conformational changes during binding. In Figure 7(a), three primary free energy basins can be identified: a monomer basin (M), an intermediate (I), and also a native basin (N). The M basin refers to an incompletely native monomer conformation (Q B ∼ 0.5, thus different from its native form) but that is present in solution; the I state denotes a binding complex with monomer B remaining in its M state but also being loosely bound to monomer A, so Q B ∼ 0.5 and Q I ∼ 0.5; while the N state is a fully native‐like dimer state with both Q measures attaining high values (Q B ∼ 0.9 and Q I ∼ 0.7). As the strength of the electrostatics increases, both states I and N become more populated, as can be verified by comparing the plots on the left (ɛ r = 33.2) and right (ɛ r = 16.6) of Figure 7(a). Examining many annealing trajectories suggests to us that there is a dominant sequence of events. These events are shown schematically as a pathway involving representative structures in Figure 7(b). The monomer in the M state is first electrostatically guided to its binding partner, forming first the intermediate complex I. During this process, Q I increases a great deal while Q B remains moderate and constant. After this initial binding, the monomer B undergoes a conformational adjustment into its folded state (Q B increases), in order to form the correct native dimer structure. Clearly, the folding of the protein is induced by its binding to the partner rather than merely being selected out of a pre‐existing ensemble. Here, the mechanism of the rearrangement is coupled to the electrostatic interactions for the binding of 1KDX.
Figure 7.
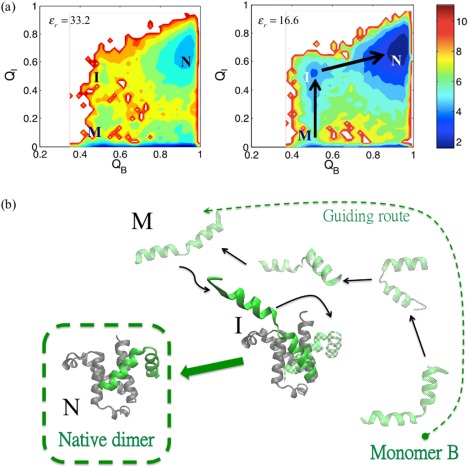
Electrostatic interactions play an important role in steering the binding of the KIX‐pKID (PDB code: 1KDX). (a) Two dimensional free energy surfaces are displayed in terms of order parameters Q I and Q B. These represent the fraction of intermolecular native contacts for the binding region and the fraction of native contacts for the folding of monomer B alone, respectively. Note that monomer B is a short fragment, which is ordinarily disordered by itself in solution [green in (b)]. As the electrostatic strength increases from ε r = 33.2 (left) to ε r = 16.6 (right), it can be seen that the stability of the basin I and the N ensemble increases due to electrostatically assisted interactions. A pathway for binding is shown, as indicated by black arrows. The M state is a stable conformation of monomer B with Q B ∼ 0.5 in solution. It undergoes the M to I transition when monomer B binds to its partner, therefore, Q I increases (Q I ∼ 0.5). Finally, the native structure of the dimer (N, Q I ∼ 0.7, Q B ∼ 0.9) is formed via a conformational adjustment of monomer B. The ensembles M, I, N are illustrated in (b). (b) Illustration of the steering effect on the binding. The two monomers are initially separated. Monomer B is then guided electrostatically in searching the path (black arrows) for correct binding.
An electrostatically frustrated system—FIS protein
Sometimes protein binding is assisted by the long range electrostatics, as in the case for 1KDX. Sometimes however electrostatics does not favor the specific intermolecular binding interaction, so dimerization is not assisted electrostatically. For the FIS protein (1F36) the electrostatic energy of the protein in its native monomer form and the electrostatic energy for intermolecular binding are of opposite signs; the bound complex has a favorable electrostatic energy (−2.31 kcal/mol) while the electrostatic energies of the two individual monomers are unfavorable (3.31/3.36 kcal/mol). This difference leads to electrostatically driven conformational changes, as shown in Figure 8(a). In this figure, the average electrostatic energy E elec is plotted as a function of a binding order parameter (Q I) and a folding order parameters (Q I, contacts at binding interface; Q A, contacts for monomer A only). As can be seen from the electrostatic contour map, the correct binding of the dimer is electrostatically inhibited (contour in red) due to the unfavorable electrostatic interactions presented by the monomer. Although the native electrostatic energy of the protein displays a favorable binding energy in the dimer form, our thermodynamic analysis shows that the effects on binding in fact hinge on the electrostatics of the monomer by itself. As a result, the unfavorable electrostatics within each monomer leads to frustrated interactions. These frustration effects can be assessed at residue resolution, as shown in Figure 8(b). This figure shows the numerous frustrated interactions between the charged residues in the tertiary contacts of the FIS protein, calculated using frustratometer analysis.44 Ordinarily, the frustratometer algorithm uses AWSEM's energy functions to quantify the degree of frustration in the spatially localized interactions in proteins.45, 46 In this work, we carry out the same calculations after introducing the Debye‐Hückel potential into the frustratometer algorithm in order to identify electrostatically induced frustration. As illustrated in the native structure, two sorts of interactions can be identified: one sort, shown in green, encompasses the minimally frustrated interactions while the other sort, shown in red, refers to highly frustrated interactions. The electrostatically induced frustrations, are primarily localized within each monomer (but are not on the protein‐protein binding interface). They are significantly concentrated in the region where the FIS protein binds to the major grooves of its target DNA site.47 This observation suggests the functional significance of electrostatically induced frustrated interactions in protein‐DNA binding. This DNA binding region would become less frustrated upon the formation of the protein‐DNA complex. These results provide an explanation for the peculiar trend in the prediction quality in both the monomer and in the dimer with varying strength of the electrostatic interaction observed from the simulated annealing of the FIS protein [Fig. 4(c)]. Overall, the dimerization of this protein cannot be electrostatically assisted because of the conflicting final need for the dimer to bind to DNA.
Figure 8.
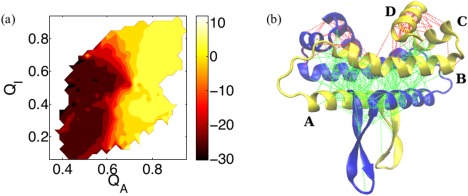
The electrostatic energy and the electrostatic frustration of the FIS protein (PDB code: 1F36) are illustrated. (a) The electrostatic energy (E elec in kcal/mol) is presented as a function of Q A and Q I. Q A refers to the fraction of the native contacts of a single monomer in the protein‐protein dimer; the FIS protein is a homodimer. A color map is used to illustrate the value of E elec (yellow for positive value). The yellow contour covers the area where the folding of the monomer and its subsequent binding are electrostatically unfavorable. (b) Different levels of frustration in the tertiary contacts of the FIS protein, as determined by the frustratometer analysis,44 are shown superimposed on the native structure of this homodimer. Minimally frustrated interactions are shown in green lines, and frustrated interactions are in red. The four α‐helices from N‐terminal to C‐terminal are named from A to D. The Debye‐Hückel term is included in the evaluation of the frustration. There are no frustrated interactions when the Debye‐Hückel term is turned off as in the original AWSEM frustratometer code. These electrostatics‐induced frustrations are localized within each monomer. Most of the frustrated interactions can be found within helix D and between helices C and D; some frustrations also exist between helix B and D (all of these involved in DNA binding region47). On the other hand, there are no induced frustration on the binding interface between the two monomers.
Discussion and Conclusions
In earlier studies of coarse‐grained protein models based on native structural information, Debye‐Hückel (DH) potentials have been used to model electrostatic interactions between charged residues of proteins. These studies suggest electrostatic interactions are essential in a variety of areas of biophysics such as folding landscapes and kinetics,40, 48, 49, 50, 51 binding mechanisms,52, 53 ionic effects,54 and especially for protein‐DNA complexes.42, 43 In this study, we have incorporated the electrostatic effects into a transferable structure prediction force field and studied how they modify the quality of the predicted structure of monomeric proteins based on their sequences. We do this by introducing the Debye‐Hückel potential into the existing AWSEM force field, which is already a good structure prediction tool. Our results demonstrate that adding these electrostatic interactions does not generally improve the structure prediction of monomeric proteins. On the other hand, in line with other computational studies aimed towards predicting folding stability, surface charge interactions of proteins do modulate the stability of some proteins by changing the folding rate and thus modify their folding landscapes.40 The increase in the folding stability can be attributed to charge‐charge interactions that destabilize unfolded ensembles.49 In fact, electrostatic effects together with nonnative hydrophobic effects were found to govern the properties of unfolded ensembles, featured by the funneled energetics of the landscape.50 Electrostatic effects are not essential for guiding the search for the correct native structure per se. We find that long range electrostatic interactions are not as important as other shorter range water mediated interactions in providing the specificity of folding. Rather, long‐range electrostatics plays a functional role in enhancing the specificity of interactions with other partners, so as to change solubility and aggregation properties.8
The long‐range nature of electrostatics implies electrostatics can change overall stability much more than structural specificity. Electrostatic effects play an essential role in binding mechanisms. They can also increase the binding rate. Owing to their slow spatial decay, electrostatic interactions acting at a large distance from the entire surface of two binding partners can bias diffusion at very large ranges thus steering docking.55 This “electrostatic steering” was first clearly described in computer studies of the reaction of superoxide dismutase (SOD) with its superoxide ionic substrate. For that system the protein can be assumed to be a rigid body without much conformational flexibility.56, 57 More generally, however, electrostatically accelerated binding processes can involve binding partners with considerable conformational flexibility, such as intrinsically disordered proteins (IDPs).52, 53 In these processes, the binding approach is coupled not to a fixed protein charge distribution but to a distribution that, owing to chain flexibility, can respond to the approaching partner, leading to a fly‐casting mechanism58 or a dock‐and‐coalesce mechanism59 when the final rearrangement is rate limiting. The present electrostatic AWSEM simulation results show that electrostatic steering effects are significant for forming the KIX‐pKID protein complex and that the charge‐charge stabilization directly contributes to the funneling of the binding landscape. The dimerization of FIS protein, on the other hand, is not electrostatically assisted. In this case, further electrostatic energy analysis shows that electrostatics‐induced frustrated interactions are located in DNA‐binding regions. These frustrated interactions are removed in the final functional binding events. In a related finding, it has recently been shown that electrostatically induced frustration facilitates a transition between specific and nonspecific binding modes for protein‐DNA binding, and that this leads to a subtle allostery in DNA targeting by transcription factors.60, 61 The specific ionic effects of Calcium on the Troponin C site III highlight again the importance of electrostatics for fine tuning functional responses. Such specific effects of multivalent ions doubtless also enter into many other problems where proteins interact with RNA, DNA, and highly charged membranes.
Methods
Model
The protein model we employ in the present work is called the Associative memory, Water mediated, Structure and Energy Model (AWSEM), which is a transferable coarse‐grained protein model.26 The descriptions of the model are detailed in Supporting Information. In this work, we address the effects of electrostatic forces on protein folding and binding. Electrostatic interactions were included in the AWSEM force field, modeled by the Debye‐Hückel (DH) potential:
| (1) |
where V AWSEM denotes the standard AWSEM energy function as Eq. (S1) in Supporting Information, and V DH refers to the Debye‐Hückel (DH) potential. The DH potential takes into account both the solvent dielectric effect and the screening of charge‐charge interactions by mobile ions in the solvent.43, 50, 54, 62 The interaction is
| (2) |
where qi and qj are charges of residue i and j that are separated by a distance rij; charge is assigned to the Cβ atom of each residue in AWSEM. K Elec = (4πɛ0)−1 = 332.24 in kcal Å mol−1 e −2. ɛr is the dielectric constant of the media (ɛ 0 =1 as in vacuum). l D refers to the Debye‐Hückel screening length, which appears in the factor that exponentially screens the direct coulomb interaction, 1/r. The length l D reflects the screening by rearranging ions in the surrounding solution. l D is given by , where k B is the Boltzmann constant, T is the temperature, e refers to the elementary electric charge, and I is the ionic strength of the solution. The ionic strength is defined as , where Ci is the molar concentration of ion i, Zi is the charge number of that ion, and the sum is taken over all types of ions in the solution. l D = 10 Å is used throughout this study. This value corresponds to a typical physiological solution condition: T = 25°C, ɛ r = 80 (water), and I = 0.1M. Note that in AWSEM only four types of residues are considered to be charged: arginine (Arg), lysine (Lys), aspartate (Asp), and glutamate (Glu). The former two residues are positively charged while the latter two are negatively charged; charge is assigned to the C β atom of each residue. The coulomb potential (1/r) is of course screened by the solvent, we can thus use ɛ r as a numerical factor to scale the strength of the DH term. In this study, we have varied the values of ɛ r to investigate the effects of dielectric screening on protein folding and binding. The effects could perhaps be probed in the laboratory by using mixed aqueous/nonaqueous solvents.
The simulation protocol and procedure are detailed in Supporting Information.
Analyses
To measure the structural similarity of snapshots from the trajectories with respect to the native structure, we use an order parameter Q, which compares the pairwise distances of C α atoms among the residues in a given instantaneous structure to those in the native structure. Q varies between 0 and 1. The higher the value of Q, the more similar the configuration is to the native structure. The explicit expression of Q that we use is
| (3) |
where N is the total number of residues, rij refers to the instantaneous distance between C α atoms of residue i and j, denotes the distance determined by experiments, and σij denotes an accuracy threshold . The summation in Eq. (3) involves only the pairs that are separated by three or more residues in sequence.
In the annealing process for either protein folding or binding, Q increases as the temperature decreases since the native structure is stabilized at low temperature. The annealing results are presented in terms of plots of Q vs annealing index. Q avg refers to an average of Q, which is taken over the last 100 snapshots from each run (30 runs for each protein or dimer). All the Q's are then sorted according to their values (from large to small). For structure prediction for monomeric proteins, the best Q was used as can be seen from Figure 2 for 12 different proteins while for protein S6, Q avg was used. In the cases of dimers we emphasized only the contacts at the binding interface, therefore, was used instead, as shown in Figure 4 for four different dimers.
Supporting information
Supporting Information
Acknowledgments
We are happy to dedicate this paper to Ron Levy whose unique combination of critical judgment and scientific open‐mindedness, evident from the earliest days of his scientific career, has illuminated the science of biomolecules.
References
- 1. Berg OG, von Hippel PH (1985) Diffusion‐controlled macromolecular interactions. Annu Rev Biophys Biophys Chem 14:131–160. [DOI] [PubMed] [Google Scholar]
- 2. Honig B, Nicholls A (1995) Classical electrostatics in biology and chemistry. Science 268:1144–1149. [DOI] [PubMed] [Google Scholar]
- 3. Schreiber G, Fersht AR (1996) Rapid, electrostatically assisted association of proteins. Nat Struct Biol 3:427–431. [DOI] [PubMed] [Google Scholar]
- 4. Janin J (1997) The kinetics of protein‐protein recognition. Proteins 28:153–161. [DOI] [PubMed] [Google Scholar]
- 5. Wolynes PG (2005) Energy landscapes and solved protein‐folding problems. Phil Trans Roy Soc A 363:453–464. [DOI] [PubMed] [Google Scholar]
- 6. Papoian GA, Ulander J, Wolynes PG (2003) Role of water mediated interactions in protein‐protein recognition landscapes. J Am Chem Soc 125:9170–9178. [DOI] [PubMed] [Google Scholar]
- 7. Otzen DE, Oliveberg M (1999) Salt‐induced detour through compact regions of the protein folding landscape. Proc Natl Acad Sci USA 96:11746–11751. [DOI] [PMC free article] [PubMed] [Google Scholar]
- 8. Kurnik M, Hedberg L, Danielsson J, Oliveberg M (2012) Folding without charges. Proc Natl Acad Sci USA 109:5705–5710. [DOI] [PMC free article] [PubMed] [Google Scholar]
- 9. Haq O, Andrec M, Morozov AV, Levy RM (2012) Correlated electrostatic mutations provide a reservoir of stability in HIV protease. PLoS Comput Biol 8:e1002675. [DOI] [PMC free article] [PubMed] [Google Scholar]
- 10. Buckle AM, Schreiber G, Fersht AR (1994) Protein‐protein recognition—crystal structural‐analysis of a barnase barstar complex at 2.0‐angstrom resolution. Biochemistry 33:8878–8889. [DOI] [PubMed] [Google Scholar]
- 11. Mao AH, Crick SL, Vitalis A, Chicoine CL, Pappu RV (2010) Net charge per residue modulates conformational ensembles of intrinsically disordered proteins. Proc Natl Acad Sci USA 107:8183–8188. [DOI] [PMC free article] [PubMed] [Google Scholar]
- 12. Das RK, Pappu RV (2013) Conformations of intrinsically disordered proteins are influenced by linear sequence distributions of oppositely charged residues. Proc Natl Acad Sci USA 110:13392–13397. [DOI] [PMC free article] [PubMed] [Google Scholar]
- 13. Koshland DE (1958) Application of a theory of enzyme specificity to protein synthesis. Proc Natl Acad Sci USA 44:98–104. [DOI] [PMC free article] [PubMed] [Google Scholar]
- 14. Monod J, Wyman J, Changeux JP (1965) On nature of allosteric transitions—a plausible model. J Mol Biol 12:88–118. [DOI] [PubMed] [Google Scholar]
- 15. Tsai CJ, Kumar S, Ma BY, Nussinov R (1999) Folding funnels, binding funnels, and protein function. Protein Sci 8:1181–1190. [DOI] [PMC free article] [PubMed] [Google Scholar]
- 16. Wang Q, Zhang P, Hoffman L, Tripathi S, Homouz D, Liu Y, Waxham MN, Cheung MS (2013) Protein recognition and selection through conformational and mutually induced fit. Proc Natl Acad Sci USA 110:20545–20550. [DOI] [PMC free article] [PubMed] [Google Scholar]
- 17. Levy RM, Gallicchio E (1998) Computer simulations with explicit solvent: recent progress in the thermodynamic decomposition of free energies and in modeling electrostatic effects. Annu Rev Phys Chem 49:531–567. [DOI] [PubMed] [Google Scholar]
- 18. Hünenberger PH, McCammon JA (1999) Effect of artificial periodicity in simulations of biomolecules under Ewald boundary conditions: a continuum electrostatics study. Biophys Chem 78:69–88. [DOI] [PubMed] [Google Scholar]
- 19. Hummer G, Pratt LR, García AE (1998) Molecular theories and simulation of ions and polar molecules in water. J Phys Chem A 102:7885–7895. [Google Scholar]
- 20. Figueirido F, Del Buono GS, Levy RM (1996) Prediction of pKa shifts without truncation of electrostatic interactions: an explicit solvent calculation for succinic acid. J Phys Chem 100:6389–6392. [Google Scholar]
- 21. Cortis CM, Friesner RA (1997) Numerical solution of the Poisson‐Boltzmann equation using tetrahedral finite‐element meshes. J Comput Chem 18:1591–1608. [Google Scholar]
- 22. Bashford D, Case DA (2000) Generalized born models of macromolecular solvation effects. Annu Rev Phys Chem 51:129–152. [DOI] [PubMed] [Google Scholar]
- 23. Zhang LY, Gallicchio E, Friesner RA, Levy RM (2001) Solvent models for protein‐ligand binding: comparison of implicit solvent poisson and surface generalized born models with explicit solvent simulations. J Comput Chem 22:591–607. [Google Scholar]
- 24. Mittal J, Best RB (2010) Tackling force‐field bias in protein folding simulations: Folding of villin HP35 and pin WW domains in explicit water. Biophys J 99:L26–L28. [DOI] [PMC free article] [PubMed] [Google Scholar]
- 25. Piana S, Lindorff‐Larsen K, Shaw DE (2012) Protein folding kinetics and thermodynamics from atomistic simulation. Proc Natl Acad Sci USA 109:17845–17850. [DOI] [PMC free article] [PubMed] [Google Scholar]
- 26. Davtyan A, Schafer NP, Zheng W, Clementi C, Wolynes PG, Papoian GA (2012) AWSEM‐MD: protein structure prediction using coarse‐grained physical potentials and bioinformatically based local structure biasing. J Phys Chem B 116:8494–8503. [DOI] [PMC free article] [PubMed] [Google Scholar]
- 27. Papoian GA, Ulander J, Eastwood MP, Luthey‐Schulten Z, Wolynes PG (2004) Water in protein structure prediction. Proc Natl Acad Sci USA 101:3352–3357. [DOI] [PMC free article] [PubMed] [Google Scholar]
- 28. Zheng W, Schafer NP, Davtyan A, Papoian GA, Wolynes PG (2012) Predictive energy landscapes for protein‐protein association. Proc Natl Acad Sci USA 109:19244–19249. [DOI] [PMC free article] [PubMed] [Google Scholar]
- 29. Zong CH, Papoian GA, Ulander J, Wolynes PG (2006) Role of topology, nonadditivity, and water‐mediated interactions in predicting the structures of alpha/beta proteins. J Am Chem Soc 128:5168–5176. [DOI] [PubMed] [Google Scholar]
- 30. Hardin C, Eastwood MP, Luthey‐Schulten Z, Wolynes PG (2000) Associative memory Hamiltonians for structure prediction without homology: alpha‐helical proteins. Proc Natl Acad Sci USA 97:14235–14240. [DOI] [PMC free article] [PubMed] [Google Scholar]
- 31. Bryngelson JD, Onuchic JN, Socci ND, Wolynes PG (1995) Funnels, pathways, and the energy landscape of protein‐folding—a synthesis. Proteins 21:167–195. [DOI] [PubMed] [Google Scholar]
- 32. Onuchic JN, Wolynes PG (2004) Theory of protein folding. Curr Opin Struct Biol 14:70–75. [DOI] [PubMed] [Google Scholar]
- 33. Bryngelson JD, Wolynes PG (1989) Intermediates and barrier crossing in a random energy‐model (with applications to protein folding). J Phys Chem 93:6902–6915. [Google Scholar]
- 34. Bryngelson JD, Wolynes PG (1987) Spin‐glasses and the statistical‐mechanics of protein folding. Proc Natl Acad Sci USA 84:7524–7528. [DOI] [PMC free article] [PubMed] [Google Scholar]
- 35. Goldstein RA, Lutheyschulten ZA, Wolynes PG (1992) Optimal protein‐folding codes from spin‐glass theory. Proc Natl Acad Sci USA 89:4918–4922. [DOI] [PMC free article] [PubMed] [Google Scholar]
- 36. Debye P, Huckel E (1923) The theory of electrolytes I. The lowering of the freezing point and related occurrences. Phys Z 24:185–206. [Google Scholar]
- 37. Turjanski AG, Gutkind JS, Best RB, Hummer G (2008) Binding‐induced folding of a natively unstructured transcription factor. PloS Comput Biol 4:e1000060. [DOI] [PMC free article] [PubMed] [Google Scholar]
- 38. Sugase K, Dyson HJ, Wright PE (2007) Mechanism of coupled folding and binding of an intrinsically disordered protein. Nature 447:1021–1025. [DOI] [PubMed] [Google Scholar]
- 39. Ganguly D, Chen J (2011) Topology‐based modeling of intrinsically disordered proteins: balancing intrinsic folding and intermolecular interactions. Proteins 79:1251–1266. [DOI] [PubMed] [Google Scholar]
- 40. Tzul FO, Schweiker KL, Makhatadze GI (2015) Modulation of folding energy landscape by charge‐charge interactions: linking experiments with computational modeling. Proc Natl Acad Sci USA 112:E259–E266. [DOI] [PMC free article] [PubMed] [Google Scholar]
- 41. Safo MK, Yang WZ, Corselli L, Cramton SE, Yuan HS, Johnson RC (1997) The transactivation region of the Fis protein that controls site‐specific DNA inversion contains extended mobile beta‐hairpin arms. Embo J 16:6860–6873. [DOI] [PMC free article] [PubMed] [Google Scholar]
- 42. Levy Y, Onuchic JN, Wolynes PG (2007) Fly‐casting in protein‐DNA binding: frustration between protein folding and electrostatics facilitates target recognition. J Am Chem Soc 129:738–739. [DOI] [PubMed] [Google Scholar]
- 43. Givaty O, Levy Y (2009) Protein sliding along DNA: dynamics and structural characterization. J Mol Biol 385:1087–1097. [DOI] [PubMed] [Google Scholar]
- 44. Ferreiro DU, Hegler JA, Komives EA, Wolynes PG (2007) Localizing frustration in native proteins and protein assemblies. Proc Natl Acad Sci USA 104:19819–19824. [DOI] [PMC free article] [PubMed] [Google Scholar]
- 45. Jenik M, Gonzalo Parra R, Radusky LG, Turjanski A, Wolynes PG, Ferreiro DU (2012) Protein frustratometer: a tool to localize energetic frustration in protein molecules. Nucleic Acids Res 40:W348–W351. [DOI] [PMC free article] [PubMed] [Google Scholar]
- 46. Ferreiro DU, Komives EA, Wolynes PG (2014) Frustration in biomolecules. Q Rev Biophys 47:285–363. [DOI] [PMC free article] [PubMed] [Google Scholar]
- 47. Stella S, Cascio D, Johnson RC (2010) The shape of the DNA minor groove directs binding by the DNA‐bending protein Fis. Genes Dev 24:814–826. [DOI] [PMC free article] [PubMed] [Google Scholar]
- 48. de Los Rios MA, Plaxco KW (2005) Apparent Debye‐Huckel electrostatic effects in the folding of a simple, single domain protein. Biochemistry 44:1243–1250. [DOI] [PubMed] [Google Scholar]
- 49. Azia A, Levy Y (2009) Nonnative electrostatic interactions can modulate protein folding: molecular dynamics with a grain of salt. J Mol Biol 393:527–542. [DOI] [PubMed] [Google Scholar]
- 50. Weinkam P, Pletneva EV, Gray HB, Winkler JR, Wolynes PG (2009) Electrostatic effects on funneled landscapes and structural diversity in denatured protein ensembles. Proc Natl Acad Sci USA 106:1796–1801. [DOI] [PMC free article] [PubMed] [Google Scholar]
- 51. Zarrine‐Afsar A, Zhang Z, Schweiker KL, Makhatadze GI, Davidson AR, Chan HS (2012) Kinetic consequences of native state optimization of surface‐exposed electrostatic interactions in the Fyn SH3 domain. Proteins 80:858–870. [DOI] [PubMed] [Google Scholar]
- 52. Ganguly D, Zhang W, Chen J (2013) Electrostatically accelerated encounter and folding for facile recognition of intrinsically disordered proteins. PLoS Comput Biol 9:e1003363. [DOI] [PMC free article] [PubMed] [Google Scholar]
- 53. Ganguly D, Otieno S, Waddell B, Iconaru L, Kriwacki RW, Chen J (2012) Electrostatically accelerated coupled binding and folding of intrinsically disordered proteins. J Mol Biol 422:674–684. [DOI] [PMC free article] [PubMed] [Google Scholar]
- 54. Wang Q, Liang KC, Czader A, Waxham MN, Cheung MS (2011) The effect of macromolecular crowding, ionic strength and calcium binding on calmodulin dynamics. PLoS Comput Biol 7:16. [DOI] [PMC free article] [PubMed] [Google Scholar]
- 55. Schreiber G, Haran G, Zhou HX (2009) Fundamental aspects of protein‐protein association kinetics. Chem Rev 109:839–860. [DOI] [PMC free article] [PubMed] [Google Scholar]
- 56. Sharp K, Fine R, Honig B (1987) Computer‐simulations of the diffusion of a substrate to an active‐site of an enzyme. Science 236:1460–1463. [DOI] [PubMed] [Google Scholar]
- 57. Allison SA, Bacquet RJ, McCammon JA (1988) Simulation of the diffusion‐controlled reaction between superoxide and superoxide‐dismutase. II. Detailed models. Biopolymers 27:251–269. [DOI] [PubMed] [Google Scholar]
- 58. Shoemaker BA, Portman JJ, Wolynes PG (2000) Speeding molecular recognition by using the folding funnel: the fly‐casting mechanism. Proc Natl Acad Sci USA 97:8868–8873. [DOI] [PMC free article] [PubMed] [Google Scholar]
- 59. Qin S, Pang X, Zhou H‐X (2011) Automated prediction of protein association rate constants. Structure 19:1744–1751. [DOI] [PMC free article] [PubMed] [Google Scholar]
- 60. Marcovitz A, Levy Y (2013) Weak frustration regulates sliding and binding kinetics on rugged protein‐DNA landscapes. J Phys Chem B 117:13005–13014. [DOI] [PubMed] [Google Scholar]
- 61. Marcovitz A, Levy Y (2011) Frustration in protein‐DNA binding influences conformational switching and target search kinetics. Proc Natl Acad Sci USA 108:17957–17962. [DOI] [PMC free article] [PubMed] [Google Scholar]
- 62. Caliskan G, Hyeon C, Perez‐Salas U, Briber RM, Woodson SA, Thirumalai D (2005) Persistence length changes dramatically as RNA folds. Phys Rev Lett 95:268303. [DOI] [PubMed] [Google Scholar]
Associated Data
This section collects any data citations, data availability statements, or supplementary materials included in this article.
Supplementary Materials
Supporting Information