

Abstract
Identification of functional genetic variants and elucidation of their regulatory mechanisms represent significant challenges of the post-genomic era. A poorly understood topic is the involvement of genetic variants in mediating post-transcriptional RNA processing, including alternative splicing. Thus far, little is known about the genomic, evolutionary, and regulatory features of genetically modulated alternative splicing (GMAS). Here, we systematically identified intronic tag variants for genetic modulation of alternative splicing using RNA-seq data specific to cellular compartments. Combined with our previous method that identifies exonic tags for GMAS, this study yielded 622 GMAS exons. We observed that GMAS events are highly cell type independent, indicating that splicing-altering genetic variants could have widespread function across cell types. Interestingly, GMAS genes, exons, and single-nucleotide variants (SNVs) all demonstrated positive selection or accelerated evolution in primates. We predicted that GMAS SNVs often alter binding of splicing factors, with SRSF1 affecting the most GMAS events and demonstrating global allelic binding bias. However, in contrast to their GMAS targets, the predicted splicing factors are more conserved than expected, suggesting that cis-regulatory variation is the major driving force of splicing evolution. Moreover, GMAS-related splicing factors had stronger consensus motifs than expected, consistent with their susceptibility to SNV disruption. Intriguingly, GMAS SNVs in general do not alter the strongest consensus position of the splicing factor motif, except the more than 100 GMAS SNVs in linkage disequilibrium with polymorphisms reported by genome-wide association studies. Our study reports many GMAS events and enables a better understanding of the evolutionary and regulatory features of this phenomenon.
Since the completion of the human genome project, major efforts have been devoted to genome-wide association studies (GWAS) with the ultimate goal of elucidating the genetic underpinnings of human diseases or phenotypic traits (Evangelou and Ioannidis 2013). It is now clear that many disease-associated genetic variants are located in noncoding regions whose functional relevance is much harder to interpret than coding variants. Thus, prediction and validation of functional variants are imperative tasks of the post-genomic era. Recent work integrating genomic and bioinformatic analyses made significant progress in prediction and prioritization for causal genetic variants, but mostly focused on their involvement in transcriptional control (for review, see Li et al. 2015). In addition to transcriptional regulation, genetic variants located in exons or introns may affect alternative splicing (Wang and Cooper 2007; Xiao and Lee 2010), an aspect that is not yet widely appreciated.
It is known that both cis- and trans-genetic variants can affect alternative splicing, which may contribute to the etiology, susceptibility, or progression of diseases (Wang and Cooper 2007; Sterne-Weiler and Sanford 2014). Previous studies reported that 15%–60% of disease-causing mutations may alter splicing, an estimate mainly based on examination of splice site mutations (Wang and Cooper 2007). Recently, a wide spectrum of cis-regulatory elements of splicing was identified, known as splicing enhancers and silencers (Wang and Burge 2008), and proved essential in predicting splicing levels (Barash et al. 2010; Busch and Hertel 2015). Thus, the prevalence of splicing-altering genetic variants that disrupt cis-regulatory elements could be much higher than previously appreciated.
To identify such genetic variants, a number of studies examined splicing quantitative trait loci (sQTL) in cell lines derived from human populations (Kwan et al. 2008; Zhao et al. 2013; Monlong et al. 2014). This approach evaluates statistical associations between genotypes and splicing phenotypes (or RNA isoforms) that necessitate a large number of parallel data sets from individuals of diverse genetic background. We previously developed a second approach that examines allele-specific expression (ASE) patterns of genetic variants to identify splicing events under regulation by these variants (Li et al. 2012). Applicable to a single RNA sequencing (RNA-seq) data set, this method identifies cis-regulatory variants independent of trans-acting effects. Machine learning–based techniques have also been applied to score genetic variants that affect splicing (Sterne-Weiler et al. 2011; Mort et al. 2014; Xiong et al. 2014). In general, methodology development is still the focus of most studies in this area. The number of experimentally validated functional variants in alternative splicing remains relatively small. Consequently, little is known about the genomic, evolutionary, and regulatory features of genetically modulated alternative splicing (GMAS).
To this end, we conducted a systematic analysis of both intronic and exonic genetic variants involved in splicing modulation, capitalizing on the cellular compartment-specific human RNA-seq data generated by the ENCODE Project (Djebali et al. 2012). We examined the ASE patterns of single-nucleotide variants (SNVs) and analyzed nuclear and cytosolic RNA contents comparatively. Our analyses identified more than 600 GMAS exons and associated SNVs, which enabled a detailed examination of the global features of these events. We observed that cis-regulatory variation is the major driving force of splicing variation in GMAS, often rendering cell-type–independent splicing phenotypes. Interestingly, GMAS-associated genes, exons, and SNVs demonstrated significant bias reflecting positive or relaxed evolutionary selection in human and other primates. In contrast, GMAS events are likely regulated by highly conserved splicing factors with strong consensus motifs that are susceptible to SNV disruption. We also analyzed the specific nucleotide positions of splicing factor motifs disrupted by GMAS SNVs, which yielded important insights that have both functional and evolutionary implications. By using gel shift assays and CLIP-seq data, we confirmed the allele-specific binding features of the splicing factor SRSF1, a major regulator of GMAS events. More than 100 (18%) GMAS SNVs were in linkage disequilibrium (LD) with GWAS SNPs, accounting for the possible function of 99 GWAS SNPs residing deep in the introns. Our study reports a large number of GMAS events and enables a better understanding of the evolutionary and regulatory features of this phenomenon.
Results
Compartment-specific RNA-seq enhances coverage of intronic SNVs
Compartment-specific RNA-seq data sets derived from nuclear and cytosolic RNA of a number of cell lines were obtained from the ENCODE Project (Djebali et al. 2012). In addition, polyadenylated RNA (polyA+) and RNA without polyA tails (polyA−) were processed into separate RNA-seq libraries. Thus, for each cell line, a total of four types of data are available: nuclear polyA+ (NA+), nuclear polyA− (NA−), cytosolic polyA+ (CA+), and cytosolic polyA− (CA−) (Supplemental Table 1). Our study focused on the first three types of data. We hypothesized that the nuclear-specific data sets represent enriched RNA content compared with that captured by traditional polyA+ RNA-seq, with a specific advantage of enhanced coverage of intronic RNA. As shown in Figure 1A, read distribution of the RNA-seq data showed that intronic RNA was the most enriched in the NA− data and the least abundant in the CA+ data set, consistent with expectations. We next examined the expression of SNVs in the RNA-seq data by analyzing their ASE patterns (Li et al. 2012). As expected, the NA− data set yielded the highest percentage of intronic SNVs with ASE (Fig. 1B). Since the NA− RNA fraction is enriched with nascent RNA prior to completion of splicing and spliced introns to be degraded or undergoing degradation (Fig. 1C), this fraction represents additional information that is not normally captured in standard polyA+ RNA-seq.
Figure 1.

Compartment-specific RNA-seq enables coverage of intronic SNVs. (A) The genomic context of uniquely mapped reads of GM12878 CA+, NA+, and NA− RNA-seq data sets. Two biological replicates (R1 and R2) were analyzed. Noncoding refers to noncoding transcripts or genes. Reads that mapped to regions with multiple annotation categories were classified into one genomic context according to priorities given as follows: coding exon > 3′ UTR > 5′ UTR > intron > noncoding > intergenic. (B) Similar to A, the genomic context of SNVs with ASE patterns in GM12878 CA+, NA+, and NA− data sets. Biological replicates were combined. (C) The biological principle underlying iGMAS detection. In this hypothetical example, the yellow exon is alternatively spliced (AS) depending on the allele of the intronic SNV, with the A allele associated with exon inclusion and G allele associated with exon skipping. In the nucleus, NA− RNA-seq reads could originate from nascent RNA or spliced-out products. In the spliced-out products, the A and G alleles will reside, respectively, in the single intron and the intron–exon–intron molecule. In the nascent RNA, the A and G alleles are also present, which is not shown in the diagram. RNA-seq reads (red arrows) originating from spliced-out products covering the intronic SNV and neighboring exon or intron are enriched with the G allele, which can be analyzed to infer allele-specific regulation of splicing. An exonic SNV is also illustrated, whose T allele (the one in the same haplotype as the intronic A allele) is expected to be enriched in RNA-seq data of the cytoplasmic RNA (CA+). Note that exonic SNVs are not always present in iGMAS exons.
Identification of intronic tag SNVs for GMAS
We analyzed the above data sets to identify intronic tags for genetic modulation of alternative splicing (iGMAS). In general, if an alternative splicing event is regulated by genetic variants, the exon demonstrates allele-specific splicing patterns depending on the alleles of the causal variant. If other exonic or intronic variants exist in LD with the causal variant, they also exhibit corresponding ASE profiles. Furthermore, if the causal or LD variants reside in the introns, the spliced-out product (i.e., spliced introns) is expected to display allele-specific bias. In the NA− data set, such spliced-out products may be captured to identify allele-specific alternative splicing events. Thus, we focused on read pairs that may represent spliced introns of alternative splicing to inform a search for iGMAS SNVs, given the paired-end NA− data.
Specifically, we anchored the search on heterozygous intronic SNVs covered by reads whose corresponding read pairs mapped to the neighboring exon or the other flanking intron of the exon (Fig. 1C, red arrows), and asked whether these reads were enriched with one of the two alleles of the intronic SNVs. Since these read pairs might have originated from spliced products where the exon was alternatively skipped, such an allelic bias may reflect existence of allele-specific alternative splicing. However, the above read pairs may also be generated from nascent RNA transcripts prior to splicing completion, in which case the allelic bias of the intronic SNVs was resulted from ASE of the entire gene. We thus examined the allelic expression ratios of the transcripts and excluded those with predicted gene-level ASE. Following this step, we tested the null hypothesis that intronic SNVs covered by read pairs as described above were not expressed in an allele-specific manner in the NA− data (Methods). The iGMAS SNVs were then defined as those associated with a rejected null hypothesis. Note that another possibility that leads to the above observed allelic bias is allele-specific intron degradation. Since this phenomenon was barely reported in the literature, we hypothesize that it is a rare mechanism and that GMAS accounts for the majority of the observed allelic bias (which is tested by experimental validation using splicing reporters below).
As a proof of principle, we first applied this method to the ENCODE data sets derived from the GM12878 cell line. In the NA− data set, a total of 3476 heterozygous intronic SNVs, not residing in genes with whole-gene-level ASE, were identified to be associated with read pairs covering the SNVs and their respective flanking exons or introns. Among these SNVs, 35 had significant allelic bias and were identified as iGMAS SNVs, an example of which is shown in Figure 2A. The small fraction of iGMAS SNVs among all testable intronic SNVs may partly reflect the stringency in defining significance in our method to enhance accuracy.
Figure 2.
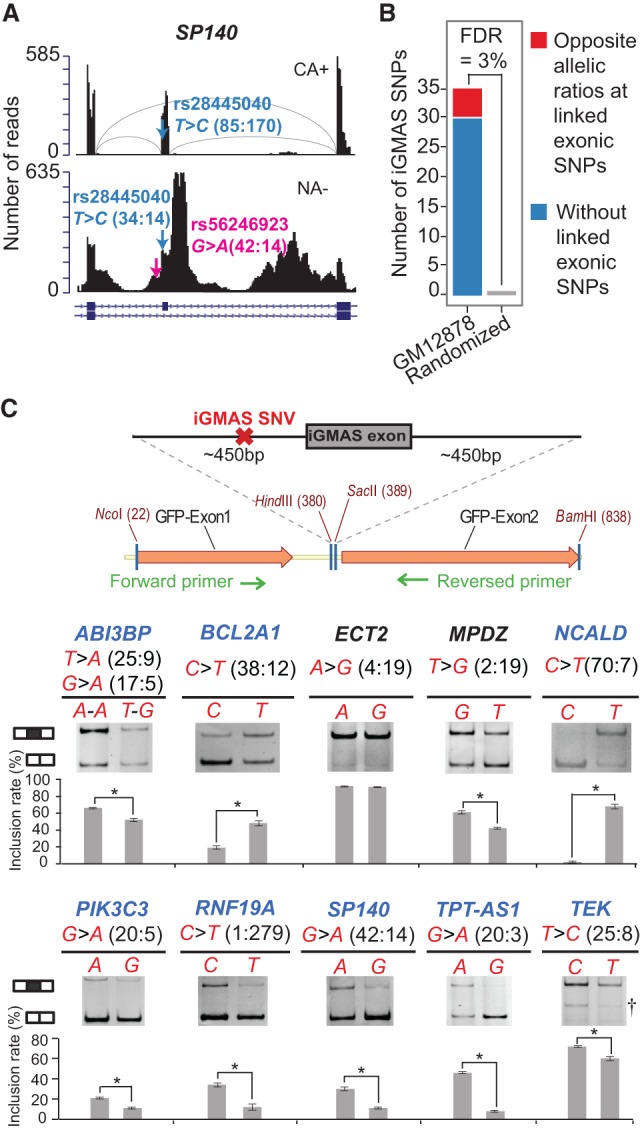
Evaluation of the iGMAS method. (A) An example iGMAS event. Read distributions of the region in the gene SP140 around an iGMAS event identified in GM12878 are illustrated using the CA+ (upper) and NA− (lower) data, respectively. Exon–intron structures (RefSeq annotation) are shown at the bottom. Pink arrow and text denote iGMAS SNP location, allele types, and number of reads harboring each allele in NA− data. This iGMAS exon also has an exonic SNP whose information is provided in blue (haplotypes: T-G, C-A). As expected for an authentic iGMAS event, the exonic SNP has opposite allelic bias in CA+ and NA− data (i.e., allele C enriched in CA+ but underrepresented in NA−). Arcs in light gray represent existence of spliced junction reads across exons. (B) The number of iGMAS events identified in GM12878 cells (blue and red) where five events (red) had corresponding exonic SNVs (all of which showed opposite allelic ratios comparing their allelic coverage in the CA+ and NA− fractions). Only one iGMAS event was identified in the randomized data (Methods), yielding an estimated a false-discovery rate (FDR) of 3%. (C) The minigene system used for experimental validation of iGMAS events is illustrated (Supplemental Methods). Validation results in HeLa cells of 10 randomly picked iGMAS events are shown. Alternative alleles of iGMAS SNVs are shown together with their read counts in NA− data. All events but one (ABI3BP) had only one iGMAS SNV. Mean and SD of exon inclusion levels based on three biological replicates are shown. As expected for successful validation, the more enriched allele in NA− RNA-seq data should be associated with a smaller exon inclusion level in the splicing assay. Among the 10 iGMAS events, eight (gene names in blue) were successfully validated in HeLa cells. (*) P ≤ 0.05, Wilcoxon rank-sum test; (†) nonspecific bands.
To evaluate the accuracy of this method, we applied a read-randomization procedure to estimate the empirical FDR (Methods). Based on this simulation, the predicted iGMAS SNVs had an FDR of <3% (Fig. 2B). As an alternative test of performance, we focused on the specific type of iGMAS events where there exists a heterozygous exonic SNV in addition to the intronic one. For a true iGMAS event, we expect to observe “opposite allelic ratios” for the exonic SNV in the NA− data compared with the CA+ RNA-seq data (Fig. 1C). That is, the allele enriched in the NA− data (among read pairs covering the intronic and exonic SNVs) should be relatively depleted in the CA+ RNA-seq data compared with its counterpart allele. Indeed, all five such exonic SNVs associated with predicted iGMAS events demonstrated opposite allelic ratios between the NA− and CA+ fractions, attesting to the validity of this method.
iGMAS events identified in seven ENCODE cell lines
We applied the method to data derived from six additional ENCODE human cell lines: K562, HeLa, HepG2, HUVEC, NHEK, and H1-hESC. Combined with those yielded from the GM12878 data, a total of 174 unique iGMAS SNVs were identified, associated with 190 AS exons (Supplemental Fig. 1; Supplemental Table 2). The number of predicted iGMAS events differs for different data sets partly because of the variation in the amount of mapped reads across data sets (Supplemental Fig. 1; Supplemental Table 1). In addition, the genetic background of each cell line also contributes to this difference because our method inherently requires the presence of intronic SNVs close to the exons. Another variable is the insert size of the libraries (Supplemental Fig. 2) since pairs of reads that overlap the intronic SNVs and the neighboring exonic regions were used whose abundance is restrained by the insert size of RNA-seq libraries. Among all predicted iGMAS SNVs and related genes, one SNP and five genes were present in two or more cell lines. This low level of overlap possibly reflects genetic diversity across the cell lines and/or the existence of a much larger number of genetically regulated splicing events not yet identified in this analysis.
Experimental validation of iGMAS predictions
We randomly picked 10 predicted iGMAS events from the results of three cell lines for validation using a minigene system (Fig. 2C; Supplemental Table 3). The iGMAS exon and about 450 bases of the flanking introns were cloned into a region flanked by two other exons (encoding GFP) and related intronic sequences (Xiao et al. 2009). For each iGMAS exon, two versions of the minigene were constructed, each carrying one of the two alleles of the intronic SNV. The minigenes were transfected into HeLa cells. Splicing of the iGMAS exon was analyzed using RT-PCR with primers targeting the two flanking GFP exons. Among the 10 candidates, eight were confirmed to have allele-specific splicing with the direction of allelic bias consistent with our RNA-seq analysis (Fig. 2C). Two other candidates (ECT2 and MPDZ) did not show the predicted difference of exon inclusion levels between the alternative alleles. Failed validation could be due to the fact that the causal SNV is located outside of the limited intronic region cloned into the minigene system, or alternatively, the responsible trans-factor is not available or functional in HeLa. Overall, the high validation rate (80%) supports the accuracy of the iGMAS method and the effectiveness of this method in capturing causal SNVs for splicing alteration. The results also suggest that it is unlikely that the observed GMAS events mainly resulted from allele-specific intron degradation.
A compendium of GMAS events
We previously developed a method to identify GMAS events by leveraging the information in RNA-seq data to reveal allelic association of exonic SNVs with splicing patterns (Li et al. 2012). The current method focusing on intronic SNVs complements the previous one (which we now call eGMAS for exonic tags of GMAS), which together generates an expanded catalog of genetically modulated exons. By combining the results of iGMAS and eGMAS on the above ENCODE data sets, we identified a total of 630 GMAS-related SNVs in 538 genes associated with splicing change of 622 exons (Supplemental Table 2; Supplemental Fig. 3A). Among all GMAS SNVs, 34% (215 out of 630) were previously reported in large-scale splicing QTL studies (’t Hoen et al. 2013; Lappalainen et al. 2013), a much larger overlap than expected (P < 0.0001) (Supplemental Fig. 3B). It should be noted that eGMAS SNVs were more often shared across cell lines compared with iGMAS SNVs, with 73 eGMAS SNVs present in more than one cell line. This observation may be partly explained by the enhanced stringency imposed in iGMAS identification. We applied a high stringency requirement considering that relatively few splicing-altering intronic SNVs were known in the literature compared with exonic ones. In addition, we observed that intronic genetic background in general is more diverse across cell lines than exonic sequences, another factor contributing to the small degree of overlap of iGMAS events across cell lines.
Cis-regulatory elements are primary drivers of splicing variation in GMAS
Among all GMAS exons, 90 were predicted in at least two cell lines, with 73% (66 out of 90 exons) having the same associated SNV. Motivated by this observation, we next addressed the question whether splicing change caused by genetic variants is often cell type specific or is shared across cell types. To this end, we collected SNVs with adequate statistical power common to two cell lines and asked whether those identified as GMAS SNVs in one cell line were often predicted as GMAS SNVs in the other cell line. In all pair-wise comparisons, we observed significantly higher numbers of shared GMAS SNVs across two cell lines than expected by chance (hypergeometric test, P < 2.2 × 10⁻¹⁶) (Fig. 3A). These data suggest that genetic variants often affect splicing in a cell-type–independent manner. Thus, cis-regulatory elements may be the primary determinants of splicing variation in GMAS.
Figure 3.
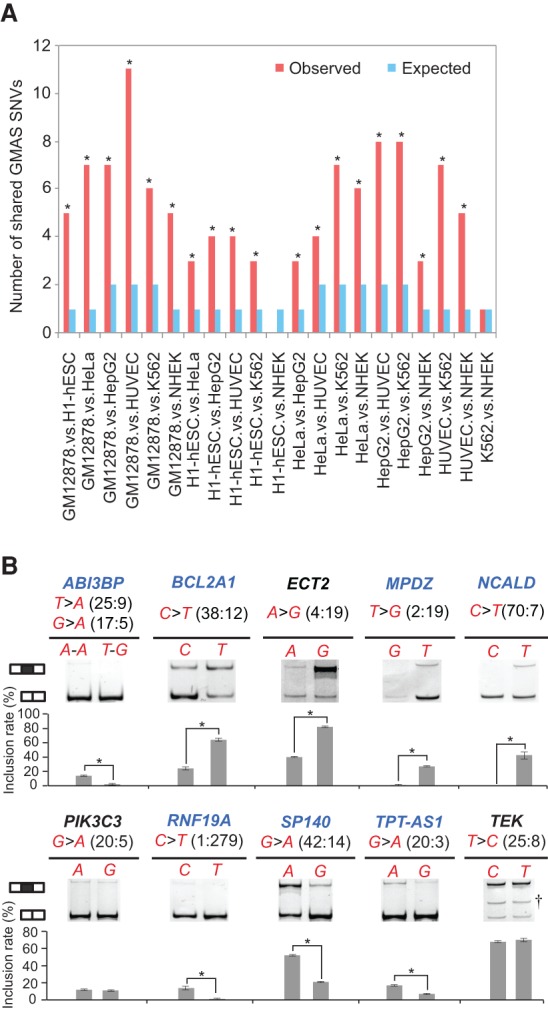
Splicing alteration by genetic variants is highly cell type independent. (A) The number of common GMAS SNVs between each pair of samples is shown (red bars). The expected number of shared GMAS SNVs for each pair of samples (blue bars) was calculated assuming an independent occurrence of each event in each sample. Enrichment of common GMAS SNVs between cell types was evaluated using hypergeometric test by comparing the observed and expected occurrences. (*) P < 0.05. (B) The same splicing assays as shown in Figure 2C were repeated by transfecting the minigenes (containing human iGMAS exons) into mouse 3T3 cells. The results are illustrated in the same way as in Figure 2C. Successfully validated cases are illustrated with the gene names in blue.
We tested the above hypothesis experimentally by expressing the human splicing reporters (Fig. 2C) in a mouse cell line (3T3) and measuring the splicing levels. Among the 10 iGMAS events tested in Figure 2C, seven were validated in 3T3 cells with the allelic bias consistent with iGMAS prediction (Fig. 3B). These results strongly suggest that cis-regulatory elements are key factors determining GMAS phenotypes. Notably, the MPDZ gene that failed validation in HeLa cells was successfully validated in 3T3 cells. Only one event (in ECT2) consistently failed in both cell types, suggesting that the accuracy of iGMAS prediction could be as high as 90% if multiple cell types were used in experimental validation.
GMAS exons demonstrate accelerated sequence evolution in primate lineages
With the large set of GMAS events, we examined their evolutionary characteristics from multiple perspectives. First, we compared the sequence conservation level of GMAS exons and associated introns to that of control exons and introns (Supplemental Methods). PhastCons scores that were derived using the genomes of 46 vertebrates spanning primates to fish were used for this purpose (Siepel et al. 2005). Interestingly, we found that GMAS exons (both coding and noncoding) were less conserved than the controls that were randomly chosen alternatively spliced (AS) exons (Fig. 4A). This observation indicates that GMAS exons may be evolving faster compared to AS exons in general.
Figure 4.
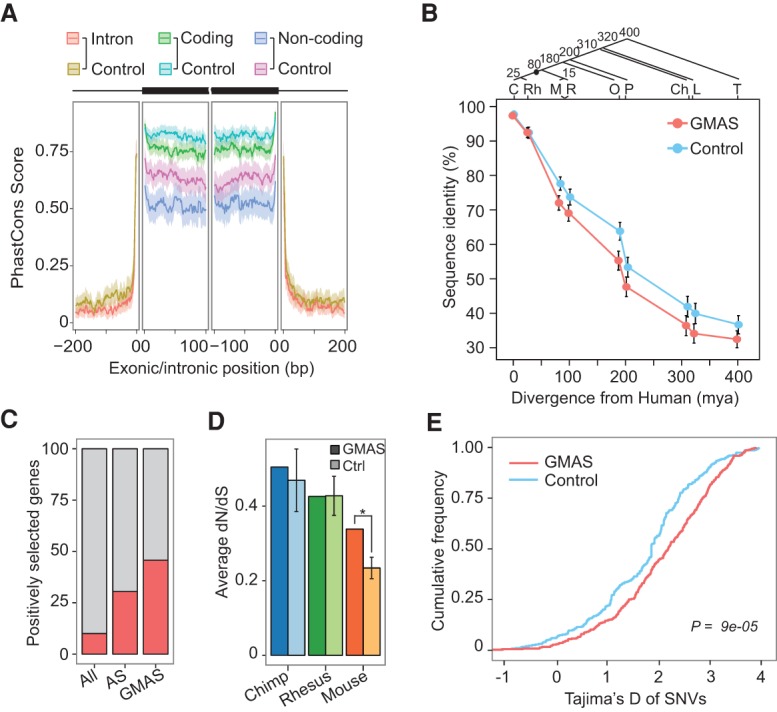
GMAS events undergo accelerated evolution. (A) Conservation profile (mean and 95% confidence interval of 46-way PhastCons scores) of GMAS exons and flanking introns. GMAS exons were separated into coding and noncoding groups with corresponding control exons of the same type. (B) Percentage of sequence identity (mean and 95% confidence interval) of GMAS exons (red) and control exons (blue) between human and each of the organisms shown in the graph. Estimated divergence times of each species from human (in million years [mya]) are shown along the x-axis and in the phylogenetic tree. (C) Chimpanzee; (Rh) rhesus macaque; (M) mouse; (R) rat; (O) opossum; (P) platypus; (Ch) chicken; (L) lizard; and (T) tetraodon. (C) Percentage of genes that are under positive selection according to the Selectome database. The analysis was conducted for all known human genes, AS genes according to ENCODE RNA-seq data used in this study, and GMAS genes. GMAS genes are more often positively selected (P < 2.2 × 10⁻¹⁶ compared with all human genes, P = 3.4 × 10⁻¹³ compared with AS genes, Fisher's exact test). (D) dN/dS values (mean and SD) of coding GMAS exons comparing human versus chimpanzee, human versus rhesus macaque, or human versus mouse. Results for GMAS exons and control exons are shown in darker and lighter colors, respectively. Control exons used in this graph were randomly picked AS exons with similar PSI values as GMAS exons as calculated using brain RNA-seq data (Supplemental Methods). The average dN/dS ratio of GMAS coding exons between human and mouse is significantly greater than that of control exons (*P < 0.001 based on empirical distribution of 1000 control sets). (E) Tajima's D values of GMAS (red) and control SNPs (blue) in the CEU population. The P-value was obtained from the Kolmogorov–Smirnov test.
To better understand the evolutionary pattern of GMAS exons, we examined their sequence divergence between human and other species in pair-wise comparisons (Fig. 4B). As expected, the sequence conservation level decreased as the evolutionary distance of the considered species increased relative to human. Interestingly, GMAS exons were similarly conserved as random control exons (Supplemental Methods) when comparing human and other primate sequences (chimpanzee and rhesus macaque). However, the lower sequence conservation of GMAS exons (compared with controls) became evident in mouse and other species with greater evolutionary distances from human. Based on the parsimony model of evolution, these data suggest that GMAS exons experienced faster evolution in recent evolutionary history, which is common to primates, but occurred after the speciation event leading to primate and rodent lineages (between 25 and 80 million years ago [mya]) (Fig. 4B).
GMAS-related genes, exons, and SNVs undergo positive or balancing selection
The primate-specific nature of accelerated evolution of GMAS exons prompted us to examine whether they are subject to positive selection. We first asked whether the genes harboring GMAS exons were enriched with those undergoing positive selection. About 46% (246 out of 538) of GMAS genes were categorized as positively selected genes in the Selectome database (Moretti et al. 2014). This fraction is significantly higher than that among all known human genes (10%) and that among genes undergoing AS (30%) based on the ENCODE RNA-seq data (Fig. 4C).
We next examined the amino acid selection pressure (dN/dS) of protein-coding GMAS exons. We randomly selected, as controls, AS exons that are also protein coding and have similar exon inclusion levels as the GMAS exons (Supplemental Methods). To quantify the exon inclusion level, we used previously published tissue-specific human RNA-seq data to calculate the percent-spliced-in (PSI) values of exons in the brain, heart, and liver, respectively (Barbosa-Morais et al. 2012). Compared between human and mouse, GMAS exons demonstrated significantly higher dN/dS values than control exons in all three tissues (Fig. 4D; Supplemental Fig. 4). This difference in dN/dS is mainly due to a higher value of dN for GMAS exons compared with control AS exons (Supplemental Fig. 4). The dN/dS of GMAS exons is not significantly different from that for control exons between human and other primates (chimpanzee and rhesus macaque). These results suggest that GMAS exons are under relaxed amino acid selection pressure in recent primate evolution, which is in line with the above observation of accelerated sequence evolution in primate lineages.
A related question is whether GMAS SNVs demonstrate any signs of accelerated evolution. To address this question, we calculated three population genetics measures: Tajima's D (Tajima 1989), fixation index (FST) (Weir and Cockerham 1984), and integrated haplotype score (iHS) (Voight et al. 2006). By using data from the 1000 Genomes Project (The 1000 Genomes Project Consortium 2012), we observed that most GMAS SNVs had positive Tajima's D values that are often statistically greater than controls in multiple populations (CEU, FIN, GBR, and TSI) (Fig. 4E; Supplemental Fig. 5A). Positive Tajima's D is considered as a signature of balancing selection where there is an excess of common variants compared with the neutral expectation within a population. Alternatively, positive values of Tajima's D may also reflect recent population contraction, which is unlikely true here since the European populations are known to have experienced recent population expansion (Keinan and Clark 2012; Nelson et al. 2012; Tennessen et al. 2012). Values of FST and iHS of the GMAS SNVs are not significantly different from those of controls (Supplemental Fig. 5). Nevertheless, GMAS SNVs demonstrated a trend of higher FST than that of control SNPs (P = 0.06). Higher FST values suggest higher population differentiation, that is, a lower level of shared alleles across populations, which is considered as a sign of positive selection. The selection signals on SNVs are generally weaker than those of GMAS genes or exons, which may be due to the existence of some noncausal SNVs among GMAS SNVs.
Altogether, the above evolutionary and populational analyses converge to the same conclusion that GMAS events are associated with a signature of accelerated evolution or positive selection in primates.
GMAS events are likely regulated by conserved splicing factors
A natural hypothesis about the regulatory mechanism of GMAS SNVs is that the alternative alleles of a SNV change the binding strength of a splicing factor, which then alters the outcome of splicing. Based on this hypothesis, we searched for known motifs of a large compendium of RNA binding proteins (RBPs) (Cook et al. 2011; Ray et al. 2013) flanking each GMAS SNV and selected one putative RBP whose motif score was altered most significantly by the SNV (Supplemental Methods). Random intronic SNVs that were at least 5000 bases away from exons were used as controls to compare with GMAS SNVs. Supplemental Figure 6 shows the difference in RBP binding scores between the two alternative alleles of each SNV. GMAS SNVs alter the binding scores of RBPs more significantly than control SNVs, supporting the expected relationship between RBPs and GMAS SNVs and the expectation that GMAS SNVs are enriched with causal SNVs.
Figure 6.
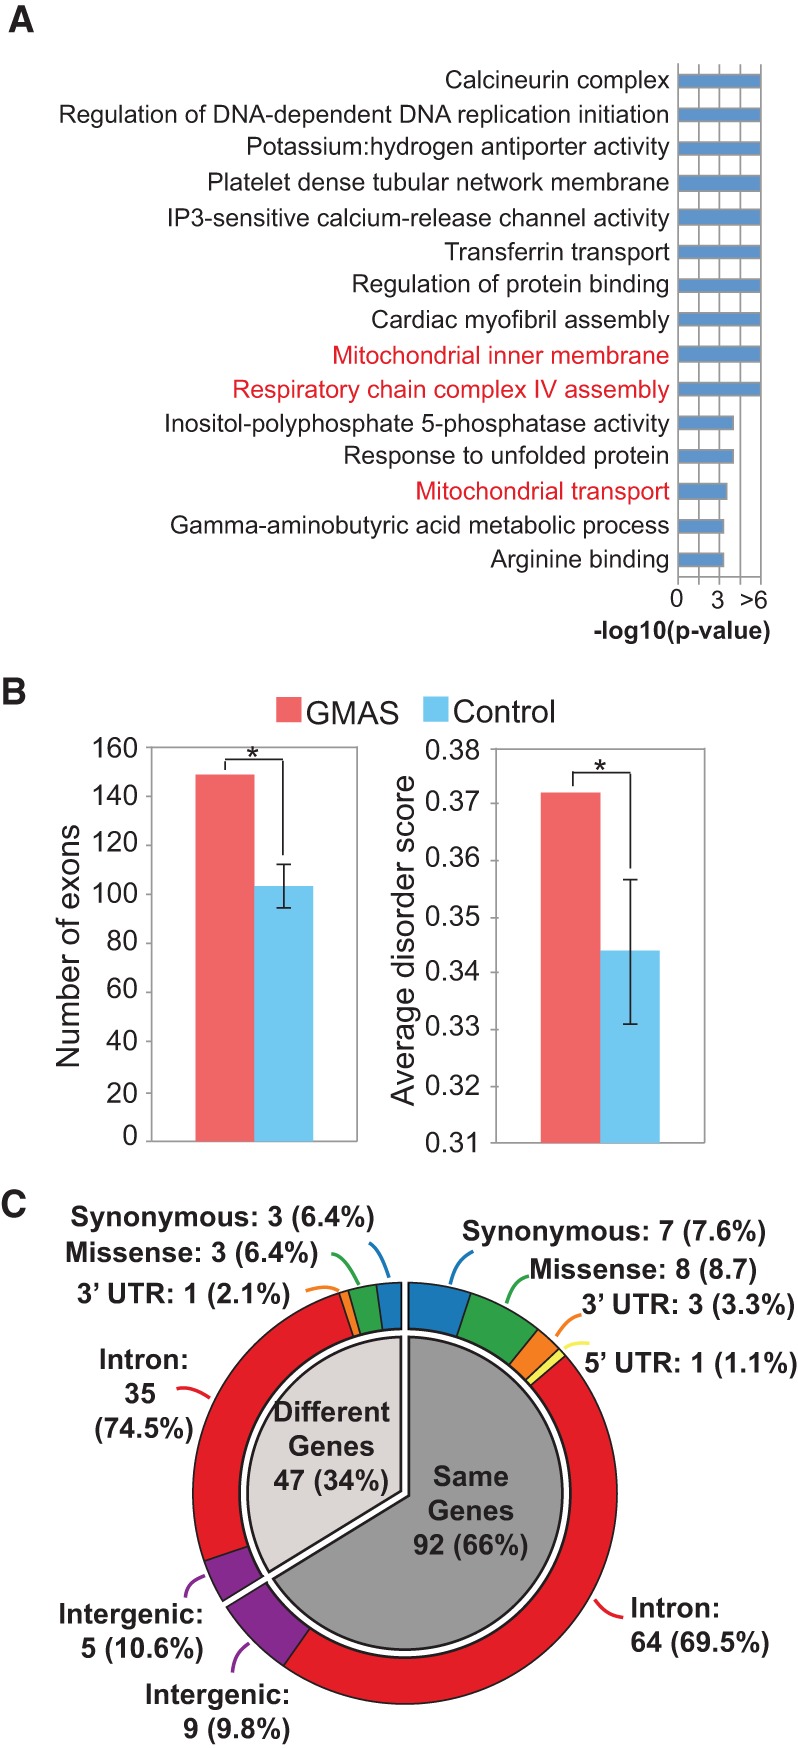
Functional relevance of GMAS events. (A) Enriched GO terms among GMAS genes. The GO terms are ranked by P-values. Mitochondrial-related terms are colored in red. (B) Intrinsically disordered regions (IDRs) overlapping GMAS exons. (Left) Number of GMAS and number of control exons (mean and SD of 1000 sets of controls) overlapping IDRs. GMAS exons are more often located in IDRs than are control exons. (Right) Average disorder scores of amino acids in GMAS and control exons (mean and SD). (*) P < 0.05, based on the empirical distribution of 1000 control sets. (C) Genomic context of GWAS SNPs (outer ring) located in the same genes as GMAS SNVs (inner pie; darker gray) or different genes as GMAS SNVs (inner pie; light gray). Most GWAS SNPs are located in introns, whose functions were elusive.
Next, we focused on 15 splicing factors that were predicted to target at least five GMAS SNVs (Fig. 5A). An immediate question is whether these splicing factors also evolve faster than expected, similar to their GMAS exon targets. Interestingly, we observed that both the protein sequences and the RNA binding domains of these factors are significantly more conserved than control splicing factors that were not predicted to target any GMAS SNV (Fig. 5B,C; Supplemental Methods). Thus, splicing of the fast-evolving GMAS exons is likely regulated by conserved splicing factors. This finding again supports our earlier conclusion that alterations in cis-elements are the primary driving force of splicing evolution.
Figure 5.
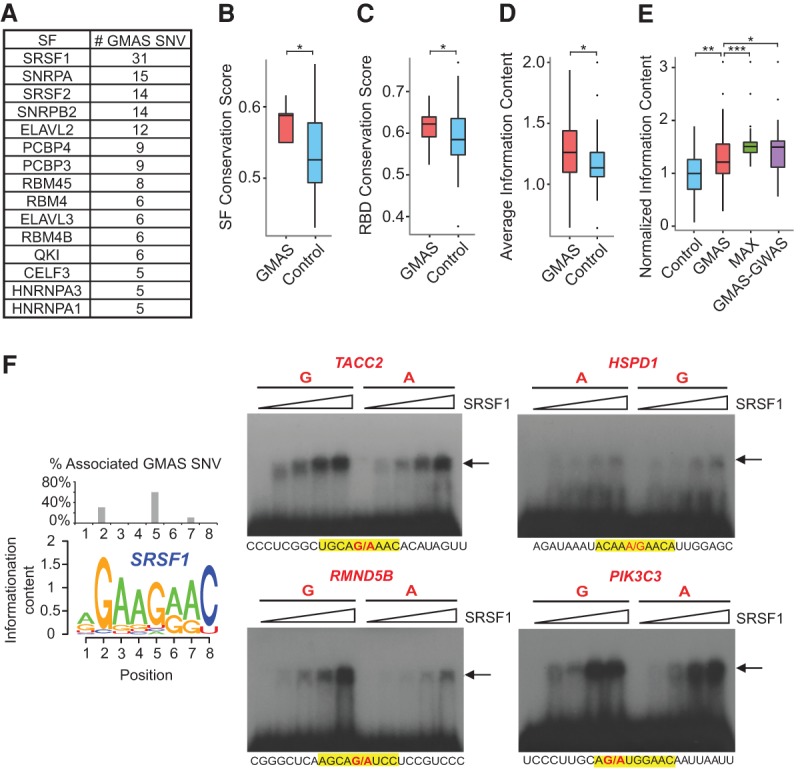
GMAS SNVs alter the binding of splicing factors. (A) Splicing factors predicted to target at least five GMAS SNVs (ranked by the number of their GMAS targets). (SF) Splicing factor. (B) Amino acid conservation scores of the GMAS-associated splicing factors (GMAS) and control splicing factors (Control). The 15 splicing factors listed in A were included in this analysis. Controls were defined as all non-GMAS-targeting splicing factors. Known splicing factors were obtained from pervious literature (Han et al. 2013). (*) P = 0.004, Wilcoxon rank-sum test. (C) Amino acid conservation scores of the RNA binding domains (RBDs) of the splicing factors. The same splicing factors and controls as described in B were analyzed. (*) P = 0.012, Wilcoxon rank-sum test. (D) Average information content of sequence motifs of splicing factors. The same splicing factors and controls as described in B were analyzed. (*) P = 0.006, Wilcoxon rank-sum test. (E) Normalized information content of specific nucleotide positions in the sequence motifs of the 15 splicing factors in A (Supplemental Methods). Normalization was carried out against the average information content of all nucleotides within each motif. (Control) A random nucleotide in a sequence motif; (GMAS) the nucleotides disrupted by GMAS SNVs; (MAX) the strongest consensus positions of each motif; and (GMAS-GWAS) the nucleotides disrupted by GMAS SNVs that are in LD with GWAS SNPs. (*) P = 0.004, (**) P = 2.26 × 10⁻⁸, (***) P = 6.30 × 10⁻¹², Wilcoxon rank-sum test. (F, left) The sequence logo of SRSF1 binding motif generated from the PWM provided by Ray et al. (2013). The percentage of GMAS SNVs targeting specific nucleotide positions of the SRSF1 motif is shown as a bar plot above the sequence logo. (Middle, right) EMSA results of SRSF1 binding to predicted GMAS targets. Alternative alleles of the GMAS SNVs were synthesized, as labeled above the gel images. The sequences of the synthetic RNA fragments are shown below each gel image, where the SRSF1 sequence motif is highlighted in yellow and the two alleles of GMAS SNVs are written in red. The arrow indicates RNA–protein complex. Increasing concentrations of SRSF1 were used in different lanes of the gel image (from left to right: 0, 0.37, 0.75, 1.5, and 3.0 µM).
Alteration of splicing factor binding by GMAS SNVs
To better understand the relationship between GMAS SNVs and the predicted splicing factors, we next examined the general motif strength of splicing factors predicted to bind to GMAS SNVs. Intuitively, only splicing factors with strong consensus motifs can be readily disrupted by a single SNV in their binding sites. Other splicing factors with highly degenerate motifs should be relatively resistant to perturbations by SNVs. We observed that consistent with this expectation, the average information content of the 15 splicing factors predicted to target five or more GMAS SNVs is significantly higher than that of the control splicing factors (all known splicing factors that are not predicted to regulate GMAS exons) (Fig. 5D).
We next examined the individual nucleotides corresponding to GMAS SNVs within the binding motif of each splicing factor. We observed that consistent with the expectation that these SNVs should disrupt motif positions with strong consensus, the information content of the SNV-overlapping nucleotides is generally higher than that of random nucleotides within the motif of the same splicing factor (Fig. 5E). Intriguingly, the SNV-overlapping nucleotides had lower information content than those with the maximum information content of each motif, suggesting that the GMAS SNV does not generally target the strongest consensus position. This observation may have important evolutionary implications (see Discussion).
Allele-specific binding of SRSF1 in enabling GMAS regulation
We next focused on GMAS regulation by the protein SRSF1, the splicing factor with the largest number of GMAS targets predicted by motif analysis (Fig. 5A). To further confirm the predicted GMAS exons as SRSF1 targets, we analyzed the recent ENCODE RNA-seq data sets of SRSF1 knockdown (and controls) and eCLIP-seq data of this protein (in HepG2 and K562 cells) (Supplemental Methods). The majority (70%) of predicted SRSF1-targeted GMAS exons showed a change of exon inclusion level of at least 10% upon knockdown of SRSF1, and many (67%) had at least one eCLIP-seq peak within the exon or <200 bp in the vicinity in at least one cell line (Supplemental Table 4). Thus, a large fraction of the predicted SRSF1 GMAS targets are confirmed endogenously. Those that did not show splicing changes upon SRSF1 knockdown could be under complex regulation where other splicing factors may compensate for the loss of SRSF1. The regulatory impact of SRSF1 on splicing is known to be complex depending on its interaction with other splicing factors (Pandit et al. 2013; Anczuków et al. 2015), which may also explain the opposite direction of splicing changes for many exons between HepG2 and K562 cells (Supplemental Table 4).
To provide direct experimental support that GMAS SNVs alter the binding of SRSF1 to RNA, we carried out electrophoretic mobility shift assays (EMSA, or gel shift) on a panel of randomly selected GMAS targets of SRSF1. In addition to the wild-type protein, we also cloned and expressed an RNA binding mutant of SRSF1 (FF-DD mutant) that was shown to have significantly reduced RNA binding capacity (Supplemental Fig. 7; Supplemental Table 5; Cho et al. 2011). Among all predicted SRSF1-bound GMAS SNVs, the majority overlap with the fifth position in the consensus motif, with the second most often targeted position being the second position that has the strongest consensus (Fig. 5F). Thus, we tested three GMAS SNVs targeting the fifth position and one GMAS SNV targeting the second position.
As shown in Figure 5F, the binding of SRSF1 to target RNAs was stronger with increasing protein input. The RNA–protein interaction was very weak or abolished when the FF-DD mutant of SRSF1 was used (Supplemental Fig. 7). Thus, these observations confirm a direct binding of SRSF1 to the target RNAs. To confirm that GMAS SNVs alter the binding of SRSF1, two versions of each target RNA were synthesized harboring the alternative alleles of the SNV. Strong signals of differential binding to the alternative alleles of GMAS SNVs were observed for three of the four RNA targets (RMND5B, TACC2, PIK3C3), with stronger binding to the allele dominant in the consensus motif (Fig. 5F). The fourth target, HSPD1, demonstrated a small degree of allelic difference (with the G allele having slightly stronger signal than the A allele at high SRSF1 concentrations of 1.5 and 3.0 µM), possibly due to the fact that this SRSF1 binding site is overall relatively weak.
Importantly, SRSF1 demonstrated global allele-specific binding to heterozygous SNPs based on the eCLIP-seq data. In the eCLIP reads, almost all observed heterozygous SNPs (covered by 20 or more reads) had significant allelic bias (Supplemental Table 6; Supplemental Methods). Among GMAS exons predicted as regulated by SRSF1, many did not have heterozygous SNPs in the HepG2 or K562 cells or adequate read coverage overlapping the heterozygous SNPs. However, one exon had a heterozygous SNP with a read coverage greater than 20 in the HepG2 eCLIP data. This SNP had a significant allelic bias (G>A, P < 0.001), confirming our prediction. These results provide strong evidence that SRSF1 is an important regulator of GMAS through allele-specific binding.
Functional analyses of GMAS genes and exons
To gain a better understanding of the functional relevance of GMAS, we first conducted gene ontology (GO) analysis of the related genes. By using a previously published method (Lee et al. 2011), we observed 15 enriched GO terms among the GMAS genes (Fig. 6A; Supplemental Table 7). Interestingly, a few mitochondria-relevant GO terms were observed, for example, respiratory chain complex IV assembly, mitochondrial inner membrane, and mitochondrial transport. Two major mitochondria-related gene families, cytochrome c oxidases (COX) and mitochondrial transporter family SLC25, host GMAS exons accounting for these GO categories. Both families of proteins have critical functions related to mitochondrial diseases (Zee and Glerum 2006) and metabolic processes (Gutiérrez-Aguilar and Baines 2013).
For coding GMAS exons, we further examined whether they are located in disordered protein regions (Supplemental Methods). These regions, defined as those that lack a stable protein structure in solution, are known to play important roles in protein–protein interactions and cellular signaling (Fu and Ares 2014). Our analysis showed more significant enrichment of GMAS exons in disordered regions than corresponding controls (AS exons picked randomly that match the exon length and GC content of GMAS exons) (Fig. 6B). Thus, GMAS exons display features of functionally important exons.
Next, we examined the protein domains encoded (possibly partly) by GMAS exons (Supplemental Methods). Many domains were identified in this analysis (Supplemental Table 8), suggesting that GMAS exons may have diversified functional impacts. Notably, three domains were significantly enriched among GMAS exons compared with controls (AS exons picked randomly that match the exon length and GC content of GMAS exons; Bonferroni-corrected P ≤ 0.05 and present in two or more distinct exons) (Supplemental Table 8). The mitochondrial carrier protein domain was encoded partly by GMAS exons in the SLC25 gene family (SLC25A26 and SLC25A28), again attesting to the association of GMAS with mitochondrial function. Another significant protein domain is the folate carrier domain encoded by SLC19A1. We identified three SNPs associated with three different GMAS exons in SLC19A1, all of which overlap with the folate carrier domain in the gene. The other GMAS exon-encoded domain, Mib-Herc2 domain, has a critical role in the activation of the Notch signaling pathway (Itoh et al. 2003). In the above examples, the same type of protein domain (in the same gene or different genes) was repeatedly observed to be associated with distinct GMAS SNVs, suggesting possible existence of selection pressure for genetic modulation of their splicing.
More than 100 GMAS SNVs are in LD with GWAS SNPs
GWAS analyses have identified thousands of genetic loci that are associated with a diverse set of diseases or phenotypic traits (Welter et al. 2014). However, it has been a major challenge to elucidate the molecular function of the vast majority of GWAS hits that may not affect protein-coding sequences. The large catalog of GMAS SNVs allowed us to examine whether a GWAS SNP may be associated with splicing alteration. We observed that 116 (18%) GMAS SNVs are in LD with GWAS SNPs (and within 200 kb in distance) (Supplemental Table 9) and are associated with a total of 110 distinct GMAS exons. For convenience, we refer to these GMAS SNVs as GMAS-GWAS SNVs henceforth.
Next, we analyzed the motif strength of nucleotides overlapping the GMAS-GWAS SNVs based on predicted splicing factor binding similarly as described above. As shown in Figure 5E, the information content of these nucleotides is at a similar level as maximum individual-nucleotide information content within the corresponding motifs. This observation is in stark contrast to that of overall GMAS SNVs, whose information content was lower than the maximum values of their respective motifs, although higher than those of random nucleotides within the motifs (Fig. 5E). Because GMAS-GWAS SNVs are associated with phenotypic traits or diseases, they represent the subset of GMAS SNVs that may have direct functional/biological implications. Therefore, the observed higher information content associated with GMAS-GWAS SNVs is consistent with the functional impact of these SNVs, which likely represent strong perturbations to splicing factor binding.
Since most GWAS observations are not supported by molecular mechanisms, splicing-altering GMAS SNVs help to shed light on the potential functional mechanisms underlying many GWAS observations. Figure 6C demonstrates an analysis of GWAS SNPs that are in LD with (and within 200 kb in distance) GMAS SNVs. About two-thirds of these GWAS SNPs are located in or are close to the same genes as GMAS SNVs in LD. Overall, the vast majority (71%) of GWAS SNPs in Figure 6C are in introns, whose functional relevance was previously elusive but may now be explained by the splicing-altering GMAS SNVs. In addition, a small fraction (15%) of these GWAS SNPs reside in coding regions, some of which were annotated as synonymous SNPs in the GWAS catalog. Thus, these seemingly nonfunctional synonymous SNPs could indeed cause splicing alteration. Only ∼8% of the GWAS SNPs were predicted to cause missense changes. Among the 90 coding GMAS-GWAS exons, 40 were in-frame with a length dividable by three (none harboring stop codons). Many of the 90 coding exons overlap known protein domains (Supplemental Table 9). Taken together, the GMAS results suggest that alteration of splicing may be part of the molecular basis of many GWAS observations.
Finally, we asked whether certain diseases or traits were enriched with GMAS-GWAS SNVs. For a number of GWAS traits, such as metabolic traits, cardiovascular disease risk factors, and attention deficit hyperactivity disorder (ADHD), multiple GMAS SNVs were observed in the associations, significantly more often than expected by chance (Supplemental Table 10; Supplemental Methods). The association of multiple GMAS genes with the same trait strongly indicates that splicing alterations are part of the functional pathways linked to the trait. Supplemental Figure 8 lists a few example genes with important biological functions that harbor GMAS events that were supported either by previous literature (low-density lipoprotein receptor [LDLR]) or by our experimental validations.
Discussion
We report a comprehensive study of alternative splicing events regulated by genetic variants. By using ENCODE RNA-seq data sets with high sequencing depth and cellular compartment–specific features, we identified a large number of GMAS exons that showed allele-specific splicing patterns. Expression analysis of SNVs in the allele-specific manner can effectively capture cis-acting regulatory variants since the relative expression of the alternative alleles of a heterozygous SNV is measured in the same cellular context, eliminating trans-acting or environmental influences on gene expression. Previous allele-specific splicing studies were mainly restricted to exonic SNVs since mature mRNAs without introns were normally interrogated in RNA-seq. Our iGMAS method fills in this gap by comparatively analyzing nuclear and cytosolic RNA contents to examine intronic SNVs and their allele-specific association with exon expression.
Our study identified more than 600 alternative splicing events that are likely regulated by genetic variants, which facilitated the first global study of genomic, evolutionary, and regulatory characteristics of GMAS events. One interesting observation is that the impact of genetic variants on splicing is largely cell type independent (Fig. 3), suggesting that cis-regulatory elements are the primary determinants of the splicing phenotype in GMAS exons. This result is in line with a previous study that reported that species-specific alternative splicing is primarily driven by cis-regulatory elements (Barbosa-Morais et al. 2012). Our observation has the important implication that splicing-altering mutations are likely effective in multiple cell types or tissues. Thus, their functional impacts could be widespread or largely ubiquitous across tissues.
We observed that GMAS exons are under selection for accelerated sequence evolution in primate genomes (Fig. 4). This finding is in line with a previous study reporting that primates demonstrated a faster accumulation of alternative exons compared with other mammalian lineages (Merkin et al. 2012). Lower levels of sequence conservation were often interpreted as reduced functional significance of the relevant genomic regions. However, the lower conservation of GMAS sequences is not likely the result of neutral or random mutations. Instead, evolutionary selection exists as reflected by the enrichment of positively selected GMAS genes and accelerated evolution of GMAS exons and SNVs (Fig. 4). Accelerated evolution may have profound functional relevance. For example, it is now well known that positive selection affects many genes of human and other primates, possibly to define species-specific phenotypes or to enable biological adaptation to environments. Positively selected genes in human play important roles in many aspects of biology, such as brain development and function, cognition, behavior, vocalization, reproduction, dietary adaptation, metabolism, physical appearance, and host–pathogen interactions (Nielsen et al. 2007). The fact that GMAS-related genes, and AS genes in general, demonstrated strong enrichment of positive selection pressure (Fig. 4C) indicates that alternative splicing may be a mechanism to introduce adaptive changes to gene expression during primate evolution.
It is important to note that positive or balancing selection is arising as an evolutionary signature of many mutations contributing to complex diseases. The accelerated evolution is often driven by selection for certain beneficial traits associated with the mutations, although these mutations may cause other diseases (Nielsen et al. 2007). A well-known example is the sickle cell mutation in the hemoglobin beta (HBB) gene that is positively selected due to its properties rendering malaria resistance despite its role in causing sickle cell disease (Currat et al. 2002). Thus, it is possible that disease-related splicing variations are under positive selection due to functional advantages associated with these variations for certain biological processes, a hypothesis that needs further investigation.
Another aspect of our study revealed that the molecular mechanisms of many GMAS SNVs likely lie in their disruption of splicing factor binding (Fig. 5). It is interesting to note that GMAS-associated splicing factors are often more conserved than expected, in contrast to the accelerated evolution of GMAS exons or SNV-flanking sequences. This observation again suggests that alterations in cis-elements, rather than trans-factors, are the main driving forces of splicing evolution. The evolutionary cost of a mutation in a cis-regulatory motif is much smaller than that in a trans-factor, since the latter may impact hundreds to thousands of splicing events. Thus, cis-element-driven splicing evolution is cost-effective.
An important observation is that GMAS SNVs often disrupt motif positions that had stronger consensus nucleotides than expected by chance. However, they do not generally correspond to the strongest consensus nucleotide of the respective motifs. In contrast, the subset of GMAS SNVs that presumably has close biological relevance (i.e., those in LD with GWAS SNPs) often overlaps with the strongest consensus nucleotides. These results indicate that, in general, GMAS SNVs can alter splicing factor binding, but many of them may only cause moderate splicing changes. Moderate tuning of splicing serves as a mechanism to introduce novel gene expression products for evolutionary selection without severely affecting biological or functional pathways. During evolution, new SNVs may occur at the strongest consensus nucleotide of a splicing factor binding site, which may be selected against due to strong adverse effects. However, some of these SNVs may survive evolutionary selection (such as the GMAS-GWAS SNVs) as a result of, for example, advantageous function or adaptive response to environment changes.
Methods
RNA-seq data and mapping
Paired-end RNA-seq data (2 × 76 nt) from seven human cell lines (GM12878, K562, HeLa, HepG2, HUVEC, NHEK, and H1-hESC) were downloaded from the ENCODE data repository (www.encodeproject.org) under the ENCODE Data Coordination Center accession number ENCSR037HRJ (The ENCODE Project Consortium 2012) or NCBI GEO accession number GSE30567, where two biological replicates are available for all cell lines except H1-hESC. The reads were mapped using a stringent mapping method described in our previous work (Bahn et al. 2012). Further details of read mapping are given in Supplemental Methods. RNA-seq data following shRNA knockdown of SRSF1, nonspecific target controls, eCLIP-seq data of SRSF1, and mock input controls in K562 and HepG2 cells were downloaded from the ENCODE portal (http://www.encodeproject.org) (accession numbers: ENCSR066VOO, ENCSR094KBY, ENCSR603TCV, ENCSR129RWD, ENCSR432XUP, ENCSR989VIY, ENCSR925TYQ, ENCSR499ZCU).
Prediction of iGMAS events
The goal of the iGMAS analysis is to capture intronic SNVs associated with allele-specific splicing. To this end, we used the RNA-seq data of nuclear RNA without polyA tails (NA−) to capitalize on the enrichment of intronic RNA in these data sets. Specifically, we aim to determine whether the alternative alleles of an intronic SNV are present in a biased manner in the spliced-out products. Spliced-out products considered here only include those that contain an alternatively skipped exon and its flanking introns, where the intronic SNV could reside in either intron. Thus, our analysis is limited to alternative exon skipping, the most prevalent type of alternative splicing.
To achieve the above goal, we focused on read pairs where one read was mapped to either flanking intron with the other read mapped to the exon or where the two reads were mapped to the two flanking introns, respectively (Fig. 1C). In addition, at least one intronic read must harbor an SNV. Thus, these read pairs (referred to as “linked reads” below) likely originated from the spliced-out products that contain skipped exons. Alternatively, these reads could have come from the nascent unspliced RNA that is also present in the NA− data. In this scenario, intronic SNVs may have imbalanced allelic expression if the nascent RNA is transcribed in an allele-specific manner, which leads to ASE of the entire gene. Since our goal is to enrich for reads that represent spliced-out products, we applied two exclusion filters to remove reads that may have arisen from ASE of the gene. First, we identified genes that showed significant ASE patterns on the whole-gene level using our previous method and CA+ RNA-seq data (Li et al. 2012). Reads mapped to these genes were excluded from further analysis. Second, we estimated the gene-level allelic expression ratio (rest) for each gene that had multiple SNVs using CA+ data as follows:
where Nref and Nvar represent the read counts for the reference or variant allele of a SNV, respectively, assuming there are n SNVs in a gene. Variables a and b are priors that were set to be one since the reference and variant alleles were known in our problem. Since the haplotypes of SNVs are unknown, this estimated allelic ratio is not always accurate but can only serve as an exclusion filter. We removed reads mapped to genes with an estimated allelic ratio outside the range of (0.4, 0.6), which indicates possible allelic bias on the gene level.
For all candidate intronic SNVs that passed the above exclusion filters, we next determined whether they demonstrate significant allelic bias deviating from the expected allelic ratio of 0.5, with allelic ratio calculated as Nref/(Nref + Nvar). In these calculations, only the linked reads (as defined above) were used. A two-sided binomial test P-value was calculated as follows:
where p = 0.5 in this case; N = Nref + Nvar.
To achieve adequate statistical power, we required that the number of linked reads for each intronic SNV (after combining biological replicates of RNA-seq data) was at least 19 according to the power estimation conducted in our previous work (Li et al. 2012). We required the binomial P-value to be less than 0.01 to call significant allelic bias. Finally, to enhance stringency, we required that the deviation of the allelic ratio, Nref/(Nref + Nvar), from 0.5 was at least 0.2. Intronic SNVs that satisfied all the above requirements were categorized as iGMAS SNVs.
To estimate the FDR of the iGMAS method, we randomly distributed reads covering intronic SNVs to their alternative alleles, maintaining the total number of reads for each SNV. This randomization was carried out assuming an expected allelic ratio of 0.5. This procedure controls for the read coverage of each gene and SNV and maintains the read distribution in alternative and constitutively processed regions. The same iGMAS identification framework as described above was applied to the randomized data and an FDR was estimated.
Splicing reporter assays
Minigenes containing iGMAS exons and flanking introns were constructed, each harboring one alternative allele of the targeted SNV. Further details of the splicing assay are described in Supplemental Methods.
Supplementary Material
Acknowledgments
We thank the anonymous reviewers for insightful comments. We thank members of the Xiao laboratory for helpful discussions and comments on this work. We thank the ENCODE Project Consortium for generating valuable data sets. Specifically, we thank Brenton Graveley's group for generating the SRSF1 knockdown RNA-seq data, Gene Yeo's group for SRSF1 eCLIP-seq data, and Thomas Gingeras' group for cell fractionation RNA-seq data. This work was supported in part by grants from the National Human Genome Research Institute of the National Institutes of Health (R01HG006264, U01HG007013, and U01HG007912), National Science Foundation (1262134), Alfred P. Sloan Foundation, and the University of California Cancer Research Coordinating Committee to X.X.
Footnotes
[Supplemental material is available for this article.]
Article published online before print. Article, supplemental material, and publication date are at http://www.genome.org/cgi/doi/10.1101/gr.193359.115.
References
- The 1000 Genomes Project Consortium. 2012. An integrated map of genetic variation from 1,092 human genomes. Nature 491: 56–65. [DOI] [PMC free article] [PubMed] [Google Scholar]
- Anczuków O, Akerman M, Cléry A, Wu J, Shen C, Shirole NH, Raimer A, Sun S, Jensen MA, Hua Y, et al. 2015. SRSF1-regulated alternative splicing in breast cancer. Mol Cell 60: 105–117. [DOI] [PMC free article] [PubMed] [Google Scholar]
- Bahn JH, Lee J-H, Li G, Greer C, Peng G, Xiao X. 2012. Accurate identification of A-to-I RNA editing in human by transcriptome sequencing. Genome Res 22: 142–150. [DOI] [PMC free article] [PubMed] [Google Scholar]
- Barash Y, Calarco JA, Gao W, Pan Q, Wang X, Shai O, Blencowe BJ, Frey BJ. 2010. Deciphering the splicing code. Nature 465: 53–59. [DOI] [PubMed] [Google Scholar]
- Barbosa-Morais NL, Irimia M, Pan Q, Xiong HY, Gueroussov S, Lee LJ, Slobodeniuc V, Kutter C, Watt S, Colak R, et al. 2012. The evolutionary landscape of alternative splicing in vertebrate species. Science 338: 1587–1593. [DOI] [PubMed] [Google Scholar]
- Busch A, Hertel KJ. 2015. Splicing predictions reliably classify different types of alternative splicing. RNA 21: 813–823. [DOI] [PMC free article] [PubMed] [Google Scholar]
- Cho S, Hoang A, Sinha R, Zhong X-Y, Fu X-D, Krainer AR, Ghosh G. 2011. Interaction between the RNA binding domains of Ser-Arg splicing factor 1 and U1-70K snRNP protein determines early spliceosome assembly. Proc Natl Acad Sci 108: 8233–8238. [DOI] [PMC free article] [PubMed] [Google Scholar]
- Cook KB, Kazan H, Zuberi K, Morris Q, Hughes TR. 2011. RBPDB: a database of RNA-binding specificities. Nucleic Acids Res 39: D301–D308. [DOI] [PMC free article] [PubMed] [Google Scholar]
- Currat M, Trabuchet G, Rees D, Perrin P, Harding RM, Clegg JB, Langaney A, Excoffier L. 2002. Molecular analysis of the β-globin gene cluster in the Niokholo Mandenka population reveals a recent origin of the βS Senegal mutation. Am J Hum Genet 70: 207–223. [DOI] [PMC free article] [PubMed] [Google Scholar]
- Djebali S, Davis CA, Merkel A, Dobin A, Lassmann T, Mortazavi A, Tanzer A, Lagarde J, Lin W, Schlesinger F, et al. 2012. Landscape of transcription in human cells. Nature 489: 101–108. [DOI] [PMC free article] [PubMed] [Google Scholar]
- The ENCODE Project Consortium. 2012. An integrated encyclopedia of DNA elements in the human genome. Nature 489: 57–74. [DOI] [PMC free article] [PubMed] [Google Scholar]
- Evangelou E, Ioannidis JPA. 2013. Meta-analysis methods for genome-wide association studies and beyond. Nat Rev Genet 14: 379–389. [DOI] [PubMed] [Google Scholar]
- Fu X-D, Ares M. 2014. Context-dependent control of alternative splicing by RNA-binding proteins. Nat Rev Genet 15: 689–701. [DOI] [PMC free article] [PubMed] [Google Scholar]
- Gutiérrez-Aguilar M, Baines CP. 2013. Physiological and pathological roles of mitochondrial SLC25 carriers. Biochem J 454: 371–386. [DOI] [PMC free article] [PubMed] [Google Scholar]
- Han H, Irimia M, Ross PJ, Sung H-K, Alipanahi B, David L, Golipour A, Gabut M, Michael IP, Nachman EN, et al. 2013. MBNL proteins repress ES-cell-specific alternative splicing and reprogramming. Nature 498: 241–245. [DOI] [PMC free article] [PubMed] [Google Scholar]
- Itoh M, Kim C-H, Palardy G, Oda T, Jiang Y-J, Maust D, Yeo S-Y, Lorick K, Wright GJ, Ariza-McNaughton L, et al. 2003. Mind bomb is a ubiquitin ligase that is essential for efficient activation of Notch signaling by Delta. Dev Cell 4: 67–82. [DOI] [PubMed] [Google Scholar]
- Keinan A, Clark AG. 2012. Recent explosive human population growth has resulted in an excess of rare genetic variants. Science 336: 740–743. [DOI] [PMC free article] [PubMed] [Google Scholar]
- Kwan T, Benovoy D, Dias C, Gurd S, Provencher C, Beaulieu P, Hudson TJ, Sladek R, Majewski J. 2008. Genome-wide analysis of transcript isoform variation in humans. Nat Genet 40: 225–231. [DOI] [PubMed] [Google Scholar]
- Lappalainen T, Sammeth M, Friedländer MR, ’t Hoen PAC, Monlong J, Rivas MA, Gonzàlez-Porta M, Kurbatova N, Griebel T, Ferreira PG, et al. 2013. Transcriptome and genome sequencing uncovers functional variation in humans. Nature 501: 506–511. [DOI] [PMC free article] [PubMed] [Google Scholar]
- Lee J-H, Gao C, Peng G, Greer C, Ren S, Wang Y, Xiao X. 2011. Analysis of transcriptome complexity through RNA sequencing in normal and failing murine hearts. Circ Res 109: 1332–1341. [DOI] [PMC free article] [PubMed] [Google Scholar]
- Li G, Bahn JH, Lee J-H, Peng G, Chen Z, Nelson SF, Xiao X. 2012. Identification of allele-specific alternative mRNA processing via transcriptome sequencing. Nucleic Acids Res 40: e104. [DOI] [PMC free article] [PubMed] [Google Scholar]
- Li MJ, Yan B, Sham PC, Wang J. 2015. Exploring the function of genetic variants in the non-coding genomic regions: approaches for identifying human regulatory variants affecting gene expression. Brief Bioinform 16: 393–412. [DOI] [PubMed] [Google Scholar]
- Merkin J, Russell C, Chen P, Burge CB. 2012. Evolutionary dynamics of gene and isoform regulation in Mammalian tissues. Science 338: 1593–1599. [DOI] [PMC free article] [PubMed] [Google Scholar]
- Monlong J, Calvo M, Ferreira PG, Guigó R. 2014. Identification of genetic variants associated with alternative splicing using sQTLseekeR. Nat Commun 5: 4698. [DOI] [PMC free article] [PubMed] [Google Scholar]
- Moretti S, Laurenczy B, Gharib WH, Castella B, Kuzniar A, Schabauer H, Studer RA, Valle M, Salamin N, Stockinger H, et al. 2014. Selectome update: quality control and computational improvements to a database of positive selection. Nucleic Acids Res 42: D917–D921. [DOI] [PMC free article] [PubMed] [Google Scholar]
- Mort M, Sterne-Weiler T, Li B, Ball EV, Cooper DN, Radivojac P, Sanford JR, Mooney SD. 2014. MutPred Splice: machine learning-based prediction of exonic variants that disrupt splicing. Genome Biol 15: R19. [DOI] [PMC free article] [PubMed] [Google Scholar]
- Nelson MR, Wegmann D, Ehm MG, Kessner D, St Jean P, Verzilli C, Shen J, Tang Z, Bacanu S-A, Fraser D, et al. 2012. An abundance of rare functional variants in 202 drug target genes sequenced in 14,002 people. Science 337: 100–104. [DOI] [PMC free article] [PubMed] [Google Scholar]
- Nielsen R, Hellmann I, Hubisz M, Bustamante C, Clark AG. 2007. Recent and ongoing selection in the human genome. Nat Rev Genet 8: 857–868. [DOI] [PMC free article] [PubMed] [Google Scholar]
- Pandit S, Zhou Y, Shiue L, Coutinho-Mansfield G, Li H, Qiu J, Huang J, Yeo GW, Ares M, Fu X-D. 2013. Genome-wide analysis reveals SR protein cooperation and competition in regulated splicing. Mol Cell 50: 223–235. [DOI] [PMC free article] [PubMed] [Google Scholar]
- Ray D, Kazan H, Cook KB, Weirauch MT, Najafabadi HS, Li X, Gueroussov S, Albu M, Zheng H, Yang A, et al. 2013. A compendium of RNA-binding motifs for decoding gene regulation. Nature 499: 172–177. [DOI] [PMC free article] [PubMed] [Google Scholar]
- Siepel A, Bejerano G, Pedersen JS, Hinrichs AS, Hou M, Rosenbloom K, Clawson H, Spieth J, Hillier LW, Richards S, et al. 2005. Evolutionarily conserved elements in vertebrate, insect, worm, and yeast genomes. Genome Res 15: 1034–1050. [DOI] [PMC free article] [PubMed] [Google Scholar]
- Sterne-Weiler T, Sanford JR. 2014. Exon identity crisis: disease-causing mutations that disrupt the splicing code. Genome Biol 15: 201. [DOI] [PMC free article] [PubMed] [Google Scholar]
- Sterne-Weiler T, Howard J, Mort M, Cooper DN, Sanford JR. 2011. Loss of exon identity is a common mechanism of human inherited disease. Genome Res 21: 1563–1571. [DOI] [PMC free article] [PubMed] [Google Scholar]
- ’t Hoen PAC, Friedländer MR, Almlöf J, Sammeth M, Pulyakhina I, Anvar SY, Laros JFJ, Buermans HPJ, Karlberg O, Brännvall M, et al. 2013. Reproducibility of high-throughput mRNA and small RNA sequencing across laboratories. Nat Biotechnol 31: 1015–1022. [DOI] [PubMed] [Google Scholar]
- Tajima F. 1989. Statistical method for testing the neutral mutation hypothesis by DNA polymorphism. Genetics 123: 585–595. [DOI] [PMC free article] [PubMed] [Google Scholar]
- Tennessen JA, Bigham AW, O'Connor TD, Fu W, Kenny EE, Gravel S, McGee S, Do R, Liu X, Jun G, et al. 2012. Evolution and functional impact of rare coding variation from deep sequencing of human exomes. Science 337: 64–69. [DOI] [PMC free article] [PubMed] [Google Scholar]
- Voight BF, Kudaravalli S, Wen X, Pritchard JK. 2006. A map of recent positive selection in the human genome. PLoS Biol 4: e72. [DOI] [PMC free article] [PubMed] [Google Scholar]
- Wang Z, Burge CB. 2008. Splicing regulation: from a parts list of regulatory elements to an integrated splicing code. RNA 14: 802–813. [DOI] [PMC free article] [PubMed] [Google Scholar]
- Wang G-S, Cooper TA. 2007. Splicing in disease: disruption of the splicing code and the decoding machinery. Nat Rev Genet 8: 749–761. [DOI] [PubMed] [Google Scholar]
- Weir BS, Cockerham CC. 1984. Estimating F-statistics for the analysis of population structure. Evolution 38: 1358–1370. [DOI] [PubMed] [Google Scholar]
- Welter D, MacArthur J, Morales J, Burdett T, Hall P, Junkins H, Klemm A, Flicek P, Manolio T, Hindorff L, et al. 2014. The NHGRI GWAS Catalog, a curated resource of SNP-trait associations. Nucleic Acids Res 42: D1001–D1006. [DOI] [PMC free article] [PubMed] [Google Scholar]
- Xiao X, Lee J-H. 2010. Systems analysis of alternative splicing and its regulation. Wiley Interdiscip Rev Syst Biol Med 2: 550–565. [DOI] [PubMed] [Google Scholar]
- Xiao X, Wang Z, Jang M, Nutiu R, Wang ET, Burge CB. 2009. Splice site strength–dependent activity and genetic buffering by poly-G runs. Nat Struct Mol Biol 16: 1094–1100. [DOI] [PMC free article] [PubMed] [Google Scholar]
- Xiong HY, Alipanahi B, Lee LJ, Bretschneider H, Merico D, Yuen RKC, Hua Y, Gueroussov S, Najafabadi HS, Hughes TR, et al. 2014. The human splicing code reveals new insights into the genetic determinants of disease. Science 347: 1254806. [DOI] [PMC free article] [PubMed] [Google Scholar]
- Zee JM, Glerum DM. 2006. Defects in cytochrome oxidase assembly in humans: lessons from yeast. Biochem Cell Biol 84: 859–869. [DOI] [PubMed] [Google Scholar]
- Zhao K, Lu Z-X, Park JW, Zhou Q, Xing Y. 2013. GLiMMPS: robust statistical model for regulatory variation of alternative splicing using RNA-seq data. Genome Biol 14: R74. [DOI] [PMC free article] [PubMed] [Google Scholar]
Associated Data
This section collects any data citations, data availability statements, or supplementary materials included in this article.