Summary
Development of life-threatening cancer metastases at distant organs requires disseminated tumor cells’ adaptation to and co-evolution with the drastically different microenvironments of metastatic sites1. Cancer cells of common origin manifest distinct gene expression patterns after metastasizing to different organs2. Clearly, the dynamic interplay between metastatic tumor cells and extrinsic signals at individual metastatic organ sites critically impacts the subsequent metastatic outgrowth3,4. Yet, it is unclear when and how disseminated tumor cells acquire the essential traits from the microenvironment of metastatic organs that prime their subsequent outgrowth. Here we show that primary tumor cells with normal expression of PTEN, an important tumor suppressor, lose PTEN expression after dissemination to the brain, but not to other organs. PTEN level in PTEN-loss brain metastatic tumor cells is restored after leaving brain microenvironment. This brain microenvironment-dependent, reversible PTEN mRNA and protein down-regulation is epigenetically regulated by microRNAs (miRNAs) from astrocytes. Mechanistically, astrocyte-derived exosomes mediate an intercellular transfer of PTEN-targeting miRNAs to metastatic tumor cells, while astrocyte-specific depletion of PTEN-targeting miRNAs or blockade of astrocyte exosome secretion rescues the PTEN loss and suppresses brain metastasis in vivo. Furthermore, this adaptive PTEN loss in brain metastatic tumor cells leads to an increased secretion of cytokine chemokine (C-C motif) ligand 2 (CCL2), which recruits Iba1+ myeloid cells that reciprocally enhance outgrowth of brain metastatic tumor cells via enhanced proliferation and reduced apoptosis. Our findings demonstrate a remarkable plasticity of PTEN expression in metastatic tumor cells in response to different organ microenvironments, underpinning an essential role of co-evolution between the metastatic cells and their microenvironment during the adaptive metastatic outgrowth. Our findings signify the dynamic and reciprocal cross-talk between tumor cells and the metastatic niche; importantly, they provide new opportunities for effective anti-metastasis therapies, especially of consequence for those brain metastasis patients who are in dire need.
Keywords: PTEN, metastatic tumor microenvironment, epigenetic regulation, microRNA, exosome
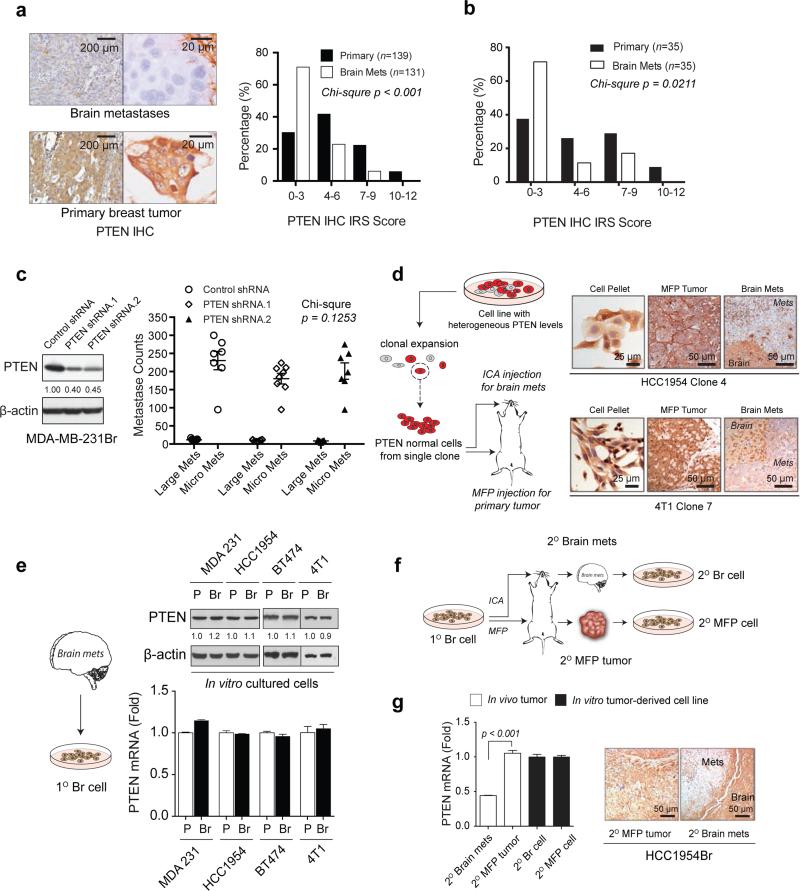
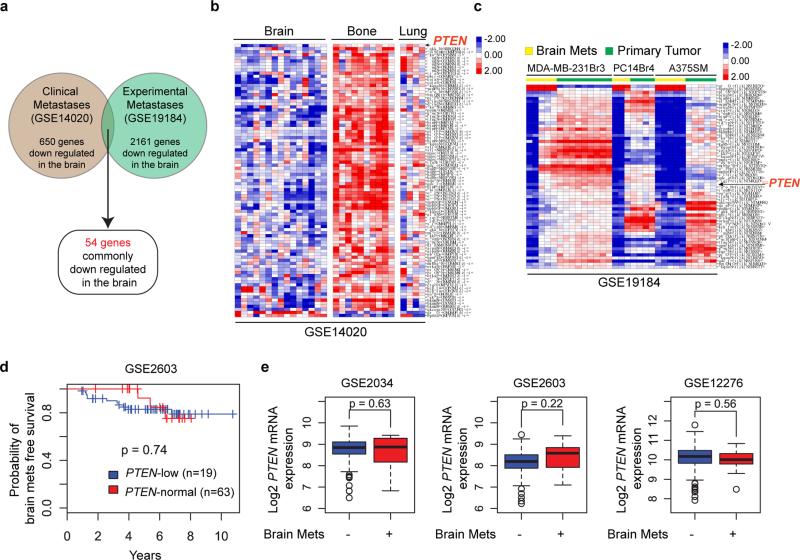
The remarkable phenotypic plasticity observed in metastasis is indicative of co-evolution occurring at specific metastatic organ microenvironments5,6. To obtain insights on how disseminated tumor cells acquire essential traits from metastatic microenvironments for successful outgrowth, we analyzed public gene expression profiles of clinical metastases from distinct organs as well as organ-specific metastases from mice injected with various cancer cells (Extended Data 1a-c). Intriguingly, PTEN mRNA was dramatically down-regulated in brain metastases compared to primary tumors or other organ metastases. Our immunohistochemistry (IHC) analyses of PTEN confirmed a significantly higher rate of PTEN loss (defined by IRS 0-3)7 in brain metastases (Mets., 71%) than in unmatched primary breast cancers (30%) (Fig. 1a). PTEN loss was also detected at a significantly higher frequency in brain metastases (71%) than matched primary breast cancers (37%) of an independent patient cohort (Fig.1b).
Figure 1. Brain microenvironment-dependent reversible PTEN down-regulation in brain metastases (Mets).
a, Representative IHC staining and histograms of PTEN protein levels in primary breast tumors and unmatched brain metastases (Chi-square test). b, Histograms of PTEN protein levels in primary breast tumors and matched brain metastases from 35 patients (Chi-square test). c, PTEN western blots (WB, left) and brain metastasis counts 30 days after intracarotid injection (right) of MDA-MB-231Br cells transfected with control or PTEN shRNAs. Large Mets: >50 μm in diameter (mean ± s.e.m., Chi-square test). d, PTEN IHC staining of tumors derived from clonally expanded of PTEN-normal sublines. ICA: intracarotid artery; MFP: mammary fat pad. e, WB and qRT-PCR of PTEN expression in the indicated parental (P) and brain-seeking (Br) cells under culture. f, Schematic of in vivo re-establishment of secondary brain metastasis, MFP tumor, and their derived cell lines. g, PTEN qRT-PCR (mean ± s.e.m., t-test) and IHC in HCC1954Br secondary tumors and cultured cells.
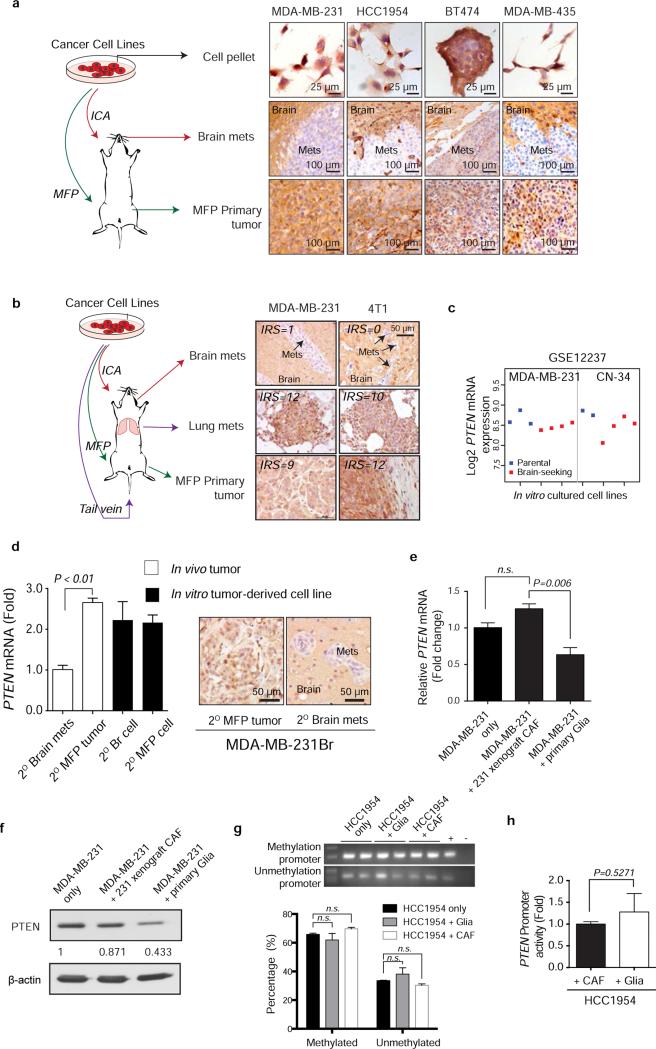
To test a possible role of PTEN loss in brain metastasis8,9, we intracarotidly injected PTEN knock-down tumor cells and assessed experimental brain metastasis; unexpectedly, neither incidence nor size of brain metastases was increased (Fig. 1c). Furthermore, patients with PTEN-normal or PTEN-loss primary tumors had comparable brain metastasis-free survival, and patients with or without brain metastases had similar PTEN levels in their primary tumors (Extended Data 1d-e). Thus, the observed PTEN loss in brain metastases was unlikely derived from PTEN-low primary tumors. To investigate whether PTEN loss in brain metastasis is a secondary non-genetic event imposed by the brain microenvironment, we injected five PTEN-normal breast cancer cell lines either into mammary fat pad (MFP) or intracarotidly to induce brain metastasis. Strikingly, the PTEN level was significantly decreased in brain metastases compared to the respective MFP tumors or lung metastases (Extended Data 2a-b). We repeated the injections with cells clonally expanded from single PTEN-normal tumor cells, and observed similar phenotypes (Fig. 1d), suggesting PTEN-loss brain metastases were not selected from pre-existing PTEN-low cells in primary tumors. Surprisingly, established sublines from PTEN-low brain metastases (1° Br cells) regained PTEN expression in culture comparable to parental cells (Fig. 1e). Analogously, two in vivo-selected brain-seeking sublines (Br cells) exhibited similar PTEN levels to their matched parental cells in vitro (Extended Data 2c). Re-injecting the cultured PTEN-normal 1° Br cells conferred a distinct PTEN loss in brain metastases (2° Brain Mets), but not in 2° MFP tumors, and PTEN levels in 2° Br cells were fully restored again in culture (Fig. 1f-g, Extended Data 2d), indicating a reversible non-genetic PTEN loss in the brain tumor microenvironment (TME).
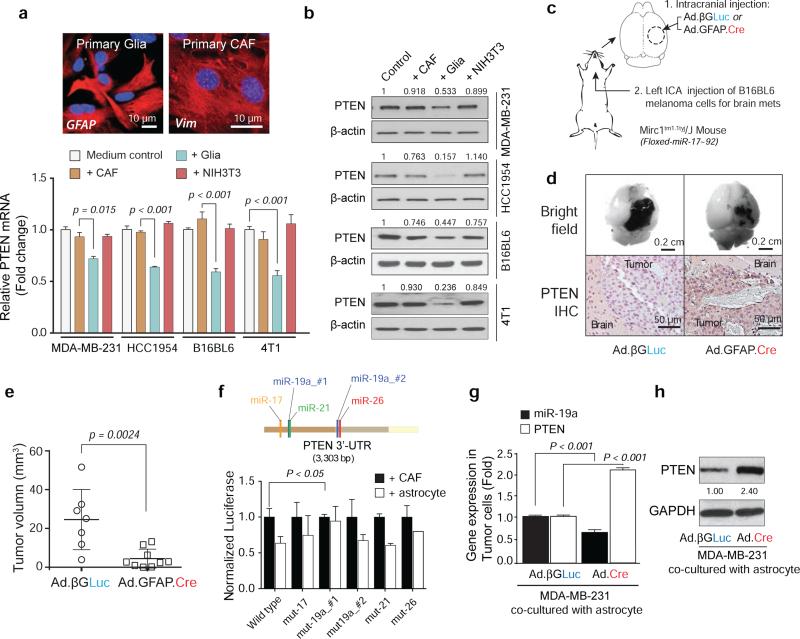
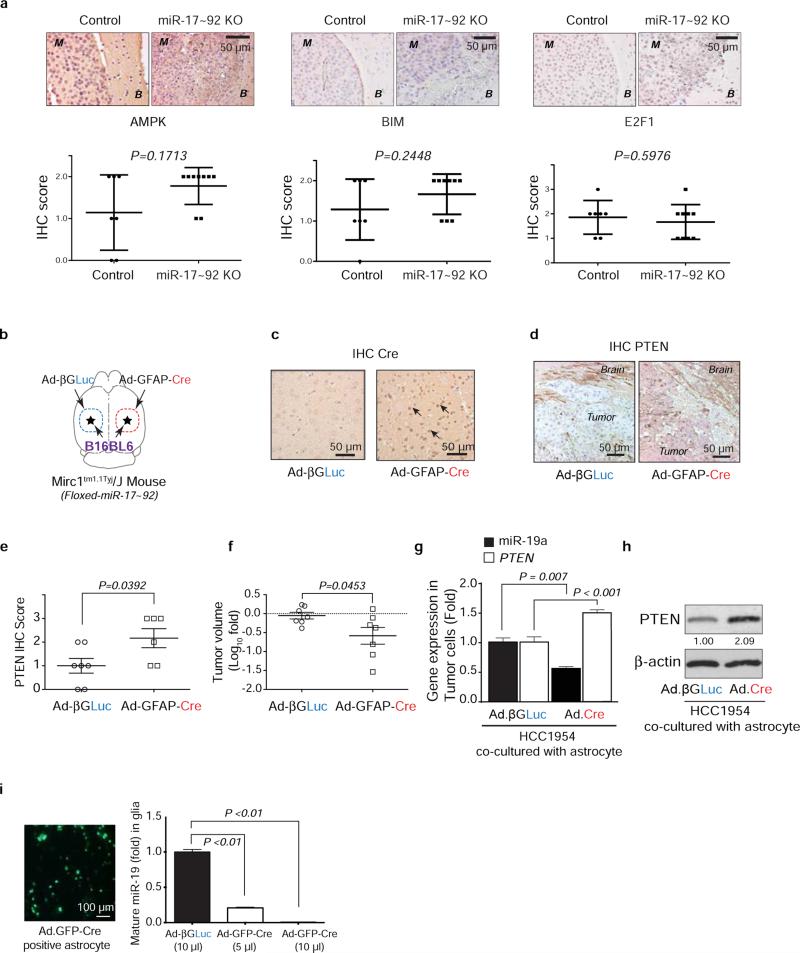
To explore how the brain TME regulates PTEN in metastatic cells10–12, we co-cultured tumor cells with primary glia (>90% astrocytes)13, cancer associated fibroblasts (CAFs), or NIH3T3 fibroblasts. Co-culture with glia led to a significant decrease of PTEN mRNA and protein (Fig. 2a-b and Extended Data 2e-f) in all tumor cells, but did not affect PTEN promoter methylation nor activity (Extended Data 2g-h). This prompted us to examine whether glia reduce PTEN mRNA stability through microRNAs (miRNAs). Five miRNAs (miR-17, miR-19a, miR-19b, miR-20a, and miR-92) in the miR-17-92 cluster were functionally demonstrated to target PTEN14–17, and Mirc1tm1.1Tyj/J mice have a floxed miR-17-92 allele18. We knocked out the miR-17-92 allele in situ in Mirc1tm1.1Tyj/J mice by intracranial injection of astrocyte-specific Cre adenovirus (Ad-GFAP-Cre), then intracarotidly injected syngeneic mouse melanoma B16BL6 cells to form brain metastases (Fig. 2c). Astrocyte-specific depletion of PTEN-targeting miRNAs blocked PTEN down-regulation in the brain metastasis tumor cells in vivo without significantly altering other potential miRNA targets (Extended Data 3a), and significantly suppressed brain metastasis growth compared to control group (Fig. 2d-e), indicating a tumor cell non-autonomous PTEN down-regulation by astrocyte-derived PTEN-targeting miRNAs. Astrocyte-specific depletion of PTEN-targeting miRNAs also suppressed intracranially injected tumor cell outgrowth (Extended Data 3b-f). To examine which PTEN-targeting miRNA mediates the PTEN loss, wild-type and miRNA binding site-mutant PTEN 3’-UTR-driven luciferase activities in tumor cells under astrocyte co-culture were assessed (Fig. 2f). Compared with CAF co-culture, astrocyte co-culture inhibited luciferase activity of wild-type PTEN 3’-UTR, which was rescued by miR-19a #1 binding site mutation, but not other mutations, indicating miR-19a's major role in astrocyte-mediated PTEN mRNA down-regulation in tumor cells. Additionally, PTEN mRNA (Fig. 2g and Extended Data 3g) and protein (Fig. 2h and Extended Data 3h) were not down-regulated in tumor cells co-cultured with primary astrocytes from Mirc1tm1.1Tyj/J mice with PTEN-targeting miRNAs depleted (Extended Data 3i).
Figure 2. Astrocyte-derived miRNAs silence PTEN in tumor cells.
a, PTEN mRNA in the indicated tumor cells after 2-5 days co-culture with GFAP-positive primary glia or vimentin (Vim)-positive primary cancer-associated fibroblasts (CAFs) or NIH3T3 fibroblasts (mean ± s.e.m., t-test). b, WB of PTEN protein under co-culture as in (a). c, Schematic of astrocyte-specific miR-17-92 deletion by GFAP-driven Cre adenovirus (Ad.GFAP-Cre) in Mirc1tm1.1Tyj/J mice. d, Representative image of tumor sizes and PTEN IHC of brain metastases. e, Quantification of brain metastases volume (mean ± s.d., t-test). f, PTEN 3’-UTR- luciferase activity after co-culture (mean ± s.e.m., t-test). g, qRT-PCR analyses of miR-19a and PTEN mRNA in MDA-MB-231 cells after 48 hour co-culture with primary astrocytes from Mirc1tm1.1Tyj/J mice pre-infected (48 hours) by adenovirus (Ad-βGLuc or Ad.GFP.Cre) (mean ± s.e.m., t-test). h, WB of PTEN protein in MDA-MB-231 cells co-cultured as in (g).
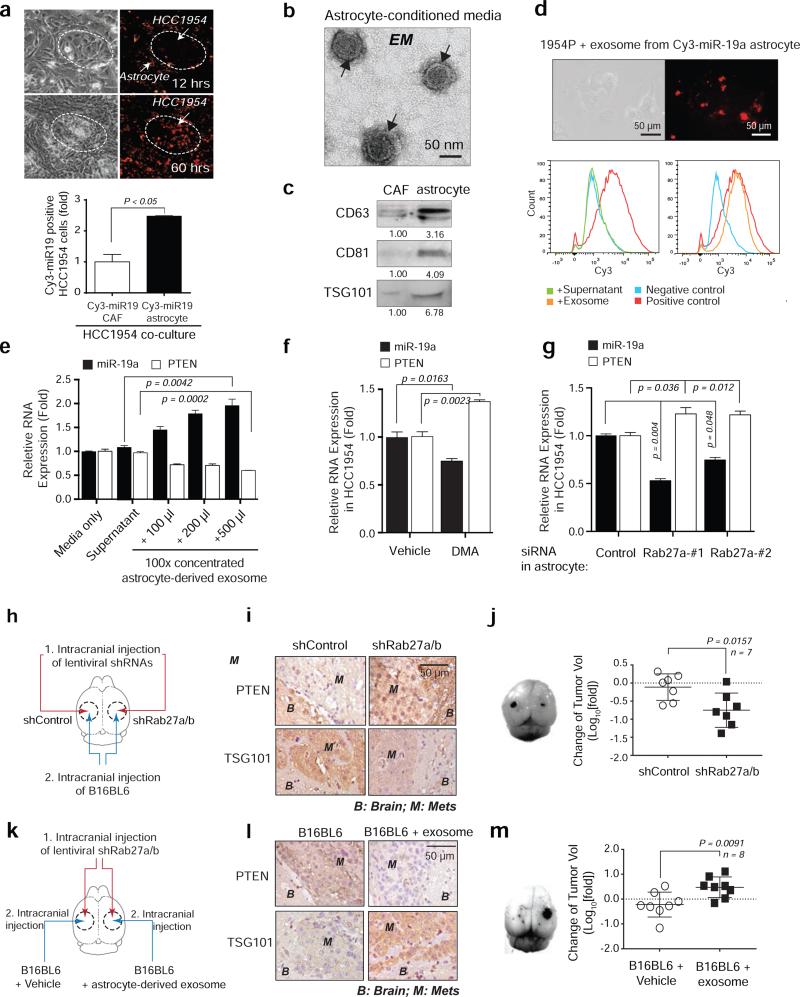
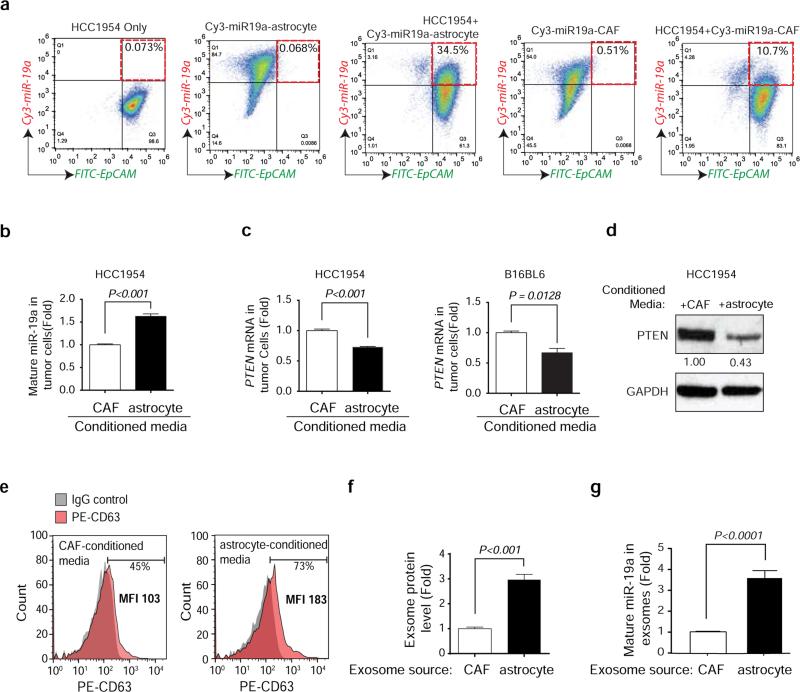
After co-cultured with Cy3-miR-19a-transfected primary astrocytes, we detected significantly more Cy3+ EpCAM-positive tumor cells over time than under CAFs co-culture (Fig. 3a and Extended Data 4a), suggesting miR-19a is intercellularly transferred from astrocytes to tumor cells. miRNAs are transferable between neighboring cells through gap junctions or small vesicles19,20. Treating tumor cells with a gap junction channel (G°C) inhibitor, carbenoxolone disodium salt, had no significant effect on miR-19a intercellular transfer (data not shown), while adding astrocyte-conditioned media to tumor cells led to an increased miR-19a and subsequent PTEN down-regulation (Extended Data 4b-d). Recognizing exosomes’ involvement in neuronal function and glioma development21, we postulated that exosomes may mediate miR-19a transfer from astrocytes to tumor cells. Indeed, transmission electron microscopy (TEM) detected spherical, membrane-encapsulated particles between 30–100 nm, typical of exosome vesicles, in astrocyte-conditioned media (Fig. 3b)22. Additionally, the astrocyte-conditioned media contained significantly more CD63+, CD81+, and TSG101+ exosomes22 than the CAF-conditioned media (Fig. 3c and Extended Data 4e-f). Moreover, the exosomes from astrocytes contained 3.5-fold higher miR-19a than those from CAFs (Extended Data 4g). Adding exosomes purified from conditioned media of Cy3-miR-19a-transfected astrocytes led to miR-19a transfer into cultured tumor cells (Fig. 3d). Furthermore, treating tumor cell directly with astrocyte-derived exosomes led to a dose-dependent increase of miR-19a and subsequent decrease of PTEN mRNA in tumor cells (Fig. 3e). To determine whether astrocyte-released exosomes are required for miR-19a transfer, we blocked astrocyte exosome secretion by treating astrocytes with an inhibitor of exosome release, dimethyl amiloride (DMA), or siRNA targeting Rab27a, a mediator of exosome secretion23 (Extended Data 5a-c). Both exosome blockades decreased astrocytes’ miR-19a transfer into tumor cells and restored PTEN mRNA level (Fig. 3f-g). Furthermore, we intracranially injected Rab27a/b shRNA lentiviruses to block exosome secretion in mouse brain parenchyma (brain metastasis stroma) and then inoculated B16BL6 melanoma cells to the same sites (Fig. 3h). Inhibiting Rab27a/b reduced TSG101+ and CD63+ exosomes, blocked PTEN downregulation in tumor lesions (Fig. 3i and Extended Data 5d-g), and significantly decreased tumor outgrowth (Fig. 3j). Conversely, intracranial co-injection of tumor cells with astrocyte-derived exosomes (Fig. 3k) rescued PTEN-downregulation in tumor cells (Fig. 3l) and metastatic outgrowth (Fig. 3m) in Rab27a/b shRNA lentivirus-injected mouse brains (Extended Data 5h-i). Collectively, exosome-mediated miR-19a transfer from astrocytes to tumor cells is critical for tumor PTEN down-regulation and aggressive outgrowth in the brain.
Figure 3. Intercellular transfer of PTEN-targeting miR-19a to tumor cells via astrocyte-derived exosomes.
a, Intercellular transfer of miR-19a. Top: light microscopy and fluorescent images of HCC1954 cells 12 and 60 hours after co-cultured with astrocytes loaded with Cy3-labeled miR-19a. Bottom: flow cytometry analysis of Cy3-miR-19a in tumor cells 60 hours after co-culture (mean ± s.e.m., t-test). b-c, Transmission electron microscopy (b) of exosome vesicles in astrocyte-conditioned media that are confirmed by western blot for CD63, CD81, and TSG101 exosome markers released by 1 × 10⁶ of CAFs or astrocytes (c). d, Representative data showing presence of Cy3-miR-19a in HCC1954 breast cancer cells after adding exosomes purified from Cy3-miR-19a transfected astrocytes for 24 hours. Bottom panel: flow cytometry analysis of Cy3-miR-19a-positive HCC1954 cells after treatment with supernatant (without exosomes), or exosomes purified from Cy3-miR-19a-transfected astrocytes. Negative control is HCC1954 cells without treatment. Positive control is Cy3-miR-19a-transfected astrocytes. e, Histograms of miR-19a and PTEN mRNA in HCC1954 cells 48 hours after addition of media, astrocyte supernatant, or exosomes purified from astrocyte-conditioned media (mean ± s.e.m., t-test). f-g, Histograms of miR-19a and PTEN mRNA in HCC1954 cells after 48 hour co-culture in conditioned media from vehicle- or DMA-treated (4 hours) astrocytes (f) and control- or Rab27a-siRNA- transfected (48 hours) astrocytes (g) (mean ± s.e.m., t-test). h–j, Schematics of in vivo experiments (h), IHC analyses of PTEN and exosome marker expression (i) and changes of tumor volume (j) (mean ± s.d., t-test). k-m, Schematics showing in vivo rescue of exosome effect by pre-incubation of tumor cells with astrocyte-derived exosomes (k), IHC analyses of PTEN and exosome marker expression (l) and changes of tumor volume (m) (mean ± s.d., t-test).
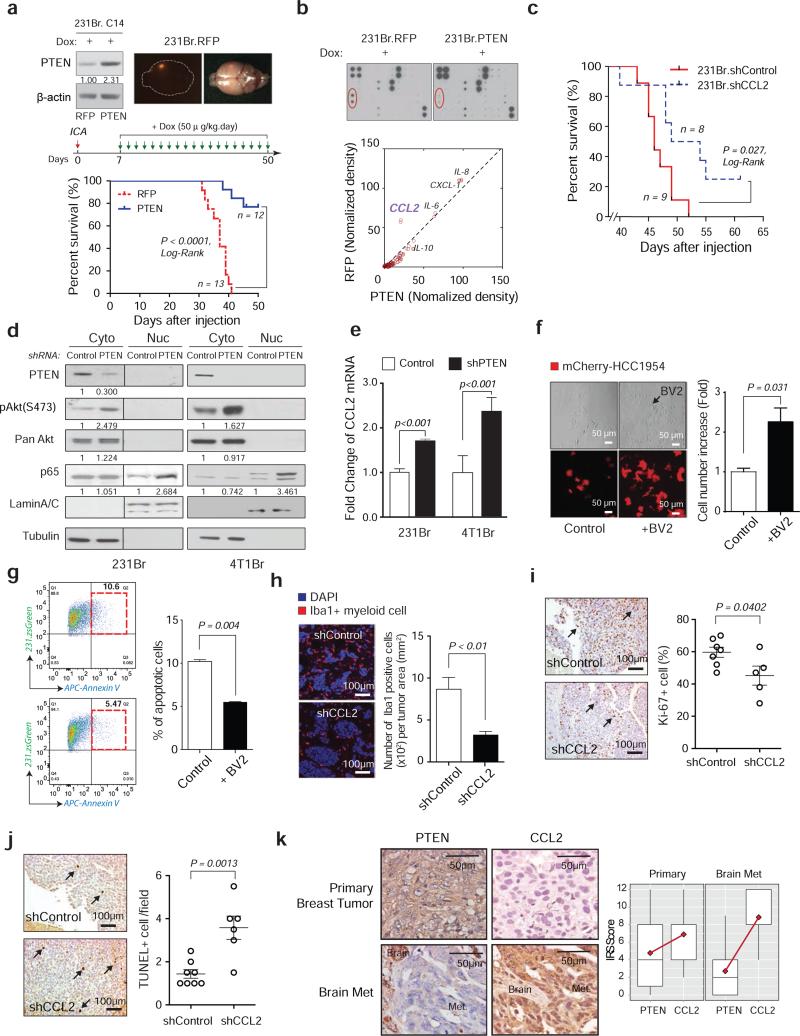
We next explored how PTEN loss promotes brain metastasis. Doxycycline (dox)-inducible PTEN knockdown (Extended Data 6a) prior to intracarotid injection did not alter tumor cell extravasation into the brain parenchyma (Extended Data 6b-c). To test whether restoring PTEN expression after tumor cell extravasation inhibits metastatic outgrowth, we selected MDA-MB-231Br subclones stably expressing either a dox-inducible PTEN-coding sequence without the 3’-UTR miRNA binding sites or RFP controls (Fig. 4a and Extended Data 6d). PTEN induction seven days post-intracarotid injection after tumor cells’ extravasation markedly extended the overall survival of brain metastases-bearing mice (Fig. 4a and Extended Data 6e). Collectively, PTEN loss primes brain metastasis outgrowth after tumor cell extravasation and PTEN restoration suppresses the outgrowth.
Figure 4. Brain-dependent PTEN-loss instigates metastatic microenvironment to promote metastatic cell outgrowth.
a, Prolonged mouse survival by restoration of PTEN expression. Upper: dox-inducible RFP (left) and PTEN expression (right) in 231Br cells. Middle: schematics of brain metastasis assay with dox-induced RFP or PTEN expression. Lower: overall survival of mice bearing brain metastases of 231Br cells with induced PTEN re-expression or RFP expression (Log-Rank test). b, Cytokine array of 231Br cells with dox-induced RFP or PTEN expression. c, Overall survival of mice bearing brain metastases of 231Br cells transfected with control or CCL2 shRNAs (Log-Rank test). d, WB analysis of NF-κB p65 nuclear translocation after knocking down PTEN. e, Histogram showing CCL2 mRNA level after PTEN knockdown detected by qPCR (mean ± s.e.m., t-test). f, Light and fluorescent microscopy images and quantification of mCherry-labeled tumor cells with or without BV2 microglia co-culture under 2-day serum starvation (mean ± s.e.m., t-test). g, FACS analyses of AnnexinV+ apoptotic zsGreen-labeled 231Br cells under doxorubicin treatment with or without BV2 microglia co-culture (mean ± s.e.m., t-test). h, Immunofluorescence (IF) staining of Iba1+ myeloid cells in brain metastases of 231Br cells containing control or CCL2 shRNAs (mean ± s.e.m., t-test). i-j, IHC analyses showing decreased proliferation (i: Ki-67) and increased apoptosis (j: TUNEL staining) in brain metastases after shRNA-mediated CCL2 knockdown in vivo (mean ± s.e.m., t-test). k: PTEN and CCL2 expression in matched primary breast tumors and brain metastases. Left: representative IHC staining of PTEN and CCL2. Right: quantification of PTEN and CCL2 expression in 35 cases of matched primary breast tumors and brain metastases (mean ± s.d.).
Autocrine and paracrine signaling play decisive roles in metastasis seeding and outgrowth. Although PTEN restoration only led to a trend of reduced Akt and p70S6K phosphorylation (Extended Data 6f), cytokine array analyses revealed dramatically reduced CCL2 secretion in PTEN-expressing tumor cells compared to controls (Fig. 4b); whereas PTEN knockdown increased CCL2 expression (Extended Data 6g). Moreover, the overall survival of brain metastasis-bearing mice with CCL2-knockdown MDA-MB-231Br cells was significantly extended compared to controls (Fig. 4c and Extended Data 6h-i). Mechanistically, PTEN induction decreased NF-κB p65 phosphorylation (Extended Data 7a-b) along with reduced CCL2 secretion (Fig. 4b), whereas PTEN knockdown increased p65 nuclear translocation, an indicator of NF-κB activation, and CCL2 expression (Fig. 4d-e), partly through Akt activation (Extended Data 7c). Furthermore, CCL2 mRNA and protein expression in brain-seeking tumor cells was inhibited by NF-κB inhibitor pyrrolidine dithiocarbamate (PDTC) (Extended Data 7d-f), indicating NF-κB activation is critical for PTEN loss-induced CCL2 up-regulation.
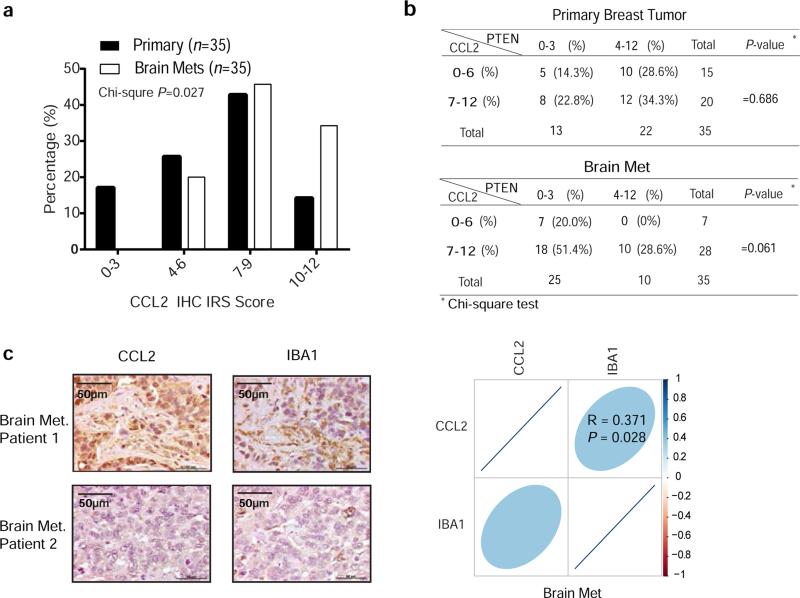
CCL2 is a chemo-attractant during inflammation24. CCL2 receptor (CCR2)-expressing brain-derived Iba1-positive (Iba1+) primary myeloid cells and BV2 microglial cells (Extended Data 8a-b) migrate towards CCL2, which was blocked by CCR2 antagonists (Extended Data 8c-d)25. Functionally, co-culturing with BV2 cells enhanced proliferation and inhibited apoptosis of breast cancer cells (Fig. 4f-g). In vivo, CCL2-knockdown brain metastases had decreased Iba1+/CCR2+ myeloid cell infiltration (Fig. 4h) corresponding to their reduced proliferation and increased apoptosis (Fig. 4i-j). Furthermore, IHC staining of human primary breast tumors and matched brain metastases for PTEN and CCL2 (Figs. 1b, and 4k, respectively) revealed a significantly (p=0.027) higher CCL2 expression in brain metastases than primary tumors (Extended Data 9a). Importantly, severe PTEN loss in brain metastases corresponded to higher CCL2 expression (Extended Data 9b), which significantly correlated with Iba1+ myeloid cell recruitment (Extended Data 9c), validating that PTEN down-regulation in brain metastatic tumor cells contributes to CCL2 up-regulation and Iba1+ myeloid cell recruitment in clinical brain metastases.
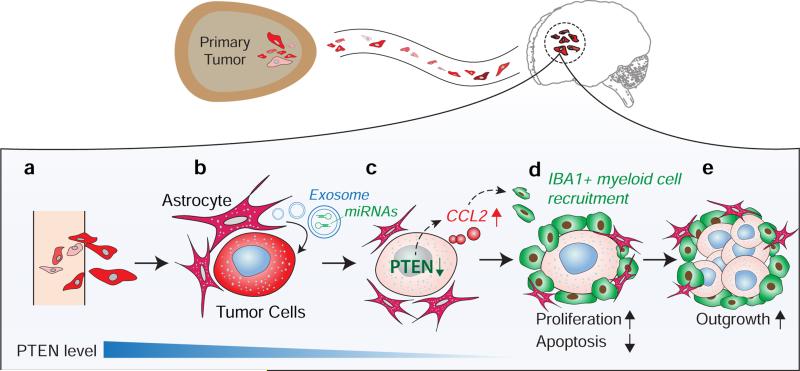
Taken together, our data unveiled a complex reciprocal communication between metastatic tumor cells and their TME, which primes the successful outgrowth of cancer cells to form life-threatening metastases (Extended Data 10). Beyond tumor cell autonomous view of metastasis, our findings highlighted an important plastic and tissue-dependent nature of metastatic tumor cells and a bi-directional co-evolutionary view of “seed and soil” hypothesis. Importantly, although clinical application of CCL2 inhibitor for metastasis treatment requires careful design26, our data of brain metastasis inhibition by stable ablation of PTEN loss-induced CCL2 demonstrated the potential of CCL2-targeting for therapeutic intervention of life-threatening brain metastases.
Online Methods
Reagents and cell culture
All common chemicals were from Sigma (St. Louis, MO). Pyrrolidinedithiocarbamic acid was from Santa Cruz Biotechnology (Santa Cruz, CA). Exo-FBS Exosome-depleted FBS was purchased from System Biosciences (SBI) (Mountain View, CA). PTEN (# 9188), p-Akt (T308) (#9275), p-Akt (S473) (#4060), Pan Akt (#4691), and Bim (#2933) antibodies were from Cell Signaling (Danvers, MA). CD9 (ab92726), Rab27a (ab55667), AMPK (ab3759), CCL2 (ab9899), MAP2 (ab11267), and p-P70S6K (ab60948) antibodies were from Abcam (Cambridge, MA). Tsg101 (14497-1-AP) and Rab27b (13412-1-AP) antibodies were from Proteintech (Chicago, IL). CD81 (104901) antibody was from BioLegend (San Diego, CA). E2F1 (NB600-210) and CCR2 (NBP1-48338) antibodies were from Novus (Littleton, CO). GFAP (Z0334) antibody was from DAKO (Carpinteria, CA). Iba-1 antibody was from WAKO (Richmond, VA). Cre (969050) antibody was from Novagen (Madison, WI). NF-kB p65 (SC-109), CD63 (SC-15363) antibody was from Santa Cruz (Santa Cruz, CA). DMA (sc-202459) and CCR2 antagonist (sc-202525) were from Santa Cruz (Santa Cruz, CA). MK2206 (S1078) was from Selleckchem (Houston, TX). PDTC (P8765) was from Sigma-Aldrich (St. Louis, MO). Human breast cancer cell lines (MDA-MB-231, HCC1954, BT474, and MDA-MB-435) and mouse cell lines (B16BL6 mouse melanoma and 4T1 mouse breast cancer) were purchased from ATCC and verified by MD Anderson Cancer Center (MDACC) Cell Line Characterization Core Facility. Primary glia was isolated as described13. Briefly, after homogenization of dissected brain from P0-P2 neonatal mouse pups, all cells were seeded on Poly-D-Lysine coated flasks. 7 days later, flasks with primary culture were placed on an orbital shaker and shaken at 230 rpm for 3 hours. Warm DMEM 10:10:1 (10% of fetal bovine serum, 10% of horse serum, 1% Penicillin/streptomycin) were added and flasks were shaken again at 260 rpm overnight. After shaking, fresh trypsin was added into the flask and leftover cells were plated with warm DMEM 5:5:1 (5% of fetal bovine serum, 5% of horse serum, 1% Penicillin/streptomycin) to establish primary astrocyte culture. >90% of isolated primary glial cells were GFAP+ astrocytes. Primary cancer associated fibroblasts (CAFs) were isolated by digesting the mammary tumors from MMTV-neu transgenic mouse. 231.xenograft CAFs were isolated by digesting the mammary tumors from MDA.MB.231 xenograft. For the mixed co-culture experiments, tumor cells were mixed with equal number of freshly isolated primary glia or CAFs or NIH3T3 fibroblast cells in six-well plate (1:3 ratio). Co-cultures were maintained for 2-5 days before magnetic bead-based separation. For the trans-well co-culture experiments, tumor cells were seeded in the bottom well and freshly isolated primary glia, CAFs, or NIH3T3 cells were seeded on the upper insert (1:3 ratio). Co-cultures were maintained for 2-5 days for the further experiments. Lentiviral-based packaging vectors (Addgene, Cambridge, MA), pLKO.1 PTEN-targeting shRNAs and all siRNAs (Sigma), Human Cytokine Antibody Array 3 (Ray biotech), and lentiviral-based vector pTRIPZ-PTEN and pTRIPZ-CCL2 shRNAs (MDACC shRNA and ORFome Core, from Open Biosystems) were purchased. The human PTEN-targeting shRNA sequences in the lentiviral constructs were: 5’-CCGGAGGCGCTATGTGTATTATTATCTCGAGATAATAATACACATAGCGCCTTTTTT-3’ (targeting coding sequence); 5’-CCGGCCACAAATGAAGGGATATAAACTCGAGTTTATATCCCTTCATTTGTGGTTTTT-3’ (targeting 3’-UTR). The human PTEN-targeting siRNA sequences used were: GGUGUAAU GAUAUGUGCAU and GUUAAAGAAUCAUCUGGAU. The human CCL2-targeting siRNA sequences used were: CAGCAAGUGUCCCAAAGAA and CCGAAGACUUGAACACUCA. The mouse Rab27a-targeting siRNA sequences used were: CGAUUGAGAUGCUCCUGGA and GUCAUUUAGGGAUCCAAGA. Mouse pLKO shRNA (shRab27a: TRCN0000381753; shRab27b: TRCN0000100429) were purchased from Sigma (St. Louis, MO). For lentiviral production, lentiviral expression vector was co-transfected with the third-generation lentivirus packing vectors into 293T cells using Lipo293 DNA in vitro Transfection Reagent (SignaGen). 48 to 72 hours after transfection, cancer cell lines were stably infected with viral particles. Transient transfection with siRNA was performed using pepMute siRNA transfection reagent (SignaGen). For in vivo intracranial virus injection, lentivirus was harvested from 15cm plates 48 hours after transfection of packaging vectors. After passing a 0.45μm filter, all viruses were centrifuged at 25,000 rpm for 90 min at 4 °C. Viral pellet was suspended in PBS (~200 fold concentrated). The final virus titer (~1 × 10⁹ UT/ml) was confirmed by limiting dilution.
Isolation of tumor cells from co-culture
Cell isolation was performed based on the magnetic bead-based cell sorting protocol according to manufacturer's recommendation (Miltenyi Biotec Inc., CA). After preparation of single cell suspension, tumor cells (HCC1954 or BT474) were stained with primary EpCAM-FITC antibody (Catalog #130-098-113) (50 μl per 107 total cells) and incubated for 30 min in the dark at 4°C. After washing, the cell pellet was re-suspended and Anti-FITC microbeads (50 μl per 107 total cells) were added before loading onto the magnetic column of a MACS separator. Column was washed twice and removed from the separator. The magnetically captured cells were flushed out immediately by firmly applying the plunger. The isolated and labeled cells were analyzed on a Gallios flow cytometer (Beckman Coulter). For EpCAM-negative MDA-MB-231 tumor cells, FACS sorting (ARIAII, Becton Dickinson) was used to isolate GFP+ tumor cells from glia or CAFs.
Isolation of CD11b+ cells from mouse primary glia
Isolation of primary glia was achieved by homogenization of dissected brain from postnatal days 0-2 mouse pups. After 7 days, trypsin was added onto plate and cells were collected. After centrifugation and re-suspension of cell pellet to single –cell suspension, cells were incubated with CD11b+ microbeads (Miltenyl Biotec) (50 μl per 107 total cells) for 30 min at 4 °C. The cells were washed with buffer and CD11b+ cells were isolated by MACS Column. CD11b+ cells were analyzed by flow cytometry and immunofluorescence staining.
Western blotting
Western blotting was done as previously described. Briefly, cells were lysed in lysis buffer (20 mM Tris at pH 7.0, 1% Triton-X 100, 0.5% NP-40, 250 mM NaCl, 3 mM EDTA, and protease inhibitor cocktail). Proteins were separated by SDS-PAGE and transferred onto a PVDF membrane. After membranes were blocked with 5% milk for 30 min, they were probed with various primary antibodies overnight at 4°C, followed by incubation with secondary antibodies for 1 hour at room temperature, and visualized with enhanced chemiluminescence reagent (Thermo Scientific).
qRT-PCR
Briefly, total RNA was isolated using miRNeasy Mini Kit (Qiagen) and then reverse transcribed using reverse transcriptase kits (iScript cDNA synthesis Kit, Bio-rad). SYBR-based qRT-PCR was performed using pre-designed primers (Life Technologies). miRNA assay was conducted using Taqman miRNA assay kit (Life Technologies). For quantification of gene expression, real-time PCR was conducted using Kapa Probe Fast Universal qPCR, and SYBR Fast Universal qPCR Master Mix (Kapa Biosystems) on a StepOnePlus real-time PCR system (Applied Biosystems). The relative expression of mRNAs was quantified by 2−ΔΔCt with logarithm transformation. Primers used in qRT-PCR analyses are: Mouse CCL2: forward, 5’- GTTGGCTCAGCCAGATGCA-3’; reverse: 5’-AGCCTACTCATTGGGATCATCTTG-3’. Mouse ACTB: forward: 5’-AGTGTGACGTTGACATCCGT3’; reverse: 5’-TGCTAGGAGCCAGAGCAGTA-3’. Mouse PTEN: forward: 5’-AACTTGCAATCCTCAGTTTG-3’; reverse: 5’-CTACTTTGATATCACCACACAC-3’. Mouse CCR2 primer: Cat: 4351372 ID: Mm04207877_m1 (Life technologies, Grand Island, NY)
miRNA labeling and transfection
Synthetic miRNAs were purchased from Sigma and labeled with Cy3 by Silencer siRNA labeling kit (Life Technologies). Briefly, miRNAs were incubated with labeling reagent for one hour at 37°C in the dark, and then labeled miRNAs were precipitated by ethanol. Labeled miRNAs (100 pmoles) were transfected into astrocytes or CAFs in a 10 cm-plate. After 48 hours, astrocytes and CAFs containing Cy3-miRNAs were co-cultured with tumor cells (at 5:1 ratio).
PTEN promoter methylation analysis and luciferase reporter assay of PTEN promoter activity
Genomic DNA was isolated by PreLink genomic DNA mini Kit (Invitrogen), bisulfite conversion was performed by EpiTect Bisulfite Kit and followed by EpiTect methylation-specific PCR (Qiagen). Primers for PTEN CpG island are 5’-TGTAAAACGACGGCCAGTTTGTTATTATTTTTAGGGTTGGGAA-3’ and 5’-CAGGAAACAGCTATGACCCTAAACCTACTTCTCCTCAACAACC-3’. Luciferase reporter assays were done as previously described27. The wild-type PTEN promoter driven pGL3-luciferase reporter was a gift from Dr. A. Yung (MD Anderson Cancer Center). The pGL3-PTEN reporter and a control Renilla luciferase vector were co-transfected into tumor cells by Lipofectamine 2000 (Life Technologies). After 48-hours, tumor cells were co-cultured with astrocytes or CAFs. Another 48 hours later, luciferase activities were measured by Dual-Luciferase Report Assay Kit (Promega) on Luminometer 20/20 (Turner Biosystems). The PTEN-3’UTRs with various miRNA-binding site mutations were generated by standard PCR-mediated mutagenesis method and inserted downstream of luciferase reporter gene in pGL3 vector. The activities of the luciferase reporter with the wild-type and mutated PTEN-3’UTRs were assayed as described above.
Exosome isolation and purification
Astrocytes or CAFs were cultured for 48-72 hours and exosomes were collected from their culture media after sequential ultracentrifugation as described previously. Briefly, cells were harvested, centrifuged at 300×g for 10 minutes and the supernatants were collected for centrifugation at 2000×g for 10 minutes, 10,000×g for 30 minutes. The pellet was washed once with PBS and purified by centrifugation at 100,000×g for 70 minutes. The final pellet containing exosomes was re-suspended in PBS and used for 1) TEM by fixing exosomes with 2% glutaraldehyde in 0.1 M phosophate buffer, pH 7.4; 2) measure of total exosome protein content using BCA Protein Assay normalized by equal number of primary astrocytes and CAF cells; 3) Western blotting of exosome marker protein CD63, CD81 and Tsg101; and 4) real-time qRT-PCR by extracting miRNAs with miRNeasy Mini Kit (Qiagen).
Transmission electron microscopy
Fixed samples were placed on 100 mesh carbon coated, formvar coated nickel grids treated with poly-L-lysine for about 30 minutes. After washing the samples on several drops of PBS buffer, samples were incubated on drops of buffered 1% gluteraldehyde for 5 minutes, and then washed several times on drops of distilled water. Afterwards, samples were negatively stained on drops of millipore-filtered aqueous 4% uranyl acetate for 5 minutes. Stain was blotted dry from the grids with filter paper and samples were allowed to dry. Samples were then examined in a JEM 1010 transmission electron microscope (JEOL, USA, Inc., Peabody, MA) at an accelerating voltage of 80 Kv. Digital images were obtained using the AMT Imaging System (Advanced Microscopy Techniques Corp., Danvers, MA).
Flow cytometry analysis of exosome marker proteins, Annexin V and CCR2
For exosome detection, 100 μl exosome isolated from 10 ml conditioned media of asttrocytes or CAFs were incubated with 10 μl of aldehyde/sulfate latex beads (4 μm-diameter, Life Technologies) for 15 min at 4°C. After 15 min, PBS was added to make sample volume up to 400 μl which was incubated overnight at 4°C under gentle agitation. Exosome-coated beads were washed twice in FACS washing buffer (1% BSA and 0.1% NaN3 in PBS), and re-suspended in 400 μl FACS washing buffer, stained with 4 μg of PE-conjugated anti-mouse CD63 antibody (BioLegend) or mouse IgG (Santa Cruz Biotechnology) for 3 hours at 4°C under gentle agitation and analyzed on a FACS Canto II flow cytometer. Samples were gated on bead singlets based on FCS and SSC characteristics (4 μm-diameter). For Annexin V apoptosis assay, after 24 hrs doxorubicin (2uM) treatment, the cells were collected, labeled by APC-Annexin V antibody (Biolegend) and analyzed on a FACS Canto II flow cytometer. CD11b+ and BV2 cells were stained with CCR2 antibody (Novus) at 4 °C overnight; they were then washed and stained with Alexa Fluro 488 anti-rabbit IgG (Life Technologies) at room temperature for 1 hour. Then the cells were analyzed on a FACS Canto II flow cytometer.
In vivo experiments
All animal experiments and terminal endpoints were carried out in accordance with approved protocols from the Institutional Animal Care and Use Committee of MDACC. Animal numbers of each group were calculated by power analysis and animals are grouped randomly for each experiment. No blinding of experiment groups was conducted. Mammary fad pad (MFP) tumors were established by injection of 5×10⁶ tumor cells in 100 μl of PBS:Matrigel mixture (1:1 ratio) orthotopically into the MFP of 8-weeks old swiss nude mice as done previously28. Brain metastasis tumors were established by intracarotid artery (ICA) injection of tumor cells (250,000 cells in 0.1ml HBSS for MDA-MB-231, HCC1954, MDA-MB-435, 4T1, B16BL6 and 500,000 cells in 0.1ml HBSS for BT474.m1 into the right common carotid artery as done previously29. Mice (6-8 weeks) were randomly grouped into designated groups. Female mice are used for breast cancer experiments, both female and male are used for melanoma experiments. Since brain metastasis model does not result in visible tumor burdens in living animal, the endpoints of in vivo metastasis experiments are based on the presence of clinical signs of brain metastasis, including but not limited to, primary CNS disturbances, weight loss, and behavioral abnormalities. Animals are sacrificed upon showing above signs or one to two weeks post-surgery based on specific experimental designs. Brain metastasis lesions are enumerated as experimental readout. Brain metastases were counted as micromets and macromets. The definition of micromets and macromets are based on a comprehensive mouse and human comparison study previously published30. Briefly, ten HE-stained serial sagittal sections (300 μm/section) through the left hemisphere of the brain were analyzed for the presence of metastatic lesions. We counted micrometastases (i.e., those ≤50 μm2) to a maximum of 300 of micrometastases per section and every large metastasis (i.e., those >50 μm2) in each section. Brain-seeking cells from overt metastases and whole brains were dissected and disaggregated in DMEM/F-12 medium using Tenbroeck homogenizer briefly. Dissociated cell mixtures were plated on tissue culture dish. Two weeks later, tumors cells recovered from brain tissue were collected and expanded as brain-seeking sublines (Br.1). For the astrocyte miR-19 knockout mouse model, Mirc1tm1.1Tyj/J mice (Jax lab) (6-8 weeks) were intracranially injected with Ad5.GFAP.Cre virus (Iowa University, Gene Transfer Vector Core) 2 μl (MOI ~108 units/μl) per point, total 4 points at the right hemisphere (n=9). Control group (n=7) was injected with the same dose Ad5.RSVβ-Gluc (Ad.GLuc) at the right hemisphere. All intracranial injections were performed by an implantable guide-screw system. One week after virus injection, mice were intracarotidlly injected with 2 × 10⁵ B16BL6 tumor cells. After two weeks, whole brains were dissected and fixed in 4% formaldehyde, and embedded in paraffin. Tumor formation, histological phenotypes of H&E-stained sections, and immunohistochemistry staining were evaluated. Only parenchymal lesions, which are in close proximity of adenovirus injection, were included in our evaluation. Tumor size was calculated as (longest diameter) × (shortest diameter) ^ 2 × 0.5. For intracranial tumor model, Mirc1tm1.1Tyj/J mice (Jax lab) (6-8 weeks) were intracranially injected as described above. Seven mice were used in the experiment. One week later, these mice were intracranially injected with 2.5 × 10⁵ B16BL6 tumor cells at both sides where adenoviruses were injected. After another week, whole brains were dissected and fixed in 4% formaldehyde, and embedded in paraffin. Tumor formation and phenotype were analyzed as above.
For the Rab27a/b knockdown mouse model, seven C57BL6 mice (Jax lab) (6-8 weeks) were intracranially injected with concentrated lentivirus containing shRab27a and shRab27b (ratio 1:2) 2 μl per point, total 3 points at the right hemisphere; concentrated control lentivirus containing pLKO.1 scramble were injected at the left hemisphere. All intracranial injections were performed by an implantable guide-screw system. One week later, mice were intracranially injected with 5 × 10⁴ B16BL6 tumor cells at both sides where they had been infected. After one week, whole brains were dissected and fixed in 4% formaldehyde, and embedded in paraffin. Tumor formation, histological phenotypes of H&E-stained sections, immunohistochemistry staining were evaluated. When perform metastases size quantification, only parenchymal lesions that in close proximity to adenovirus injection sites were included into analyses. Tumor size was calculated as (longest diameter) × (shortest diameter) ^ 2 × 0.5. For exosome rescue experiments, eight C57BL6 mice (Jax lab) (6-8 weeks) were intracranially injected with concentrated lentivirus containing shRab27a and shRab27b (ratio 1:2) 2 μl per point, total 3 points at both hemispheres. One week later, these mice were intracranially injected with 5 × 10⁴ B16BL6 tumor cells with 10 μg exosome isolated from astrocyte media at right sides where they had been injected with lentivirus; 5 × 10⁴ B16BL6 tumor cells with vehicle were injected at left sides where lentivirus had been injected. After another week, whole brains were dissected and fixed in 4% formaldehyde, and embedded in paraffin. Tumor formation and phenotype were analyzed as above.
For in vivo extravasation assay, equal number of cells labeled with GFP-control shRNA and RFP-PTEN shRNA (Open Biosystems) were mixed and ICA injected. After cardiac perfusion, brains were collected and sectioned through coronal plan on a vibrotome (Leica) into 50 μm slice. Fluorescent cells were then counted. For inducible PTEN expression in vivo, mice were given doxycycline (10 μg/kg) every other day. To quantify brain metastasis incidence and tumor size, brains were excised for imaging and histological examination at the end of experiments. Ten serial sagittal sections every 300 microns throughout the brain were analyzed by at least two pathologists who are blinded to animal groups in all above analyses.
Reverse Phase Protein Array
Reverse phase protein array (RPPA) of PTEN-overexpressing cells was performed in MDACC Functional Proteomics core facility. Briefly, cellular proteins were denatured by 1% SDS, serial diluted and spotted on nitrocellulose-coated slides. Each slide was probed with a validated primary antibody plus a biotin-conjugated secondary antibody. The signal obtained was amplified using a Dako Cytomation–catalyzed system and visualized by DAB colorimetric reaction. The slides were analyzed using customized Microvigene software (VigeneTech Inc., Carlisle, MA). Each dilution curve was fitted with a logistic model (“Super curve Fitting” developed at MDACC) and normalized by median polish. Differential intensity of normalized log values of each antibody between RFP (control) and PTEN overexpressed cells were compared in GenePattern (http://genepattern.broadinstitute.org). Antibodies with differential expression (p<0.2) were selected for clustering and heatmap. The data clustering was performed using GenePattern.
Patient samples
Two studies in separate cohorts were conducted. The first one was a retrospective evaluation of PTEN in two cohorts. 1) Archived formalin fixed and paraffin-embedded (FFPE) brain metastasis specimens (n=131) from patients with a history of breast cancer who presented with metastasis to the brain parenchyma and had surgery at MDACC (Supplementary information). Tissues were collected under a protocol (LAB 02-486) approved by the institutional review board (IRB) at MDACC. 2) Archived unpaired primary breast cancer FFPE specimens (n=139) collected under an IRB protocol (Lab 02-312) at MDACC (Supplementary information). Formal consent was obtained from all patients. The second study was a retrospective evaluation of PTEN, CCL2 and Iba1 in the matched primary breast tumors and brain metastatic samples from 35 patients, of which there are 12 HER2-positive, 14 triple-negative and nine ER-positive tumors according to clinical diagnostic criteria (Supplementary information). Formalin-fixed, paraffin-embedded primary breast and metastatic brain tumor samples were obtained from the Pathology Department, University of Queensland Centre for Clinical Research (Queensland, Australia). Tissues were collected with approval by human research ethics committees at the Royal Brisbane and Women's Hospital (2005/022) and the University of Queensland (2005000785). For tissue microarray (TMA) construction, tumour-rich regions (guided by histological review) from each case were sampled using 1 mm cores. All the archival paraffin-embedded tumor samples were coded with no patient identifiers.
Immunohistochemistry (IHC) and Immunofluorescence (IF)
Standard IHC staining was performed as done previously28. Briefly, after de-paraffinization and rehydration, 4 μm sections were subjected to heat-induced epitope retrieval (0.01 M citrate for PTEN). Slides were then incubated with various primary antibodies at 4°C overnight, after blocking with 1% goat serum. Slides underwent color development with DAB and hematoxylin counterstaining. Ten visual fields from different areas of each tumor were evaluated by two pathologists independently (blind to experiment groups). Positive Iba1 and Ki-67 staining in mouse tumors were calculated as percentage of positive cells per field (%) and normalized by the total cancer cell number in each field. TUNEL staining was counted as average positive cells/field (10 random fields). We excluded necrotic areas in the tumors from evaluation. Immunofluorescence (IF) was performed following the standard protocol recommended by Cell Signaling Inc. Briefly, after washing with PBS twice, cells were fixed with 4% formaldehyde. Samples were blocked with 5% normal goat serum in PBS for 1 hour before incubation with a primary antibody cocktail overnight at 4°C, washed, then incubated with secondary antibodies before examination using confocal microscope. Pathologists were blinded to the group allocation during the experiment and when assessing the outcome.
Bioinformatics and statistical analysis
Publicly available GEO datasets GSE14020 and GSE19184, GSE2603, GSE2034 and GSE12276 were used for bioinformatics analysis. The top 2 × 10⁴ verified probes were subjected to analysis. Differentially expressed genes between metastases from brain and other sites (primary or other metastatic organ sites) were analyzed by SAM analysis in R statistical software. The 54 commonly down-regulated genes in brain metastases from GSE14020 and GSE19184 were depicted as heat map by Java Treeview. For power analysis, we calculated sample size using Pwr package in R environment. For staining of patient samples, we calculated the correlation by Fisher's exact test. For survival analysis of GSE2603, the patient samples were mathematically separated into PTEN-low and -normal groups based on K-means (K=2). Kaplan-Meier survival curves were generated by survival package in R. Multiple group IHC scores were compared by Chi-square test and Mantelhaen test in R. All quantitative experiments have been repeated using at least three independent biological repeats and are presented as mean ± s.e.m. or mean ± s.d.. Quantitative data were analyzed either by one-way analysis of variance (ANOVA) (multiple groups) or t-test (two groups). P < 0.05 (two-sided) was considered statistically significant.
Extended Data
Extended Data Figure 1. Organ-specific loss of PTEN in brain metastases.
a, Schematics of microarray analyses. Patients’ brain metastases exhibited a discrete gene expression profile with 650 genes significantly down-regulated compared to bone or lung metastases (GSE14020). Cancer cells were injected into immunodeficient mice to produce orthotopic primary tumors (MDA-MB-231 cells for mammary tumor, PC14 for prostate tumor, A375SM for melanoma) and experimental brain metastases (all three lines). Brain metastases derived from these three cancer cell lines exhibited 2161 commonly down-regulated genes compared to their respective primary tumors (GSE19184). PTEN is one of only 54 commonly down-regulated genes in brain metastases of both datasets. b, Heat-maps showing expression of 54 commonly down-regulated genes (see a) in clinical brain metastases versus lung metastases and bone metastases. c, Heat-maps showing expression of the 54 genes (see a) in cell line-induced primary tumors versus experimental brain metastases. d, Kaplan–Meier survival analyses showing no significant differences in brain metastasis-free survival between breast cancer patients with primary tumors expressing normal PTEN or low PTEN mRNA in GEO cDNA microarray set GSE2603. e, PTEN mRNA levels detected in primary breast tumors from patients with or without brain metastasis relapse. Three GEO cDNA microarray datasets (GSE2034, GSE2603 and GSE12276) with clinical annotation were analyzed. Relative PTEN expression levels were compared by t-test.
Extended Data Figure 2. PTEN expression in different metastatic organ microenvironments and in vitro culture condition.
a, Breast cancer cell lines (MDA-MB-231, HCC1954, BT474, and MDA-MB-435) were cultured and injected either to mammary fad pad (MFP) to form primary tumor or intracarotidly to form brain metastases. Cells pellets and tumor tissues were stained for PTEN expression by immunohistochemistry using anti-PTEN antibodies as done previously28. b, IHC staining of PTEN in brain metastases, paired lung metastases and primary tumor derived from either MDA-MB-231 or 4T1 cells. PTEN expression level was analyzed based on IRS scoring system. c, PTEN mRNA levels between parental MDA-MB-231 and CN-34 breast cancer cell lines (blue) and their brain-seeking sublines (red). Normalized PTEN-specific probe intensity values were extracted from cDNA microarray dataset GSE12237. Dot plot shows the mean probe intensity derived from independent RNA samples. d, PTEN qRT-PCR (mean ± s.e.m., t-test) and IHC in MDA.MB.231Br secondary tumors and cultured cells. e-f, qRT-PCR (e) and western blot (f) analysis of PTEN mRNA expression (mean ± s.e.m., t-test) or protein expression in MDA-MB-231 cells after co-culture with either primary mouse CAFs isolated from MDA-MB-231 xenograft tumors or primary mouse glia isolated from mouse brain. g, Representative methylation-specific PCR of PTEN promoter and quantification under co-culture with glia or CAF (mean ± s.e.m., t-test). h, PTEN promoter activity measured by luciferase reporter in HCC1954 cells after co-culture with either CAF or glia cells for 48 hours (mean ± s.e.m., t-test).
Extended Data Figure 3. Cre-mediated depletion of PTEN-targeting microRNAs in astrocytes.
a, IHC analyses of AMPK, Bim, and E2F1 expression (mean ± s.d, t-test) in brain metastasis tumors with/without pre-knocking out (KO) miR-17-92 cluster in brain microenvironment. M: brain metastases; B: brain tissue. b, Schematic of experimental design. GFAP-Cre adenovirus (Ad-GFAP-Cre) was injected intracranially to the right hemisphere of the Mirc1 mouse, and the control adenovirus (Ad-βGLuc) was injected intracranially to contralateral side of the brain. Then B16BL6 cells were injected intracranially to both sides. c, IHC analysis of Cre expression in the brain astrocytes. d, IHC analysis of PTEN expression in the tumor cells. e, Quantifications of PTEN expression in tumor cells (mean ± s.d., t-test). f, Quantification of intracranial tumor outgrowth by volume (mean ± s.e.m., t-test). g, qRT-PCR analyses of miR-19a and PTEN mRNA in tumor cell HCC1954 after 48 hour co-culture with primary astrocytes from Mirc1tm1.1Tyj/J mice pre-infected (48 hours) by adenovirus (Ad-βGLuc or Ad.GFP.Cre) (mean ± s.e.m., t-test). h, WB of PTEN protein in the indicated tumor cells co-cultured as in (g). i, Knockout of miR-17-92 allele in cultured primary astrocytes. miR-17~92 cluster is flanked by loxP site in Mirc1tm1.1Tyj/J mouse. Primary astrocytes were isolated from Mirc1 mouse brain then infected by adenovirus encoding for βGLuc or GFP.Cre protein. Concentrated adenovirus particles of indicated volume (same MOI ~108 units/mL) encoding βGLuc or GFP.Cre proteins were added to 106 astrocytes. Left, representative photo showing the infection efficiency. Right: bar diagram showing the relative miR-19a expression (one of the five miRNA genes in the miR-17-92 cluster) three days after adenovirus infection (mean ± s.e.m., t-test).
Extended Data Figure 4. Contact-independent down-regulation of PTEN in tumor cells by miR-19a from astrocyte derived exosomes.
a, Flow cytometric detection of Cy3-miR-19a and FITC-EpCAM in tumor cells 60 hours after co-culture with Cy3-miR-19a-transfected astrocytes and CAFs. b-c, Tumor cells were co-cultured with conditioned media from astrocytes or CAFs for 60 hours. RT-PCR analyses of PTEN-targeting miR-19a level (b) and PTEN mRNA level (c) in tumor cells (mean ± s.e.m., t-test). d, Western blot detecting PTEN protein levels in HCC1954 cells after culture with conditioned media from either astrocytes or CAFs for 60 hours. e, Flow cytometry detecting CD63+ exosomes extracted from CAF- or astrocyte-conditioned media. f, Histogram showing the exosome protein level detected from CAF- and astrocyte-conditioned media normalized by cell number (mean ± s.e.m., t-test).g, RT-PCR analyses of miR-19a level in exosomes extracted from CAF or astrocyte conditioned media normalized by equal cell numbers (mean ± s.e.m., t-test).
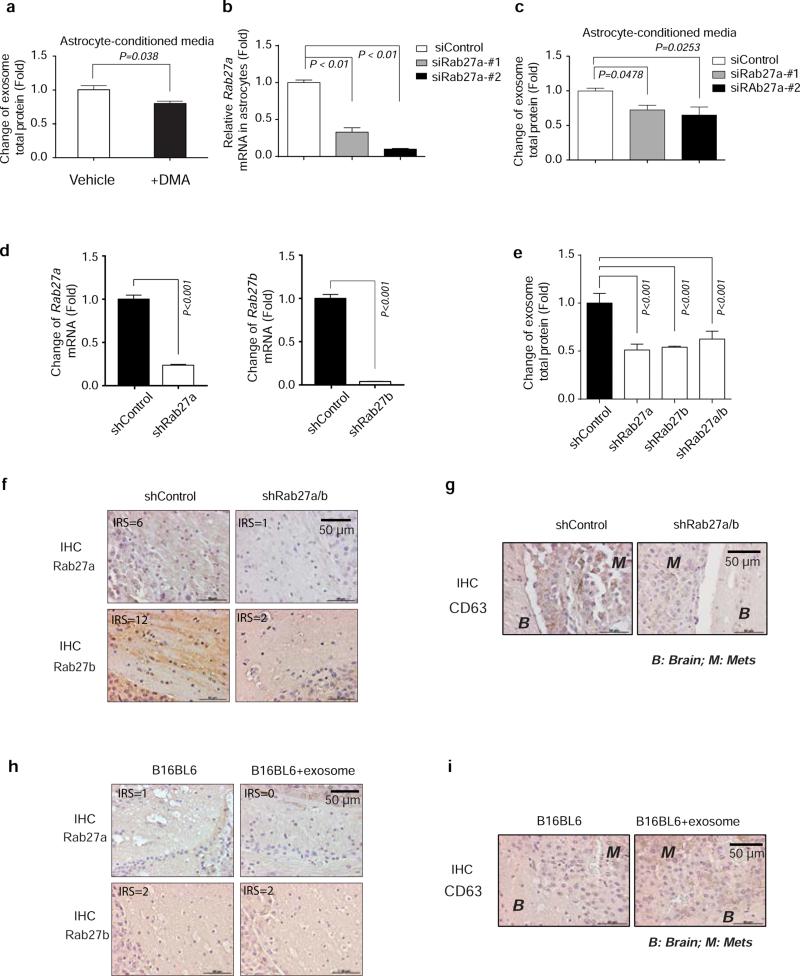
Extended Data Figure 5. Inhibition of exosome release by DMA, Rab27a siRNA or Rab27 shRNAs.
a, Exosome-releasing inhibitor (DMA) treatment reduced exosome secretion from astrocytes compared to vehicle treated astrocytes. Astrocytes were treated with DMA (25μg/ml) or vehicle for 4 hours; exosomes were concentrated from astrocyte-conditioned media and total proteins from exosomes were examined by BCA assay (normalized to total cell numbers) (mean ± s.e.m., t-test). b, Knockdown of Rab27a in astrocytes by siRNA. Two siRNAs targeting mouse Rab27a were transiently transfected into astrocytes and mRNA level of Rab27a was examined by RT-PCR 48 hours after transfection (mean ± s.e.m., t-test). c, Knocking down Rab27a in astrocytes inhibited exosome release. 48 hours after Rab27a-targeting siRNAs were transfected, exosomes were collected from astrocyte-conditioned media and total proteins from exosomes were examined by BCA assay (normalized to total cell numbers) (mean ± s.e.m., t-test). d, Histogram showing relevant changes of Rab27a and Rab27b mRNA level in primary astrocytes infected with pLKO.shRab27a or pLKO.shRab27b virus (mean ± s.e.m., t-test, P<0.001, 3 biological replicates, with 3 technical replicates each). e, Change of exosome protein level detected in astrocyte-conditioned media from cells infected by pLKO.shRab27a or pLKO.shRab27b virus by BCA assay (normalized to total cell numbers) (mean ± s.e.m., t-test, P<0.001, 3 biological replicates, with 3 technical replicates each). f-g. IHC analysis showing the expression level of Rab27a, Rab27b (f) and exosome marker expression CD63 (g) in the brain tissue derived from mice injected with control lentivirus or Rab27a/b shRNA lentiviruses and subsequently intracranially injected with B16BL6 cells. h-i. IHC analysis showing the expression level of Rab27a and Rab27b (h) and exosome marker expression CD63 (i) in the brain tissue derived from mice injected with Rab27a/b shRNA lentiviruses and subsequently intracranially injected with B16BL6 cells with vehicle or B16BL6 cells with astrocyte derived exosomes.
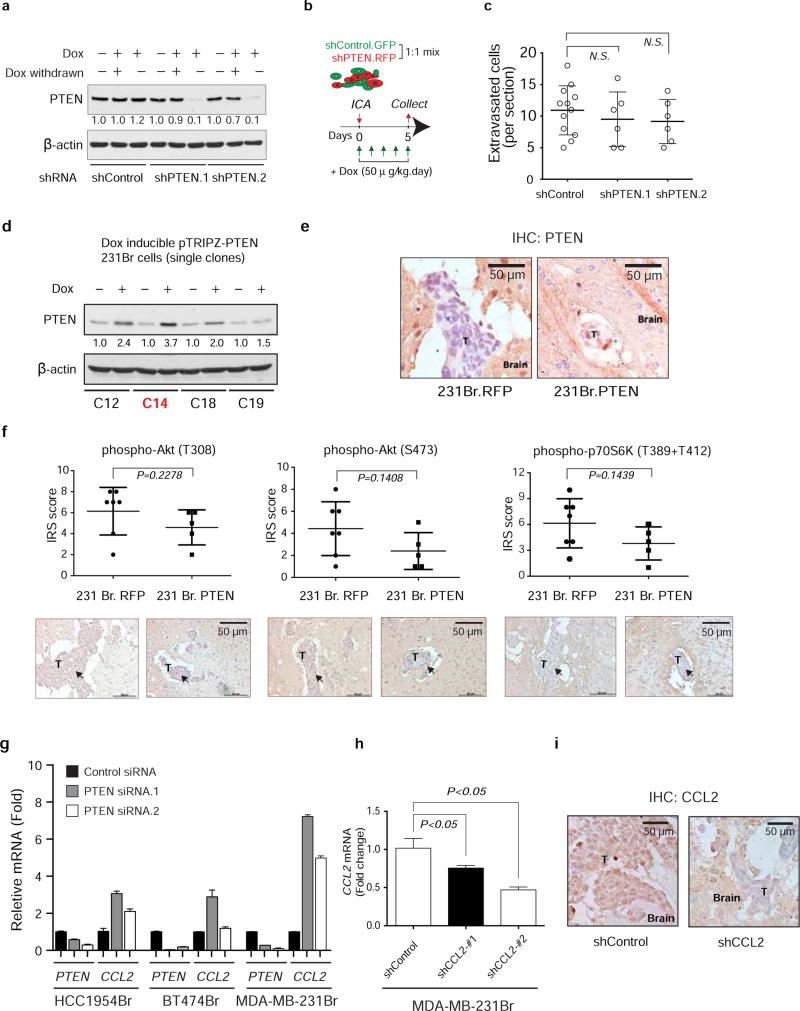
Extended Data Figure 6. Brain extravasation of MDA-MB-231 parental cells with or without induction of Dox-inducible PTEN shRNA knockdown, PTEN expression and CCL2 shRNA knockdown.
a, Western blot showing PTEN expression levels after treating MDA-MD-231 cells with doxycycline (Dox). MDA-MD-231 cells were stably infected with inducible shRNA expression vectors (pTRIPZ-Control.sh.GFP as control and pTRIPZ.shRNA.RFP for PTEN shRNA). Dox (1 μg/ml) was added to induce shRNA expression for five days. As indicated, Dox were withdrawn in some samples for another five days before analysis. b, Schematics of in vivo extravasation assay. shControl.GFP and shPTEN.RFP cells were mixed at 1:1 ratio. Total 200,000 cells were injected intracarotidly into mice. Dox (50 μg/kg) was given to mice intraperitoneally daily. Brains were collected 5 days after injection. ICA: intracarotid injection. c, Dot-plot of extravasated cell counts five days after intracarotid injection of indicated MDA-MB-231 sublines. Tumor bearing brains were collected and sectioned into 100 μm brain coronal slices. The extravasated tumor cells were counted under the fluorescence microscope (mean ± s.d., t-test). d, MDA-MB-231Br single cells were expanded into subclones (C12, C14, C18, and C19) which were transfected with Dox-inducible pTRIPZ.RFP or pTRIPZ.PTEN. 48 hours after Dox (1μg/mL) treatment, PTEN induction was tested by western blotting. C14 clone were used for further in vivo assays (see Fig. 4a, and Extended Data 6e-f). e, Induced PTEN expression in brain metastases. IHC staining of PTEN expression levels in brain metastases derived from mice injected with MDA-MB-231Br (231Br. RFP or 231Br. PTEN) cells. T: brain metastasis tumors at day 30 post intracarotid injection. f, IHC analysis of PTEN downstream singling pathway, including phospho-Akt(T308), phospho-Akt(S473) and phospho-P70S6K(T389+T412) in brain metastases from mice injected with 231Br.RFP versus 231Br.PTEN cells. Top, dot-plot of IHC data quantification by immuno-reactive score (IRS) (mean ± s.d., t-test); bottom, representative IHC staining data. T: brain metastasis tumors at day 30 post intracarotid injection. g, Histograms of PTEN and CCL2 mRNA levels (mean ± s.e.m., t-test) in indicated cancer cell lines 48 hours after transfection with control or PTEN siRNAs. h, Histogram showing the inducible CCL2 knockdown. MDA-MB-231Br cells were stably infected with pTRIPZ inducible CCL2 shRNAs. 48 hours after Dox (1μg/ml) treatment, CCL2 mRNA was examined by RT-PCR (mean ± s.e.m., t-test). i, Dox-induced CCL2 knockdown in brain metastases. Mice were ICA injected with MDA-MB-231Br cells harboring control or CCL2 shRNAs. Dox (50 μg/kg) was given to mice intraperitoneally daily after injection. IHC staining of CCL2 expression levels in brain metastases derived from MDA-MB-231Br cells. T: brain metastasis tumors at day 30 post intracarotid injection.
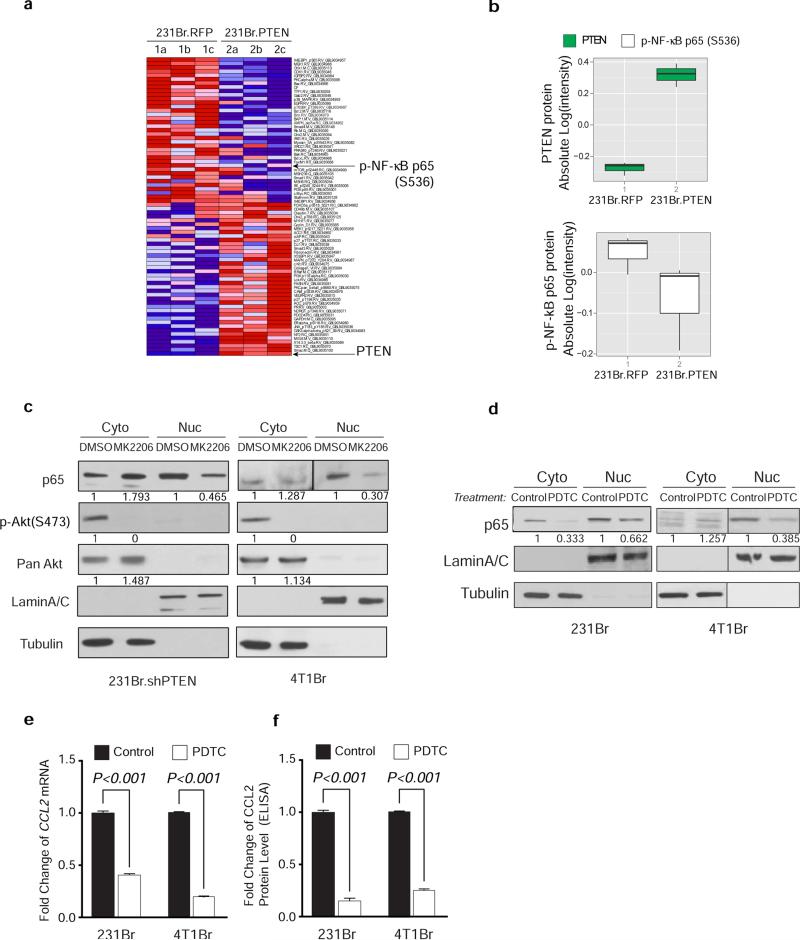
Extended Data Figure 7. PTEN-regulated CCL2 expression through NFκB pathway.
a, Heatmap showing differentially expressed protein markers of Reverse Phase Protein Array (RPPA) analysis. Dox-inducible pTRIPZ.RFP or pTRIPZ.PTEN cells. MDA-MB-231Br were stably infected with pTRIPZ.RFP or pTRIPZ.PTEN (231Br. RFP or 231Br. PTEN) and induced by Dox (1μg/mL) for 48 hours. b, Box chart showing the absolute intensity of PTEN and NF-κB p65 (S536). c, Western blot analysis of NF-κB p65 nuclear translocation after Akt inhibitor (MK2206) treatment. Cells were treated with MK2206 (10 μg/mL) 24 hours before being separated into cytosol (Cyto) and nuclear (Nuc) fraction. d, Western blot analysis of NF-κB p65 nuclear translocation after NF-κB inhibitor PDTC treatment. Cells were treated with PDTC (0.2 mM) 16hours before being separated into cytosol (Cyto) and nuclear (Nuc) fraction. e, Relative CCL2 mRNA expression after NF-κB inhibitor PDTC treatment analyzed by qPT-PCR (mean ± s.e.m., t-test). Cells were treated with PDTC (0.2 mM) 16 hours. f, Relative CCL2 protein expression after NF-κB inhibitor PDTC treatment analyzed by ELISA (mean ± s.e.m., t-test). Cells were treated the same as (e).
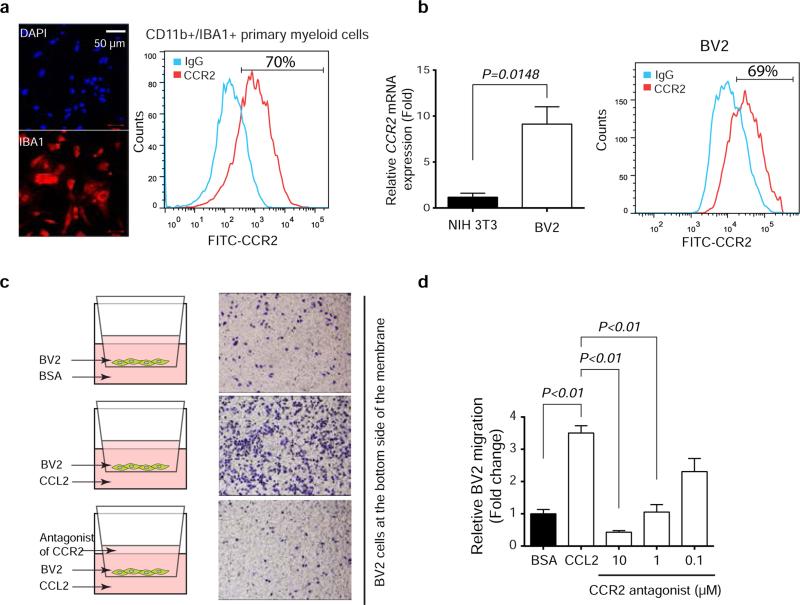
Extended Data Figure 8. CCR2-mediated Iba1+ myeloid cell directional migration.
a, Co-expression of Iba1 and CCR2 on myeloid cells freshly isolated from mouse brain by CD11b beads. Representative picture of immunofluorescence staining of Iba1 (left). FACS analysis of CD11b-positive cells for CCR2 expression. b, Relative CCR2 expression in the BV2 microglia cell line compared with NIH 3T3 fibroblasts. CCR2 mRNA level was analyzed by qRT-PCR (mean ± s.e.m., t-test) (left) and protein expression was analyzed by FACS (right). c, Transwell migration assay examining the directional migration of BV2 cells toward CCL2. 105 BV2 cells were seeded in the top chamber of the transwell units and CCL2 or BSA (20ng/ml) was added into serum-free media in the bottom chamber. The migrated cell numbers were counted at 24h. Next, CCR2 antagonists with different concentrations (10uM, 1uM, 0.1uM) were added into the top chamber with BV2 cells, and CCL2 (20ng/ml) was added into serum-free media in the bottom chamber. The migrated cell numbers were counted at 24h. d, Quantification of BV2 cell migration assay (means ± s.e.m., t-test).
Extended Data Figure 9. The association between PTEN, CCL2 expression and recruitment of Iba-1+ myeloid cells in patients’ brain metastases and matched primary breast tumors.
a, Summary histogram of CCL2 protein levels in primary breast tumors and matched brain metastases from 35 patients. Chi-square test was used to compare IHC score in primary breast tumors versus matched brain metastases. p<0.05 is defined as significantly different. b, Tables showing IHC scores of PTEN and CCL2 expression in primary breast tumors and matched brain metastases. c, Representative IHC staining of CCL2 proteins and Iba1+ myeloid cells in patients’ brain metastases, and the correlation plot showing the Pearson correlation between CCL2 and Iba1 staining in patients’ brain metastases.
Extended Data Figure 10. PTEN loss induced by astrocyte-derived exosomal microRNA primes brain metastasis outgrowth via functional cross-talk between disseminated tumor cells and brain metastatic microenvironment.
Top: Disseminated tumor cells extravasate into the brain. Bottom: a-c, Exosomes secreted by astrocytes in the brain microenvironment transfer PTEN-targeting miRNA into extravasated brain metastatic tumor cells leading to PTEN down-regulation in tumor cells. c-d, PTEN loss in brain metastatic tumor cells increases their CCL2 secretion, facilitating recruitment of Iba1+/CCR2+ myeloid cells at the micrometastasis site. d-e, The recruited Iba1+ myeloid cells enhance proliferation and inhibit apoptosis of metastatic tumor cells, and promote metastatic outgrowth.
Acknowledgement
We thank M.-C. Hung, H.-K. Lin, Z. Lu for reading the manuscript, A. Yung for PTEN promoter constructs, MDACC shRNA and ORFome, FACS, histology, high resolution electron microscopy, and animal core facilities (NIH CA16672) for technical support and members of the Yu laboratory for helpful discussions. Thanks to Dr Admire Matsika for histological review and TMA construction. This work was supported partially by DOD Center of Excellence grant (PS) subproject W81XWH-06-2-0033 (DY), NIH Pathway to Independence Award 5R00CA158066-05 (SZ), DOD Postdoctoral Fellowship W81XWH-11-1-0003 (CZ), Isaiah Fidler Fellowship in Cancer Metastasis (FJL), PO1-CA099031 project 4 (DY), RO1-CA112567-06 (DY), R01CA184836 (DY), Susan G. Komen Breast Cancer Foundation Promise Grant KG091020 (DY), METAvivor Research Grant (DY), Breast and Ovarian Cancers Moon Shot program, China Medical University Research Fund, and Sowell-Huggins Pre-doctoral Fellowship (LZ) and Professorship (DY) in Cancer Research. D. Yu is the Hubert L. & Olive Stringer Distinguished Chair in Basic Science at MDACC.
Footnotes
Disclosure of Potential Conflicts of Interest: No potential conflicts of interest are disclosed.
Author contribution
L.Z., S.Z. and D.Y. developed original hypothesis and designed experiments. L.Z., S.Z., J.Y., F.L., Q.Z., W.-C. H., P.L., M.L., X.W., C.Z., K.E., H.W., D. P., M.C., J. M., P.S., D.Y. performed experiments and/or analyzed data. J.S., S.L., S.H., A.S., K.A., P.S. provided critical reagents and/or clinical samples. S.Z., L.Z., F.L, D.Y. wrote and edited the manuscript. D.Y. supervised the study.
The authors declare no competing financial interests.
Supplementary information is linked to the online version of the paper at www.nature.com/nature.
References
- 1.Quail DF, Joyce JA. Microenvironmental regulation of tumor progression and metastasis. Nat. Med. 2013;19:1423–1437. doi: 10.1038/nm.3394. [DOI] [PMC free article] [PubMed] [Google Scholar]
- 2.Park ES, et al. Cross-species hybridization of microarrays for studying tumor transcriptome of brain metastasis. Proc. Natl. Acad. Sci. 2011;108:17456–17461. doi: 10.1073/pnas.1114210108. [DOI] [PMC free article] [PubMed] [Google Scholar]
- 3.Joyce JA, Pollard JW. Microenvironmental regulation of metastasis. Nat. Rev. Cancer. 2009;9:239–252. doi: 10.1038/nrc2618. [DOI] [PMC free article] [PubMed] [Google Scholar]
- 4.Vanharanta S, Massagué J. Origins of Metastatic Traits. Cancer Cell. 2013;24:410–421. doi: 10.1016/j.ccr.2013.09.007. [DOI] [PMC free article] [PubMed] [Google Scholar]
- 5.Gray J. Cancer: Genomics of metastasis. Nature. 2010;464:989–990. doi: 10.1038/464989a. [DOI] [PubMed] [Google Scholar]
- 6.Friedl P, Alexander S. Cancer Invasion and the Microenvironment: Plasticity and Reciprocity. Cell. 2011;147:992–1009. doi: 10.1016/j.cell.2011.11.016. [DOI] [PubMed] [Google Scholar]
- 7.Zhang S, et al. Combating trastuzumab resistance by targeting SRC, a common node downstream of multiple resistance pathways. Nat. Med. 2011;17:461–469. doi: 10.1038/nm.2309. [DOI] [PMC free article] [PubMed] [Google Scholar]
- 8.Gonzalez-Angulo AM, et al. PI3K pathway mutations and PTEN levels in primary and metastatic breast cancer. Mol. Cancer Ther. 2011;10:1093–1101. doi: 10.1158/1535-7163.MCT-10-1089. [DOI] [PMC free article] [PubMed] [Google Scholar]
- 9.Wikman H, et al. Relevance of PTEN loss in brain metastasis formation of breast cancer patients. Breast Cancer Res. 2012;14:R49. doi: 10.1186/bcr3150. [DOI] [PMC free article] [PubMed] [Google Scholar]
- 10.Song MS, Salmena L, Pandolfi PP. The functions and regulation of the PTEN tumour suppressor. Nat. Rev. Mol. Cell Biol. 2012;13:283–296. doi: 10.1038/nrm3330. [DOI] [PubMed] [Google Scholar]
- 11.Hopkins BD, et al. A Secreted PTEN Phosphatase That Enters Cells to Alter Signaling and Survival. Science. 2013;341:399–402. doi: 10.1126/science.1234907. [DOI] [PMC free article] [PubMed] [Google Scholar]
- 12.Miething C, et al. PTEN action in leukaemia dictated by the tissue microenvironment. Nature. 2014;510:402–406. doi: 10.1038/nature13239. [DOI] [PMC free article] [PubMed] [Google Scholar]
- 13.Mecha M, et al. An easy and fast way to obtain a high number of glial cells from rat cerebral tissue: A beginners approach. 2011 < http://dx.doi.org/10.1038/protex.2011.218>.
- 14.Zhu H, Han C, Lu D, Wu T. miR-17-92 cluster promotes cholangiocarcinoma growth: evidence for PTEN as downstream target and IL-6/Stat3 as upstream activator. Am. J. Pathol. 2014;184:2828–2839. doi: 10.1016/j.ajpath.2014.06.024. [DOI] [PMC free article] [PubMed] [Google Scholar]
- 15.Liu S-Q, Jiang S, Li C, Zhang B, Li Q-J. miR-17-92 cluster targets phosphatase and tensin homology and Ikaros Family Zinc Finger 4 to promote TH17-mediated inflammation. J. Biol. Chem. 2014;289:12446–12456. doi: 10.1074/jbc.M114.550723. [DOI] [PMC free article] [PubMed] [Google Scholar]
- 16.Olive V, et al. miR-19 is a key oncogenic component of mir-17-92. Genes Dev. 2009;23:2839–2849. doi: 10.1101/gad.1861409. [DOI] [PMC free article] [PubMed] [Google Scholar]
- 17.Olive V, Jiang I, He L. mir-17-92, a cluster of miRNAs in the midst of the cancer network. Int. J. Biochem. Cell Biol. 2010;42:1348–1354. doi: 10.1016/j.biocel.2010.03.004. [DOI] [PMC free article] [PubMed] [Google Scholar]
- 18.Ventura A, et al. Targeted deletion reveals essential and overlapping functions of the miR-17 through 92 family of miRNA clusters. Cell. 2008;132:875–886. doi: 10.1016/j.cell.2008.02.019. [DOI] [PMC free article] [PubMed] [Google Scholar]
- 19.Mittelbrunn M, et al. Unidirectional transfer of microRNA-loaded exosomes from T cells to antigen-presenting cells. Nat. Commun. 2011;2:282. doi: 10.1038/ncomms1285. [DOI] [PMC free article] [PubMed] [Google Scholar]
- 20.Suetsugu A, et al. Imaging exosome transfer from breast cancer cells to stroma at metastatic sites in orthotopic nude-mouse models. Adv. Drug Deliv. Rev. 2013;65:383–390. doi: 10.1016/j.addr.2012.08.007. [DOI] [PubMed] [Google Scholar]
- 21.Krämer-Albers E-M. Emerging roles of exosomes in neuron–glia communication. Front. Membr. Physiol. Membr. Biophys. 2012;3:119. doi: 10.3389/fphys.2012.00119. [DOI] [PMC free article] [PubMed] [Google Scholar]
- 22.Kesimer M, et al. Characterization of exosome-like vesicles released from human tracheobronchial ciliated epithelium: a possible role in innate defense. FASEB J. 2009;23:1858–1868. doi: 10.1096/fj.08-119131. [DOI] [PMC free article] [PubMed] [Google Scholar]
- 23.Peinado H, et al. Melanoma exosomes educate bone marrow progenitor cells toward a prometastatic phenotype through MET. Nat. Med. 2012;18:883–891. doi: 10.1038/nm.2753. [DOI] [PMC free article] [PubMed] [Google Scholar]
- 24.Conti I, Rollins BJ. CCL2 (monocyte chemoattractant protein-1) and cancer. Semin. Cancer Biol. 2004;14:149–154. doi: 10.1016/j.semcancer.2003.10.009. [DOI] [PubMed] [Google Scholar]
- 25.Qian B-Z, et al. CCL2 recruits inflammatory monocytes to facilitate breast-tumour metastasis. Nature. 2011;475:222–225. doi: 10.1038/nature10138. [DOI] [PMC free article] [PubMed] [Google Scholar]
- 26.Bonapace L, et al. Cessation of CCL2 inhibition accelerates breast cancer metastasis by promoting angiogenesis. Nature. 2014;515:130–133. doi: 10.1038/nature13862. [DOI] [PubMed] [Google Scholar]
- 27.Lu J, et al. 14-3-3zeta Cooperates with ErbB2 to promote ductal carcinoma in situ progression to invasive breast cancer by inducing epithelial-mesenchymal transition. Cancer Cell. 2009;16:195–207. doi: 10.1016/j.ccr.2009.08.010. [DOI] [PMC free article] [PubMed] [Google Scholar]
- 28.Nagata Y, et al. PTEN activation contributes to tumor inhibition by trastuzumab, and loss of PTEN predicts trastuzumab resistance in patients. Cancer Cell. 2004;6:117–127. doi: 10.1016/j.ccr.2004.06.022. [DOI] [PubMed] [Google Scholar]
- 29.Zhang S, et al. Src Family Kinases as Novel Therapeutic Targets to Treat Breast Cancer Brain Metastases. Cancer Res. 2013;73:5764–5774. doi: 10.1158/0008-5472.CAN-12-1803. [DOI] [PMC free article] [PubMed] [Google Scholar]
- 30.Gril B, et al. Effect of Lapatinib on the Outgrowth of Metastatic Breast Cancer Cells to the Brain. J. Natl. Cancer Inst. 2008;100:1092–1103. doi: 10.1093/jnci/djn216. [DOI] [PMC free article] [PubMed] [Google Scholar]


