Abstract
Mutants of cellular retinoic acid-binding protein II (CRABPII), engineered to bind all-trans-retinal as an iminium species, demonstrate photochromism upon irradiation with light at different wavelengths. UV light irradiation populates the cis-imine geometry, which has a high pKa, leading to protonation of the imine and subsequent “turn-on” of color. Yellow light irradiation yields the trans-imine isomer, which has a depressed pKa, leading to loss of color because the imine is not protonated. The protein-bound retinylidene chromophore undergoes photoinduced reversible interconversion between the colored and uncolored species, with excellent fatigue resistance.
Keywords: imines, isomerization, photochemistry, protein engineering, retinal
Introduction
Photochromic proteins, although rare in the totality of the proteome, play key roles in essential biological processes, such as photosynthesis, phototaxis, energy production, and visual perception.[1] Amongst these proteins, the rhodopsins share a unique characteristic: the photoisomerization of the retinylidene chromophore (or one of its closely related analogues).[2] Principally, these carbon–carbon double-bond isomerization events are coupled to the ultimate function of the protein. Interestingly, the iminium species (otherwise known as the protonated Schiff base, PSB) formed between the retinal aldehyde functionality and an active site Lys residue undergoes a drastic pKa change as the consequence of the isomerization in most systems. A well-studied example is bacteriorhodopsin: a 26 kDa photosynthetic protein that functions as a light-driven proton pump in Halobacterium halobium.[3] The all-trans-retinal chromophore, responsible for the absorption of light, is bound through a PSB to Lys216.[4] Illumination with visible light initiates an ultrafast isomerization of the bound all-trans-retinal to the 13-cis isomer (Scheme 1A).[2f,5] The change in the environment of the iminium species, as a result of the isomerization, leads to a dramatic change in its pKa (13.3 for all-trans isomer, reduced by 4–5 pKa units upon isomerization[6]), with the eventual translocation of a proton across the membrane.[7]
Scheme 1.
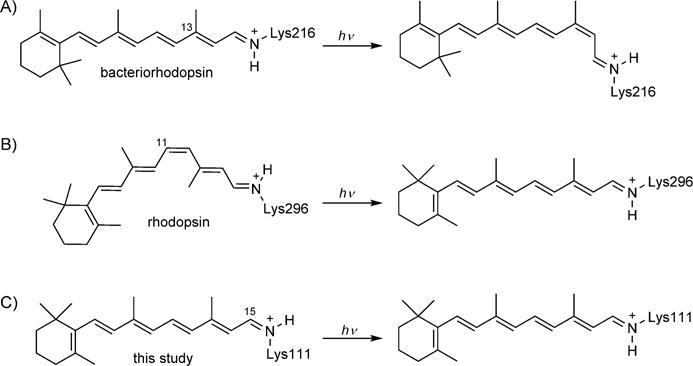
Isomerizations of retinal isomers in A) bacteriorhodopsin, B) rhodopsin, and C) rhodopsin mimics in this study.
Rhodopsin, the light-activated G protein-coupled receptor, the engine of vertebrate vision, possesses a similar mechanism. The difference, however, is that rhodopsin activation relies on the isomerization of the PSB of 11-cis-retinal, bound to Lys296,[8] which yields a strained all-trans-retinal configuration in the sub-nanosecond time regime (Scheme 1B).[5f,9] Subsequent thermal relaxations eventually lead to the metarhodopsin II state (which initiates the visual transduction pathway), in which the initial PSB, with a high estimated pKa>16, is deprotonated.[2e,9,10] The significant change in the pKa of the imine functionality is again the consequence of the isomerization that changes the environment of the imine nitrogen atom. As described below, our recent efforts in generating rhodopsin protein mimics[11] have also provided the opportunity to produce engineered proteins that recapitulate the change in the pKa of the iminium functionality as a function of isomerization.[12] Here we disclose a protein system that is capable of light-activated isomerization, with concomitant changes to the pKa of the PSB. Specifically, we report for the first time a rhodopsin mimic that can be reversibly photocycled between a protonated cis-iminium species and its deprotonated trans-imine with >4 pKa unit change (Scheme 1C).
Our efforts began with an observation reported previously during our optimization studies for the design of a colorimetric proteinaceous pH sensor.[12] Cellular retinoic acid-binding protein II (CRABPII) was reengineered to bind all-trans-retinal as a PSB. We were not only able to show wavelength regulation in absorption, as a function of perturbing electrostatic potential across the length of the chromophore, but were also successful in modulating the pKa of the iminium species from 2.4 to 8.1. Unexpectedly, a series of mutants exhibited apparent time-dependent conversion of the PSB (λmax>450 nm) to the Schiff base (SB, λmax=360 nm); this was ascribed to an event that must have changed the pKa of the iminium species. In most cases, the observed deprotonation occurred quickly. Fortuitously, the retinal-bound R111K:R132L:Y134F:T54V:R59W-CRABPII penta-mutant exhibited a slow conversion (complete within 2 h), thus enabling pKa measurement of each state to be made independently (Figure 1A). The pKa of the initial species formed with the addition of retinal was 6.6. Gradual loss of the red-shifted PSB peak, concurrent with the rise of the SB absorption, led to a new species, the pKa of which was 2.5.
Figure 1.
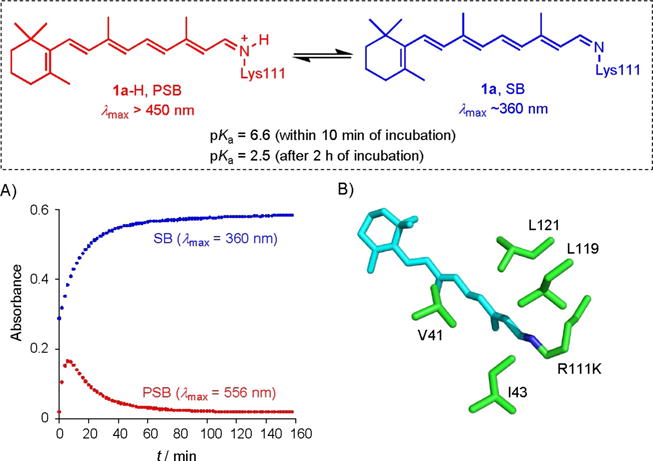
A) Rates of SB and PSB formation, highlighting the initial buildup in PSB followed by its time-dependent conversion into the SB. B) Truncated crystal structure of R111K:R132L:Y134F:T54V:R59W-CRABPII (PDB ID: 4I9S), illustrating the trans-imine surrounded by hydrophobic residues.
The previously obtained crystal structure of the matured protein complex (pKa=2.5),[12] shows a trans imine geometry (Figure 1B). The imine nitrogen atom is surrounded with aliphatic amino acid residues, presumably leading to the low observed pKa (2.5) to avoid buildup of charge in a hydrophobic environment. The latter observations led us to hypothesize that the initial complex exhibiting high pKa must be an isomeric variant (kinetic product), which over time yields the crystallographically observed thermodynamic product. This presumes that the initial isomeric geometry places the imine nitrogen in an environment that can support a positive charge.
Results and Discussion
Identification of the isomeric states of retinal
We hypothesized that the conversion between the two forms stems from the cis–trans isomerization of the imine, as shown in Scheme 2. This was further supported by HPLC analysis of the chromophore. Similar retention times were obtained when all-trans-retinal was incubated in 0.2m citric acid buffer and when incubated with R111K:R132L:Y134F:T54V:R59W-CRABPII, thus indicating that the isolate was all-trans-retinal in both cases (see below). This further supports the hypothesis of varying isomeric states at the imine, rather than a C=C bond isomerization, which would have led to isomeric retinal species with dissimilar retention times in HPLC. Figure 2 details the HPLC traces of all-trans-retinal incubated in the absence or presence of R111K:R132L:Y134F:T54V:R59W-CRABPII.
Scheme 2.
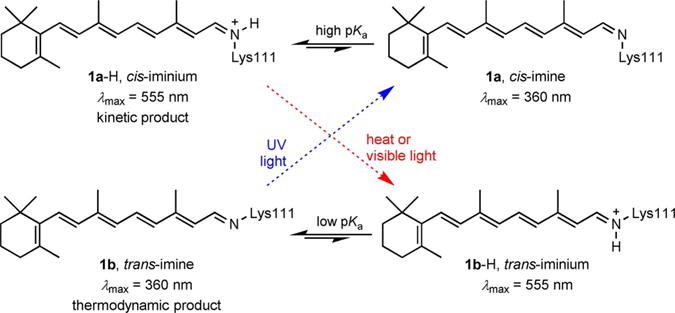
Proposed cycle for imine isomerization.
Figure 2.
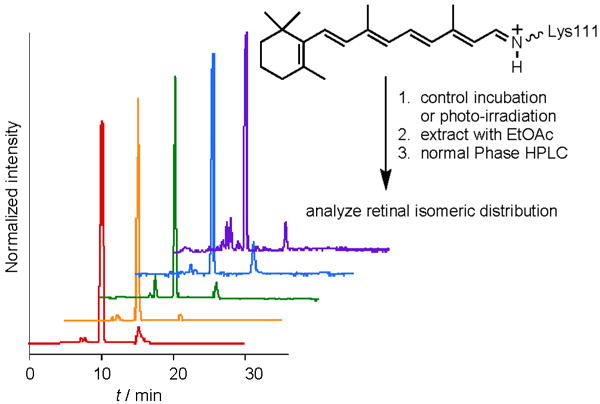
HPLC traces of: extracted all-trans-retinal incubated for 2 min in 0.2M citric acid buffer (red), all-trans-retinal incubated for 2 h in 0.2M citric acid buffer (orange), all-trans-retinal incubated with R111K:R132L:Y134F: T54V:R59W-CRABPII for 2 h (green), all-trans-retinal incubated with R111K: R132L:Y134F:T54V:R59W-CRABPII for 2 h and then UV irradiated for 1 min (blue), and all-trans-retinal incubated with R111K:R132L:Y134F:T54V:R59W-CRABPII for 2 h and then irradiated with yellow light for 15 min (purple).
Thermal isomerization of the retinylidene chromophore
The observed loss of the PSB peak for the R111K:R132L:Y134F:T54V:R59W-CRABPII·retinal complex occurs in the absence of light. Therefore, the presumed imine isomerization, concurrent with the loss of a proton, is thermally activated. In fact, as depicted in Figure 3, the rate of isomerization, in the dark, is temperature-dependent, with longer t1/2 at 6.9°C and shorter t1/2 at 30.5°C (Figure S2 in the Supporting Information).
Figure 3.
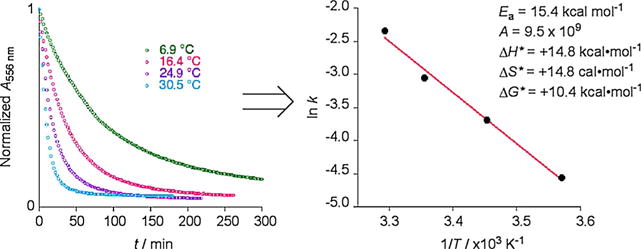
PSB conversion into the SB is temperature-dependent for the R111K:R132L:Y134F:T54V:R59W-CRABPII·retinal complex. The different rates yield the Arrhenius plot as shown.
Elucidation of the thermal isomerization mechanism
Further examination of the initially observed thermal isomerization led to a potential mechanism for isomerization from the presumed cis-iminium species 1a-H to the trans-imine 1b, depicted in Scheme 3. We propose the reversible addition of water to 1a-H, leading to the hemiaminal 2, which, upon single bond rotation to 3 and loss of water, yields the trans-iminium species 1b-H. This is promptly deprotonated as a result of the highly nonpolar nature of the new imine environment. The following lines of evidence support the mechanism described above.
Scheme 3.

Proposed mechanism for the thermal isomerization of the iminium species from the putative cis geometry and subsequent deprotonation to afford the crystallographically observed trans-imine.
As illustrated in Figure 3, rates of thermal isomerization are temperature-dependent. The Arrhenius plot for the temperature dependence of k (pseudo-first-order) yields the following thermodynamic parameters (see Figures S3 and S4 for graphs): Ea=15.4 kcalmol−1, A=9.5×10⁹ and ΔH*=+14.8 kcalmol−1, ΔS*=+14.8 calmol−1K−1, and ΔG*=+10.4 kcalmol−1 (at pH 5.2 and 25°C). These values are in good agreement with previously reported thermal isomerization parameters of various other synthetic imines in aqueous solvent,[13] thus suggesting that enzyme-like catalysis is most probably not at play.
Figure 4A depicts a pH/rate profile for the thermal decay of the PSB to the SB, measured in solutions of constant ionic strength (0.2M citric acid; note that these are specific acid catalysis conditions; see Figure S6 for kinetic data at different pH values) and temperature (25°C). The increase in rate, apparent below pH 5, suggests that the change in the protonation state of a nearby acidic residue (pKa≈4) could be responsible for accelerating the isomerization. Note that the imine is protonated at pH 5 and below (pKa=6.6).[12] The only acidic residue with its side chain pointing into the interior of the binding cavity is Glu73. One can surmise that the protonation of Glu73 could reduce the barrier to the hydration of the iminium species. As depicted in Figure 4B, this could be the result of anionic stabilization originating from the glutamate–iminium interaction, which is reduced upon protonation of Glu73. Interestingly, all E73A mutants investigated exhibit low iminium pKa values.[12] Putatively, the absence of Glu73 reduces the barrier for isomerization such that the trans-imine is the only observable species.
On the basis of the suggested mechanism in Scheme 3, one would not expect a large deuterium isotope effect because deprotonation is not presumed to be rate-determining. In fact, rates of thermal isomerization measured in H2O- and D2O-based buffers showed no significant differences (Figure S5).[14]
Figure 4.
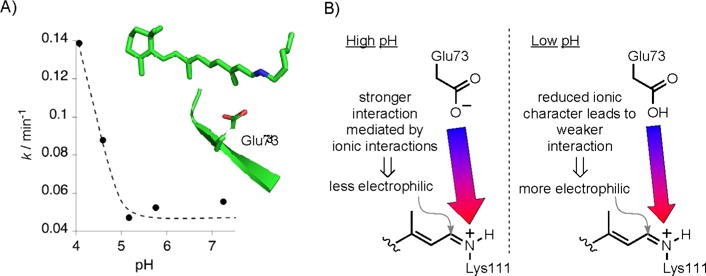
A) The rate of PSB decay to the SB is pH-dependent. Glu73, highlighted in the truncated structure, is the only amino acid in the vicinity of the imine with the appropriate pKa for the change in protonation state in the pH regime that alters the rate of the reaction. B) Possible scenario for the less active iminium species at high pH (ionic interaction resulting in a more stabilized iminium species). The protonation of Glu73 reduces the anionic charge stabilization, thus activating the iminium species towards addition of water.
Taken together, these observations suggest that addition of water to the imine to generate the tetrahedral intermediate is rate-determining. Nonetheless, the photoinduced isomerization of either the SB or PSB (see below) certainly is not bound by the mechanistic discussions above, and is currently the focus of further studies.
Photochemical isomerization of the retinylidene chromophore
We were delighted to discover that the thermal isomerization, requiring 2 h at 25°C for completion, could be greatly accelerated with visible light irradiation. As depicted in Figure 5A, 15 min irradiation with yellow light fully eradicated the PSB peak at 556 nm, concomitantly with maximum growth of the SB peak at 362 nm. This observation illustrates a light-induced isomerization pathway that is specific and unique to the imine functionality.
Figure 5.
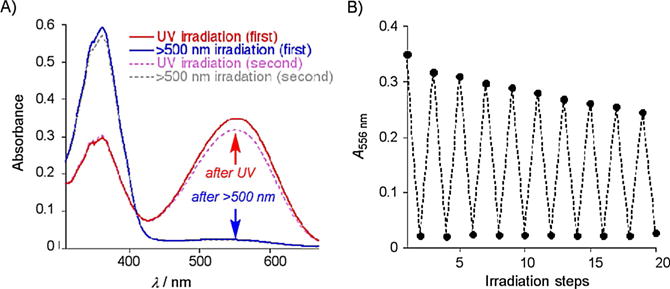
A) UV/Vis traces after iterative UV and visible light (>500 nm) irradiation of the R111K:R132L:Y134F:T54V:R59W-CRABPII·retinal complex. B) Absorbance at 556 nm measured after 20 cycles of alternating UV and visible light irradiation.
Gratifyingly, UV light irradiation (<360 nm) of the thermally equilibrated protein complex (low pKa, trans-imine) led to a fast restoration of the kinetically observed high-pKa species (complete within 1 min), evident from the change in the absorption spectrum (loss of the SB peak and gain of the red-shifted PSB peak, Figure 5A). The opposite behavior was observed when the SB-maximized complex, obtained through UV light irradiation as described above, was photoisomerized with yellow light (>500 nm). These observations led us to propose the cycle depicted in Scheme 2. The cis isomer 1a-H, exhibiting a high pKa, and thus protonated with an absorption above 500 nm, is thermally unstable and converts into the trans-iminium species 1b-H. The trans-iminium species is not able to support the protonated state at pH 7.2 (low-pKa isomer) and therefore reverts to the SB form 1b that absorbs at <380 nm. The latter thermal isomerization is photoinducible, with yellow light irradiation (>500 nm). The cycle is completed with UV light irradiation that restores the original cis-imine 1a, which now protonates to form 1a-H as a result of the change in the pKa of the system.
We next investigated the possibility of repeated cycling of the complex to operate as a photoinducible switch. Fatigue resistance is crucial in assessing the potential usefulness of photochromic material.[15] It is desirable to see a reproducible return to the original state of a system upon repeated cycling, without significant loss in signal, or otherwise maintaining a large difference in signal between the two interconverting states. Rapid and complete cycling with UV and yellow light was reproduced several times (as measured by the intensity of absorption, Figure 5B), demonstrating that little light-induced degradation occurs in each cycle. The initial cycle leads to a higher percentage loss as measured by the absorption of the PSB peak (9.2%); however, the average loss is 3.2% per cycle thereafter. More importantly, as can be seen in Figure 5B, the difference in absorption between each state remains large, and thus could be differentiated with ease. We attribute the larger initial loss of intensity to singlet-oxygen-mediated bleaching due to the presence of dissolved molecular oxygen. The protein solutions utilized for fatigue resistance studies had been crudely degassed. In the absence of degassing, the initial drop in intensity was 18.9%, with subsequent average losses of 3.8% per cycle.
Subsequent to the multiple rounds of photoisomerization, the chromophore was extracted at both the SB and PSB stages and analyzed by HPLC (Figure 2, blue and purple traces). The results show only the presence of all-trans-retinal, thus further verifying the lack of C=C bond isomerization and the structural resilience of the chromophore during the process.
Application to another iLBP—hCRBPII
Having shown that the photoisomerization of the retinylidene SB can be achieved photochemically with UV and visible light in CRABPII mutants, we sought to determine whether the same process could be observed in a related protein, human cellular retinol binding protein II (hCRBPII). Both CRABPII and hCRBPII belong to the superfamily of intracellular lipid-binding proteins (iLBPs). These two proteins possess similar tertiary structures, each consisting of a ten-stranded antiparallel β-barrel enclosing an internal ligand-binding pocket, with two α-helices capping the pocket. As such, we hypothesized that with variants engineered to bind the same chromophore retinal, the light-induced isomerization of the imine could occur in hCRBPII, as similarly observed in CRABPII.
Q108K:K40L:T51V:R58F hCRBPII tetra-mutant, optimized to form a PSB with all-trans-retinal,[11k] showed remarkably similar behavior. Green light irradiation of the PSB populated the blue-shifted SB state, whereas UV irradiation of the SB maximized the levels of PSB. Nonetheless, in contrast to the behavior discussed above for CRABPII, retinal-bound hCRBPII complex possessed a stable PSB that did not convert over time into the SB. Each state is thermally stable (at room temperature); the trigger for imine isomerization requires light. Cycling of the retinal-bound hCRBPII tetra-mutant showed good fatigue resistance for cycling between the trans-imine and the cis-iminium species (Figure S7).
Although there could be multiple reasons for the difference in behavior, we are tempted to attribute the thermally stable nature of hCRBPII mutants to the greater distance between E72 (E73 in the CRABPII series) and the iminium nitrogen atom. The distance between E72 and the iminium species is 10.9 Å (in comparison with 9.3 Å in CRABPII), thus attenuating its electrostatic influence (see Figure S8 for an overlay of the two proteins).
Conclusions
The results disclosed here demonstrate temperature- and light-dependent isomerization of an iminium bond formed between all-trans-retinal and an active-site Lys residue in an engineered rhodopsin protein mimic. The isomerization can be cycled between each state repetitively. Evidence gathered thus far has not indicated any C=C bond isomerization, thus suggesting selective isomerization of the imine bond. This system provides a unique platform to study the isomerization of an imine bond with complete control. This SB/PSB interconversion might also show potential as a photoswitchable protein quencher or in artificial proton pump designs.
Experimental Section
General
UV/Vis spectra were recorded with a Cary 100 Bio WinUV, Varian spectrophotometer. All-trans-retinal was purchased from Sigma–Aldrich and was used as received. pET17b plasmid containing the previously designed R111K:R132L:Y134F:T54V:R59W-CRABPII penta-mutant was expressed in BL21(DE3)pLysS competent cells, and the protein was purified as described before.[12] The absorption extinction coefficient (ε) for R111K:R132L:Y134F:T54V:R59W-CRABPII was reported previously (25038M−1cm−1).[12]
The pET-17b plasmid including the Q108K:K40L:T51V:R58F-hCRBPII tetra-mutant was obtained by site-directed mutagenesis of the pET-17b plasmid containing Q108K:K40L:T51V-hCRBPII with use of the following primers: forward primer 5′-CTAGC ACATT CTTCA ACTAT GATGT G-3′ and reverse primer 5′-CACAT CATAG TTGAA GAATG TGCTA G-3′, under PCR conditions previously reported.[11k] The tetra-mutant was expressed in BL21(DE3)pLysS competent cells, and the protein was purified as described before.[11k] The e value for Q108K:K40L:T51V:R58F-hCRBPII was found to be 25038M−1cm−1, measured by a method previously reported by Gill and von Hippel.[16]
For light irradiation of samples, an Oriel Illuminator (Model 66142, Oriel Instruments) connected to a power supply [Model 668820, Oriel Instruments, 500 W Mercury (Xenon) lamp] was used. For all light irradiations, a combination of two filters was used. One of these was always a glass filter (6 mm thickness, Figure S1C) to filter UV light below ≈320 nm, and the second was either of the following: for UV irradiations, a U-360 (UV) 2″ square band-pass filter [center wavelength (CWL)=360 nm, full width at half-maximum height (FWHM)=45 nm, purchased from Edmund Optics, Figure S1A] was used, whereas for visible light yellow irradiations a Y-50 2″ square long-pass filter (cut-off position=500±6 nm, purchased from Edmund Optics, Figure S1B) was employed. The transmittance of the filters was verified before use.
HPLC analysis of extracted R111K:R132l:Y134F:T54V:R59W·retinal complexes
HPLC analysis was used to verify the identity of all-trans-retinal after the following treatments: 1) incubation of all-trans-retinal (10 μm) in citric acid buffer (pH 5.2, 0.2m) for 2 min, 2) incubation of all-trans-retinal (10 μM) in citric acid buffer (pH 5.2, 0.2M) for 2 h, 3) incubation of all-trans-retinal (10 μM) with R111K:R132L:Y134F:T54V:R59W-CRABPII (20 μM) in citric acid buffer (pH 5.2, 0.2M) for 2 h, 4) incubation of all-trans-retinal (10 μM) with R111K:R132L:Y134F:T54V:R59W-CRABPII (20 μM) in citric acid buffer (pH 5.2, 0.2M) for 2 h, followed by white light irradiation with the UV band-pass filter for 1 min, and 5) incubation of all-trans-retinal (10 μM) with R111K:R132L:Y134F:T54V:R59W-CRABPII (20 μM) in citric acid buffer (pH 5.2, 0.2M) for 2 h, followed by white light irradiation with the LP 500 nm yellow filter for 15 min.
Similar retention times in all instances indicate that all-trans-retinal was not modified during incubation in citric acid buffer (0.2M), either in the presence or in the absence of R111K:R132L:Y134F: T54V:R59W-CRABPII or after white light irradiation with either the UV band-pass filter or the LP 500 nm yellow filter. This further supports the hypothesis of imine isomerization, rather than a C=C isomerization, which would have led to isomeric retinal species with dissimilar retention times in HPLC.
To prepare samples for HPLC, the solution was extracted with ethyl acetate, and the organic layer was transferred to an Eppendorf tube (1.5 mL), dried with sodium sulfate, and then concentrated to dryness under a nitrogen stream. The sample was then dissolved in hexane/ethyl acetate (90:10, 100 μL). The resulting solution was analyzed by normal-phase HPLC (silica column, Zorbax Rx-SIL, 9.4 mm×25 cm) after manual injection. The sample was eluted with hexane/ethyl acetate (90:10) at 3 mLmin−1. The products were detected at 325 nm.
UV/Vis measurements
The CRABPII-R111K:R132L:Y134F:T54V:R59W-CRABPII·retinal PSB formation (556 nm) in citric acid buffer (pH 5.2, 0.2M) was followed by UV/Vis. The pH was verified every time before the spectrum was recorded. The experiment was performed with a final protein concentration of 20 μm (from a stock of 1.6 mM in Tris buffer), and retinal (0.5 equiv.) was added (from a stock solution of 0.6 mM in ethanol). Peaks with λmax=556 nm are considered PSB peaks, whereas deprotonated imine peaks (SB) appear at ≈360 nm. Free retinal absorbs at ≈380 nm.
Time-dependent changes in pKa
Time-dependent PSB deprotonation of the CRABPII-R111K:R132L:Y134F:T54V:R59W penta-mutant was monitored over time by UV/Vis at varying temperatures. To ensure that only the PSB deprotonation to the SB event was being kinetically analyzed, the CRABPII·retinal complex was allowed to convert into the SB thermally over time, and then the PSB was restored upon irradiation with a UV band-pass filter, at which point the sample was continuously scanned over time until the sample had again reverted to the SB.
For each experiment, a solution of the protein (20 μM) and retinal (0.5 equiv, 10 μM) was incubated at room temperature for three hours. The sample was then scanned by UV/Vis to ensure complete conversion into the SB. The solution was then irradiated with white light and with use of a UV band-pass filter for 1 min (cuvette cooled with a circulating solution of saturated NaCl in water for the sample cooled to 6.9°C and ice-water for the samples cooled to 16.4 and 24.9°C), followed by UV/Vis monitoring in two-minute intervals at the desired temperature. The UV/Vis chamber was purged with N2 during the course of measurements to avoid condensation buildup on the sides of the cuvette. Note that the temperature of the protein solution was in each case verified by use of a calibrated thermo probe immersed in the cuvette (6.9, 16.4, 24.9, and 30.5°C). The actual temperature settings of the Cary temperature controller were set to 4, 15, 25, and 32°C, respectively.
The absorption of the PSB at 556 nm was plotted as a function of time, and fit to an exponential decay (pseudo first order) in KaleidaGraph to the following Equation (1).
| (1) |
where A is the absorbance at each recorded time point, A0 is the final absorbance value after complex formation, k is the rate constant, t is the time after addition, and c is a free constant. The equation was rewritten in KaleidaGraph as Equation (2).
| (2) |
where m2 is the rate constant. For kinetic plots, see Figure S2.
Time-dependent changes in pKa in D2O versus H2O
Citric acid (0.84 g) was dissolved in D2O (20 mL) to give a 0.2M solution. The pH was then adjusted to 5.2 by addition of the required amount of a NaOH (10M) in D2O solution. Note that the measured pH of a D2O solution with a pH probe requires the following adjustment, as previously reported.[14b]
| (3) |
where pH* is the pH of the solution measured in D2O with a pH probe calibrated in H2O. pH is the calculated pH value in H2O after application of Equation (3).
A solution of the protein (20 μM) and retinal (10 μM, 0.5 equiv) was incubated at room temperature for three hours. The sample was then scanned by UV/Vis to ensure complete conversion into the SB. The solution was irradiated with white light and with use of a UV band-pass filter for 1 min, followed by UV/Vis monitoring at two-minute intervals at 25°C. The absorption of the PSB at 556 nm was plotted as a function of time and fit to an exponential decay (pseudo first order) in KaleidaGraph according to Equation (2). For kinetic plots, see Figure S5.
Time-dependent changes in pKa at various pH values
Samples of the protein (20 μM) and retinal (10 μM, 0.5 equiv) were incubated at room temperature in citric acid buffer (pH 5.2, 0.2M) for three hours. The sample was then scanned by UV/Vis to ensure complete conversion into the SB. The solution was then adjusted to the desired pH by addition of HCl or NaOH. The solution was then irradiated with white light and with use of a UV band-pass filter for 1 min, followed by UV/Vis monitoring at two-minute intervals at 25°C. The absorption of the PSB at 556 nm was plotted as a function of time and fit to an exponential decay (pseudo first order) in KaleidaGraph according to Equation (2). For kinetic plots, see Figure S6.
Iterative UV and visible light irradiations
For the R111K:R132L: Y134F:T54V:R59W-CRABPII·retinal complex, samples were incubated in citric acid buffer (pH 5.2, 0.2M) until full SB formation was observed by UV/Vis spectroscopy. The sample was then irradiated with white light with use of a UV band-pass filter for 1 min, followed by UV/Vis scanning of the sample. The sample was then irradiated with white light through a LP 500 nm yellow filter (while the cuvette was circulated with water) for 15 min. Cycling of UV and yellow irradiations was repeated 20 times. For degassed samples, argon was bubbled through the citric acid buffer for 1 h before incubation of the CRABPII mutant and retinal.
For the Q108K:K40L:T51V:R58F-hCRBPII·retinal complex, a sample of Q108K:K40L:T51V:R58F-hCRBPII (20 μM) and retinal (0.5 equiv) in PBS buffer (pH 7.3) was scanned by UV/Vis spectroscopy until complete formation of the PSB was observed. The sample was then irradiated with white light and with use of a VG-9 (VIS) 2″ square colored glass band-pass filter (CWL=526 nm, FWHM=53 nm, purchased from Edmund Optics) for 12 min. Upon conversion into the SB, the sample was irradiated with white light and with use of a UV band-pass filter for 1 min. Successive cycling was repeated 15 times.
Supplementary Material
Acknowledgments
We are grateful to the National Institutes of Health (GM101353) for generous funding.
Footnotes
Supporting information for this article is available on the WWW under http://dx.doi.org/10.1002/cbic.201500613.
References
- 1.a) Braatsch S, Klug G. Photosynth Res. 2004;79:45–57. doi: 10.1023/B:PRES.0000011924.89742.f9. [DOI] [PubMed] [Google Scholar]; b) Gehring WJ. Wiley Interdiscip Rev Dev Biol. 2014;3:1–40. doi: 10.1002/wdev.96. [DOI] [PubMed] [Google Scholar]; c) Kelber A, Osorio D. Proc R Soc London Ser B. 2010;277:1617–1625. doi: 10.1098/rspb.2009.2118. [DOI] [PMC free article] [PubMed] [Google Scholar]; d) Spudich JL, Yang CS, Jung KH, Spudich EN. Annu Rev Cell Dev Biol. 2000;16:365–392. doi: 10.1146/annurev.cellbio.16.1.365. [DOI] [PubMed] [Google Scholar]; e) Ziegler T, Moglich A. Front Biosci. 2015;2:30–30. doi: 10.3389/fmolb.2015.00030. [DOI] [PMC free article] [PubMed] [Google Scholar]
- 2.a) Ernst OP, Lodowski DT, Elstner M, Hegemann P, Brown LS, Kandori H. Chem Rev. 2014;114:126–163. doi: 10.1021/cr4003769. [DOI] [PMC free article] [PubMed] [Google Scholar]; b) Inoue K, Tsukamoto T, Sudo Y. Biochim Biophys Acta Bioenerg. 2014;1837:562–577. doi: 10.1016/j.bbabio.2013.05.005. [DOI] [PubMed] [Google Scholar]; c) Ostrovsky MA, Feldman TB. Russ Chem Rev. 2012;81:1071–1090. [Google Scholar]; d) Rando RR. Chem Rev. 2001;101:1881–1896. doi: 10.1021/cr960141c. [DOI] [PubMed] [Google Scholar]; e) Ritter E, Przybylski P, Brzezinski B, Bartl F. Curr Org Chem. 2009;13:241–249. [Google Scholar]; f) Wand A, Gdor I, Zhu J, Sheves M, Ruhman S. Annu Rev Phys Chem. 2013;64:437–458. doi: 10.1146/annurev-physchem-040412-110148. [DOI] [PubMed] [Google Scholar]
- 3.a) Hampp N. Chem Rev. 2000;100:1755–1776. doi: 10.1021/cr980072x. [DOI] [PubMed] [Google Scholar]; b) Haupts U, Tittor J, Oesterhelt D. Annu Rev Biophys Biomol Struct. 1999;28:367–399. doi: 10.1146/annurev.biophys.28.1.367. [DOI] [PubMed] [Google Scholar]; c) Lanyi JK. J Biol Chem. 1997;272:31209–31212. doi: 10.1074/jbc.272.50.31209. [DOI] [PubMed] [Google Scholar]; d) Lanyi JK, Luecke H. Curr Opin Struct Biol. 2001;11:415–419. doi: 10.1016/s0959-440x(00)00226-8. [DOI] [PubMed] [Google Scholar]; e) Stoeckenius W, Lozier RH, Bogomolni RA. Biochim Biophys Acta Rev Bioenerg. 1979;505:215–278. doi: 10.1016/0304-4173(79)90006-5. [DOI] [PubMed] [Google Scholar]
- 4.Mullen E, Johnson AH, Akhtar M. FEBS Lett. 1981;130:187–193. doi: 10.1016/0014-5793(81)81116-7. [DOI] [PubMed] [Google Scholar]
- 5.a) Atkinson GH, Zhou Y, Ujj L, Aharoni A, Sheves M, Ottolenghi M. J Phys Chem A. 2002;106:3325–3336. [Google Scholar]; b) Gai F, Hasson KC, McDonald JC, Anfinrud PA. Science. 1998;279:1886–1891. doi: 10.1126/science.279.5358.1886. [DOI] [PubMed] [Google Scholar]; c) Humphrey W, Logunov I, Schulten K, Sheves M. Biochemistry. 1994;33:3668–3678. doi: 10.1021/bi00178a025. [DOI] [PubMed] [Google Scholar]; d) Lanyi JK. J Phys Chem B. 2000;104:11441–11448. [Google Scholar]; e) Lanyi JK, Varo G. Isr J Chem. 1995;35:365–385. [Google Scholar]; f) Liu RSH. Acc Chem Res. 2001;34:555–562. doi: 10.1021/ar000165c. [DOI] [PubMed] [Google Scholar]; g) Liu RSH, Hammond GS. Proc Natl Acad Sci USA. 2000;97:11153–11158. doi: 10.1073/pnas.210323197. [DOI] [PMC free article] [PubMed] [Google Scholar]; h) Logunov I, Humphrey W, Schulten K, Sheves M. Biophys J. 1995;68:1270–1282. doi: 10.1016/S0006-3495(95)80301-2. [DOI] [PMC free article] [PubMed] [Google Scholar]; i) Lozier RH, Bogomolni RA, Stoeckenius W. Biophys J. 1975;15:955–962. doi: 10.1016/S0006-3495(75)85875-9. [DOI] [PMC free article] [PubMed] [Google Scholar]; j) Luecke H, Schobert B, Cartailler JP, Richter HT, Rosengarth A, Needleman R, Lanyi JK. J Mol Biol. 2000;300:1237–1255. doi: 10.1006/jmbi.2000.3884. [DOI] [PubMed] [Google Scholar]; k) Neutze R, Pebay-Peyrou-la E, Edman K, Royant A, Navarro J, Landau EM. Biochim Biophys Acta Biomembr. 2002;1565:144–167. doi: 10.1016/s0005-2736(02)00566-7. [DOI] [PubMed] [Google Scholar]; l) Schenkl S, Mourik Fvan, Friedman N, Sheves M, Schlesinger R, Haacke S, Chergui M. Proc Natl Acad Sci USA. 2006;103:4101–4106. doi: 10.1073/pnas.0506303103. [DOI] [PMC free article] [PubMed] [Google Scholar]
- 6.a) Brown LS, Bonet L, Needleman R, Lanyi JK. Biophys J. 1993;65:124–130. doi: 10.1016/S0006-3495(93)81064-6. [DOI] [PMC free article] [PubMed] [Google Scholar]; b) Sheves M, Albeck A, Friedman N, Ottolenghi M. Proc Natl Acad Sci USA. 1986;83:3262–3266. doi: 10.1073/pnas.83.10.3262. [DOI] [PMC free article] [PubMed] [Google Scholar]
- 7.a) Luecke H, Schobert B, Richter HT, Cartailler JP, Lanyi JK. Science. 1999;286:255–261. doi: 10.1126/science.286.5438.255. [DOI] [PubMed] [Google Scholar]; b) Luecke H, Schobert B, Richter HT, Cartailler JP, Lanyi JK. J Mol Biol. 1999;291:899–911. doi: 10.1006/jmbi.1999.3027. [DOI] [PubMed] [Google Scholar]
- 8.a) Ovchinnikov YuA. FEBS Lett. 1982;148:179–191. doi: 10.1016/0014-5793(82)80805-3. [DOI] [PubMed] [Google Scholar]; b) Palczewski K, Kumasaka T, Hori T, Behnke CA, Motoshima H, Fox BA, Le Trong I, Teller DC, Okada T, Stenkamp RE, Yamamoto M, Miyano M. Science. 2000;289:739–745. doi: 10.1126/science.289.5480.739. [DOI] [PubMed] [Google Scholar]
- 9.a) Doukas AG, Junnarkar MR, Alfano RR, Callender RH, Kakitani T, Honig B. Proc Natl Acad Sci USA. 1984;81:4790–4794. doi: 10.1073/pnas.81.15.4790. [DOI] [PMC free article] [PubMed] [Google Scholar]; b) Hubbard R, Kropf A. Proc Natl Acad Sci USA. 1958;44:130–139. doi: 10.1073/pnas.44.2.130. [DOI] [PMC free article] [PubMed] [Google Scholar]; c) Lodowski DT, Angel TE, Palczewski K. Photochem Photobiol. 2009;85:425–430. doi: 10.1111/j.1751-1097.2008.00516.x. [DOI] [PMC free article] [PubMed] [Google Scholar]; d) Nakanishi K. Chem Pharm Bull. 2000;48:1399–1409. doi: 10.1248/cpb.48.1399. [DOI] [PubMed] [Google Scholar]; e) Shichida Y, Imai H. Cell Mol Life Sci. 1998;54:1299–1315. doi: 10.1007/s000180050256. [DOI] [PMC free article] [PubMed] [Google Scholar]; f) Shichida Y, Morizumi T. Photochem Photobiol. 2007;83:70–75. doi: 10.1562/2006-03-22-IR-854. [DOI] [PubMed] [Google Scholar]; g) Smith SO. In: Annual Review of Biophysics. Rees DC, Dill KA, Williamson JR, editors. Vol. 39. 2010. pp. 309–328. [DOI] [PubMed] [Google Scholar]; h) Sugihara M, Hufen J, Buss V. Biochemistry. 2006;45:801–810. doi: 10.1021/bi0515624. [DOI] [PubMed] [Google Scholar]
- 10.a) Steinberg G, Ottolenghi M, Sheves M. Biophys J. 1993;64:1499–1502. doi: 10.1016/S0006-3495(93)81518-2. [DOI] [PMC free article] [PubMed] [Google Scholar]; b) Cooper A, Dixon SF, Nutley MA, Robb JL. J Am Chem Soc. 1987;109:7254–7263. [Google Scholar]; c) Sakmar TP, Franke RR, Khorana HG. Proc Natl Acad Sci USA. 1991;88:3079–3083. doi: 10.1073/pnas.88.8.3079. [DOI] [PMC free article] [PubMed] [Google Scholar]
- 11.a) Crist RM, Vasileiou C, Rabago-Smith M, Geiger JH, Borhan B. J Am Chem Soc. 2006;128:4522–4523. doi: 10.1021/ja058591m. [DOI] [PubMed] [Google Scholar]; b) Huntress MM, Gozem S, Malley KR, Jailaubekov AE, Vasileiou C, Vengris M, Geiger JH, Borhan B, Schapiro I, Larsen DS, Olivucci M. J Phys Chem B. 2013;117:10053–10070. doi: 10.1021/jp305935t. [DOI] [PubMed] [Google Scholar]; c) Lee KSS, Berbasova T, Vasileiou C, Jia X, Wang W, Choi Y, Nossoni F, Geiger JH, Borhan B. ChemPlusChem. 2012;77:273–276. [Google Scholar]; d) Nossoni Z, Assar Z, Yapici I, Nosrati M, Wang W, Berbasova T, Vasileiou C, Borhan B, Geiger J. Acta Crystallogr Sect D. 2014;70:3226–3232. doi: 10.1107/S1399004714023839. [DOI] [PMC free article] [PubMed] [Google Scholar]; e) Vaezeslami S, Jia X, Vasileiou C, Borhan B, Geiger JH. Acta Crystallogr Sect D. 2008;64:1228–1239. doi: 10.1107/S0907444908032216. [DOI] [PMC free article] [PubMed] [Google Scholar]; f) Vaezeslami S, Mathes E, Vasilelou C, Borhan B, Geiger JH. J Mol Biol. 2006;363:687–701. doi: 10.1016/j.jmb.2006.08.059. [DOI] [PubMed] [Google Scholar]; g) Vasileiou C, Lee KSS, Crist RM, Vaezeslami S, Goins SA, Geiger JH, Borhan B. Proteins Struct Funct Bioinf. 2009;76:281–290. doi: 10.1002/prot.22334. [DOI] [PMC free article] [PubMed] [Google Scholar]; h) Vasileiou C, Vaezeslami S, Crist RM, Rabago-Smith M, Geiger JH, Borhan B. J Am Chem Soc. 2007;129:6140–6148. doi: 10.1021/ja067546r. [DOI] [PubMed] [Google Scholar]; i) Vasileiou C, Wang W, Jia X, Lee KSS, Watson CT, Geiger JH, Borhan B. Proteins Struct Funct Bioinf. 2009;77:812–822. doi: 10.1002/prot.22495. [DOI] [PMC free article] [PubMed] [Google Scholar]; j) Wang W, Geiger JH, Borhan B. Bioessays. 2014;36:65–74. doi: 10.1002/bies.201300094. [DOI] [PMC free article] [PubMed] [Google Scholar]; k) Wang W, Nossoni Z, Berbasova T, Watson CT, Yapici I, Lee KSS, Vasileiou C, Geiger JH, Borhan B. Science. 2012;338:1340–1343. doi: 10.1126/science.1226135. [DOI] [PMC free article] [PubMed] [Google Scholar]
- 12.Berbasova T, Nosrati M, Vasileiou C, Wang W, Lee KS, Yapici I, Geiger JH, Borhan B. J Am Chem Soc. 2013;135:16111–16119. doi: 10.1021/ja404900k. [DOI] [PMC free article] [PubMed] [Google Scholar]
- 13.a) Fischer E, Frei Y. J Chem Phys. 1957;27:808–809. [Google Scholar]; b) Luo Y, Utecht M, Dokic J, Korchak S, Vieth HM, Haag R, Saalfrank P. ChemPhysChem. 2011;12:2311–2321. doi: 10.1002/cphc.201100179. [DOI] [PubMed] [Google Scholar]
- 14.a) It is important to note that pH adjustment for D2O relative to H2O is critical for correct measurement of rate because there is a significant rate dependence on pH;; Krezel A, Bal W. J Inorg Biochem. 2004;98:161–166. doi: 10.1016/j.jinorgbio.2003.10.001. [DOI] [PubMed] [Google Scholar]
- 15.a) Deniz E, Impellizzeri S, Sortino S, Raymo FM. Can J Chem. 2011;89:110–116. [Google Scholar]; b) Guo J, Jia D, Liu L, Yuan H, Li F. J Mater Chem. 2011;21:3210–3215. [Google Scholar]; c) Herder M, Schmidt BM, Grubert L, Paetzel M, Schwarz J, Hecht S. J Am Chem Soc. 2015;137:2738–2747. doi: 10.1021/ja513027s. [DOI] [PubMed] [Google Scholar]; d) Samoylova E, Dallari W, Allione M, Pignatelli F, Marini L, Cingolani R, Diaspro A, Athanassiou A. Mater Sci Eng B. 2013;178:730–735. [Google Scholar]
- 16.Gill SC, von Hippel PH. Anal Biochem. 1989;182:319–326. doi: 10.1016/0003-2697(89)90602-7. [DOI] [PubMed] [Google Scholar]
Associated Data
This section collects any data citations, data availability statements, or supplementary materials included in this article.


