

ABSTRACT
In the past decades, obesity and associated metabolic complications have reached epidemic proportions. For the study of these pathologies, a number of animal models have been developed. However, a direct comparison between Wistar and Sprague-Dawley (SD) Rat as models of high-fat (HF) diet-induced obesity has not been adequately evaluated so far. Wistar and SD rats were assigned for 2 experimental groups for 17 weeks: standard (St) and high-fat (HF) diet groups. To assess some of the features of the metabolic syndrome, oral glucose tolerance tests, systolic blood pressure measurements and blood biochemical analysis were performed throughout the study. The gut microbiota composition of the animals of each group was evaluated at the end of the study by real-time PCR. HF diet increased weight gain, body fat mass, mesenteric adipocyte's size, adiponectin and leptin plasma levels and decreased oral glucose tolerance in both Wistar and SD rats. However, the majority of these effects were more pronounced or earlier detected in Wistar rats. The gut microbiota of SD rats was less abundant in Bacteroides and Prevotella but richer in Bifidobacterium and Lactobacillus comparatively to the gut microbiota of Wistar rats. Nevertheless, the modulation of the gut microbiota by HF diet was similar in both strains, except for Clostridium leptum that was only reduced in Wistar rats fed with HF diet. In conclusion, both Wistar and SD Rat can be used as models of HF diet-induced obesity although the metabolic effects caused by HF diet seemed to be more pronounced in Wistar Rat. Differences in the gut microbial ecology may account for the worsened metabolic scenario observed in Wistar Rat.
Keywords: animal models, diet-induced obesity, high-fat diet, metabolic syndrome, microbiota, obesity
Introduction
Obesity (especially visceral obesity) is a key feature of the metabolic syndrome, a set of interrelated risk factors for cardiovascular disease and diabetes, that also includes dysglycemia, raised blood pressure, elevated triglyceride levels and low high density lipoprotein cholesterol levels.1
In the past decades, obesity and associated metabolic complications have reached epidemic proportions.2 For a better understanding of these pathologies and to evaluate potential treatments for the metabolic syndrome, a number of experimental animal models have been developed.3,4
Despite the multifactorial etiology of obesity, the rate at its incidence is increasing suggests that environmental and behavioral factors (including dietary factors) have been the major contributors to the obesity epidemic rather than genetic changes.5 For this reason, instead of monogenetic models, polygenetic animal models of diet-induced obesity have been preferentially used.
Several weeks into a regimen of a semi-purified diet with a fat content of more than 40% energy based on animal fats can lead to obesity, hyperglycemia, hypertriglyceridemia and hyperleptinemia in rodents, mimicking the pathophysiology of human obesity and metabolic syndrome.6 Wistar and Sprague-Dawley (SD) Outbred Rat can be considered the standard rodents for this experiment type since they are susceptible to diet-induced obesity and insulin resistance with individual variations.6 Furthermore, due to their larger size, the evaluation of some metabolic parameters such as blood pressure is facilitated over mice.
However, a direct comparison between Wistar and SD Rat as models of high-fat (HF) diet-induced obesity has not been adequately evaluated so far. There are studies reporting some metabolic changes caused by HF diet in Wistar but not in SD rats.7,8 Nevertheless, it is difficult to attribute those variations to the strain of the animal used since there are other variables like the age of animals, the duration of the study and the composition of the HF diet used that can also be behind those divergences. Therefore, in the present study, Wistar and SD rats were studied in parallel to evaluate the metabolic effects of an HF diet in comparison to a standard chow, in both strains. To assess some of the features of the metabolic syndrome, oral glucose tolerance tests, systolic blood pressure measurement, and blood biochemical analysis were performed. Given the growing body of evidence demonstrating the prominent role of gut microbiota in energy balance and metabolism, the gut microbiota composition and its modulation by HF diet were also evaluated in both strains.
Results
Energy ingestion, weight gain and body fat composition
HF diet increased energy ingestion, weight gain and fat mass and reduced water consumption in both Wistar and Sprague-Dawley rats (P < 0.001) (Fig. 1 and Table 2).
Figure 1.

Energy ingestion (A) and body weight (B) of Wistar and Sprague-Dawley (SD) rats fed either with standard (St) or high-fat (HF) diet along the 17 weeks of the study. Data are presented as mean ± SEM (n = 6 rats per group).£P < 0.05 between St and HF diet groups of both strains andδ P < 0.05 between St and HF diet groups of Wistar rats.
Table 2.
Energy intake, weight gain and body fat mass of Wistar and Sprague-Dawley (SD) rats fed either with standard (St) or high-fat (HF) diet during 17 weeks
|
Wistar Rat |
SD Rat |
Two-way ANOVAP values |
|||||
|---|---|---|---|---|---|---|---|
| St | HF | St | HF | Diet | Strain | Interaction | |
| Energy Ingested (Kcal/day) | 53.0 ± 1.2 | 74.7 ± 1.4** | 53.7 ± 0.6 | 66.6 ± 1.3*,†*,† | <0.001 | 0.005 | 0.001 |
| Drink Ingested (mL) | 31.9 ± 1.9 | 24.1 ± 1.1 | 29.6 ± 0.7 | 24.0 ± 1.4 | <0.001 | 0.371 | 0.437 |
| Weight Gain (g) | 190.0 ± 9.1 | 317.2 ± 25.5 | 208.8 ± 11.5 | 276.2 ± 14.3 | <0.001 | 0.506 | 0.082 |
| Fat Mass (g) | 181.3 ± 6.8 | 259.2 ± 16.8 | 179.3 ± 6.1 | 218.1 ± 8.5 | <0.001 | 0.053 | 0.076 |
Data are presented as mean ± SEM (n = 6 rats per group).
P < 0.05 vs respective St diet group and
P < 0.05 between HF diet groups.
Energy ingestion was higher in HF diet groups of both strains since the beginning of the study (P < 0.05) (Fig. 1A). However, the average of the energy ingested per day during the entirely study was significantly higher in Wistar rats fed with HF diet than in SD rats fed with the same diet (74.7 ± 1.4 vs 66.6 ± 1.3 Kcal/day, interaction P = 0.001) (Table 2).
Wistar rats on HF diet became heavier than their St counterparts from the 4th week of the study while SD rats became heavier only from the 7th week of the study (P < 0.05) (Fig. 1B). Nevertheless, HF diet caused a significant increase in total weight gain in both strains (P < 0.001) (Table 2). However, while the increase observed in Wistar rats was 66.9 ± 13.4% (from 190.0 ± 9.1 to 317.2 ± 25.5 g), in SD rats was only 32.2 ± 6.9% (from 208.8 ± 11.5 to 276.2 ± 14.3 g) (P < 0.05).
Through bioelectrical impedance it was possible to estimate the total fat mass of the animals, at the end of the study. HF diet lead to an increase of total fat mass in both strains (P < 0.001). The increase observed was 43.0 ± 9.3% (from 181.3 ± 6.8 to 259.2 ±16.8 g) and 21.6 ± 4.7% (from 179.3 ± 6.1 to 218.1 ± 8.5 g) in Wistar and SD rats, respectively. However, the difference between these results did not reach statistical significance (P = 0.068).
Glycaemic response
OGTTs were performed in the middle (Fig. 2) and at the end of the study (Fig. 3) to evaluate the effects of HF diet in glycaemic response of both strains. During OGTTs, blood glucose was affected by time (P < 0.001) (Figs. 2A and 3A). Total area under the curve (AUC) of the glycaemic response was calculated for each experimental group (Figs. 2B and 3B). While at the end of the study, HF diet increased the AUC independently of the strain (P < 0.05), at the 9th week of the study this effect was only visible in Wistar rats (interaction P = 0.003).
Figure 2.

Glycaemic response during oral glucose tolerance test (A), total area under the curve (AUC) (B), fasting insulin plasma levels (C) and homeostasis model assessment (HOMA) (D) of Wistar and Sprague-Dawley (SD) rats after 9 weeks of feeding either with standard (St) or high-fat (HF) diet. HOMA was calculated using the formula: fasting glucose (mg/dl) × fasting insulin (ng/ml)/405. Data are presented as mean ± SEM (n = 5–6 rats per group). *P < 0.05 vs respective St diet group and †P < 0.05 between HF diet groups.
Figure 3.

Glycaemic response during oral glucose tolerance test (A) and total area under the curve (AUC) (B) of Wistar and Sprague-Dawley (SD) rats after 16 weeks of feeding either with standard (St) or high-fat (HF) diet. Data are presented as mean ± SEM (n = 6 rats per group).
Fasting insulin levels were doubled in Wistar rats fed with HF diet compared to those in the St diet group right after 9 weeks of HF feeding (interaction P = 0.017) (Fig. 2C). Similarly, homeostasis model assessment (HOMA) of insulin resistance indicated that these animals were fold2- less insulin sensitive (interaction P = 0.007) (Fig. 2D). Insulin sensitivity remained unchanged in SD rats fed with HF diet in comparison with their St counterparts (Fig. 2C and 2D) which is in accordance to the results obtained for this strain in OGTT at the 9th week of the study.
Systolic blood pressure
After 15 weeks, HF diet was not sufficient to significantly cause an elevation of SBP in rats of both strains (Fig. 4A). SBP values did not differ either between strains.
Figure 4.

Systolic blood pressure (A) and serum endotoxin levels (B) of Wistar and Sprague-Dawley (SD) rats fed either with standard (St) or high-fat (HF) diet during 17 weeks. SBP measurements were recorded at 15th week of the study. Data are presented as mean ± SEM (n = 5–6 rats per group).
Blood and urine biochemical profile
Values for the different biochemical parameters evaluated in serum and urine of Wistar and SD rats, fed either with St or HF diet, are displayed in Table 3. In general, HF diet did not change the values of the majority of biochemical markers analyzed, independently of the strain of Rat. However, HF diet decreased serum albumin (P = 0.048) and increased urinary urea (P = 0.020). Nevertheless, HF diet also caused a noticeable increase in serum urea (from 30.2 ± 0.7 to 36.6 ± 2.1 mg/dL, P < 0.05) and alkaline phosphatase (from 79.7 ± 5.2 to 132.0 ± 13.6 U/L, P < 0.05) but only in Wistar rats (interaction P < 0.05). A trend to increase serum creatinine and triglycerides was also observed in Wistar rats (interaction P = 0.062 and P = 0.064, respectively).
Table 3.
Biochemical markers evaluated in serum and urine of Wistar and Sprague-Dawley (SD) rats fed either with standard (St) or high-fat (HF) diet during 17 weeks
|
Wistar Rat |
SD Rat |
Two-way ANOVAP values |
|||||
|---|---|---|---|---|---|---|---|
| St | HF | St | HF | Diet | Strain | Interaction | |
| Serum | |||||||
| Creatinine (mg/dL) | 0.40 ± 0.04 | 0.52 ± 0.02 | 0.67 ± 0.04 | 0.67 ± 0.03 | 0.098 | <0.001 | 0.062 |
| Urea (mg/dL) | 30.2 ± 0.7 | 36.6 ± 2.3 * | 35.0 ± 2.4 | 34.0 ± 0.7 | 0.121 | 0.513 | 0.039 |
| Uric Acid (mg/dL) | 0.83 ± 0.08 | 0.92 ± 0.12 | 1.00 ± 0.27 | 0.85 ± 0.12 | 0.773 | 0.699 | 0.425 |
| Total Cholesterol (mg/dL) | 103.8 ± 7.2 | 105.6 ± 8.6 | 101.8 ± 8.2 | 80.0 ± 4.0 | 0.177 | 0.069 | 0.115 |
| Triglycerides (mg/dL) | 150.2 ± 21.3 | 185.4 ± 14.9 | 62.7 ± 12.5 | 40.7 ± 3.1 | 0.654 | <0.001 | 0.064 |
| Albumin (g/dL) | 3.7 ± 0.1 | 3.5 ± 0.1 | 3.3 ± 0.2 | 2.9 ± 0.1 | 0.048 | 0.003 | 0.296 |
| Alkaline Phosphatase (U/L) | 79.7 ± 5.2 | 132.0 ± 14.9 * | 141.0 ± 14.2 ‡ | 118.0 ± 9.7 | 0.214 | 0.052 | 0.004 |
| AST (U/L) | 191.3 ± 39.0 | 168.6 ± 20.8 | 130.7 ± 28.4 | 135.8 ± 26.1 | 0.774 | 0.138 | 0.649 |
| ALT (U/L) | 47.2 ± 4.6 | 41.4 ± 4.1 | 51.5 ± 3.9 | 59.2 ± 9.3 | 0.883 | 0.095 | 0.296 |
| Urine | |||||||
| Creatinine (g/day) | 0.010 ± 0.000 | 0.012 ± 0.002 | 0.016 ± 0.004 | 0.017 ± 0.002 | 0.606 | 0.023 | 0.825 |
| Urea (g/day) | 0.17 ± 0.02 | 0.24 ± 0.01 | 0.17 ± 0.01 | 0.21 ± 0.03 | 0.020 | 0.476 | 0.709 |
Data are presented as mean ± SEM (n = 5–6 rats per group).
P < 0.05 vs respective St diet group and
P< 0.05 between St diet groups.
ALT, alanine transaminase; AST, aspartate transaminase.
Serum creatinine, triglycerides, albumin and urinary creatinine values were significantly different between strains (P < 0.05). Serum creatinine values were higher in SD rats as well as urinary creatinine values (P < 0.05) while the serum values of triglycerides and albumin were more elevated in Wistar rats (P < 0.05).
Contrarily to what was expected, HF feeding did not increase endotoxin serum values, in both strains (Fig. 4B).
Adiponectin and leptin plasma levels (Fig. 5A and 5B) were higher in Wistar rats (P < 0.05) and when animals of both strains were fed with HF diet (P < 0.05). However, the increase in leptin plasma levels caused by HF diet was more pronounced in Wistar than in SD rats (interaction P = 0.001).
Figure 5.
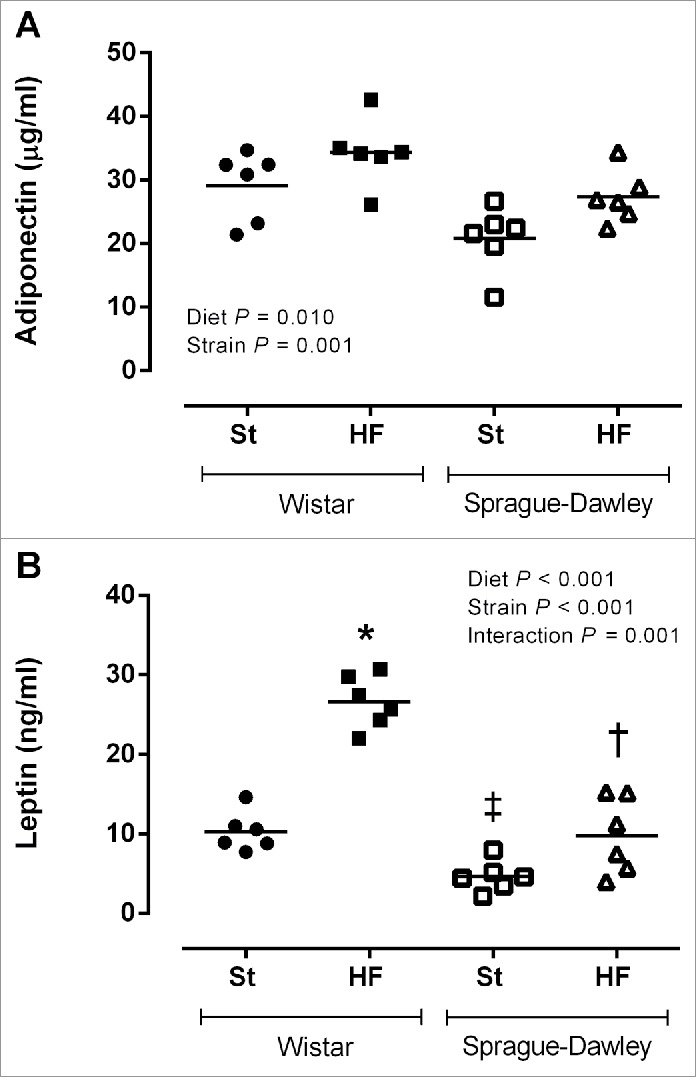
Adiponectin (A) and leptin plasma levels (B) of Wistar and Sprague-Dawley (SD) rats fed either with standard (St) or high-fat (HF) diet during 17 weeks. Data are presented as mean ± SEM (n = 6 rats per group). *P < 0.05 vs respective St diet group, ‡P < 0.05 between St diet groups and †P < 0.05 between HF diet groups.
Adipocyte area
HF diet increased the area of adipocytes from mesenteric adipose tissue (P < 0.05, Fig. 6A and 6B). The effects of HF diet on adipocyte area did not differ between strains.
Figure 6.

Mesenteric adipocyte's area (A) of Wistar and Sprague-Dawley (SD) rats fed either with standard (St) or high-fat (HF) diet during 17 weeks. Data are presented as mean ± SEM (n = 6 rats per group). (B) Representative images of hematoxylin and eosin stained-adipose tissue sections for each experimental group.
Gut microbiota
HF diet decreased Firmicutes, Bacteroidetes, Lactobacillus and Prevotella (P < 0.05) and increased Firmicutes to Bacteroidetes ratio and Bacteroides (P < 0.05), as displayed in Table 4.
Table 4.
Quantification of gut microbiota phyla, genera and species in different experimental groups
|
Wistar Rat |
SD Rat |
Two-way ANOVA P values |
|||||
|---|---|---|---|---|---|---|---|
| St | HF | St | HF | Diet | Strain | Interaction | |
| Firmicutes | 6.71 ± 0.06 | 6.28 ± 0.06 * | 6.65 ± 0.03 | 6.55 ± 0.09 † | 0.001 | 0.118 | 0.017 |
| Bacteroidetes | 6.16 ± 0.11 | 5.40 ± 0.05 | 5.55 ± 0.18 | 5.21 ± 0.12 | <0.001 | 0.004 | 0.114 |
| Firmicutes/Bacteroidetes | 1.09 ± 0.01 | 1.16 ± 0.01 | 1.20 ± 0.04 | 1.26 ± 0.03 | 0.026 | 0.001 | 0.825 |
| Lactobacillus | 4.13 ± 0.31 | 3.56 ± 0.19 | 5.87 ± 0.12 ‡ | 2.84 ± 0.29 * | <0.001 | 0.047 | <0.001 |
| Enterococcus | 2.65 ± 0.11 | 2.89 ± 0.08 | 2.89 ± 0.13 | 2.87 ± 0.17 | 0.403 | 0.410 | 0.314 |
| Clostridium leptum | 5.53 ± 0.07 | 5.09 ± 0.12 * | 5.40 ± 0.06 | 5.52 ± 0.12 † | 0.111 | 0.126 | 0.010 |
| Bacteroides | 4.07 ± 0.36 | 4.32 ± 0.12 | 3.21 ± 0.13 | 4.05 ± 0.17 | 0.020 | 0.017 | 0.192 |
| Prevotella | 4.09 ± 0.32 | 2.31 ± 0.14 * | 2.80 ± 0.25 ‡ | 2.40 ± 0.14 | <0.001 | 0.015 | 0.006 |
| Bifidobacterium | 2.13 ± 0.11 | 2.60 ± 0.27 | 4.33 ± 0.60 | 3.82 ± 0.37 | 0.949 | <0.001 | 0.219 |
Values are presented as mean ± SEM and expressed as log10 16S rRNA gene copies/20ng of DNA (n = 6 rats per group).
P < 0.05 vs respective St diet group,
P < 0.05 between St diet groups and
P < 0.05 between HF diet groups.
HF, high-fat diet group; SD, Sprague-Dawley; St, standard diet group.
A significant interaction between strain and diet was found for Firmicutes, Prevotella and Lactobacillus (P < 0.05). Accordingly, although HF diet decreased these bacterial groups in both strains, the effects on Firmicutes and Prevotella were more evident in Wistar rats while the effects on Lactobacillus were more noticeable in SD rats.
Clostridium leptum was reduced (a reduction of almost fold3-) only in Wistar rats fed with an HF diet (interaction P = 0.010).
The composition of the gut microbiota differ between the 2 strains of Rat, namely in Bacteroidetes, Firmicutes to Bacteroidetes ratio, Lactobacillus, Bacteroides, Prevotella and Bifidobacterium. The gut microbiota of SD rats was less abundant in Bacteroides and Prevotella. Since these 2 bacterial groups belong to Bacteroidetes phylum, the number of copies of Bacteroidetes was lower in SD rats. As a result, the Firmicutes to Bacteroidetes ratio was more elevated in this strain of Rat. On the other hand, the gut microbiota of SD rats was more abundant in Bifidobacterium and Lactobacillus comparatively to the gut microbiota of Wistar rats.
Discussion
The aim of the present study was to compare Wistar and SD Rat as models of HF diet-induced obesity. The results obtained showed that HF diet increased energy ingestion, weight gain, body fat mass, mesenteric adipocyte's size, adiponectin and leptin plasma levels and decreased oral glucose tolerance in both Wistar and SD Rat. Nonetheless, the majority of these effects were more evident or earlier detected in Wistar Rat.
Wistar rats fed with HF diet consumed higher amounts of food (data not shown) and, therefore, higher amounts of energy throughout the study when compared to SD rats fed with the same diet. Consequently, weight gain was larger in these animals and was mainly due to an expansion of adipose tissue mass.
Leptin is an adipocyte-derived hormone that controls food intake and energy expenditure.9 Plasma leptin concentration increases in proportion to body fat mass.10 As a result, Wistar rats fed with HF diet displayed higher leptin plasma levels than SD rats in the same diet regimen. In addition, the amount of leptin released by each gram of body fat mass (plasma leptin to body fat mass ratio) was also more elevated in Wistar than in SD rats (data not shown). This might be considered as an attempt to overcome the resistance to the leptin action which can aggravate, in turn, hyperphagia and obesity.11,12
Despite presenting higher adiponectin plasma levels, oral glucose tolerance was decreased, at the end of the study, in animals of both strains fed with HF diet. This is in accordance with other studies reporting an increase in adiponectin plasma levels and a glucose tolerance impairment in SD rats after 24 and 32 weeks of treatment with the same HF diet.7,13 Adiponectin is recognized by its insulin sensitizing action, however, it has been proposed that obesity may induce a malfunction on adiponectin signaling (adiponectin resistance).14
Albumin is considered a negative acute phase protein, and might be decreased during inflammatory conditions, such as obesity.15,16 Accordingly, in the present study, serum albumin was decreased after HF feeding in both strains.
Serum creatinine, urea and liver enzymes activity are biochemical parameters used to evaluate the function and damage of kidney and liver. The results from this study showed that, in Wistar rats, HF diet increased some of these metabolic markers. Despite the increase into values that did not differ from those of SD healthy animals fed with St diet, serum urea and alkaline phosphatase activity values in Wistar rats fed with HF diet might be, for this strain, already indicative of some renal and liver function impairment as a consequence of obesity.17-19
Hypertriglyceridemia is one of the criteria for diagnosis of the metabolic syndrome and seems to be present in Wistar rats fed with HF diet. The increase in free fatty acids flux to the liver (from an expanded adipose tissue mass) can lead to the overproduction of triglyceride-rich very low-density lipoproteins (VLDL) which results, in turn, in high circulating levels of triglycerides.20 Hypertriglyceridemia is also a reflection of the insulin resistant condition.20 In accordance, a glucose tolerance impairment, which is related to the inability of insulin to promote glucose uptake and metabolism by insulin-sensitive tissues, was clearly visible in Wistar rats fed with HF diet right from the 9th week of the study. On the other hand, SD rats which glucose tolerance was only impaired at the end of the study, did not develop hypertriglyceridemia as reported by previous studies using the same HF diet.7,13
High blood pressure is another component of the metabolic syndrome and represents a major risk factor for cardiovascular diseases. The development of hypertension in a Rat model of diet-induced obesity is described in the literature.21 However, the low salt content of the HF diet used in this study (0.3%) in contrast with those used by other authors (0.8, 2 and 4%) may explain its lack of efficiency in increasing SBP of both Wistar and SD rats.22
The ability of gut microbiota to modulate host signaling pathways that can influence energy balance and metabolism has raised the interest of the scientific community in this subject. Several studies have already demonstrated the link between the gut microbiota and obesity.23,24
Here, a comparison between the gut microbiota of Wistar and SD Rat was performed for the first time. This analysis was conducted as an attempt to explain the differential metabolic effects caused by HF feeding in these 2 models of diet-induced obesity. According to Li et al, differences in gut microbiota may account for the differential metabolic response of the animals to a dietary intervention and, consequently, predispose to different pathological outcomes such as obesity and diabetes.25 The results obtained showed that HF diet profoundly reduced the gut microbial community in both strains by decreasing its 2 dominant phyla (Bacteroidetes and Firmicutes). Furthermore, it also decreased Lactobacillus, an important bacterial genus recognized for its health promoting properties.26,27 On the other hand, it increased the number of copies of Bacteroides and increased the Firmicutes to Bacteroidetes ratio that has been associated to obesity.28-30 Most of these effects were more pronounced in Wistar rats, except for Lactobacillus. The gut microbiota composition of SD rats was richer in Lactobacillus what may justify the harshest effect of HF diet in the reduction of this genus, in this strain.
The analysis of the interrelationship between gut microbiota and host metabolic parameters (Fig. 7) showed that Clostridium leptum was significantly negatively correlated with insulineamia, leptin plasma levels, HOMA and with AUC of the glycaemic response at 9th week of the study. Previous studies had also shown that Clostridium leptum is negatively correlated with fat mass, fasting glycaemia, insulinaemia and HOMA.27,31 In the present study, Clostridium leptum was only reduced in Wistar rats fed with HF diet and these were the animals presenting a worsened metabolic scenario.
Figure 7.
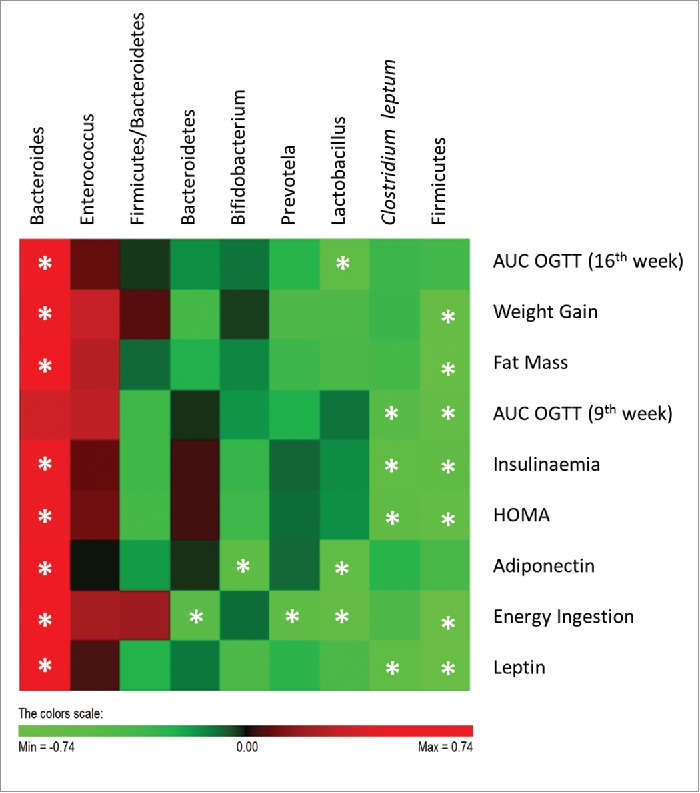
Correlations between gut microbiota and host metabolic parameters. Data of all experimental groups were gathered and analyzed by SPSS software (20.0 version) using 2-tailed Pearson's correlation test. The scores of Pearson's correlation were figured by PermutMatrix software (Version 1.9.3 EN) using heatmap plots. As shown by the colors scale, green color indicates a negative correlation while red color indicates a positive correlation. The symbol (*) indicates a statistical significant correlation (P < 0.05).
The gut microbiota-derived LPS is one of the elements linking the gut microbiota to the low-grade inflammation observed in obesity.32 Increased LPS plasma levels are observed after HF feeding, since the fat content of the food modulates LPS absorption.33 However, in the present study, LPS was not elevated in the animals fed with HF diet, despite ingesting more amount of fat than the animals in St diet groups. LPS was only measured when animals were fasted and not in the postprandial state which could explain the absence of increased endotoxin levels in HF diet groups.34
In summary, both Wistar and SD Rat can be used as models of HF diet-induced obesity, although most of the metabolic effects caused by HF diet were more pronounced, or earlier detected, in Wistar Rat. In addition, despite the differences in the gut microbiota composition of these 2 strains, the modulation caused by HF diet was similar in both groups, except for Clostridium leptum. Differences in the gut microbial ecology may account for the different responses to HF diet and to the development of a worsened metabolic and inflammatory status.
Materials and Methods
Animals and housing
Twelve male Wistar rats and 12 male SD rats were purchased from Harlan Laboratories (Santiga, Spain) and kept under controlled environmental conditions (22–24°C and 12 h light/dark cycles), for at least 1 week before starting the experiments. Animals from the 2 different strains (7 weeks of age) were randomly divided into 2 groups of 6 animals each: standard (St) and high-fat (HF) diet group. The diets were respectively “St” (Teklad 2014, Harlan Laboratories, Santiga, Spain) and “HF” with 45% of energy from lipids and 17% of energy from sucrose (D12451 Research Diets, New Brunswick, NJ, USA). Animals were subjected to different experimental conditions for a total of 17 weeks. The water and chow were supplied ad libitum. Food and beverage consumption and body weight were monitored weekly, to carefully characterize energy ingestion and weight gain.
At the end of the 17 weeks, food was removed 4–6 h before sacrifice and the animals were anesthetized with a mixture of ketamine (50 mg/kg) and medetomidine (1 mg/kg) and maintained with isoflurane. Meanwhile, using a Quantum /S bioelectrical impedance analyzer (RJL Systems, Akern SRL, Florence, Italy), the body composition of each rat was determined by bioelectrical impedance, according to the procedure already described in the literature.35 Before perfusion of the vascular compartment with a saline solution (NaCl 0.9%, w/v), blood was drawn from the left ventricle into tubes with or without heparin to obtain plasma and serum, respectively. Aliquots were frozen at −80°C until further analysis. Fresh fecal samples were collected directly from the colon of all animals, snap-frozen in liquid nitrogen and stored at −80°C until further analysis.
Animal handling and housing protocols followed European Union guidelines (Directive 2010/63/EU) for the use of experimental animals in scientific research. The protocol was approved by the Committee on the Ethics of Animal Experiments of the Faculty of Medicine of University of Porto.
Oral glucose tolerance tests (OGTTs)
In the middle (9th week of treatment) and at the end of the study (16th week of treatment), rats were fasted over 5h and a baseline blood draw from the lateral tail vein was collected for plasma fasting glucose and insulin measurements. Animals were gavaged with a glucose solution of 2 g/kg body weight and blood droplets from the tail vein were collected to measure glycaemia thereafter at 30, 60, 90 and 120 min. Glucose levels were measured with Precision Xtra Plus test strips and an Optium Xceed device (Abbott Diabetes Care, Ltd., Maidenhead, UK). Plasma insulin levels were measured using a Rat/Mouse Insulin ELISA kit (Merck Milipore, Madrid, Spain). The homeostasis model assessment (HOMA) was used to calculate approximate insulin resistance using the formula: glucose (mg/dL) × insulin (ng/ml)/405.36
Systolic blood pressure measurement
One week prior to the systolic blood pressure (SBP) measurement, animals were acclimated daily to the procedure room and handling. During the 15th week of treatment, indirect measurement of SBP in awake restrained rats was carried out by the non-invasive tail-cuff method, using LE 5000 (Letica Corporation, Rochester Hills, MI, USA).37 Before the measurements, rats were kept at 37°C during 10 min to make the pulsations of the tail artery detectable. After obtaining a stable pulse (≈300 pulses per minute), 3 to 5 consecutive measurements of SBP were taken and the average of them was considered to analysis.
Blood and urine biochemical analysis
Biochemical evaluation of serum and urine was performed at the end of the study. For urine collection, rats were placed on metabolic cages, after being acclimated. Analysis of routine biochemical markers was performed in a certified Clinical Analysis Laboratory (Guimarães, Portugal).
Adiponectin and leptin were measured in plasma collected at the end of the study, using Rat Adiponectin ELISA Kit (Life Technologies Ltd, Paisley, UK) and Rat Leptin ELISA Kit (Merck Milipore, Madrid, Spain), respectively.
Quantification of bacterial endotoxin was performed using the Chromo-Limulus Amebocyte Lysate (Chromo-LAL) reagent (Associates of Cape Cod, Inc.., Falmouth, MA, USA). Briefly, serum samples were diluted 1:4 in ultrapure water (Merck Milipore, Billerica, MA, USA) and heated for 2 min at 100°C. Samples and Chromo-LAL were incubated at 37°C for 40 min and absorbance was read every 10 seconds at 405 nm.
Morphometric analysis of adipose tissue
A small portion of mesenteric adipose tissue was collected from all animals, at the end of the study. Adipose tissue was fixed at 4°C in 10% buffered formaldehyde for at least 48 h and then dehydrated and embedded in paraffin. Three to 5 µm-thick sections were obtained with a Leica Microtome (RM2125RT, Lisbon, Portugal) and stained with hematoxylin and eosin to assess morphology. Digital images were acquired, under specimen identity occultation, with a microscope (Nikon Eclipse 50i, Melville, NY, USA) at a magnification of 200×. The adipocyte area was calculated using ImageJ software (National Institute of Health, Bethesda, MD, USA) with the average of values obtained from 100 adipocytes per animal.
DNA extraction from stool
Genomic DNA was extracted and purified from stool samples using NZY Tissue gDNA Isolation Kit (nzytech, Lisbon, Portugal) with some modifications. Briefly, faeces (170–200 mg) were homogenized in TE buffer (10 mM Tris/HCl; 1 mM EDTA, pH 8.0) and centrifuged at 4000 × g for 15 min. The supernatant was discarded and the pellet was resuspended in 350 μL of buffer NT1. After an incubation step at 95°C for 10 min, samples were centrifuged at 11000 × g for 1 min. Then, 25 μL of proteinase K were added to 200 μL of the supernatant for incubation at 70°C for 10 min. The remaining steps followed manufacturer's instructions. DNA purity and quantification were assessed with a NanoDrop spectrophotometer (Thermo Scientific, Wilmington, DE, USA).
Microbial analysis of Rat stool by real-time PCR
Real-time PCR was performed in sealed 96-well microplates using a LightCycler FastStart DNA Master SYBR Green kit and a LightCycler instrument (Roche Applied Science, Indianapolis, ID, USA). PCR reactions mixtures (total of 10 μL) contained 5 μL of 2× Faststart SYBR Green (Roche Diagnostics Ltd), 0.2 μl of each primer (final concentration of 0.2 μM), 3.6 μL of water and 1 μL of DNA (equilibrated to 20 ng). Primer sequences (Sigma-Aldrich, St. Louis, MO, USA) used to target the 16S rRNA gene of the bacteria and the conditions for PCR amplification reactions are reported in Table 1. To verify the specificity of the amplicon, a melting curve analysis was performed via monitoring SYBR Green fluorescence in the temperature ramp from 60 to 97°C. Data were processed and analyzed using the LightCycler software (Roche Applied Science). Standard curves were constructed using serial tenfold dilutions of bacterial genomic DNA, according to the following webpage http://cels.uri.edu/gsc/cndna.html. Bacterial genomic DNA used as a standard (Table 1) was obtained from DSMZ (Braunschweig, Germany). Genome size and the copy number of the 16S rRNA gene for each bacterial strain used as a standard was obtained from NCBI Genome database (www.ncbi.nlm.nih.gov). Data are presented as the mean values of duplicate PCR analysis.
Table 1.
Primer sequences and real-time PCR conditions used for gut microbiota analysis
| Target group | Primer sequence (5′-3′) | Genomic DNA Standard | PCR product Size (bp) | AT | Reference |
|---|---|---|---|---|---|
| Firmicutes | ATG TGG TTT AAT TCG AAG CA AGC TGA CGA CAA CCA TGC AC |
Lactobacillus gasseri ATCC 33323 |
126 | 60°C | 38 |
| Bacteroidetes | CAT GTG GTT TAA TTC GAT GAT AGC TGA CGA CAA CCA TGC AG |
Bacteroides vulgatus ATCC 8482 |
126 | 60°C | 38 |
| Lactobacillus | GAG GCA GCA GTA GGG AAT CTT C GGC CAG TTA CTA CCT CTA TCC TTC TTC |
Lactobacillus gasseri ATCC 33323 |
126 | 60°C | 39 |
| Enterococcus | CCC TTA TTG TTA GTT GCC ATC ATT ACT CGT TGT ACT TCC CT TGT |
Enterococcus gilvus ATCC BAA-350 |
144 | 61°C | 40 |
| Clostridium leptum | GCA CAA GCA GTG GAG T CTT CCT CCG TTT TGT CAA |
Clostridium leptum ATCC 29065 |
239 | 60°C | 41 |
| Bacteroides | ATA GCC TTT CGA AAG RAA GAT CCA GTA TCA ACT GCA ATT TTA |
Bacteroides vulgatus ATCC 8482 |
495 | 60°C | 42 |
| Prevotella | CAC RGT AAA CGA TGG ATG CC GGT CGG GTT GCA GAC C |
Prevotella nigrescens ATCC 33563 |
513 | 55°C | 42 |
| Bifidobacterium | CGC GTC YGG TGT GAA AG CCC CAC ATC CAG CAT CCA |
Bifidobacterium longum subsp. Infantis ATCC 15697 | 244 | 60°C | 39 |
AT, annealing temperature; bp, base pairs.
Statistical analysis
Values are expressed as the arithmetic mean ± standard error of the mean (SEM). Two-way ANOVA was used to determine the main effects of diet (St vs HF diet), strain (Wistar vs SD Rat) and their interaction. Tukey's multiple comparison test was used to determine differences between all experimental groups, whenever a significant interaction was identified. Two-way ANOVA repeated measures followed by Tukey's multiple comparison test was used to evaluate the differences between experimental conditions throughout time. To analyze the differences between 2 groups, a t test was used. The differences were considered statistically significant when P < 0.05. All statistical analyses were performed using GraphPad Prism 6 statistical software (GraphPad Software Inc.., La Jolla, CA, USA).
Disclosure of Potential Conflicts of Interest
No potential conflicts of interest were disclosed.
Funding
Financial support from Fundação para Ciência e Tecnologia (PTDC/AGR-TEC/2227/2012; SFRH/BPD/75294/2010; SFRH/BD/78367/2011 and SFRH/BD/93073/2013) is gratefully acknowledged.
References
- 1.Alberti KG, Eckel RH, Grundy SM, Zimmet PZ, Cleeman JI, Donato KA, Fruchart JC, James WP, Loria CM, Smith SC Jr.. Harmonizing the metabolic syndrome: a joint interim statement of the International Diabetes Federation Task Force on Epidemiology and Prevention; National Heart, Lung, and Blood Institute; American Heart Association; World Heart Federation; International Atherosclerosis Society; and International Association for the Study of Obesity. Circulation 2009; 120:1640-5; PMID:19805654; http://dx.doi.org/ 10.1161/CIRCULATIONAHA.109.192644 [DOI] [PubMed] [Google Scholar]
- 2.Ng M, Fleming T, Robinson M, Thomson B, Graetz N, Margono C, Mullany EC, Biryukov S, Abbafati C, Abera SF, et al.. Global, regional, and national prevalence of overweight and obesity in children and adults during 1980-2013: a systematic analysis for the Global Burden of Disease Study 2013. Lancet 2014; 384:766-81; PMID:24880830; http://dx.doi.org/ 10.1016/S0140-6736(14)60460-8 [DOI] [PMC free article] [PubMed] [Google Scholar]
- 3.Panchal SK, Brown L. Rodent models for metabolic syndrome research. J Biomed Biotech 2011; 2011:351982; PMID:21253582; http://dx.doi.org/ 10.1155/2011/351982 [DOI] [PMC free article] [PubMed] [Google Scholar]
- 4.Nilsson C, Raun K, Yan FF, Larsen MO, Tang-Christensen M. Laboratory animals as surrogate models of human obesity. Acta Pharmacol Sinica 2012; 33:173-81; PMID:22301857; http://dx.doi.org/ 10.1038/aps.2011.203 [DOI] [PMC free article] [PubMed] [Google Scholar]
- 5.Malik VS, Willett WC, Hu FB. Global obesity: trends, risk factors and policy implications. Nat Rev Endocrinol 2013; 9:13-27; PMID:23165161; http://dx.doi.org/ 10.1038/nrendo.2012.199 [DOI] [PubMed] [Google Scholar]
- 6.Buettner R, Scholmerich J, Bollheimer LC. High-fat diets: modeling the metabolic disorders of human obesity in rodents. Obesity (Silver Spring) 2007; 15:798-808; PMID:17426312; http://dx.doi.org/ 10.1038/oby.2007.608 [DOI] [PubMed] [Google Scholar]
- 7.Davidson EP, Coppey LJ, Dake B, Yorek MA. Effect of treatment of sprague dawley rats with AVE7688, enalapril, or candoxatril on diet-induced obesity. J Obesity 2011; 2011:pii: 686952; PMID:20847891 [DOI] [PMC free article] [PubMed] [Google Scholar]
- 8.Briaud I, Kelpe CL, Johnson LM, Tran PO, Poitout V. Differential effects of hyperlipidemia on insulin secretion in islets of langerhans from hyperglycemic versus normoglycemic rats. Diabetes 2002; 51:662-8; PMID: 11872664; http://dx.doi.org/ 10.2337/diabetes.51.3.662 [DOI] [PubMed] [Google Scholar]
- 9.Klok MD, Jakobsdottir S, Drent ML. The role of leptin and ghrelin in the regulation of food intake and body weight in humans: a review. Obesity Rev 2007; 8:21-34; PMID:17212793; http://dx.doi.org/ 10.1111/j.1467-789X.2006.00270.x [DOI] [PubMed] [Google Scholar]
- 10.Klein S, Coppack SW, Mohamed-Ali V, Landt M. Adipose tissue leptin production and plasma leptin kinetics in humans. Diabetes 1996; 45:984-7; PMID:8666153; http://dx.doi.org/ 10.2337/diab.45.7.984 [DOI] [PubMed] [Google Scholar]
- 11.Frederich RC, Hamann A, Anderson S, Lollmann B, Lowell BB, Flier JS. Leptin levels reflect body lipid content in mice: evidence for diet-induced resistance to leptin action. Nat Med 1995; 1:1311-4; PMID:7489415; http://dx.doi.org/ 10.1038/nm1295-1311 [DOI] [PubMed] [Google Scholar]
- 12.de Lartigue G, Ronveaux CC, Raybould HE. Deletion of leptin signaling in vagal afferent neurons results in hyperphagia and obesity. Mol Metab 2014; 3:595-607; PMID:25161883; http://dx.doi.org/ 10.1016/j.molmet.2014.06003 [DOI] [PMC free article] [PubMed] [Google Scholar]
- 13.Davidson EP, Coppey LJ, Calcutt NA, Oltman CL, Yorek MA. Diet-induced obesity in Sprague-Dawley rats causes microvascular and neural dysfunction. Diab Metab Res Rev 2010; 26:306-18 [DOI] [PMC free article] [PubMed] [Google Scholar]
- 14.Scheid MP, Sweeney G. The role of adiponectin signaling in metabolic syndrome and cancer. Rev Endocr Metab Disord 2014; 15:157-67; PMID:24019064; http://dx.doi.org/ 10.1007/s11154-013-9265-5 [DOI] [PubMed] [Google Scholar]
- 15.Hubner G, Voss C. [Protein fractions and total proteins in serum of rats on high fat diets]. Die Nahrung 1978; 22:85-8; PMID:80747; http://dx.doi.org/ 10.1002/food.19780220113 [DOI] [PubMed] [Google Scholar]
- 16.Schreiber G, Aldred AR, Thomas T, Birch HE, Dickson PW, Tu GF, Heinrich PC, Northemann W, Howlett GJ, de Jong FA, et al.. Levels of messenger ribonucleic acids for plasma proteins in rat liver during acute experimental inflammation. Inflammation 1986; 10:59-66; PMID:2420720; http://dx.doi.org/ 10.1007/BF00916041 [DOI] [PubMed] [Google Scholar]
- 17.Ebenezer PJ, Mariappan N, Elks CM, Haque M, Francis J. Diet-induced renal changes in Zucker rats are ameliorated by the superoxide dismutase mimetic TEMPOL. Obesity (Silver Spring) 2009; 17:1994-2002; PMID:19424163; http://dx.doi.org/ 10.1038/oby.2009.137 [DOI] [PMC free article] [PubMed] [Google Scholar]
- 18.Carmiel-Haggai M, Cederbaum AI, Nieto N. A high-fat diet leads to the progression of non-alcoholic fatty liver disease in obese rats. FASEB J 2005; 19:136-8; PMID:15522905 [DOI] [PubMed] [Google Scholar]
- 19.Panchal SK, Poudyal H, Iyer A, Nazer R, Alam MA, Diwan V, Kauter K, Sernia C, Campbell F, Ward L, et al.. High-carbohydrate, high-fat diet-induced metabolic syndrome and cardiovascular remodeling in rats. J Cardiovasc Pharmacol 2011; 57:611-24; PMID:21572266; http://dx.doi.org/ 10.1097/FJC.0b013e3181feb90a [DOI] [PubMed] [Google Scholar]
- 20.Eckel RH, Grundy SM, Zimmet PZ. The metabolic syndrome. Lancet 2005; 365:1415-28; PMID:15836891; http://dx.doi.org/ 10.1016/S0140-6736(05)66378-7 [DOI] [PubMed] [Google Scholar]
- 21.Dobrian AD, Davies MJ, Prewitt RL, Lauterio TJ. Development of hypertension in a rat model of diet-induced obesity. Hypertension 2000; 35:1009-15; PMID:10775577; http://dx.doi.org/ 10.1161/01.HYP.35.4.1009 [DOI] [PubMed] [Google Scholar]
- 22.Dobrian AD, Schriver SD, Lynch T, Prewitt RL. Effect of salt on hypertension and oxidative stress in a rat model of diet-induced obesity. Am J Physiol Renal Physiol 2003; 285:F619-28; PMID:12799306; http://dx.doi.org/ 10.1152/ajprenal.00388.2002 [DOI] [PubMed] [Google Scholar]
- 23.Angelakis E, Armougom F, Million M, Raoult D. The relationship between gut microbiota and weight gain in humans. Future Microbiol 2012; 7:91-109; PMID:22191449; http://dx.doi.org/ 10.2217/fmb.11.142 [DOI] [PubMed] [Google Scholar]
- 24.Clarke SF, Murphy EF, Nilaweera K, Ross PR, Shanahan F, O'Toole PW, Cotter PD. The gut microbiota and its relationship to diet and obesity: new insights. Gut Microbes 2012; 3:186-202; PMID:22572830; http://dx.doi.org/ 10.4161/gmic.20168 [DOI] [PMC free article] [PubMed] [Google Scholar]
- 25.Li HK, Ni Y, Su MM, Qiu YP, Zhou MM, Qiu MF, Zhao AH, Zhao LP, Jia W. Pharmacometabonomic phenotyping reveals different responses to xenobiotic intervention in rats. J Proteome Res 2007; 6:1364-70; PMID:17311441; http://dx.doi.org/ 10.1021/pr060513q [DOI] [PubMed] [Google Scholar]
- 26.Bomhof MR, Saha DC, Reid DT, Paul HA, Reimer RA. Combined effects of oligofructose and Bifidobacterium animalis on gut microbiota and glycemia in obese rats. Obesity (Silver Spring) 2014; 22:763-71; PMID:24124012; http://dx.doi.org/ 10.1002/oby.20632 [DOI] [PubMed] [Google Scholar]
- 27.Dewulf EM, Cani PD, Claus SP, Fuentes S, Puylaert PG, Neyrinck AM, Bindels LB, de Vos WM, Gibson GR, Thissen JP, et al.. Insight into the prebiotic concept: lessons from an exploratory, double blind intervention study with inulin-type fructans in obese women. Gut 2013; 62:1112-21; PMID:23135760; http://dx.doi.org/ 10.1136/gutjnl-2012-303304 [DOI] [PMC free article] [PubMed] [Google Scholar]
- 28.Wang JH, Bose S, Kim GC, Hong SU, Kim JH, Kim JE, Kim H. Flos Lonicera ameliorates obesity and associated endotoxemia in rats through modulation of gut permeability and intestinal microbiota. PloS one 2014; 9:e86117; PMID:24475077; http://dx.doi.org/ 10.1371/journal.pone.0086117 [DOI] [PMC free article] [PubMed] [Google Scholar]
- 29.Verdam FJ, Fuentes S, de Jonge C, Zoetendal EG, Erbil R, Greve JW, Buurman WA, de Vos WM, Rensen SS. Human intestinal microbiota composition is associated with local and systemic inflammation in obesity. Obesity (Silver Spring) 2013; 21:E607-15; PMID:23526699; http://dx.doi.org/ 10.1002/oby.20466 [DOI] [PubMed] [Google Scholar]
- 30.Bervoets L, Van Hoorenbeeck K, Kortleven I, Van Noten C, Hens N, Vael C, Goossens H, Desager KN, Vankerckhoven V. Differences in gut microbiota composition between obese and lean children: a cross-sectional study. Gut Pathog 2013; 5:10; PMID:23631345; http://dx.doi.org/ 10.1186/1757-4749-5-10 [DOI] [PMC free article] [PubMed] [Google Scholar]
- 31.Teixeira TFS, Grzeskowiak LM, Salminen S, Laitinen K, Bressan J, Peluzio MDG. Faecal levels of Bifidobacterium and Clostridium coccoides but not plasma lipopolysaccharide are inversely related to insulin and HOMA index in women. Clin Nutr 2013; 32:1017-22; PMID:23538004; http://dx.doi.org/ 10.1016/j.clnu.2013.02.008 [DOI] [PubMed] [Google Scholar]
- 32.Cani PD, Bibiloni R, Knauf C, Waget A, Neyrinck AM, Delzenne NM, Burcelin R. Changes in gut microbiota control metabolic endotoxemia-induced inflammation in high-fat diet-induced obesity and diabetes in mice. Diabetes 2008; 57:1470-81; PMID:18305141; http://dx.doi.org/ 10.2337/db07-1403 [DOI] [PubMed] [Google Scholar]
- 33.Cani PD, Amar J, Iglesias MA, Poggi M, Knauf C, Bastelica D, Neyrinck AM, Fava F, Tuohy KM, Chabo C, et al.. Metabolic endotoxemia initiates obesity and insulin resistance. Diabetes 2007; 56:1761-72; PMID:17456850; http://dx.doi.org/ 10.2337/db06-1491 [DOI] [PubMed] [Google Scholar]
- 34.Laugerette F, Alligier M, Bastard JP, Drai J, Chanseaume E, Lambert-Porcheron S, Laville M, Morio B, Vidal H, Michalski MC. Overfeeding increases postprandial endotoxemia in men: Inflammatory outcome may depend on LPS transporters LBP and sCD14. Mol Nutr Food Res 2014; 58:1513-8; PMID:24687809; http://dx.doi.org/ 10.1002/mnfr.201400044 [DOI] [PubMed] [Google Scholar]
- 35.Rutter K, Hennoste L, Ward LC, Cornish BH, Thomas BJ. Bioelectrical impedance analysis for the estimation of body composition in rats. Lab Anim 1998; 32:65-71; PMID: 9481696; http://dx.doi.org/ 10.1258/002367798780559356 [DOI] [PubMed] [Google Scholar]
- 36.Muniyappa R, Chen H, Muzumdar RH, Einstein FH, Yan X, Yue LQ, Barzilai N, Quon MJ. Comparison between surrogate indexes of insulin sensitivity/resistance and hyperinsulinemic euglycemic clamp estimates in rats. Am J Physiol Endocrinol Metab 2009; 297:E1023-9; PMID:19706785; http://dx.doi.org/ 10.1152/ajpendo.00397.2009 [DOI] [PMC free article] [PubMed] [Google Scholar]
- 37.Ibrahim J, Berk BC, Hughes AD. Comparison of simultaneous measurements of blood pressure by tail-cuff and carotid arterial methods in conscious spontaneously hypertensive and Wistar-Kyoto rats. Clin Exp Hypertens 2006; 28:57-72; PMID:16443565; http://dx.doi.org/ 10.1080/10641960500386817 [DOI] [PubMed] [Google Scholar]
- 38.Queipo-Ortuno MI, Seoane LM, Murri M, Pardo M, Gomez-Zumaquero JM, Cardona F, Casanueva F, Tinahones FJ. Gut microbiota composition in male rat models under different nutritional status and physical activity and its association with serum leptin and ghrelin levels. PloS One 2013; 8:e65465; PMID:23724144; http://dx.doi.org/ 10.1371/journal.pone.0065465 [DOI] [PMC free article] [PubMed] [Google Scholar]
- 39.Delroisse JM, Boulvin AL, Parmentier I, Dauphin RD, Vandenbol M, Portetelle D. Quantification of Bifidobacterium spp. and Lactobacillus spp. in rat fecal samples by real-time PCR. Microbiol Res 2008; 163:663-70; PMID:19216105; http://dx.doi.org/ 10.1016/j.micres.2006.09.004 [DOI] [PubMed] [Google Scholar]
- 40.Rinttila T, Kassinen A, Malinen E, Krogius L, Palva A. Development of an extensive set of 16S rDNA-targeted primers for quantification of pathogenic and indigenous bacteria in faecal samples by real-time PCR. J Appl Microbiol 2004; 97:1166-77; PMID: 15546407; http://dx.doi.org/ 10.1111/j.1365-2672.2004.02409.x [DOI] [PubMed] [Google Scholar]
- 41.Matsuki T, Watanabe K, Fujimoto J, Takada T, Tanaka R. Use of 16S rRNA gene-targeted group-specific primers for real-time PCR analysis of predominant bacteria in human feces. Appl Environ Microbiol 2004; 70:7220-8; PMID:15574920; http://dx.doi.org/ 10.1128/AEM.70.12.7220-7228.2004 [DOI] [PMC free article] [PubMed] [Google Scholar]
- 42.Matsuki T, Watanabe K, Fujimoto J, Miyamoto Y, Takada T, Matsumoto K, Oyaizu H, Tanaka R. Development of 16S rRNA-gene-targeted group-specific primers for the detection and identification of predominant bacteria in human feces. Appl Environ Microbiol 2002; 68:5445-51; PMID:12406736; http://dx.doi.org/ 10.1128/AEM.68.11.5445-5451.2002 [DOI] [PMC free article] [PubMed] [Google Scholar]