Abstract
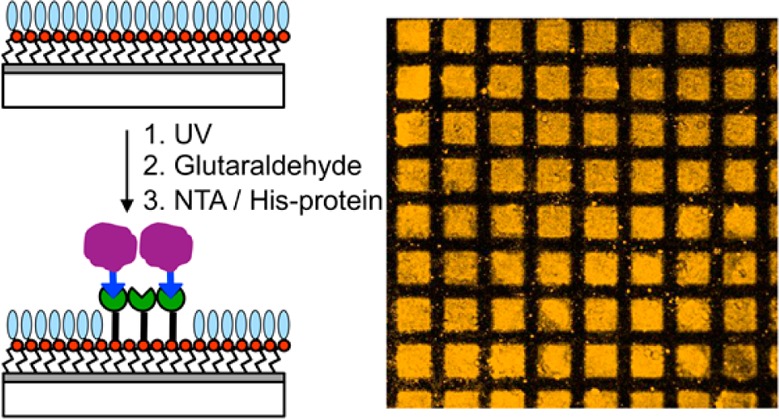
The site-specific immobilization of histidine-tagged proteins to patterns formed by far-field and near-field exposure of films of aminosilanes with protein-resistant photolabile protecting groups is demonstrated. After deprotection of the aminosilane, either through a mask or using a scanning near-field optical microscope, the amine terminal groups are derivatized first with glutaraldehyde and then with N-(5-amino-1-carboxypentyl)iminodiacetic acid to yield a nitrilo-triacetic-acid-terminated surface. After complexation with Ni2+, this surface binds histidine-tagged GFP and CpcA-PEB in a site-specific fashion. The chemistry is simple and reliable and leads to extensive surface functionalization. Bright fluorescence is observed in fluorescence microscopy images of micrometer- and nanometer-scale patterns. X-ray photoelectron spectroscopy is used to study quantitatively the efficiency of photodeprotection and the reactivity of the modified surfaces. The efficiency of the protein binding process is investigated quantitatively by ellipsometry and by fluorescence microscopy. We find that regions of the surface not exposed to UV light bind negligible amounts of His-tagged proteins, indicating that the oligo(ethylene glycol) adduct on the nitrophenyl protecting group confers excellent protein resistance; in contrast, exposed regions bind His-GFP very effectively, yielding strong fluorescence that is almost completely removed on treatment of the surface with imidazole, confirming a degree of site-specific binding in excess of 90%. This simple strategy offers a versatile generic route to the spatially selective site-specific immobilization of proteins at surfaces.
Introduction
Proteins regulate many interfacial processes, including cellular attachment,1−4 biosensing,5−8 thrombogenesis,9,10 inflammation,11 and fouling by bacteria,12 algae,13 and marine organisms.14−16 The investigation of biological interfacial phenomena requires the capacity both to characterize and to control the organization of biological molecules, including proteins, at surfaces. For example, the fabrication of assemblies of cell adhesion molecules with spatial organization on nanometer length scales3,4 has provided insights into the clustering of integrins during the formation of focal adhesions in mammalian cell attachment; the arrangement of biological molecules at surfaces is also important in biosensors,17 and the fabrication of arrays of immobilized biological recognition elements (oligonucleotides,7 antibodies, aptamers,18 etc.) is important in many high-throughput detection systems.17 However, the control of organization of proteins on submicrometer-length scales remains extremely challenging; while DNA-based biochips are widespread, the development of protein chips has been significantly slower.
A variety of techniques have been used to pattern proteins on submicrometer length scales, including microcontact printing,19 photolithography,20−22 electron beam lithography,23,24 dip-pen nanolithography,25,26 local oxidation techniques,27 near-field lithography,28−31 interferometric lithography,32−34 and nanoimprinting.34,35 Significant progress has been made in recent years, but there is still a need to develop simple, generic methodologies capable of widespread implementation. The development of surface chemical methods to control the architecture of the biological interface is an essential element of such methods.36,37 The primary requirement is to control nonspecific adhesion.38 The most widely used approaches have been based around oligo(ethylene glycol) (OEG) derivatives,39 including OEG-terminated monolayers of alkylthiolates,40−42 alkenes43 and silanes,30,32 poly(ethylene glycol),39 and poly(oligoethylene glycol methacrylate) brushes,44,45 although other materials, for example, zwitterionic poly(amino acid methacrylate) brushes,33 have also been used to good effect. Once adequate control of nonspecific adsorption has been achieved, it is also necessary to ensure that biomolecules are presented in an appropriate conformation by facilitating site-specific immobilization of a high fraction of the immobilized proteins to address biological hypotheses in a meaningful way. There remains a need to develop simple, generic methods to achieve this end.
Recently the synthesis of a new protein-resistant siloxane, (methoxyheptaethylene glycol)nitrophenylethoxycarbonyl-protected aminopropyltriethoxysilane (henceforth OEG-NPEOC-APTES), was described.29 This molecule consists of an aminosiloxane that is protected by a photocleavable, protein-resistant protecting group. When a film formed by the adsorption of OEG-NPEOC-APTES on silica is exposed to near-UV light, photocleavage of the nitrophenyl protecting group occurs, exposing the amine and lifting the protein-resistance of the surface (Scheme 1).
Scheme 1. Photodeprotection of a Film Formed by the Adsorption of Protein-Resistant OEG-NPEOC-APTES on Silica Yields an Amine-Terminated Surface.
Here we describe an approach to the site-specific immobilization of proteins on films of OEG-NPEOC-APTES that have been patterned by exposure at 244 nm. The use of NTA-His-tag interactions to immobilize proteins at surfaces has been described by a number of authors,46−48 and NTA-His-tag strategies are widely used by biochemists for the manipulation of proteins; they are thus attractive as a generic means for the control of protein organization on the nanometer scale.31,49,50 The goal of the present work was to examine an approach to protein patterning that combined photopatterning of OEG-NPEOC-APTES with simple derivatization chemistry. The process, shown schematically in Figure 1, involves the reaction of amine groups exposed by the lithographic step with glutaraldehyde to enable capture of a nitrilotriacetic acid (NTA) derivative with an amine linker; complexation of the NTA-functionalized surface with Ni2+ is followed by binding of histidine-tagged proteins. We sought to investigate quantitatively the efficacy of this simple scheme. We find that it enables the fabrication of well-resolved patterns exhibiting excellent spatial control of protein attachment, containing a high fraction of site-specifically bound proteins. We use ellipsometry and fluorescence measurements to demonstrate quantitatively the efficiency of patterning and of site-specific binding of proteins on the micrometer and nanometer length scales.
Figure 1.
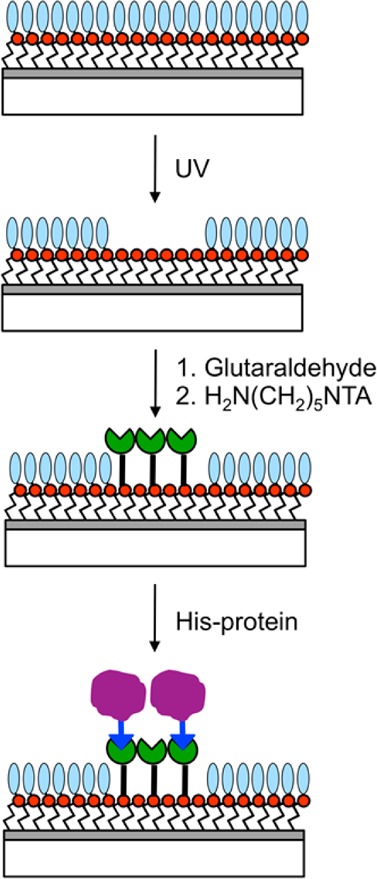
Schematic representation of the patterning process investigated here.
Experimental Section
Materials
Sulfuric acid ((1.83 S.G. 95+%), hydrogen peroxide solution (100 volumes 30+%), ammonia solution (S. G. 0.88, 35%), and toluene (HPLC grade) were supplied by Fisher Scientific (Loughborough, U.K.) and used as received. Ethanol (absolute) and glutaraldehyde solution (grade II, 50% in water) were obtained from VWR international (Lutterworth, U.K.). N-(5-Amino-1-carboxypentyl)iminodiacetic acid (ABNTA) was purchased from Dojindo Molecular Technologies (Munich, Germany). HS(CH2)11(EG)3NTA was purchased from Prochimia Surfaces (Sopot, Poland). (3-Aminopropyl)triethoxysilane (APTES, 99%) and phosphate-buffered saline (PBS) tablets were supplied by Sigma-Aldrich (Poole, U.K.). PBS tablets were prepared into PBS buffer solution (pH 7.4) in our lab. (Methoxyheptaethylene glycol)nitrophenylethoxycarbonyl-protected aminopropyltriethoxysilane was synthesized by AF ChemPharm (Sheffield, U.K.). Silicon wafers (reclaimed, p-type, < 100>) were supplied by Compart Technology (Tamworth, U.K.). Quartz slides (50 mm × 25 mm × 1 mm) were supplied by Agar Scientific (Stansted, U.K.) and coverslips (20 × 60 mm) were supplied by Menzel-Gläser (Braunschweig, Germany).
All substrates used in the preparation of silane films were cleaned first with piranha solution, a mixture of 30% hydrogen peroxide and 95% concentrated sulfuric acid in the ratio of 3:7 (Caution: Piranha solution is a strong oxidizing agent and may detonate unexpectedly on contact with organic materials) and then with the Radio Cooperative of America (RCA) cleaning solution, a mixture of water, 30% hydrogen peroxide, and 35% ammonia solution in the ratio of 5:1:1. After rinsing with copious amounts of deionized water, substrates were dried overnight in an oven at 120 °C.
The gene-encoding GFP was cloned into pET14b (Novagen), and the resulting plasmid was transformed into BL21-competent cells. Single colonies were inoculated into 6 mL of LB plus ampicillin and allowed to grow overnight at 37 °C, then subcultured into a 400 mL LB/ampicillin) in a conical flask. After shaking for 2 h at 37 °C cells were induced with 1 mM IPTG for 4 h, then pelletted and frozen at −20 °C until further use. Cells harvested from a 400 mL culture were resuspended in 10 mL of membrane buffer A (20 mM MOPS, pH 7 100 mM NaCl), and a few grains of DNase I and lysozyme and MgCl2 to 20 mM were added to the suspension and left to incubate at room temperature for 1 h. The cells were then disrupted by two cycles in a French pressure cell at 18 000 psi. The lysate was centrifuged at 15 000 rpm for 25 min, and the supernatant was loaded onto a 50 mL column packed with chelating sepharose fast flow resin (GE Healthcare) charged with nickel and equilibrated with buffer A. The column was washed with five column volumes of buffer A, then a gradient of three column volumes was applied ending with 50 mL of 100% buffer B (buffer A + 500 mM imidazole). The fractions containing the pure GFP were pooled, concentrated, exchanged with buffer A, then stored at −80 °C until further use.
The plasmids for the expression of CpcA-Phycoerythrobilin (CpcA-PEB) were transformed into E. coli BL21 (DE3) cells.51 Frozen cells containing recombinant protein were thawed, resuspended in Buffer O (20 mL of buffer was used for the cells from 1.0 L of culture), and lysed by three passages through a chilled French pressure cell at 138 MPa. The resulting whole-cell lysate was centrifuged for 35 min at 35 000g to remove unbroken cells and large cellular debris. [His6]-tagged recombinant proteins were purified by affinity chromatography on columns (1.0 mL bed volume) containing Ni-Superdex-S200 resin (GE Healthcare); proteins were eluted with Buffer O containing 250 mM imidazole.52 Recombinant proteins were dialyzed against buffer O overnight at 4 °C to remove the imidazole. Purified proteins were stored at −80 °C until analyzed.
Film Formation and Derivatization
To prepare aminated control surfaces, we immersed clean silicon wafers or glass slides in a 1% (v/v) solution of APTES in toluene for 1 h. To prepare OEG-NPEOC-APTES films, we immersed the substrates in a 0.1% (v/v) solution of OEG-NPEOC-APTES in toluene for 48 h. After film formation, the substrates were washed several times with toluene and ethanol and dried under a stream of nitrogen. Finally, the samples were annealed at 120 °C for 1 h in a vacuum oven.
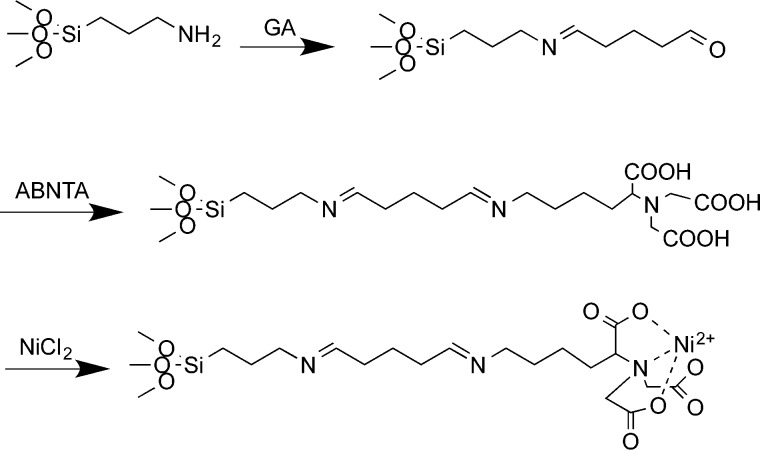
To derivatize amine-terminated films, we first placed them in a 25% (v/v) glutaraldehyde solution (pH 5) for 1 h to form an aldehyde-functionalized surface. Subsequently, the samples were immersed in a 10 mM aqueous solution of ABNTA (pH 5) overnight to produce NTA functional surfaces. The Ni2+-chelated surfaces were prepared by treating NTA functional surfaces with 500 mM NiCl2 for 2 h. The reaction is shown in Scheme 2.
Scheme 2. Sequence of Reactions Used to Prepare an Aminated Surface for Immobilization of Histidine-Tagged Proteins.
Reaction with glutaraldehyde to generate an aldehyde-functionalized surface; reaction between surface aldehyde groups and N-(5-amino-1-carboxypentyl)iminodiacetic acid to yield an NTA-functionalized surface; and finally complexation of the carboxylic acid groups with Ni2+ ions.
Alternatively, the aldehyde-functionalized surfaces were immersed in a 4% (v/v) solution of NH2CH2CF3 in water for 3 h to produce CF3-tagged surfaces. The reaction process is shown in Scheme 2. Derivatization by reaction with trifluoroacetic anhydride (TFAA) was carried out by immersing samples in a 3% (v/v) solution of a 1:1 mixture of TFAA and triethylamine in DMF for 3 h. After completion of the reaction, samples were rinsed with ethanol and dried under a stream of nitrogen.
Clean gold substrates were immersed in a 4 mM solution of HS(CH2)11(EG)3NTA in water for 2 h. The samples were rinsed with deionized water several times and dried with N2. The preparation process is shown in Scheme 2.
Photochemistry and Patterning
Photochemical modification of silane films was carried out by exposing samples to light from a frequency-doubled argon ion laser (Coherent Innova FreD 300C) emitting at 244 nm or a HeCd laser (IK 3202R-D, Kimmon, Tokyo, Japan) emitting at 325 nm. Micropatterning was performed by exposing the sample through a copper electron microscope grid (Agar, Stansted, U.K.), and nanopatterning was performed using the HeCd laser coupled to a WiTec AlphaSNOM scanning near-field optical microscope (WiTec, Ulm, Germany). The SNOM system used cantilever probes (WiTec) with hollow pyramidal tips that had apertures at their apexes. The resolution is defined by the aperture size, which was ca. 150 nm.
After photopatterning, OEG-NPEOC-APTES-modified substrates were immersed in PBS solution (pH 7.4) for 0.5 h and dried under a stream of N2 gas. Subsequently the substrates were derivatized with aldehyde functional groups and NTA as previously described. Samples were immersed in a solution of the appropriate protein in phosphate-buffered saline solution (pH 7.4) overnight (Scheme 2), rinsed with PBS solution, and characterized using a LSM 510 Meta laser scanning confocal microscope (Carl Zeiss, Welwyn Garden City, U.K.)
Surface Analysis
X-ray photoelectron spectroscopy was carried out using a Kratos Axis Ultra X-ray photoelectron spectrometer equipped with a delay-line detector and operating at a base pressure of 1 × 10⁻⁹ mbar. Survey spectra were acquired at pass energy of 160 eV and high-resolution spectra were acquired at pass energy of 20 eV. All XPS spectra were analyzed and curve-fitted using the Casa XPS software and were corrected relative to the C 1s signal at binding energy (B.E.) = 285.0 eV. Peak fitting was done using combinations of Gaussian (30%) and Lorentzian (70%) curves. The components in a given region were constrained to have the same full width at half-maximum (fwhm), in the range 1.3 to 1.5 eV. Measurements were typically made in triplicate, and errors quoted in numerical data are the standard deviations.
Film thicknesses were measured using an M-2000 V ellipsometer (J. A. Woollam). The data were fitted using the model into a Cauchy model using the software CompleteEASE.
Confocal microscopy was carried out using an LSM 510 laser scanning confocal microscope (Carl Zeiss). Lasers emitting at 488 (GFP) and 543 nm (CpcA-PEB) were used for excitation. A 40× or 63× magnification oil-immersion lens was used for imaging the samples, which were mounted in an antifade reagent (glycerol-PBS solution, AF1) (Citifluor, London, U.K.). The captured images were analyzed using Zeiss LSM image browser software.
Results and Discussion
XPS Analysis of NTA-Functionalized APTES Surfaces
Scheme 2 shows the sequence of reactions used to form an NTA-functionalized surface. Deprotection of OEG-NPEOC-APTES yields aminopropyl(triethoxysilane) (APTES), which is reacted with glutaraldehyde (GA), a dialdehyde bifunctional linker. One aldehyde group on the GA molecule reacts with the terminal amine to form an imine bond, while the other aldehyde group is presented at the surface. Incubation of this aldehyde-terminated surface with N-(5-amino-1-carboxypentyl)iminodiacetic acid (ABNTA) leads to attachment of ABNTA to the surface via the formation of a new imine linkage between the amine linker and the surface-bound aldehyde. The reaction leading to the formation of the imine bond is acid-catalyzed, so the reaction is carried out at pH 5.
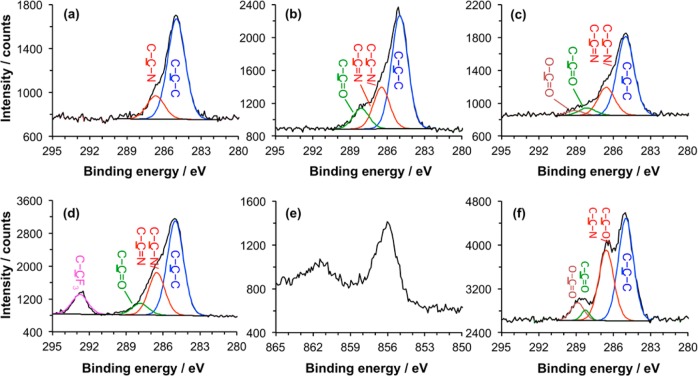
To characterize the reaction sequence in Scheme 2 and optimize the reaction conditions, we made measurements by XPS on APTES films. The XPS C 1s high-resolution spectra for different surfaces are shown in Figure 2. The spectrum of the film that results from adsorption of APTES onto silicon dioxide (Figure 2a) is fitted with two peaks: one with binding energy (BE) of 285.0 eV that is attributed to C–C–C and another with a BE of 286.6 eV that is attributed to C–C–N. After reaction with GA (Figure 2b), the spectrum of the APTES-GA surfaces is fitted with three peaks: the component at 285.0 eV again corresponds to aliphatic carbon atoms; the peak at 286.5 eV is attributed to carbon atoms in unreacted amines (C–C–N) or adjacent to the nitrogen atom in the imine group (C–C=N); and the component at 288.1 eV is attributed to C–C=O in the free aldehyde group ω to the imine bond. After incubation of the surface with ABNTA (Figure 2c), a fourth component is observed at 289.0 eV that is attributed to the carboxylate carbon atom.
Figure 2.
XPS data for APTES films following surface chemical reactions. (a) C 1s spectrum of an as-prepared film. (b) C 1s spectrum after incubation with glutaraldehyde solution. (c) C 1s spectrum after reaction of the aldehyde-functionalized surface with ABNTA. (d) C 1s spectrum after reaction of the aldehyde-functionalized surface with trifluoroethylamine. (e) Ni 2p spectrum after incubation of the NTA-functionalized surface with nickel chloride solution. (f) C 1s reference spectrum obtained for SAM of an NTA-terminated oligo(ethylene glycol) derivatized alkylthiolate on gold.
Quantitative data extracted from the XPS spectra are shown in Tables 1 and 2. For the as-prepared film of APTES, the experimentally determined fraction of C–C–N is 20%. The expected value is 33.3%. The N/C elemental ratio was 0.16 compared with a predicted value of 0.33 (see Supporting Information), consistent with this interpretation of the C 1s spectrum. Aminated surfaces have comparatively high surface free energies, and it is likely that the reduced size of the C–C–N component reflects the presence at the surface of atmospheric contamination adsorbed at the surface prior to analysis. After reaction with GA, a new component was observed corresponding to the aldehydic carbon atom. The experimentally determined percentage of C=O is 11.4%, rather similar to the calculated value 12.5%. The area of the C–C–N component also has a peak area that is similar to the expected value. This implies that a high fraction of the terminal amine groups has reacted with GA; however, caution must be exercised given that the area of the C–C–N component was somewhat reduced for the as-prepared film, and it is known that contaminant species also often contain a component at ca. 286.6 eV in their C 1s spectra.53 The elemental data (Supporting Information) suggest that the N/C ratio is smaller than expected (0.7, compared with a calculated value of 0.13), suggesting that there may indeed be some adventitious contamination, as in the first stage in the derivatization process. The final stage of the attachment process yields a less ambiguous indication of the net efficiency of reaction; the carboxylate component observed after attachment of ABNTA was not observed in any other stage of the process. The area of this peak was measured to be 3.7%, compared with an expected value, assuming 100% derivatization, of 16.8%. Neglecting attenuation effects (which will influence the precise yield), these data suggest that ca. 25% of the APTES terminal amine groups are ultimately derivatized by NTA. Bearing in mind that the NTA group is bulky and hence the final yield will be sterically constrained, this represents a significant degree of derivatization, and the most likely explanation for the anomalous area of the C–C–N peak in Figure 2a is that it results from surface contamination that was not transferred through to later stages of the derivatization process.
Table 1. Contributions to the C 1s Spectra (as % of the Total C 1s Peak Area) for APTES Films Following Surface Derivatization Reactionsa.
| C–C–C | C–C–O, C–C–N | C–C=O, N–C=O | O–C=O, O–CN=O | C–C–F3 | |
|---|---|---|---|---|---|
| APTES | 80 ± 2 (66.7) | 20 ± 2 (33.3) | n/a | n/a | n/a |
| APTES + GA | 64 ± 1 (62.5) | 25 ± 1 (25.0) | 11.4 ± 0.3 (12.5) | n/a | n/a |
| APTES + GA + ABNTA | 66 ± 1 (44.4) | 24 ± 1 (38.8) | 6.8 ± 0.6 (n/a) | 3.7 ± 0.4 (16.8) | n/a |
| APTES + GA + NH2CH2CF3 | 52 ± 5 (50.0) | 27 ± 3 (40.0) | 9 ± 3 (n/a) | n/a | 11.5 ± 0.3 (10.0) |
| HS(CH2)11EG3NTA | 54 ± 1 (44.9) | 36 ± 1 (41.4) | 3.3 ± 0.6 (3.4) | 8.2 ± 0.4 (10.3) | n/a |
Calculated values are given in parentheses.
Table 2. Contributions to the C 1s Spectra (as % of the total C 1s Peak Area) for OEG-NPEOC-APTES before and after Photodeprotection, and after Derivatizationa.
| C–C–C | C–C–O, C–C–N | C–C=O, N–C=O | O–C=O, O–CN=O | C–C–F3 | |
|---|---|---|---|---|---|
| OEG-NPEOC-APTES | 34 ± 2 (25.9) | 61 ± 2 (70.4) | n/a | 5.2 ± 0.4 (3.7) | n/a |
| deprotected OEG-NPEOC-APTES | 42 ± 2 (66.7) | 45 ± 2 (33.3) | n/a | n/a | n/a |
| deprotected film + TFAA | 47 ± 1 (40.0) | 34 ± 1 (20.0) | 13 ± 1 (20.0) | n/a | 7 ± 1 (20.0) |
| deprotected film + GA | 51 ± 2 (62.5) | 33 ± 3 (25.0) | 11 ± 1 (12.5) | n/a | n/a |
| deprotected film + GA + ABNTA | 62 ± 1 (44.4) | 27 ± 1 (38.9) | 3.8 ± 0.4 (n/a) | 7.1 ± 0.8 (16.7) | n/a |
Calculated values are given in parentheses.
To test this hypothesis, we carried out a further reaction using trifluoroethylamine, a small molecule with a distinctive fluorinated label, in place of ABNTA (Figure 2d). For this molecule, the area of the CF3 component in the XPS spectrum after reaction with the GA-functionalized APTES film was 11.5%, slightly larger than the calculated value of 10% for complete reaction. This result suggests that the extent of derivatization is very high and that the sequence of steps involved in Scheme 2 is highly efficient. The fact that the yield appears to be greater than 100% is explained by attenuation effects: The trifluoromethyl group is located at the top of the monolayer, and the signal is less strongly attenuated than, for example, photoelectrons emitted from the vicinity of the imine bond. The high extent of reaction achieved here is consistent with the hypothesis that the final extent of derivatization by ABNTA is limited by steric constraints.
Binding of His-tagged proteins requires the coordination of Ni2+ to the NTA-terminated film. To quantify the efficiency of this chelation process, we immersed samples in a 500 mM aqueous solution of NiCl2 for 2 h and characterized them by XPS. The observation of a peak in the Ni 2p high-resolution spectrum (Figure 2e) confirmed, qualitatively, the chelation of Ni2+ to the NTA groups. The experimental composition of nickel, determined from the survey spectrum (Supporting Information), was 0.7%, from which the chelating efficiency of ABNTA units was estimated to be ca. 0.5 Ni atoms per chelator (the theoretical value is 1).
To verify the positions of the components in the C 1s spectra, we used self-assembled monolayers formed by the adsorption of HS-C11-(EG)3-NTA on gold as a reference, as previously described by Cheng et al.54 The C 1s spectrum of the SAMs was also fitted with four peaks (Figure 2f): 285.0 eV attributed to C–C–C; 286.6 eV attributed to C–C–O and C–N; 288.2 eV attributed to N–C=O; and 288.9 eV attributed to O–C=O. Comparing this C 1s spectrum (Figure 2f) with the one for the APTES-GA-NTA surface (Figure 2c), we find that they have peaks with almost the same BE for O–C=O, although the relative areas are different because of the different compositions of the adsorbate molecules.
From all of the results above, it was concluded that an NTA-functionalized surface had been prepared successfully on the APTES film.
XPS Analysis of NTA-Functionalized OEG-NPEOC-APTES Surfaces
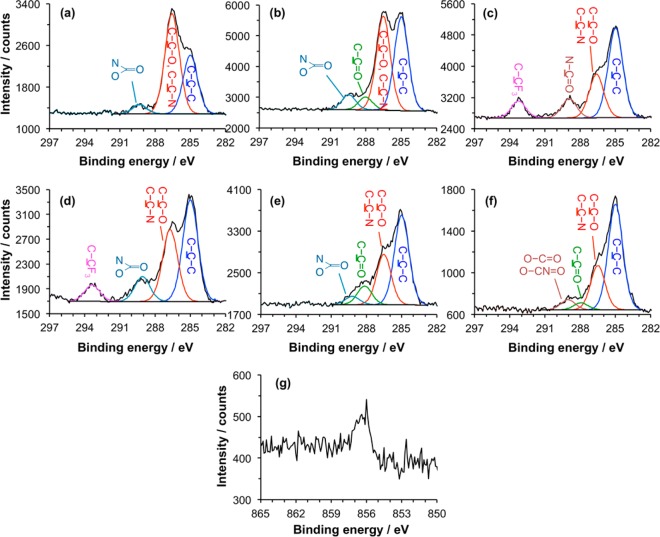
The XPS C 1s spectrum of a freshly prepared film of OEG-NPEOC-APTES is shown in Figure 3a. The most intense component in the fitted spectrum is the one at 286.5 eV corresponding to the ether carbon atoms in the OEG-functionalized protecting group. Carbon adjacent to nitrogen yields a slightly smaller chemical shift but contributes to the size of this peak. A smaller hydrocarbon peak is observed at 285.0 eV, corresponding to photoemission from carbon atoms in the aromatic ring and in the propyl linker. Finally, a small peak at 289.3 eV is attributed to the carbamate carbon, which is doubly bonded to oxygen and singly bonded to both oxygen and nitrogen.
Figure 3.
(a) C 1s spectrum of an as-prepared OEG-NPEOC-APTES film. (b) C 1s spectrum after photodeprotection by exposure to UV light at 244 nm and immersion in PBS solution. (c,d) C 1s spectra of, respectively, an APTES film and a deprotected OEG-NPEOC-APTES film following derivatization by reaction with TFAA. (e) C 1s spectrum of a deprotected OEG-NPEOC-APTES film after incubation with glutaraldehyde solution. (f) C 1s spectrum acquired after subsequent reaction of the aldehyde-functionalized surface with ABNTA. (g) Ni 2p spectrum after incubation of an NTA-functionalized surface similar to that in panel f with nickel chloride solution.
Samples were exposed to UV light. Alang-Ahmad et al. reported that freshly prepared films of NPEOC-APTES yield two components in the N 1s region of the XPS spectrum, corresponding to the carbamate nitrogen atom and the nitrogen in the NO2 group;55 near-UV UV exposure led to deprotection of OEG-NPEOC-APTES, accompanied by loss of the NO2 component in the N 1s spectrum. In the present work, the NO2 component was also found to have disappeared after exposure at the dose of 15 J cm–2 at 244 nm, but the C 1s spectrum (Figure 3b) retained a significant component at 286.6 eV. While the carbon atom adjacent to N in the propyl chain was included in this component in Figures 2a and 3a, the size of this component is nevertheless somewhat larger than expected in Figure 3b. This suggests that a significant amount of the oligo(ethylene glycol) adduct remains at the surface, although relative to the component at 285.0 eV it is reduced in size. A third component is observed at 288.1 eV and attributed, tentatively, to carbonyl carbon atoms. One possibility is that at the large exposure and high photon energy used here some of the OEG adducts undergo photodegradation to yield aldehydes, as has been reported elsewhere for similar materials.30,56 To test this hypothesis, samples that had been exposed to UV light were incubated with trifluoroethylamine, a reagent previously shown to react with aldehydes produced in photodegradation of OEG-terminated monolayers.57 Over the range of exposure studied here there was no uptake of fluorine by the samples, suggesting that photodegradation of the OEG groups to yield aldehydes was not occurring. Finally, a peak is also observed at 289.0 eV that is attributed to carbamate carbon atoms.
On the basis of these data we summarize the photochemistry of OEG-NPEOC-APTES as follows: At high exposures, N 1s spectra suggest that all of the NO2 groups are lost, but C 1s spectra suggest that OEG groups remain at the surface (albeit at slightly reduced concentrations). We hypothesize the following explanation. Photodeprotection occurs at 244 nm, as described by Alang-Ahmad et al. at longer wavelengths,29 but a competing reaction occurs after exposure at 244 nm that leads to conversion of the nitro group to a nitroso group rather than cleavage of the C–N bond in the carbamate group. This competing reaction has been reported by a number of researchers in studies of nitrophenyl-protecting groups.58
To quantify the extent of photodeprotection further, a model reaction was utilized. First, as a control, films formed by the adsorption of APTES on glass were reacted with trifluoro(acetic anhydride) (TFAA). The resulting C 1s spectrum is shown in Figure 3c. As expected, the reaction between the anhydride and the amine group of the adsorbate yields new components corresponding to the amide carbon (289.3 eV) and the carbon atom in the trifluoromethyl group (293.7 eV). These latter components are in the ratio 1:1, indicative of extensive derivatization. Second, films formed from OEG-NPEOC-APTES were exposed to UV light and were also reacted with TFAA. The resulting C 1s spectrum is shown in Figure 3d. A peak corresponding to the carbon atom in the trifluoromethyl group is clearly observed. The ratio of the area of this peak to that of the main hydrocarbon peak at 285 eV is similar to that in Figure 3c. A peak is also observed at 289.3 eV that includes contributions from both the carbamate group of any adsorbates with intact protecting groups and also the carbonyl groups of deprotected, derivatized adsorbates. The ratio of the intensity of the CF3 component to this peak provides a direct measure of the extent of derivatization by TFAA and hence of the progress of the photodeprotection reaction to completion. Data are shown in Figure 4 as a function of UV exposure. The limiting value of the intensity of the CF3 component corresponds to a film in which ca. 70% of the adsorbates have been deprotected and derivatized by reaction with TFAA. On the basis of these data we conclude that it is likely that a side reaction occurs. The nature of this side reaction is not established definitively; however, one possibility is the conversion of the nitro group to a nitroso group, as has been previously reported.58 In support of this, an unexpected additional component was observed at ca. 402 eV in the N 1s spectrum after UV exposure (see Supporting Information), consistent with some literature reports of XPS spectra of nitroso compounds;59 however, the majority of adsorbates (ca. two-thirds at exposures of 5 J cm–2 and higher) undergo deprotection to expose their amine groups for subsequent reaction.
Figure 4.
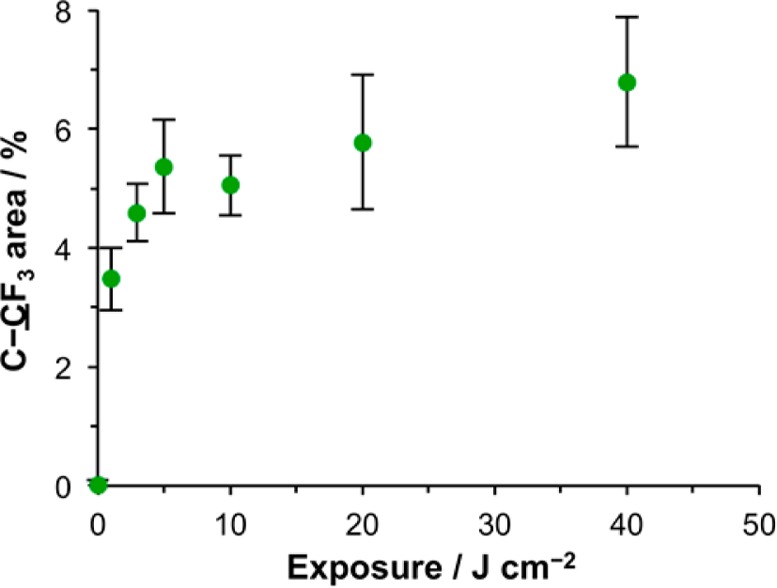
Variation in the C–CF3 peak area (as a percentage of the total C 1s peak area) as a function of UV exposure at 244 nm for OEG-NPEOC-APTES films following derivatization with TFAA.
UV-modified OEG-NPEOC-APTES films were reacted with GA (Figure 3e) and then with ABNTA (Figure 3d). After reaction with GA, the C 1s spectrum was much closer to the spectrum acquired for APTES after reaction with GA (Figure 2b). The component at 286.6 eV was slightly increased in size, and a small component was still observed that was due to the carbamate. After reaction with ABNTA, the spectrum obtained for the deprotected OEG-NPEOC-APTES film was very similar indeed to that obtained after derivatization of APTES. Again, the component at 286.6 eV was larger, and the peak at 289.4 eV is slightly larger in Figure 3f than the corresponding peak in Figure 2c (7.1 and 3.7%, respectively). Complexation with Ni2+ yielded an Ni 2p peak, indicative of the formation of the desired nickel–NTA complex.
In summary, XPS data suggest that the photochemistry of OEG-NPEOC-APTES is more complex at 244 eV than was previously described at near-UV wavelengths. A competing reaction likely occurs that involves conversion of the nitro group to a nitroso group, inhibiting deprotection; however, deprotection is extensive at exposures >5 J cm–2, yielding amine groups that are derivatized by GA, to yield surface aldehydes that react with ABNTA. The ultimate efficiency of attachment of ABNTA (as gauged by the area of the carboxylate component in the C 1s spectrum) is slightly greater than that obtained for the control surface, APTES.
Binding of His-Tagged Proteins
To quantify the relationship between the UV exposure and immobilization of His-tagged protein, we studied the adsorption of two His-tagged fluorescent proteins using ellipsometry. Figure 5a shows the variation in the thickness of the adsorbed layer for two His-GFP and His-CpcA-PEB as a function of UV exposure on NTA-functionalized OEG-NPEOC-APTES surfaces. The ellipsometric thickness is proportional to the amount of adsorbed protein. The dimensions of GFP are ca. 24 Å × 24 Å × 42 Å and those of CpcA are ca. 24 Å × 36 Å × 67 Å. The thickness of a monolayer will thus depend on the presentation of the protein at the surface. It can be seen from Figure 5a that for both proteins the adsorbed amount increases to an exposure of 5 J cm–2. Subsequently, the thickness of the protein layer changes very little. The final thickness value of GFP is ca. 35 Å, and that of CpcA-PEB-PEB is ca. 40 Å. These data suggest that an exposure of 5 J cm–2 is sufficient to ensure the formation of a monolayer of site-specifically oriented protein and that the thickness of the two proteins is similar when site-specifically bound via the His-tag.
Figure 5.
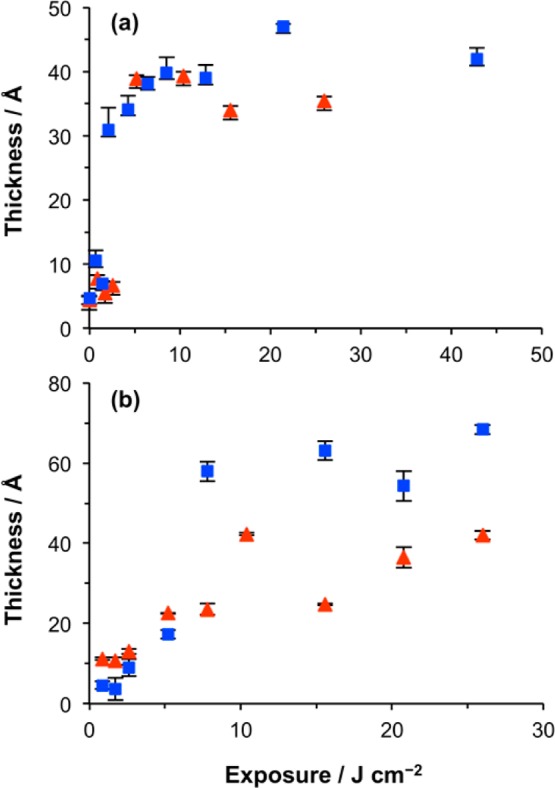
Ellipsometric measurements of the thickness of the adsorbed layer of GFP (red triangles) and CpcA-PEB-PEB (blue squares) on films of OEG-NPEOC-APTES as a function of UV exposure (a) after treatment with GA/ABNTA/Ni2+ to create an NTA-functionalized surface and (b) without any postexposure modification.
The amount of protein adsorbed at the surface was measured by ellipsometry as a function of UV exposure for samples that were not derivatized with ABNTA (Figure 5b). The thickness of the adsorbed layer increased more slowly and reached a limiting value for each protein after an exposure of ca. 10 J cm–2. The limiting thickness of the GFP layer is ca. 40 Å, while that of CpcA-PEB-PEB is ca. 65 Å. The increased thickness of the monolayer that forms by adsorption of CpcA-PEB-PEB may reflect the fact that the protein is oriented differently at the surface.
Protein Patterning
Samples of OEG-NPEOC-APTES were exposed to UV light through a mask and treated with GA, ABNTA, and Ni2+, then incubated in solutions of His-GFP and His-CpcA-PEB-PEB. Figure 6a,b shows confocal fluorescence images of the resulting micropatterns. Bright fluorescence is observed for the exposed regions (squares), indicating high levels of attachment, and dark contrast regions in the masked areas (bars) indicated low levels of nonspecific protein adsorption on the unexposed regions where the OEG-NPEOC protecting groups were intact. The size of the squares with protein is ca. 20 × 20 μm2 and the width of the dark bars is ca. 10 μm.
Figure 6.
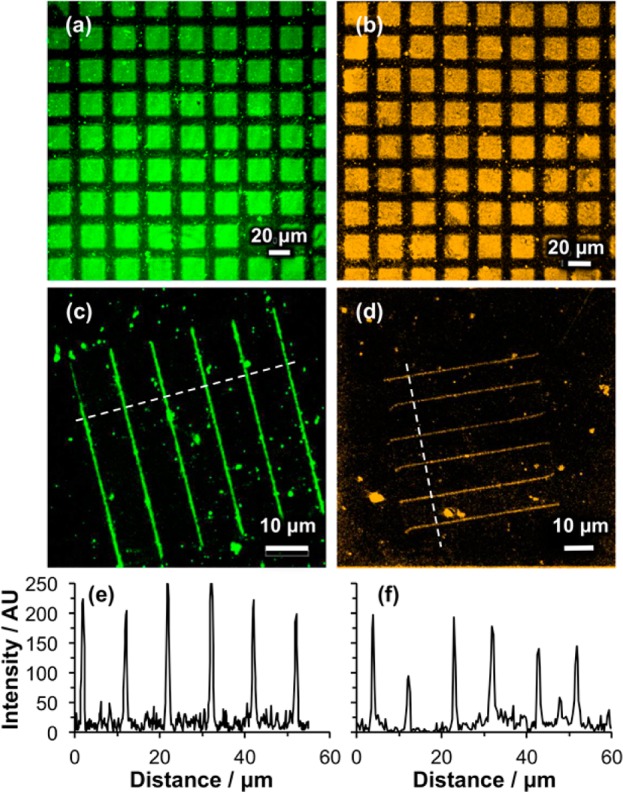
Confocal fluorescence microscopy images of patterned samples formed by exposure of OEG-NPEOC-APTES through a mask (a,b) and using a near-field probe (c,d) prior to activation of the surface by incubation with GA, ABNTA, and then Ni2+. Panels a and c show samples to which His-GFP has been bound, and samples b and d show samples to which His-CpcA-PEB-PEB has been bound. Representative line sections, measured along the dashed lines marked in panels c and d, are shown in panels e and f.
Nanofabrication was carried out by near-field lithography. For these experiments, an HeCd laser (325 nm) was coupled to a scanning near-field optical microscope because the optics of the microscope were not transparent at 244 nm. The probe was traced across the OEG-NPEOC-APTES-modified surfaces to fabricate a series of six parallel lines, the exposed regions were functionalized with NTA and Ni2+, and the samples were immersed in solutions of His-GFP or His-CpcA-PEB-PEB to facilitate binding of the proteins to the features modified by exposure to the near field. Figure 6c,d shows confocal fluorescence images of GFP and CpcA-PEB-PEB nanopatterns. Strong fluorescence contrast was observed between the lines and the unexposed regions. Line sections through the nanopatterns demonstrate that sharp and well-defined features have been formed (Figure 6e,f). In the regions to which the proteins were attached, the fluorescence signal was as high as 250 au for GFP (Figure 6e) and 200 au for CpcA-PEB-PEB (Figure 6f), similar to values obtained for micropatterned samples, and the signal in the between the lines was close to zero, indicating good spatial control of protein attachment. A small number of isolated spots is also observed between the lines fabricated by near-field lithography; we speculate that these may result from adventitious deposition of small aggregates of protein that formed in solution.
Site-Specific Attachment of Proteins to Patterned Samples
An OEG-NPEOC-APTES film sample was exposed to UV light through a mask. In exposed regions the adsorbates are expected to undergo deprotection to expose amine groups that may be activated using GA, and coupled to ABNTA. After complexation of the NTA-derivatized regions with Ni2+, the sample was immersed in a solution of His-tagged GFP. After rinsing, the sample was imaged using confocal fluorescence microscopy (Figure 7a). Square regions of bright fluorescence may be observed. These correspond to regions that were exposed to UV light during the patterning step; the observation of bright fluorescence from these regions confirms that the protein has been immobilized successfully. The dark bars correspond to regions that were masked during exposure. The low fluorescence intensity in those regions (no more than background noise) demonstrates the excellent protein resistance of the OEG-terminated as-prepared surface.
Figure 7.
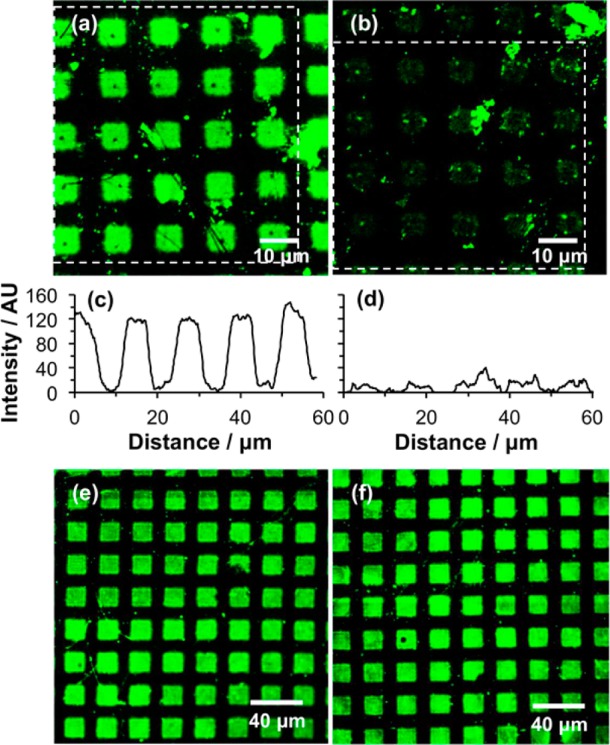
(a) Confocal fluorescence micrograph of an OEG-NPEOC-APTES film sample following UV exposure through a mask, derivatization with ABNTA/Ni2+ and immersion in a solution of His-tagged GFP. (b) Micrograph of the same sample following subsequent treatment with a 1 M solution of imidazole in water. (c,d) Sections averaged across the regions indicated by the dashed boxes in panels a and b, respectively. (c) Fluorescence image of an OEG-NPEOC-APTES film exposed to UV light, using the same exposure employed to prepare the sample in panel a but without subsequent derivatization by NTA, after immersion in a solution of His-GFP. (d) Fluorescence micrograph of the sample shown in panel c after treatment with a 1 M solution of imidazole.
To test whether the immobilized proteins were site-specifically bound, we treated the sample with a large excess of imidazole, which removes Ni2+ from the His-tagged protein/Ni2+/NTA complex via ligand competition and disrupts the bond between the His-tag and the NTA group. Figure 7b shows a confocal fluorescence micrograph of the sample imaged in Figure 7a after the addition of 1 M imidazole. The dramatic reduction in fluorescence intensity confirms that the majority of the protein has been displaced and indicates that the protein that was imaged in Figure 7a was largely bound in a site-specific fashion to the surface. Comparisons of line sections through the two images indicate a very low level of residual fluorescence due to nonspecifically bound protein, and some bright spots in Figure 7b are due to immovable spots that are attributed to nonspecific binding.
Repetition of the experiment in the absence of the GA/ABNTA/Ni2+ activation steps leads to His-GFP adsorption onto the patterned surface, resulting in bright fluorescence from exposed areas of the sample (Figure 7c); however, in contrast with the behavior seen in Figure 7b, this fluorescence is not diminished when the sample is treated with a 1 M solution of imidazole. Hence, in the absence of the GA/ABNTA/Ni2+ activation steps the protein is able to adsorb in a nonspecific fashion to the surface.
Conclusions
Exposure of aminosilane films protected with an oligo(ethylene glycol) nitrophenyl group by irradiation at 244 nm leads to photodeprotection, exposing amine groups with an efficiency of ca. 70% within the XPS sampling depth. The reaction does not proceed to completion because of a side reaction, which likely leads to conversion of the nitro group in the protecting group to a nitroso group. The remaining surface remains moderately protein-resistant because the side reaction leads to retention of some of the oligo(ethylene glycol) aducts. Deprotected films are reacted first with glutaraldehyde and second with aminobutyl nitrilotriacetic acid, yielding a surface carboxylate concentration slightly exceeding that achieved for an aminosilane control. The resulting surfaces may be complexed with Ni2+ to facilitate efficient site-specific immobilization of His-tagged proteins. Micrometer- and nanometer-scale patterns may be formed when the exposure is carried out using either a mask or a near-field probe. Treatment of the resulting patterns with 1 M imidazole leads to almost quantitative removal of the immobilized protein, demonstrating that the protein attachment process is extremely selective. Site-specific binding of two different His-tagged proteins is demonstrated. This system appears to provide a convenient generic approach to the site-specific immobilization of proteins in micrometer- and nanometer-scale assemblies.
Acknowledgments
We are grateful to EPSRC (Grant EP/I012060/1) for financial support. S.X. thanks the University of Sheffield for a Research Scholarship. C.N.H. and J.M.gratefully acknowledge financial support from the Biotechnology and Biological Sciences Research Council (BBSRC U.K.), award number BB/M000265/1. C.N.H. was also supported by an Advanced Award 338895 from the European Research Council. J.M. was supported by a BBSRC doctoral studentship. This work was also supported as part of the Photosynthetic Antenna Research Center (PARC), an Energy Frontier Research Center funded by the U.S. Department of Energy, Office of Science, Office of Basic Energy Sciences under Award Number DE-SC 0001035. PARC’s role was to provide partial support for D.A.B. and C.N.H.
Supporting Information Available
The Supporting Information is available free of charge on the ACS Publications website at DOI: 10.1021/acs.langmuir.5b04368.
Elemental composition data obtained from XPS spectra and N 1s spectra of OEG-NPEOC-APTES before and after exposure to UV light. (PDF)
The authors declare no competing financial interest.
Supplementary Material
References
- Lopez G. P.; Albers M. W.; Schreiber S. L.; Carroll R.; Peralta E.; Whitesides G. M. Convenient Methods for Patterning the Adhesion of Mammalian Cells to Surfaces using Self-Aseembled Monolayers of Alkanethiolates on Gold. J. Am. Chem. Soc. 1993, 115, 5877–5878. 10.1021/ja00066a087. [DOI] [Google Scholar]
- Chen C. S.; Mrksich M.; Huang S.; Whitesides G. M.; Ingber D. E. Geometric Control of Cell Life and Death. Science 1997, 276, 1425–1428. 10.1126/science.276.5317.1425. [DOI] [PubMed] [Google Scholar]
- Cavalcanti-Adam E. A.; Volberg T.; Micoulet A.; Kessler H.; Geiger B.; Spatz J. P. Cell Spreading and Focal Adhesion Dynamics are Regulated by Spacing of Integrin Ligands. Biophys. J. 2007, 92, 2964–2974. 10.1529/biophysj.106.089730. [DOI] [PMC free article] [PubMed] [Google Scholar]
- Cavalcanti-Adam E.; Micoulet A.; Blümmel J.; Auernheimer J.; Kessler H.; Spatz J. P. Lateral Spacing of Integrin Ligands Influences Cell Spreading and Focal Adhesion Assembly. Eur. J. Cell Biol. 2006, 85, 219–224. 10.1016/j.ejcb.2005.09.011. [DOI] [PubMed] [Google Scholar]
- Tamura T.; Hamachi I. Recent Progress in Design of Protein-Based Fluorescent Biosensors and Their Cellular Applications. ACS Chem. Biol. 2014, 9, 2708–2717. 10.1021/cb500661v. [DOI] [PubMed] [Google Scholar]
- Turner A. P. F. Biosensors: Sense and Sensibility. Chem. Soc. Rev. 2013, 42, 3184–3196. 10.1039/c3cs35528d. [DOI] [PubMed] [Google Scholar]
- Zhao W.-W.; Xu J.-J.; Chen H.-Y. Photoelectrochemical DNA Biosensors. Chem. Rev. 2014, 114, 7421–7441. 10.1021/cr500100j. [DOI] [PubMed] [Google Scholar]
- Liu Q.; Wu C.; Cai H.; Hu N.; Zhou J.; Wang P. Cell-Based Biosensors and Their Application in Biomedicine. Chem. Rev. 2014, 114, 6423–6461. 10.1021/cr2003129. [DOI] [PubMed] [Google Scholar]
- Leslie D. C.; Waterhouse A.; Berthet J. B.; Valentin T. M.; Watters A. L.; Jain A.; Kim P.; Hatton B. D.; Nedder A.; Donovan K.; Super E. H.; Howell C.; Johnson C. P.; Vu T. L.; Bolgen D. E.; Rifai S.; Hansen A. R.; Aizenberg M.; Super M.; Aizenberg J.; Ingber D. E. A Bioinspired Omniphobic Surface Coating on Medical Devices Prevents Thrombosis and Biofouling. Nat. Biotechnol. 2014, 32, 1134–1140. 10.1038/nbt.3020. [DOI] [PubMed] [Google Scholar]
- Fedorov K.; Blaszykowski C.; Sheikh S.; Reheman A.; Romaschin A.; Ni H.; Thompson M. Prevention of Thrombogenesis from Whole Human Blood on Plastic Polymer by Ultrathin Monoethylene Glycol Silane Adlayer. Langmuir 2014, 30, 3217–3222. 10.1021/la500745p. [DOI] [PubMed] [Google Scholar]
- Rostam H. M.; Singh S.; Vrana N. E.; Alexander M. R.; Ghaemmaghami A. M. Impact of Surface Chemistry and Topography on the Function of Antigen Presenting Cells. Biomater. Sci. 2015, 3, 424–441. 10.1039/C4BM00375F. [DOI] [PubMed] [Google Scholar]
- Banerjee I.; Pangule R. C.; Kane R. S. Antifouling Coatings: Recent Developments in the Design of Surfaces That Prevent Fouling by Proteins, Bacteria, and Marine Organisms. Adv. Mater. 2011, 23, 690–718. 10.1002/adma.201001215. [DOI] [PubMed] [Google Scholar]
- Ge S.; Agbakpe M.; Wu Z.; Kuang L.; Zhang W.; Wang X. Influences of Surface Coating, UV Irradiation and Magnetic Field on the Algae Removal Using Magnetite Nanoparticles. Environ. Sci. Technol. 2015, 49, 1190–1196. 10.1021/es5049573. [DOI] [PubMed] [Google Scholar]
- Rosenhahn A.; Schilp S.; Kreuzer H. J.; Grunze M. The Role of ″Inert″ Surface Chemistry in Marine Biofouling Prevention. Phys. Chem. Chem. Phys. 2010, 12, 4275–4286. 10.1039/c001968m. [DOI] [PubMed] [Google Scholar]
- Brzozowska A. M.; Parra-Velandia F. J.; Quintana R.; Xiaoying Z.; Lee S. S. C.; Chin-Sing L.; Jańczewski D.; Teo S. L. M.; Vancso Biomimicking Micropatterned Surfaces and Their Effect on Marine Biofouling. Langmuir 2014, 30, 9165–9175. 10.1021/la502006s. [DOI] [PubMed] [Google Scholar]
- Bixler G. D.; Bhushan B. Biofouling: Lessons from Nature. Philos. Trans. R. Soc., A 2012, 370, 2381–2417. 10.1098/rsta.2011.0502. [DOI] [PubMed] [Google Scholar]
- Rosi N. L.; Mirkin C. A. Nanostructures in Biodiagnostics. Chem. Rev. 2005, 105, 1547–1562. 10.1021/cr030067f. [DOI] [PubMed] [Google Scholar]
- Zhou W.; Jimmy Huang P.-J.; Ding J.; Liu J. Aptamer-Based Biosensors for Biomedical Diagnostics. Analyst 2014, 139, 2627–2640. 10.1039/c4an00132j. [DOI] [PubMed] [Google Scholar]
- Coyer S. R.; García A. J.; Delamarche E. Facile Preparation of Complex Protein Architectures with Sub-100-nm Resolution on Surfaces. Angew. Chem., Int. Ed. 2007, 46, 6837–6840. 10.1002/anie.200700989. [DOI] [PubMed] [Google Scholar]
- Jeyachandran Y. L.; Terfort A.; Zharnikov M. Controlled Modification of Protein-Repelling Self-Assembled Monolayers by Ultraviolet Light: The Effect of the Wavelength. J. Phys. Chem. C 2012, 116, 9019–9028. 10.1021/jp300436n. [DOI] [Google Scholar]
- Weber T.; Meyerbroker N.; Hira N. K.; Zharnikov M.; Terfort A. UV-Mediated Tuning of Surface Biorepulsivity in Aqueous Environment. Chem. Commun. 2014, 50, 4325–4327. 10.1039/c4cc00982g. [DOI] [PubMed] [Google Scholar]
- Jeyachandran Y. L.; Meyerbröker N.; Terfort A.; Zharnikov M. Maskless Ultraviolet Projection Lithography with a Biorepelling Monomolecular Resist. J. Phys. Chem. C 2015, 119, 494–502. 10.1021/jp510809a. [DOI] [Google Scholar]
- Ballav N.; Terfort A.; Zharnikov M. Fabrication of Mixed Self-Assembled Monolayers Designed for Avidin Immobilization by Irradiation Promoted Exchange Reaction. Langmuir 2009, 25, 9189–9196. 10.1021/la9007476. [DOI] [PubMed] [Google Scholar]
- Ballav N.; Thomas H.; Winkler T.; Terfort A.; Zharnikov M. Making Protein Patterns by Writing in a Protein-Repelling Matrix. Angew. Chem., Int. Ed. 2009, 48, 5833–5836. 10.1002/anie.200900950. [DOI] [PubMed] [Google Scholar]
- Lee K.-B.; Park S.-J.; Mirkin C. A.; Smith J. C.; Mrksich M. Protein Nanoarrays Generated by Dip-Pen Nanolithography. Science 2002, 295, 1702–1705. 10.1126/science.1067172. [DOI] [PubMed] [Google Scholar]
- Lee K.-B.; Lim J.-H.; Mirkin C. A. Protein Nanostructures formed via Direct-Write Dip-Pen Nanolithography. J. Am. Chem. Soc. 2003, 125, 5588–5589. 10.1021/ja034236p. [DOI] [PubMed] [Google Scholar]
- Qin G.; Cai C. Sub-10-nm Patterning of Oligo(Ethylene Glycol) Monolayers on Silicon Surfaces via Local Oxidation using a Conductive Atomic Force Microscope. Nanotechnology 2009, 20, 355306. 10.1088/0957-4484/20/35/355306. [DOI] [PubMed] [Google Scholar]
- Montague M.; Ducker R. E.; Chong K. S. L.; Manning R. J.; Rutten F. J. M.; Davies M. C.; Leggett G. J. Fabrication of Biomolecular Nanostructures by Scanning Near-Field Photolithography of Oligo(ethylene glycol) Terminated Self-Assembled Monolayers. Langmuir 2007, 23, 7328–7337. 10.1021/la070196h. [DOI] [PubMed] [Google Scholar]
- Alang Ahmad S. A.; Wong L. S.; ul-Haq E.; Hobbs J. K.; Leggett G. J.; Micklefield J. Protein Micro- and Nanopatterning Using Aminosilanes with Protein-Resistant Photolabile Protecting Groups. J. Am. Chem. Soc. 2011, 133, 2749–2759. 10.1021/ja1103662. [DOI] [PubMed] [Google Scholar]
- Ul-Haq E.; Patole S.; Moxey M.; Amstad E.; Vasilev C.; Hunter C. N.; Leggett G. J.; Spencer N. D.; Williams N. H. Photocatalytic Nanolithography of Self-Assembled Monolayers and Proteins. ACS Nano 2013, 7, 7610–7618. 10.1021/nn402063b. [DOI] [PMC free article] [PubMed] [Google Scholar]
- Reynolds N. P.; Tucker J. D.; Davison P. A.; Timney J. A.; Hunter C. N.; Leggett G. J. Site-Specific Immobilization and Micrometer and Nanometer Scale Photopatterning of Yellow Fluorescent Protein on Glass Surfaces. J. Am. Chem. Soc. 2009, 131, 896–897. 10.1021/ja8079252. [DOI] [PubMed] [Google Scholar]
- Tizazu G.; el Zubir O.; Patole S.; McLaren A.; Vasilev C.; Mothersole D.; Adawi A.; Hunter C. N.; Lidzey D.; Lopez G.; Leggett G. Micrometer and Nanometer Scale Photopatterning of Proteins on Glass Surfaces by Photo-degradation of Films Formed from Oligo(Ethylene Glycol) Terminated Silanes. Biointerphases 2012, 7, 1–9. 10.1007/s13758-012-0054-6. [DOI] [PubMed] [Google Scholar]
- Alswieleh A. M.; Cheng N.; Canton I.; Ustbas B.; Xue X.; Ladmiral V.; Xia S.; Ducker R. E.; El Zubir O.; Cartron M. L.; Hunter C. N.; Leggett G. J.; Armes S. P. Zwitterionic Poly(amino acid methacrylate) Brushes. J. Am. Chem. Soc. 2014, 136, 9404–9413. 10.1021/ja503400r. [DOI] [PMC free article] [PubMed] [Google Scholar]
- Moxey M.; Johnson A.; El-Zubir O.; Cartron M.; Dinachali S. S.; Hunter C. N.; Saifullah M. S. M.; Chong K. S. L.; Leggett G. J. Fabrication of Self-Cleaning, Reusable Titania Templates for Nanometer and Micrometer Scale Protein Patterning. ACS Nano 2015, 9, 6262–6270. 10.1021/acsnano.5b01636. [DOI] [PubMed] [Google Scholar]
- Vasilev C.; Johnson M. P.; Gonzales E.; Wang L.; Ruban A. V.; Montano G.; Cadby A. J.; Hunter C. N. Reversible Switching between Nonquenched and Quenched States in Nanoscale Linear Arrays of Plant Light-Harvesting Antenna Complexes. Langmuir 2014, 30, 8481–8490. 10.1021/la501483s. [DOI] [PMC free article] [PubMed] [Google Scholar]
- Castner D. G.; Ratner B. D. Biomedical Surface Science: Foundations to Frontiers. Surf. Sci. 2002, 500, 28–60. 10.1016/S0039-6028(01)01587-4. [DOI] [Google Scholar]
- Langer R.; Tirrell D. A. Designing Materials for Biology and Medicine. Nature 2004, 428, 487–492. 10.1038/nature02388. [DOI] [PubMed] [Google Scholar]
- Meyers S. R.; Grinstaff M. W. Biocompatible and Bioactive Surface Modifications for Prolonged In Vivo Efficacy. Chem. Rev. 2012, 112, 1615–1632. 10.1021/cr2000916. [DOI] [PMC free article] [PubMed] [Google Scholar]
- Harris J. M.Poly(Ethylene Glycol) Chemistry: Biochemical and Biomedical Applications; Plenum: New York, 1992. [Google Scholar]
- Prime K. L.; Whitesides G. M. Self-Assembled Organic Monolayers: Model Systems for Studying Adsorption of Proteins at Surfaces. Science 1991, 252, 1164–1167. 10.1126/science.252.5009.1164. [DOI] [PubMed] [Google Scholar]
- Pale-Grosdemange C.; Simon E. S.; Prime K. L.; Whitesides G. M. Formation of Self-Assembled Monolayers by Chemisorption of Derivatives of Oligo(Ethylene Glycol) of Structure HS(CH2)11(OCH2CH2)mOH on Gold. J. Am. Chem. Soc. 1991, 113, 12–20. 10.1021/ja00001a002. [DOI] [Google Scholar]
- Lopez G. P.; Biebuyck H. A.; Haerter R.; Kumar A.; Whitesides G. M. Fabrication and Imaging of Two-Dimensional Patterns of Proteins Adsorbed on Self-Assembled Monolayers by Scanning Electron Microscopy. J. Am. Chem. Soc. 1993, 115, 10774–10781. 10.1021/ja00076a038. [DOI] [Google Scholar]
- Yam C. M.; Lopez-Romero J. M.; Gu J.; Cai C. Protein-Resistant Monolayers Prepared by Hydrosilylation of α-Oligo(Ethylene Glycol)-ω-Alkenes on Hydrogen-Terminated Silicon(111) Surfaces. Chem. Commun. 2004, 2510–2511. 10.1039/b401499e. [DOI] [PubMed] [Google Scholar]
- Hucknall A.; Rangarajan S.; Chilkoti A. In Pursuit of Zero: Polymer Brushes that Resist the Adsorption of Proteins. Adv. Mater. 2009, 21, 2441–2446. 10.1002/adma.200900383. [DOI] [Google Scholar]
- Ma H.; Li D.; Sheng X.; Zhao B.; Chilkoti A. Protein Resistant Polymer Brushes on Silicon Oxide by Surface Initiated Atom Transfer Radical Polymerization. Langmuir 2006, 22, 3751–3756. 10.1021/la052796r. [DOI] [PubMed] [Google Scholar]
- Sigal G. B.; Bamdad C.; Barberis A.; Strominger J.; Whitesides G. M. A Self-Assembled Monolayer for the Binding and Study of Histidine-Tagged Proteins by Surface Plasmon Resonance. Anal. Chem. 1996, 68, 490–497. 10.1021/ac9504023. [DOI] [PubMed] [Google Scholar]
- Schmid E. L.; Keller T. A.; Dienes Z.; Vogel H. Reversible Oriented Surface Immobilization of Functional Proteins on Oxide Surfaces. Anal. Chem. 1997, 69, 1979–1985. 10.1021/ac9700033. [DOI] [PubMed] [Google Scholar]
- de Groot G. W.; Demarche S.; Santonicola M. G.; Tiefenauer L.; Vancso G. J. Smart Polymer Brush Nanostructures Guide the Self-Assembly of Pore-Spanning Lipid Bilayers with Integrated Membrane Proteins. Nanoscale 2014, 6, 2228–2237. 10.1039/c3nr05356c. [DOI] [PubMed] [Google Scholar]
- Falconnet D.; Pasqui D.; Park S.; Eckert R.; Schift H.; Gobrecht J.; Barbucci R.; Textor M. A Novel Approach to produce Protein Nanopatterns by Combining Nanoimprint Lithography and Molecular Self-Assembly. Nano Lett. 2004, 4, 1909–1914. 10.1021/nl0489438. [DOI] [Google Scholar]
- Maury P.; Escalante M.; Péter M.; Reinhoudt D. N.; Subramaniam V.; Huskens J. Creating Nanopatterns of His-Tagged Proteins on Surfaces by Nanoimprint Lithography Using Specific NiNTA-Histidine Interactions. Small 2007, 3, 1584–1592. 10.1002/smll.200700046. [DOI] [PubMed] [Google Scholar]
- Alvey R. M.; Biswas A.; Schluchter W. M.; Bryant D. A. Attachment of Noncognate Chromophores to CpcA of Synechocystis sp. PCC 6803 and Synechococcus sp. PCC 7002 by Heterologous Expression in Escherichia coli. Biochemistry 2011, 50, 4890–4902. 10.1021/bi200307s. [DOI] [PubMed] [Google Scholar]
- Shen G.; Saunee N. A.; Williams S. R.; Gallo E. F.; Schluchter W. M.; Bryant D. A. Identification and characterization of a new class of bilin lyase - The cpcT gene encodes a bilin lyase responsible for attachment of phycocyanobilin to CYS-153 on the β-subunit of phycocyanin in Synechococcus sp. PCC 7002. J. Biol. Chem. 2006, 281, 17768–17778. 10.1074/jbc.M602563200. [DOI] [PubMed] [Google Scholar]
- Zhu Y.-J.; Olson N.; Beebe T. P. Surface Chemical Characterization of 2.5-μm Particulates(PM2.5) from Air Pollution in Salt Lake City Using TOF-SIMS, XPS, and FTIR. Environ. Sci. Technol. 2001, 35, 3113–3121. 10.1021/es0019530. [DOI] [PubMed] [Google Scholar]
- Cheng F.; Gamble L. J.; Castner D. G. XPS, TOF-SIMS, NEXAFS, and SPR Characterization of Nitrilotriacetic Acid-Terminated Self-Assembled Monolayers for Controllable Immobilization of Proteins. Anal. Chem. 2008, 80, 2564–2573. 10.1021/ac702380w. [DOI] [PMC free article] [PubMed] [Google Scholar]
- Alang-Ahmad S. A.; Wong L. S.; ul-Haq E.; Hobbs J. K.; Leggett G. J.; Micklefield J. Micrometer- and Nanometer-Scale Photopatterning Using 2-Nitrophenylpropyloxycarbonyl-Protected Aminosiloxane Monolayers. J. Am. Chem. Soc. 2009, 131, 1513–1522. 10.1021/ja807612y. [DOI] [PubMed] [Google Scholar]
- Alang-Ahmad S. A.; Hucknall A.; Chilkoti A.; Leggett G. J. Patterning by UV-induced Photodegradation of Poly(oligo(ethylene glycol)methacrylate) Brushes. Langmuir 2010, 26, 9937–9942. 10.1021/la100438d. [DOI] [PubMed] [Google Scholar]
- Ducker R. E.; Janusz S. J.; Sun S.; Leggett G. J. One-Step Photochemical Introduction of Nanopatterned Protein-Binding Functionalities to Oligo(Ethylene Glycol) Terminated Self-Assembled Monolayers. J. Am. Chem. Soc. 2007, 129, 14842–14843. 10.1021/ja0749800. [DOI] [PubMed] [Google Scholar]
- Prompinit P.; Achalkumar A. S.; Han X.; Bushby R. J.; Walti C.; Evans S. D. Improved Photoreaction Yields for Soft Ultraviolet Photolithography in Organothiol Self-Assembled Monolayers. J. Phys. Chem. C 2009, 113, 21642–21647. 10.1021/jp907950c. [DOI] [Google Scholar]
- Vančik H.Aromatic C-nitroso Compounds; Springer: The Netherlands, 2013; pp 75–76. [Google Scholar]
Associated Data
This section collects any data citations, data availability statements, or supplementary materials included in this article.


