

Abstract
Breast cancer risk factors and clinical outcomes vary by tumour marker expression. However, individual studies often lack the power required to assess these relationships, and large‐scale analyses are limited by the need for high throughput, standardized scoring methods. To address these limitations, we assessed whether automated image analysis of immunohistochemically stained tissue microarrays can permit rapid, standardized scoring of tumour markers from multiple studies. Tissue microarray sections prepared in nine studies containing 20 263 cores from 8267 breast cancers stained for two nuclear (oestrogen receptor, progesterone receptor), two membranous (human epidermal growth factor receptor 2 and epidermal growth factor receptor) and one cytoplasmic (cytokeratin 5/6) marker were scanned as digital images. Automated algorithms were used to score markers in tumour cells using the Ariol system. We compared automated scores against visual reads, and their associations with breast cancer survival. Approximately 65–70% of tissue microarray cores were satisfactory for scoring. Among satisfactory cores, agreement between dichotomous automated and visual scores was highest for oestrogen receptor (Kappa = 0.76), followed by human epidermal growth factor receptor 2 (Kappa = 0.69) and progesterone receptor (Kappa = 0.67). Automated quantitative scores for these markers were associated with hazard ratios for breast cancer mortality in a dose‐response manner. Considering visual scores of epidermal growth factor receptor or cytokeratin 5/6 as the reference, automated scoring achieved excellent negative predictive value (96–98%), but yielded many false positives (positive predictive value = 30–32%). For all markers, we observed substantial heterogeneity in automated scoring performance across tissue microarrays. Automated analysis is a potentially useful tool for large‐scale, quantitative scoring of immunohistochemically stained tissue microarrays available in consortia. However, continued optimization, rigorous marker‐specific quality control measures and standardization of tissue microarray designs, staining and scoring protocols is needed to enhance results.
Keywords: breast tumours, immunohistochemistry, tissue microarrays, digital pathology, automated scoring
Introduction
Breast cancer is a biologically heterogeneous disease, which comprises multiple distinctive subtypes that are distinguishable by immunohistochemistry (IHC) 1, 2 or molecular analysis such as transcriptomic profiling 3, 4, 5. Clinically, IHC staining for oestrogen receptor (ER), progesterone receptor (PR) and epidermal growth factor receptor 2 (HER2) is routinely performed in most diagnostic laboratories to help select adjuvant treatment and to assess prognosis 6, 7. Research studies demonstrate that expanding this IHC panel to include markers of basal breast cancers, such as cytokeratin 5/6 (CK5/6) and epidermal growth factor receptor 1 (EGFR or HER1), can enable more detailed molecular subtyping, approximating taxonomies based on molecular profiling 1, 8, 9.
Evaluating differences across breast cancer subtypes is central to etiological and clinical research. However, such studies require large sample sizes in order to include sufficient numbers of the less common subtypes, many of which are clinically important. Tissue microarrays (TMAs) can be used to assess IHC results for multiple cases in one tissue section 10, enabling standardized IHC staining and facilitating scoring. Given that visual scoring is labour intensive and suffers from imperfect inter‐rater agreement, automated quantitative image analysis has been proposed as an alternative that may offer logistical advantages with good reliability.
Automated analysis of pathology images has been in use for more than 20 years 11 and has been applied extensively in recent years in the study of breast cancer with increasingly complex algorithms and improved concordance with visual scores 12, 13, 14, 15, 16, 17, 18. However, most comparisons are based on TMAs of a few hundred to a few thousand tumours constructed and stained in a single pathology laboratory. Although centralized construction and staining of TMAs is desirable to obtain comparable data 19, this is not always practical in large collaborative investigations that aggregate pathology samples from multiple studies.
This article details the application of fully automated image analysis of 8267 breast cancers collated from nine studies within the Breast Cancer Association Consortium (BCAC) 20. Automated image analysis was applied to score nuclear (ER, PR), membranous (HER2, EGFR) and cytoplasmic (CK5/6) markers to determine the usefulness and pitfalls of this approach and to identify limitations that might be addressed with methodological research.
Materials and methods
Study populations
This report includes nine BCAC studies with formalin‐fixed, paraffin‐embedded tumour blocks that had been previously prepared as TMAs (supplementary material Table 1). Relevant research ethics committees approved all studies; samples were anonymized before being sent to two coordinating centres at Strangeways Research Laboratory (University of Cambridge, Cambridge, UK) and Breakthrough Pathology Core Facility (Institute of Cancer Research, London, UK) for analysis. A total of 8267 cases with information on clinico‐pathological characteristics of the tumour, obtained from clinical records or centralized review of cases, were included in the analyses (supplementary material Table 2).
TMA immunohistochemistry
Three studies (ABCS, PBCS and SEARCH) provided previously stained TMA slides of ER and PR, four studies (ABCS, HEBCS, PBCS and SEARCH) of HER2, three studies (ABCS, KBCP, PBCS) of CK5/6 and three studies (HEBCS, KBCP, PBCS) of EGFR. Studies lacking pre‐existing stained TMAs for specific stains provided unstained TMA slides for centralized staining. Staining centres and protocols are detailed in supplementary material Table 3.
Automated Ariol scanning and scoring of TMAs
All TMA slides were scanned and analysed on the Leica Ariol system (Leica Biosystems, Newcastle upon Tyne, UK) using standard procedures and predefined algorithms tuned by an image analysis expert (see details in supplementary material). A single tuned algorithm was then applied to all TMAs. For ER and PR nuclear staining, we obtained automated measures of average stain intensity and percentage of cells stained. For HER2, the system calculated the HercepTest score 21 (0, 1+, 2+, 3+). For CK5/6 and EGFR, we obtained a continuous automated score (0–300) based on a weighted sum of the percentage of positive cells in three bins of weakly, intermediate and strongly positive cells. Quality control procedures are described in the supplementary material.
Visual scoring of TMAs
Randomly selected cores from each study were re‐arrayed in ‘virtual TMAs' for visual scoring (see supplementary material). This resulted on a total of 942, 952 and 998 core images being visually scored in duplicate by two pathologists (M.E.S. and E.P.) for ER, PR and HER2, respectively. The Allred scoring system and intensity score was used for ER and PR 22. Stains for ER and PR were considered positive if the Allred score was ≥3. For HER2, the Herceptest scoring system was used for visual scoring. Positive stains for HER2 were defined in two groups as having an intensity score of 2 or 3 (HER2 2+) or 3 only (HER2 3+).
TMA slides of CK5/6 from four studies (CNIO‐BCS, MCBCS, ORIGO, SBCS) and slides of EGFR from six studies (ABCS, CNIO‐BCS, MCBCS, KBCP, ORIGO, SBCS) that had been centrally stained at CRUK‐CI were visually scored using the SlidePath system (see supplementary material). Ten scorers scored a total of 5771 cores for CK5/6 and 8259 for EGFR. MES served as the reference pathologist and scored a random sample of up to 100 cores per study/centre assigned to each of the other scores to evaluate inter‐scorer agreement. CK5/6 and EGFR positive score by visual scoring was defined as >10% of positive cells.
Scorers assigned each core the following quality control categories: 1) satisfactory core (invasive tumour), 2) DCIS only, 3) no tumour/few tumour cells, 4) no core and 5) unsatisfactory for other reasons.
Statistical methods
The correlation between automated continuous scores and visual ordinal scores was evaluated by the Spearman's correlation coefficient, using data from the virtual TMA. The area under the curve (AUC) of receiver operating characteristic (ROC) graphs was used to evaluate the discriminatory accuracy of the ER, PR combined‐automated scores (intensity*percentage) to distinguish between visual positive and negative scores. The automated score that optimized the sensitivity and specificity in the ROC graph was applied as the cut‐off point to define marker status for all analysed cores (not just the ones in the virtual TMA). We also evaluated an alternative method to define the cut‐off for positive and negative scores, as described by Ali et al 15. Briefly, the cut‐off under this method is determined by the distribution of automated percentage and intensity scores for all cores, ie, it does not use information on visual scores from a subset of tumours in the virtual TMAs to define a cut‐off point.
The kappa statistic was used as a measure of agreement between dichotomous or semi‐quantitative scores. Sensitivity and specificity were calculated as measures of validity using the visual score as the reference; positive predictive value (PPV) and negative predictive value (NPV) were calculated as a measure of the value of automated dichotomous scores to predict visual dichotomous scores.
Comparisons between automated scores and visual scores were performed at the core level for cores in the virtual TMAs. Subject‐level scores for ER, PR, HER2 were derived by selecting the maximum score of all available cores for a given subject, after having excluded cores identified as having few or no tumour cells or no cores by the pathologist. These were compared to positive/negative status in the BCAC database, based primarily on medical records, or centralized reviews by study centres.
Kaplan–Meier survival plots were used to plot survival functions by subject‐level IHC scores. Associations with 10‐year breast cancer‐specific survival were assessed using a Cox proportional‐hazards model, providing estimates of hazard ratio (HR) and 95% confidence interval (95% CI). Violations of the proportional‐hazards assumption were accounted for by the T coefficient that varied as a function of log time. We used penalized‐likelihood criteria, ie, Akaike Information Criterion (AIC) and Bayesian Information Criterion (BIC), to compare model parsimony and fit of alternative non‐nested Cox regression models including visual versus automated scores. Models with lower values for AIC or BIC have a better balance between model parsimony and fit. All statistical analyses were conducted in Stata/MP version 12.1 (StataCorp, College Station, TX, USA).
Results
Differences in TMAs and clinico‐pathological characteristics of cases across studies
The nine studies used different TMA designs including a total of 20 263 tissue cores in 104 TMA blocks from 8267 BCAC breast cancer cases (Table 1 and supplementary material Table 1). The average age at diagnosis was 53 years. There were substantial differences in the distribution of age and clinico‐pathological characteristics across studies (supplementary material Table 2). A range of 75–77% of cores across virtual TMAs for ER, PR, HER2 were satisfactory for scoring (5–8% of which had only DCIS component), 10–13% had no tumour or few tumour cells, 3–5% had missing cores and 7–10% had unsatisfactory cores for other reasons (eg, blurred image, folded cores; see Table 2).
Table 1.
Description of study populations and TMA designs used by participating studies
| Study Acronym | Country | Cases | Age at diagnosis, mean (range) | TMA blocks | Cores per case | Cores per TMA | Core size (mm) | Total cores per study |
|---|---|---|---|---|---|---|---|---|
| ABCS | Netherlands | 1000 | 43 (23 50) | 26 | 1–6 | 12–241 | 0.6 | 3 314 |
| CNIO‐BCS | Spain | 171 | 60 (35 81) | 3 | 2–2 | 86–148 | 1.0 | 342 |
| HEBCS | Finland | 1154 | 56 (22 95) | 17 | 2–8 | 56–400 | 0.6 | 4 880 |
| KBCP | Finland | 392 | 59 (23 92) | 12 | 3–3 | 96–99 | 1.0 | 1 176 |
| MCBCS | USA | 348 | 58 (26 87) | 4 | 4–4 | 280–400 | 0.6 | 1 392 |
| ORIGO | Netherlands | 233 | 56 (27 88) | 3 | 3–9 | 237–310 | 0.6 | 841 |
| PBCS | Poland | 1406 | 56 (27 75) | 9 | 2–7 | 363–474 | 0.6 | 3 790 |
| SBCS | UK | 358 | 60 (30 92) | 11 | 3–8 | 90–156 | 0.6 | 1 320 |
| SEARCH | UK | 3205 | 52 (24 70) | 19 | 1–2 | 152–172 | 0.6 | 3 208 |
| Totals | 8267 | 53 (22 95) | 104 | 1–9 | 12–474 | 0.6–1.0 | 20 263 |
Table 2.
Distribution of quality control measures for tissue cores stained for ER, PR and HER2 in the virtual TMAs
| Quality control category | ER | PR | HER2 | |||
|---|---|---|---|---|---|---|
| N | % | N | % | N | % | |
| Satisfactory Core (invasive tumour) | 649 | 69 | 679 | 71 | 672 | 67 |
| DCIS only | 61 | 6 | 52 | 5 | 82 | 8 |
| No Tumour, few tumour cells | 123 | 13 | 98 | 10 | 126 | 13 |
| No core | 38 | 4 | 32 | 3 | 48 | 5 |
| Unsatisfactory core for other reasons | 71 | 8 | 91 | 10 | 70 | 7 |
| Total | 942 | 952 | 998 | |||
Core‐level comparison between ER, PR, HER2 automated and visual scores in virtual TMAs
The distributions of continuous automated scores and ordinal Allred visual scores for ER and PR are shown in Figures 1 and 2, respectively. The automated and ordinal visual scores were highly correlated and there was a clear separation of the distribution of automated scores by the visual positive/negative scores (Figures 1D, 1E and 2D, 2E). There were differences in distributions of automated scores across studies that could reflect different clinico‐pathological characteristics of the tumours or staining quality (supplementary material Figures 3 and 4).
Figure 1.
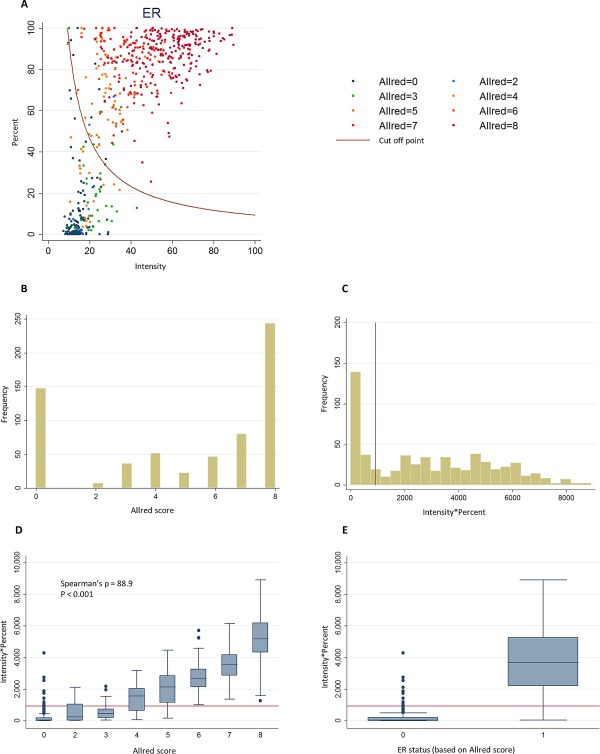
Distribution of ER continuous automated scores and ER visual ordinal scores in virtual TMAs. (A) Scatter plot of the intensity and percentage automated scores colour coded according to the Allred score for the corresponding core by visual scoring. The red curve represents the cut‐off point for positive/negative status by the ROC method. (B) Distribution of Allred visual scores (rater 1). (C) Distribution intensity*percent automated scores used in the ROC method. (D) Boxplot of the distribution of the intensity*percent automated score by categories of the Allred visual score. (E) Boxplot of the distribution of the intensity*percent automated score by visual positive/negative status. Red lines in C–E show the positive/negative cut‐off points for the corresponding automated score.
Figure 2.
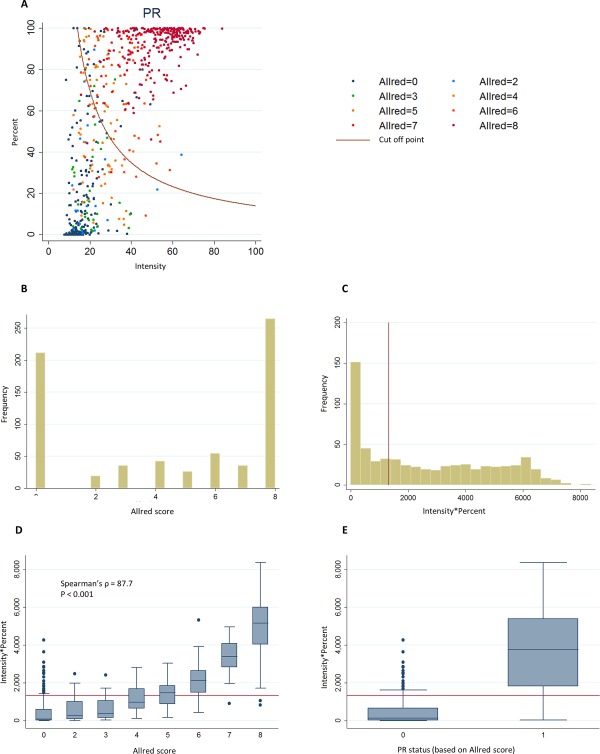
Distribution of PR continuous automated scores and PR visual ordinal scores in virtual TMAs. (A) Scatter plot of the intensity and percentage automated scores colour coded according to the Allred score for the corresponding core by visual scoring. The red curve represents the cut‐off point for positive/negative status by the ROC method. (B) Distribution of Allred visual scores (rater 1). (C) Distribution of intensity*percent automated scores. (D) Boxplot of the intensity*percent automated score by categories of the Allred visual score. (E) Boxplot of the intensity*percent automated score by visual positive/negative status. Red lines in C–E show the positive/negative cut‐off points for the corresponding automated score.
The AUC for ER and PR showed excellent discrimination (Table 3). For dichotomous scores, there was excellent inter‐rater agreement for ER and PR and substantial agreement between automated and visual scores, which were better for ER than PR (Table 3, see supplementary material Table 4 for cross‐tabulations). The automated system had good sensitivity and specificity. The NPV was substantially lower for the automated to rater comparisons than the inter‐rater comparison (∼70% versus 95%). Use of study‐specific cut‐off points for negative versus positive scores did not substantially improve the measures of agreement (data not shown). Measures of relative performance of automated versus visual scoring were similar when we used the Ali et al 15 method to select a cut‐off point for positive and negative automated score (data not shown).
Table 3.
Inter‐rater agreement and agreement between each rater and Ariol automated quantitative ER, PR scores for cores in the virtual TMA
| Marker | Comparison | N | % Pos. | Continuous automated score | Dichotomous automated score | |||||
|---|---|---|---|---|---|---|---|---|---|---|
| AUC (95%CI) | Observed agreement | Kappa (95%CI) | Se (%) | Sp (%) | PPV (%) | NPV (%) | ||||
| ER | Rater 1 vs rater 2 | 615 | 76.3 | n/a | 96.7 | 0.91 (0.83, 0.99) | 98.3 | 91.8 | 97.5 | 94.4 |
| Ariol vs rater 1 | 587 | 75.0 | 0.97 (0.95, 0.98) | 90.1 | 0.76 (0.68, 0.84) | 89.5 | 91.8 | 97.0 | 74.6 | |
| Ariol vs rater 2 | 636 | 76.4 | 0.96 (0.95, 0.98) | 90.1 | 0.75 (0.67, 0.83) | 88.9 | 94.0 | 98.0 | 72.3 | |
| PR | Rater 1 vs rater 2 | 655 | 67.0 | n/a | 96.8 | 0.93 (0.85, 1.00) | 97.5 | 95.4 | 97.7 | 94.9 |
| Ariol vs rater 1 | 624 | 67.3 | 0.93 (0.91, 0.95) | 83.8 | 0.65 (0.57, 0.73) | 82.9 | 85.8 | 92.3 | 70.9 | |
| Ariol vs rater 2 | 634 | 66.6 | 0.93 (0.91, 0.95) | 84.4 | 0.66 (0.59, 0.74) | 83.6 | 85.8 | 92.2 | 72.5 | |
Raters scores are dichotomous (positive/negative), and Ariol automated scores are considered as continuous and dichotomous.
% Pos., % positive cores for reference rater; Se, sensitivity; Sp, Specificity; PPV, positive predictive value; NPV, negative predictive value.
The kappa statistics for HER2 Herceptest score showed substantial agreement for both inter‐rater and automated to visual comparisons (kappa = 0.62–0.71; Table 4). Although the agreement for the HER2 2+ dichotomous classification was substantial for both inter‐rater and rater‐automated comparisons, the agreement for HER2 3+ was only moderate for one of the raters. Sensitivity to identify HER2 3+ cores was low, both in inter‐rater and rater‐automated comparisons (Table 4). When we examined cross‐tabulations to evaluate the sources of disagreement (supplementary material Table 4), it could be seen that extreme discrepancies, ie, Ariol scores of 0 where pathologist scores were 3 were very infrequent. Of the 13 discrepant cores, five were determined as pathologist error and re‐evaluated; four were due to poor tissue or staining quality (either through folds, high level of background staining or edge artifact, small tumour fragment) and four were due to Ariol error. The kappa statistics for rater‐automated agreement changed little when pathology errors and staining errors were removed from the analysis (data not shown).
Table 4.
Inter‐rater agreement and agreement between each rater and Ariol automated quantitative HER2 scores for cores in the virtual TMA
| HER2 semi‐quantitative score (0/1, 2,3) | N | Observed agreement | Kappa (95% CI) |
|---|---|---|---|
| Comparisons | |||
| Rater 1 vs rater2 | 660 | 92.7 | 0.71 (0.65, 0.78) |
| Ariol vs rater 1 | 693 | 90.7 | 0.62 (0.56, 0.68) |
| Ariol vs rater 2 | 716 | 93.7 | 0.71 (0.65, 0.77) |
| HER2 dichotomous score | N | % Pos. | Observed agreement | Kappa (95% CI) | Se (%) | Sp (%) | PPV (%) | NPV (%) |
|---|---|---|---|---|---|---|---|---|
| HER2 2+ (0/1 vs 2/3) | ||||||||
| Rater 1 vs rater2 | 660 | 20.9 | 91.4 | 0.73 (0.65, 0.81) | 74.6 | 95.8 | 82.4 | 93.5 |
| Ariol vs rater 1 | 693 | 21.2 | 90.0 | 0.69 (0.62, 0.77) | 72.1 | 94.9 | 79.1 | 92.7 |
| Ariol vs rater 2 | 716 | 19.6 | 91.6 | 0.73 (0.66, 0.81) | 77.9 | 95.0 | 79.0 | 94.6 |
| HER2 3+ (0/2 vs 3) | ||||||||
| Rater 1 vs rater2 | 660 | 12.6 | 94.1 | 0.68 (0.61, 0.76) | 59.0 | 99.1 | 90.7 | 94.4 |
| Ariol vs rater 1 | 693 | 12.4 | 91.3 | 0.46 (0.40, 0.53) | 34.9 | 99.3 | 88.2 | 91.5 |
| Ariol vs rater 2 | 716 | 8.4 | 95.8 | 0.67 (0.60, 0.74) | 55.0 | 99.5 | 91.7 | 96.0 |
% Pos.=% positive cores for reference rater
Se, sensitivity; Sp, Specificity; PPV, positive predictive value; NPV, negative predictive value.
Subject‐level comparison for ER, PR, HER2 automated scores to positive/negative scores in BCAC database
Figure 3 shows scatter plots and distributions of automated scores for all cases (6424 cases for ER and 6385 cases for PR) by positive/negative status previously assigned by each individual study. The agreement between subject‐level automated scores and marker status was substantial to moderate, generally lower than the core‐level comparisons in the virtual TMAs (Table 5; see supplementary material Table 5 for cross‐tabulations). There were substantial differences in the measures of agreement by study (supplementary material Table 6).
Figure 3.
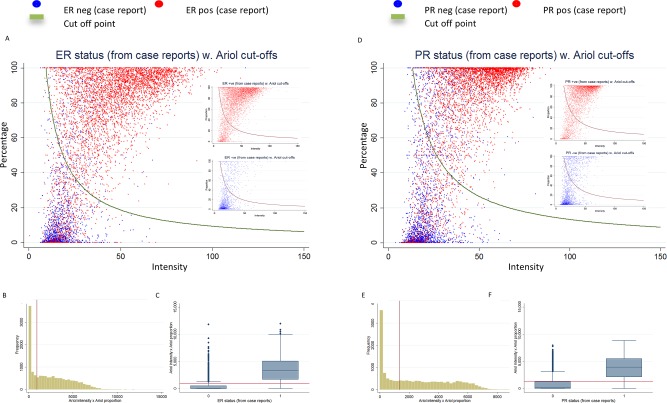
Distribution of ER (A–C) and PR (D–F) continuous automated scores (subject level) and positive/negative status in BCAC database, including 6424 cases for ER and 6385 cases for PR from nine studies. (A) Scatter plot of the intensity and percentage automated scores colour coded according to the BCAC ER status (red for positive and blue for negative). The red curve represents the cut‐off point for positive/negative status by the ROC method. The smaller inserted plots show ER‐positive and ER‐negative cases separately (B) Distribution of intensity*percent automated scores. (C) Boxplot of the intensity*percent automated score by BCAC ER status. Red lines show the positive/negative cut‐off points for the corresponding automated score. Figures D–F show similar plots for PR.
Table 5.
Agreement between Ariol automated quantitative ER, PR and HER2 scores for each subject and marker status from clinical/study records
| Marker | N | % Pos. | Continuous automated score | Dichotomous automated score | |||||
|---|---|---|---|---|---|---|---|---|---|
| AUC (95%CI) | Observed agreement | Kappa (95%CI) | Se (%) | Sp (%) | PPV (%) | NPV (%) | |||
| ER | 6424 | 74.5 | 0.89 (0.89, 0.90) | 84.1 | 0.62 (0.59, 0.64) | 84.6 | 82.7 | 93.4 | 64.7 |
| PR | 6385 | 63.6 | 0.87 (0.86, 0.88) | 80.0 | 0.57 (0.55, 0.60) | 82.5 | 75.7 | 85.6 | 71.2 |
| HER2 2+ | 6322 | 15.5 | – | 88.9 | 0.62 (0.59, 0.64) | 77.2 | 91.0 | 61.3 | 95.6 |
| HER2 3+ | 6322 | 15.5 | – | 89.2 | 0.43 (0.41, 0.44) | 31.8 | 99.7 | 95.4 | 88.8 |
Clinical/study scores are dichotomous (positive/negative), and ER, PR Ariol scores are considered both as continuous and dichotomous.
% Pos., % positive cores for reference rater; Se, sensitivity; Sp, Specificity; PPV, positive predictive value; NPV, negative predictive value.
To evaluate the impact of core quality on measures of agreement, we used automated estimates of the number of tumour nuclei to identify cores with no or few tumour cells. Measures of agreement improved only slightly after these exclusions; however, this resulted in a substantial reduction in the number of subjects with valid scores (data not shown). We, therefore, decided not to make these exclusions in the remaining analyses.
Survival analysis for ER, PR, HER2 automated scores compared to positive/negative scores from individual studies
Kaplan–Meier survival curves drawn from the full subject‐level dataset demonstrated that the automated analysis generated the expected survival associations for ER, PR and HER2 (Figures 4, 5, 6). While estimates of HR for automated data showed weaker associations with survival for dichotomous scores, automated scores allowed classification of cases into meaningful quantitative levels of ER and PR expression. Quintiles of the automated scores resulted in a refinement of the associations with survival (Figures 4 and 5). However, models with automated scores had a worse fit than models with dichotomous visual scores (see AIC/BIC values in Figures 4 and 5).
Figure 4.
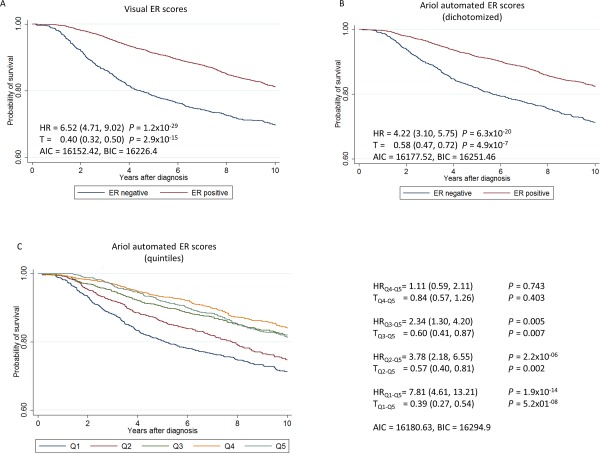
Kaplan–Meier survival curves and hazard ratios (HR) for 10‐year breast cancer survival by ER, based on 6135 subjects and 981 breast cancer specific deaths, using (A) pathologists data from study sites (positive/negative), (B) dichotomized (positive/negative) automated scores and (C) automated scores classified in quintiles.
Figure 5.
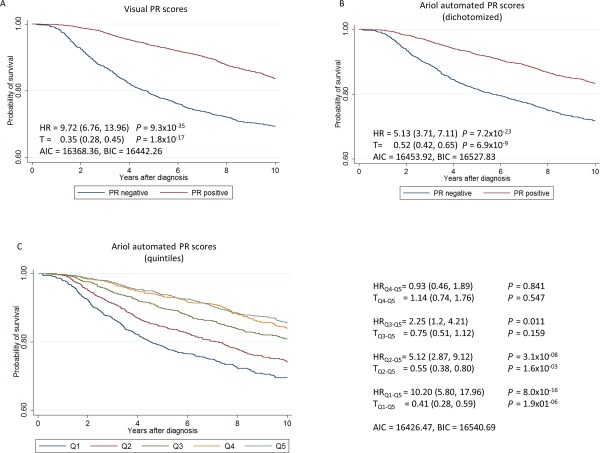
Kaplan–Meier survival curves and hazard ratios (HR) for 10‐year breast cancer survival by PR, based on 6115 subjects and 998 breast cancer specific deaths, using (A) pathologists data from study sites (positive/negative), (B) dichotomized (positive/negative) automated scores and (C) automated scores classified in quintiles.
Figure 6.
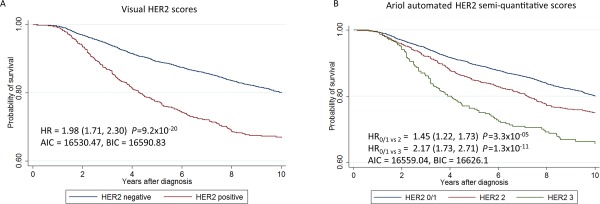
Kaplan–Meier survival curves and hazard ratios (HR) for 10‐year breast cancer survival by PR, based on 6039 subjects and 997 breast cancer specific deaths, using (A) pathologists data from study sites (positive/negative), and (B) semi‐quantitative automated scores.
The HRs for women in the lowest quintiles for ER and PR were similar to those for receptor negative cases according to the BCAC database (representing 25.3% of the cases for ER 36.2% of cases for PR). The percentage of cores classified as negative in the BCAC database included in each of the quintiles for ER and PR is shown in supplementary material Table 8. Automated scores for HER2 also allowed estimation of HR by HER2 semi‐quantitative scores, showing increasing hazard for increasing scores (Figure 6). However, as for ER and PR, the model fit was worse for automated that visual scores (see AIC/BIC values in Figure 6)
Comparison of automated and visual scores for CK5/6 and EGFR
An initial analysis for CK5/6 and EGFR in the entire TMA dataset resulted in very poor performance of automated scoring compared with visual scores by rater 1 or rater 2 (data not shown). A subsequent re‐analysis was performed only in the SEARCH study to demonstrate if limiting the tuning and analysis to a single study helped. Although this resulted in a marked improvement, the PPV was still poor (49.2% for CK5/6 and 30.0% for EGFR) reflecting a large number of false positives (Table 6). Performance was better for ER‐negative than ER‐positive tumours, the former including a higher percentage of CK5/6 and EGFR‐positive tumours. Examination of discordant cores showed that the disagreements were primarily related to false positives due to scoring of normal cells by Ariol. We, therefore, scored visually all cores that had not been previously scored by individual studies (ie, 5771 cores stained for CK5/6 and 8259 cores stained for EGFR). The distribution of quality control scores for these TMAs was similar to those seen for ER, PR and HER2 (supplementary material Table 9). Examination of inter‐rater agreement on a subset of 357 CK5/6 cores and 760 EGFR cores scored visually by a reference pathologist for QC showed a better agreement than the automated versus visual agreement seen in the SEARCH study; however, the PPV was also relatively low (Table 6). Evaluation of discordant pairs revealed that disagreements between visual scores were primarily due to disagreements between pathologists in identifying whether immunostained cells were normal cells versus cancer cells.
Table 6.
Inter‐rater agreement and agreement between Ariol automated CK56 and EGFR scores (dichotomized using the ROC method) for cores in TMAs from participating studies
| Marker | Comparison | N | % Pos. | Observed Agreement | Kappa (95%CI) | Se (%) | Sp (%) | PPV (%) | NPV (%) |
|---|---|---|---|---|---|---|---|---|---|
| CK5/6 | Inter‐rater agreementa | 357 | 11.9 | 91.6 | 0.74 (0.66, 0.83) | 96.6 | 90.6 | 67.1 | 99.3 |
| Ariol vs raterb ‐ all | 1897 | 10.4 | 89.4 | 0.49 (0.44, 0.53) | 61.6 | 92.6 | 49.2 | 95.4 | |
| Ariol vs raterb – ER+ | 1107 | 6.4 | 89.1 | 0.41 (0.35, 0.46) | 71.8 | 90.3 | 33.6 | 97.9 | |
| Ariol vs raterb – ER− | 360 | 21.1 | 86.9 | 0.57 (0.47, 0.67) | 56.6 | 95.1 | 75.4 | 89.1 | |
| EGFR | Inter‐rater agreementc | 760 | 10.5 | 94.5 | 0.73 (0.66, 0.81) | 90.7 | 94.9 | 66.0 | 98.9 |
| Ariol vs raterb | 1914 | 9.8 | 84.1 | 0.44 (0.40, 0.48) | 87.7 | 83.7 | 36.9 | 98.4 | |
| Ariol vs raterb – ER+ | 1041 | 1.3 | 86.2 | 0.14 (0.11, 0.17) | 100.0 | 86.0 | 8.9 | 100.0 | |
| Ariol vs raterb – ER− | 342 | 39.5 | 82.2 | 0.63 (0.53, 0.74) | 83.7 | 81.2 | 74.3 | 88.4 |
% Pos., % positive cores for reference rater; Se, sensitivity; Sp, Specificity; PPV, positive predictive value; NPV, negative predictive value.
Includes data from CNIO‐BCS, MCBCS, ORIGO, SBCS.
Includes data from SEARCH re‐analysis.
Includes data from ABCS, CNIO‐BCS, KBCP, MCBCS, ORIGO, SBCS.
Discussion
Automated image analysis of TMAs using many different systems has been shown to perform well for multiple markers 12, 13, 14, 15, 16, 17, 18, 23, 24. However, most studies have been based on relatively small comparisons of TMAs from one or few centres. Our report is a large‐scale evaluation of the performance of automated image analysis in the scoring of TMAs from different source institutions across different countries in a consortium of breast cancer studies.
The core‐level measures of agreement between automated and visual scores for the virtual TMAs in our report are most comparable to those in previous reports as they were based on comparisons of the same exact images. For ER, PR and HER2, they were lower than previously reported by our group using the Ariol system 14, or an automated scoring algorithm adapted from astronomy 15, possibly reflecting the greater variability in tissue preparation related to multiple specimen sources. Bolton et al 14 used TMAs stained by ER, PR and HER2 from PBCS, and Ali et al 15 used ER and HER2 stained TMAs from SEARCH. While these TMAs were also included in our study, the automated image analysis of the TMAs was done independently using different methods. Patient characteristics, modes of tumour detection, pathologic features and tissue handling in this report were likely highly variable because of the inclusion of multiple studies, but representative of ‘real world' population‐based samples collected over many years in international collaborations.
As expected, the agreement for subject‐level comparisons was lower than for core‐level comparisons since the latter are comparing scores based on different pieces of the tumour tissue, and the visual scores came from multiple sources (mainly clinical records and central review of cases by individual studies). Arguably, however, these comparisons are most relevant for answering scientific questions. A key advantage of automated image analysis is that it does not use pathologists's time and can be run continuously, including overnight. The analysis time is dependent on the type of stain, size of cores and number of cores per TMA. For instance, the time to score a TMA with 183 cores of 0.6 mm diameter can range from 25 min for a simple nuclear analysis (ER) to 70 min for a cytoplasmic analysis (CK5/6). The entire dataset was analysed over the course of a week using four batch processors. This is in comparison to approximately 35–40 min for a simple manual ER score of a similar TMA by a skilled pathologist using computer‐assisted scoring methods. A limitation of the automated approach is that 20–25% of cores in TMAs are unsatisfactory for scoring, but imaging systems do not perform well in triaging such cores. QC assessment of each core by visual inspection to identify unsatisfactory cores would improve the performance of the automated scoring. Similarly, study‐specific training of algorithms could also improve performance. Although during TMA production, tissue cores are targeted to tumour areas, contamination by normal elements is unavoidable. Identification of tumour cells by semi‐automated systems including manual demarcation of tumour areas prior to automate scoring could improve the performance of automated systems. However, these additional procedures are time consuming, and the added efforts to improve scoring diminish the relative value of automation. Automated pattern‐recognition software to identify tumour areas such as Definiens 24 are promising but it is still difficult to get accurate identification of breast tumour cells, particularly in heterogeneous sets of tissue samples such as those derived from international consortia.
The performance of automated scoring for PR was worse than ER stains, possibly partly explained by a higher regional heterogeneity in positive staining for PR than ER 16, 25. HER2 scoring performed using FDA‐approved commercial algorithms in brightfield 26, 27, 28 and in fluorescence 29 has demonstrated substantial agreement with visual assessment in studies of varying size and design. We observed a substantial agreement for HER2 semi‐quantitative scores for inter‐rater or automated‐rater comparisons, which was similar to that demonstrated previously on the Ariol system in our hands 14.
Dichotomous classification of automated scores for ER, PR and HER2 achieved less separation of prognostic groups by marker expression than the clinical/study scores. Because these three markers are routinely determined in most clinical settings, the main advantage of the automated scores was providing quantitative measures of expression that allowed refinement in the groups of patients with different prognosis. Although semi‐quantitative scores can also be obtained from clinical records, the reporting is not homogeneous and this information is not available in many epidemiological studies.
The performance of automated analysis of the cytoplasmic CK5/6 and membranous EGFR stains was much worse than for the time‐tested nuclear ER/PR and membranous HER2 antibodies, resulting in many false positive results. Automated scoring of cytoplasm stains such CK5/6 is particularly challenging since most systems use colour de‐convolution to remove the nuclear counterstain from the brown stain in order to identify nuclei and determine the cell type. This method reduces resolution so the accuracy of identification decreases. The poor performance for CK5/6 and EGFR was also an issue for the inter‐rater comparison, although to a lesser extent. Examination of discordant scores revealed that both the inter‐rater and automated‐visual discordances were often due to scoring immunopositive normal cells. Automated image analyses for CK5/6 and EGFR may provide useful triage; negative results may be considered final, whereas positive results require visual confirmation. This would potentially reduce scoring workloads by about 75%, and could be further refined by limiting visual review to ER‐negative or triple negative (ER−/PR−/HER2−) cancers expressing basal markers. However, image management could present challenges for targeted visual reviews.
In conclusion, using automated image analysis of TMAs stained by ER, PR and HER2 can be a useful tool to obtain quantitative scores for these markers in large collaborative studies including heterogeneous TMAs. However, automated scoring does not result in an improved performance of survival models, compared to visual scores. Automated scoring of CK5/6 and EGFR may permit triage of negative cores but positive results require visual review. Efforts to improve the performance of automated analysis should focus on standardization of specimen handling, TMA construction 30, 31 and use of centralized optimized IHC‐staining protocols. Improved standardization and optimization of key steps in these procedures combined with technical advances in automated analysis of IHC stains would facilitate large population‐based studies of breast cancer.
Author contributions
WJH, FMB, EP, PDP, MES, MG‐C conceived and carried out the study; WJH, LM, PG, NJ, L‐AMcD, JM, FD carried out the centralized laboratory work; EP, MES, EJS, SP, CHMvanD, LJ, RS, DV performed visual scoring; PC performed data management; MG‐C, MNB analysed data; CC, AB, JS, JW, HN, RF, CB, PH, HRA, S‐JD, JF, JL, LB, AM, VK, V‐MK, AC, IWB, SSC, MWR, FJC, JEO, PD, WEM, CMS, AH, JB, JIAP, PM, MKB, DFE, MKS contributed to data collection and/or data management. All authors were involved in writing the paper and gave final approval of the submitted and published versions.
Supporting information
The following supplementary material may be found online.
Table S1. Description of study populations included in the analyses.
Table S2. Distribution of clinico‐pathological characteristics by study, for 8267 BCAC breast cancer cases included in the analyses.
Table S3. Staining protocols used by different studies for ER, PR, HER2, CK56 and EGFR
Table S4. Cross‐classification of visual (rater 1 and rater 2) and Ariol automated scores for ER, PR and HER2 stains in Virtual TMA.
Table S5. Cross‐classification between Ariol automated quantitative ER, PR and HER2 scores for each subject and marker status from clinical/study records. Clinical/study scores are dichotomous (positive/negative), and ER, PR Ariol scores are considered both as continuous and dichotomous.
Table S6. Agreement between Ariol automated quantitative ER, PR and HER2 scores for each subject and marker status from clinical/study records, by study.
Table S7. Inter‐rater agreement of CK56 and EGFR scoring by study.
Table S8. Cross‐classification of subjects by ER and PR status (positive/negative) according to BCAC case data and quintiles of the combined automated Ariol score.
Table S9. Distribution of quality control measures for tissue cores stained for CK56 and EGFR TMAs from participating studies.
Figure S1. Representative images of ER staining demonstrating the level of variation in DAB and Haematoxylin staining across the sample set. (A) SEARCH study; (B) ABCS study (BOOG_E TMA); (C) ABCS study (BOOG_J TMA); (D) KBCP study.
Figure S2. Screengrab images from the Ariol system visualizing the algorithm training for representative images detailed in Supplementary material Figure 1. (A1, B1, C1, D1) DAB colour recognition (red) and haematoxylin colour recognition (green) demonstrating the effect of cytoplasmic ER staining and dark heamatoxylin staining on colour recognition. (A2, B2, C2, D2) Nuclear segmentation, based on the colour recognition. Yellow dots delineate ER‐positive nuclei. Pink dots delineate ER‐negative tumour cells according to the tuned algorithm A) SEARCH study; (B) ABCS study (BOOG_E TMA); (C) ABCS study (BOOG_J TMA); (D) KBCP study.
Figure S3. Distribution of Ariol automated intensity (A), percentage (B), and combined (C) scores for ER, by study.
Figure S4. Distribution of Ariol automated intensity (A), percentage (B), and combined (C) scores for ER, by study.
Supporting Information
Acknowledgements
We would like to thank Rob Sykes from Leica Biosystems who helped to retrain the SEARCH image analysis for EGFR and CK5/6. We would also like to thank Mike Irwin at the Institute of Astronomy, Cambridge, for assistance with methods in the automated analysis. ABCS was supported by the Dutch Cancer Society [grants NKI 2007‐3839; 2009 4363]; BBMRI‐NL, which is a Research Infrastructure financed by the Dutch government (NWO 184.021.007); and the Dutch National Genomics Initiative. CNIO‐BCS was supported by the Genome Spain Foundation, the Red Temática de Investigación Cooperativa en Cáncer and grants from the Asociación Española Contra el Cáncer and the Fondo de Investigación Sanitario (PI11/00923 and PI081120). The Human Genotyping‐CEGEN Unit (CNIO) is supported by the Instituto de Salud Carlos III. HEBCS was financially supported by the Helsinki University Central Hospital Research Fund, Academy of Finland (132473), the Finnish Cancer Society, The Nordic Cancer Union and the Sigrid Juselius Foundation. The KBCP was financially supported by the special Government Funding (EVO) of Kuopio University Hospital grants, Cancer Fund of North Savo, the Finnish Cancer Organizations, the Academy of Finland and by the strategic funding of the University of Eastern Finland. The MCBCS was supported by an NIH Specialized Program of Research Excellence (SPORE) in Breast Cancer [CA116201], the Breast Cancer Research Foundation, the Mayo Clinic Breast Cancer Registry and a generous gift from the David F. and Margaret T. Grohne Family Foundation and the Ting Tsung and Wei Fong Chao Foundation. ORIGO authors thank E. Krol‐Warmerdam, and J. Blom; The contributing studies were funded by grants from the Dutch Cancer Society (UL1997‐1505) and the Biobanking and Biomolecular Resources Research Infrastructure (BBMRI‐NL CP16). PBCS was funded by Intramural Research Funds of the National Cancer Institute, Department of Health and Human Services, USA. SBCS was supported by Yorkshire Cancer Research S295, S299, S305PA. SEARCH is funded by programme grant from Cancer Research UK [C490/A10124. C490/A16561] and supported by the UK National Institute for Health Research Biomedical Research Centre at the University of Cambridge. Part of this work was supported by the European Community's Seventh Framework Programme under grant agreement number 223175 (grant number HEALTH‐F2‐2009‐223175) (COGS). We acknowledge funds from Breakthrough Breast Cancer, UK, in support of MGC and MB.
Conflict of interest: The authors have declared no conflicts of interest.
References
- 1. Blows FM, Driver KE, Schmidt MK, et al Subtyping of breast cancer by immunohistochemistry to investigate a relationship between subtype and short and long term survival: a collaborative analysis of data for 10 159 cases from 12 studies. PLoS Med 2010; 7: e1000279. [DOI] [PMC free article] [PubMed] [Google Scholar]
- 2. Cuzick J, Dowsett M, Pineda S, et al Prognostic value of a combined estrogen receptor, progesterone receptor, Ki‐67, and human epidermal growth factor receptor 2 immunohistochemical score and comparison with the Genomic Health recurrence score in early breast cancer. J Clin Oncol 2011; 29: 4273–4278. [DOI] [PubMed] [Google Scholar]
- 3. Curtis C, Shah SP, Chin D‐F, et al The genomic and transcriptomic architecture of 2,000 breast tumours reveals novel subgroups. Nature 2012; 486: 346–352. [DOI] [PMC free article] [PubMed] [Google Scholar]
- 4. Sørlie T, Perou CM, Tibshirani R, et al Gene expression patterns of breast carcinomas distinguish tumor subclasses with clinical implications. Proc Natl Acad Sci USA 2001; 98: 10869–10874. [DOI] [PMC free article] [PubMed] [Google Scholar]
- 5. Perou CM, Sørlie T, Eisen MB, et al Molecular portraits of human breast tumours. Nature 2000; 406: 747–752. [DOI] [PubMed] [Google Scholar]
- 6. Wishart GC, Bajdik CD, Dicks E, et al PREDICT Plus: development and validation of a prognostic model for early breast cancer that includes HER2. Br J Cancer 2012; 107: 800–807. [DOI] [PMC free article] [PubMed] [Google Scholar]
- 7. Ravdin PM, Siminoff LA, Davis GJ, et al Computer program to assist in making decisions about adjuvant therapy for women with early breast cancer. J Clin Oncol 2001; 19: 980–991. [DOI] [PubMed] [Google Scholar]
- 8. Nielsen TO, Parker JS, Leung S, et al A comparison of PAM50 intrinsic subtyping with immunohistochemistry and clinical prognostic factors in tamoxifen‐treated estrogen receptor‐positive breast cancer. Clin Cancer Res 2010; 16: 5222–5232. [DOI] [PMC free article] [PubMed] [Google Scholar]
- 9. Nielsen TO, Hsu FD, Jensen K, et al Immunohistochemical and clinical characterization of the basal‐like subtype of invasive breast carcinoma. Clin Cancer Res 2004; 10: 5367–5374. [DOI] [PubMed] [Google Scholar]
- 10. Kononen J, Bubendorf L, Kallioniemi A, et al Tissue microarrays for high‐throughput molecular profiling of tumor specimens. Nat Med 1998; 4: 844–847. [DOI] [PubMed] [Google Scholar]
- 11. Bacus S, Flowers JL, Press MF, et al The evaluation of estrogen receptor in primary breast carcinoma by computer‐assisted image analysis. Am J Clin Pathol 1988; 90: 233–239. [DOI] [PubMed] [Google Scholar]
- 12. Turbin DA, Leung S, Cheang MCU, et al Automated quantitative analysis of estrogen receptor expression in breast carcinoma does not differ from expert pathologist scoring: a tissue microarray study of 3,484 cases. Breast Cancer Res Treat 2008; 110: 417–426. [DOI] [PubMed] [Google Scholar]
- 13. Konsti J, Lundin M, Joensuu H, et al Development and evaluation of a virtual microscopy application for automated assessment of Ki‐67 expression in breast cancer. BMC Clin Pathol 2011; 11: 3. [DOI] [PMC free article] [PubMed] [Google Scholar]
- 14. Bolton KL, Garcia‐Closas M, Pfeiffer RM, et al Assessment of automated image analysis of breast cancer tissue microarrays for epidemiologic studies. Cancer Epidemiol Biomarkers Prev 2010; 19: 992–999. [DOI] [PMC free article] [PubMed] [Google Scholar]
- 15. Ali HR, Irwin M, Morris L, et al Astronomical algorithms for automated analysis of tissue protein expression in breast cancer. Br J Cancer 2013; 17: 1–11. [DOI] [PMC free article] [PubMed] [Google Scholar]
- 16. Rexhepaj E, Brennan DJ, Holloway P, et al Novel image analysis approach for quantifying expression of nuclear proteins assessed by immunohistochemistry: application to measurement of oestrogen and progesterone receptor levels in breast cancer. Breast Cancer Res 2008; 10: R89. [DOI] [PMC free article] [PubMed] [Google Scholar]
- 17. Faratian D, Kay C, Robson T, et al Automated image analysis for high‐throughput quantitative detection of ER and PR expression levels in large‐scale clinical studies: the TEAM Trial Experience. Histopathology 2009; 55: 587–593. [DOI] [PubMed] [Google Scholar]
- 18. Walton NA, Brenton JD, Caldas C, et al PathGrid: a service‐orientated architecture for microscopy image analysis. Philos Trans A Math Phys Eng Sci 2010; 368: 3937–3952. [DOI] [PubMed] [Google Scholar]
- 19. Sherman ME, Howatt W, Blows FM, et al Molecular pathology in epidemiologic studies: a primer on key considerations. Cancer Epidemiol Biomarkers Prev 2010; 19: 966–972. [DOI] [PMC free article] [PubMed] [Google Scholar]
- 20.Breast Cancer Association Consortium, http://ccge.medschl.cam.ac.uk/consortia/bcac/. Last accessed: 1 May 2014.
- 21. Mayr D, Heim S, Werhan C, et al Comprehensive immunohistochemical analysis of Her‐2/neu oncoprotein overexpression in breast cancer: HercepTest (Dako) for manual testing and Her‐2/neuTest 4B5 (Ventana) for Ventana BenchMark automatic staining system with correlation to results of fluorescence in situ hybridization (FISH). Virchows Arch 2009; 454: 241–248. [DOI] [PubMed] [Google Scholar]
- 22. Harvey JM, Clark GM, Osborne CK, Allred DC. Estrogen receptor status by immunohistochemistry is superior to the ligand‐binding assay for predicting response to adjuvant endocrine therapy in breast cancer. J Clin Oncol 1999; 17: 1474–1481. [DOI] [PubMed] [Google Scholar]
- 23. Turashvili G, Bouchal J, Baumforth K, et al Novel markers for differentiation of lobular and ductal invasive breast carcinomas by laser microdissection and microarray analysis. BMC Cancer 2007; 7: 55. [DOI] [PMC free article] [PubMed] [Google Scholar]
- 24. Beck AH, Sangoi AR, Leung S, et al Systematic analysis of breast cancer morphology uncovers stromal features associated with survival. Sci Translational Med 2011; 3: 108ra113. [DOI] [PubMed] [Google Scholar]
- 25. Nadji M, Gomez‐Fernandez C, Ganjei‐Azar P, Morales AR. Immunohistochemistry of estrogen and progesterone receptors reconsidered: experience with 5,993 breast cancers. Am J Clin Pathol 2005; 123: 21–27. [DOI] [PubMed] [Google Scholar]
- 26. Nassar A, Cohen C, Agersborg SS, et al Trainable immunohistochemical HER2/neu image analysis: a multisite performance study using 260 breast tissue specimens. Arch Pathol Lab Med 2011; 135: 896–902. [DOI] [PubMed] [Google Scholar]
- 27. Brügmann A, Eld M, Lelkaitis G, et al Digital image analysis of membrane connectivity is a robust measure of HER2 immunostains. Breast Cancer Res Treat 2012; 132: 41–49. [DOI] [PubMed] [Google Scholar]
- 28. Lloyd MC, Allam‐Nandyala P, Purohit CN, et al Using image analysis as a tool for assessment of prognostic and predictive biomarkers for breast cancer: How reliable is it? J Pathol Inform 2010; 1: 29. [DOI] [PMC free article] [PubMed] [Google Scholar]
- 29. McCabe A, Dolled‐Filhart M, Camp RL, Rimm DL. Automated quantitative analysis (AQUA) of in situ protein expression, antibody concentration, and prognosis. J Natl Cancer Inst 2005; 97: 1808–1815. [DOI] [PubMed] [Google Scholar]
- 30. Ilyas M, Grabsch H, Ellis IO, et al Guidelines and considerations for conducting experiments using tissue microarrays. Histopathology 2013; 62: 827–839. [DOI] [PubMed] [Google Scholar]
- 31. Pinder SE, Brown JP, Gillett C, et al The manufacture and assessment of tissue microarrays: suggestions and criteria for analysis, with breast cancer as an example. J Clin Pathol 2013; 66: 169–177. [DOI] [PubMed] [Google Scholar]
Associated Data
This section collects any data citations, data availability statements, or supplementary materials included in this article.
Supplementary Materials
The following supplementary material may be found online.
Table S1. Description of study populations included in the analyses.
Table S2. Distribution of clinico‐pathological characteristics by study, for 8267 BCAC breast cancer cases included in the analyses.
Table S3. Staining protocols used by different studies for ER, PR, HER2, CK56 and EGFR
Table S4. Cross‐classification of visual (rater 1 and rater 2) and Ariol automated scores for ER, PR and HER2 stains in Virtual TMA.
Table S5. Cross‐classification between Ariol automated quantitative ER, PR and HER2 scores for each subject and marker status from clinical/study records. Clinical/study scores are dichotomous (positive/negative), and ER, PR Ariol scores are considered both as continuous and dichotomous.
Table S6. Agreement between Ariol automated quantitative ER, PR and HER2 scores for each subject and marker status from clinical/study records, by study.
Table S7. Inter‐rater agreement of CK56 and EGFR scoring by study.
Table S8. Cross‐classification of subjects by ER and PR status (positive/negative) according to BCAC case data and quintiles of the combined automated Ariol score.
Table S9. Distribution of quality control measures for tissue cores stained for CK56 and EGFR TMAs from participating studies.
Figure S1. Representative images of ER staining demonstrating the level of variation in DAB and Haematoxylin staining across the sample set. (A) SEARCH study; (B) ABCS study (BOOG_E TMA); (C) ABCS study (BOOG_J TMA); (D) KBCP study.
Figure S2. Screengrab images from the Ariol system visualizing the algorithm training for representative images detailed in Supplementary material Figure 1. (A1, B1, C1, D1) DAB colour recognition (red) and haematoxylin colour recognition (green) demonstrating the effect of cytoplasmic ER staining and dark heamatoxylin staining on colour recognition. (A2, B2, C2, D2) Nuclear segmentation, based on the colour recognition. Yellow dots delineate ER‐positive nuclei. Pink dots delineate ER‐negative tumour cells according to the tuned algorithm A) SEARCH study; (B) ABCS study (BOOG_E TMA); (C) ABCS study (BOOG_J TMA); (D) KBCP study.
Figure S3. Distribution of Ariol automated intensity (A), percentage (B), and combined (C) scores for ER, by study.
Figure S4. Distribution of Ariol automated intensity (A), percentage (B), and combined (C) scores for ER, by study.
Supporting Information