

Abstract
Unlike many other human solid tumors, ovarian tumors express many epithelial markers at a high level for cell growth and local invasion. The phosphoprotein Pinin plays a key role in epithelial cell identity. We showed that clinical ovarian tumors and ovarian cancer cell lines express a high level of Pinin when compared with normal ovarian tissues and immortalized normal ovarian surface epithelial cell lines. Pinin co-localized and physically interacted with transcriptional corepressor C-terminal binding proteins, CtBP1 and CtBP2, in the nuclei of cancer cells. Knockdown of Pinin in ovarian cancer cells resulted in specific reduction of CtBP1 protein expression, cell adhesion, anchorage-independent growth, and increased drug sensitivity. Whole transcriptomic comparison of next-generation RNA sequencing data between control ovarian cancer cell lines and cancer cell lines with respective knockdown of Pinin, CtBP1, and CtBP2 expression also showed reduced expression of CtBP1 mRNA in the Pinin knockdown cell lines. The Pinin knockdown cell lines shared significant overlap of differentially expressed genes and RNA splicing aberrations with CtBP1 knockdown and in a lesser degree with CtBP2 knockdown cancer cells. Hence, Pinin and CtBP are oncotargets that closely interact with each other to regulate transcription and pre-mRNA alternative splicing and promote cell adhesion and other epithelial characteristics of ovarian cancer cells.
Keywords: ovarian cancer, tumorigenesis, RNA metabolism, cell adhesion, RNA sequencing
INTRODUCTION
Ovarian cancer has the highest mortality rate of all gynecologic malignancies and is the fifth leading cause of cancer death in females in the United States [1]. The majority of patients with serous epithelial cancer, the most common epithelial ovarian malignancy, were usually diagnosed at an advanced stage and had a 5-year survival rate of less than 25% and a 10-year survival rate approaching zero [1]. The high death rate is not only due to the advanced stage of disease at diagnosis but also to the lack of disease-specific and effective therapy. Therefore, it is of paramount importance to understand the underlining mechanisms by which ovarian pathogenesis and tumor progression are regulated and to identify clinical targets for therapeutic development.
Characterization of ovarian tumors and cancer cell lines has shown that they are highly proliferative and are more epithelial-like than normal ovarian surface epithelia and the derived cell lines, which are mesothelial cells in nature [2–5]. Benign metaplastic ovarian cysts and the associated ovarian tumor cells [2, 3] express high levels of E-cadherin [6] and show suppression of tumor growth factor-beta (TGF-β) pathway [7]. Ectopic expression of E-cadherin caused mesenchymal-epithelial transition (MET) in ovarian surface epithelial cells and tumor formation [8, 9]. Increased cell adhesion mediated by these epithelial markers is suggested to be important for the activation of PI3K/AKT [10] and EGFR [11] pathways for anchorage-independent survival and proliferation, as well as for the invasion into local tissues via collective cell movement [12, 13]. We have previously identified overexpression of transcriptional corepressor protein, CtBP2, in ovarian cancer and its function in regulating cell growth and chemoresponse [14, 15], and also shown that CtBP2 is an oncogene that may play a significant role in epigenetic silencing of BRCA1 function in sporadic epithelial ovarian cancer [16]. C-terminal binding protein (CtBP) was originally identified as a protein that interacts with the C-terminal region of adenoviral oncoprotein E1A, which results in the reduced ability of E1A to transform cells [17, 18]. Mammalian CtBP family members include CtBP1 and CtBP2 isoforms, which carry diverse functions in embryogenesis and vertebrate development [19]. CtBP proteins promote cell survival by suppressing the expression of several pro-apoptotic genes, thus acting as apoptotic transcriptional regulators [20]. In addition, CtBPs promote cell survival through the maintenance of mitotic fidelity [21]. Loss of CtBP expression suppresses cell proliferation through a combination of apoptosis, reduction in cell cycle progression, and aberrations in transit through mitosis [21]. Alpatov et al. reported that CtBP1 interacts with a 140-kDa nucleoprotein named Pinin, which relieves CtBP1-mediated repression of E-cadherin expression [22]. Pinin was originally identified as an intermediate filament-associating protein in the desmosome complex [23] and was later found to co-exist in the nucleus [24]. Conditional disruption of Pinin expression in mice [25, 26] and in cell lines [27] resulted in cellular apoptosis and severe developmental problems.
In this study, we aimed to investigate the expression level of Pinin in ovarian tumors and its interactions with CtBP proteins in ovarian cancer cells. As Pinin has been implicated in alternative pre-mRNA splicing [28, 29], we also performed massively parallel paired-end RNA sequencing to explore the consequences of knocking down Pinin expression on gene transcription and RNA splicing variants.
RESULTS
Pinin is overexpressed in ovarian tumors and ovarian cancer cell lines
We first investigated the expression pattern of Pinin in clinical ovarian specimens. A panel of normal ovary and, benign, borderline and invasive ovarian tumors (n=74) were subjected to immunohistochemistry (IHC) staining for Pinin (Figure 1A). ANOVA and post hoc analysis (Table 1) showed significant overexpression of Pinin (p < 0.001) in malignant and borderline tumors compared to normal ovaries. When the analysis was performed to evaluate the expression among different histologic subtypes within the invasive tumor group, the serous subtype showed relatively higher Pinin expression than the mucinous subtype (p = 0.003). We also performed Western blot analysis to evaluate the expression of Pinin in our panel of immortalized normal human ovarian surface epithelial (HOSE) cell lines and ovarian cancer cell lines. The results (Figure 1B) showed that Pinin was overexpressed in ten out of twelve ovarian cancer cell lines compared with normal HOSE cell lines. Hence, collectively, the results show that Pinin is overexpressed in most of the ovarian cancer cells.
Figure 1. Pinin expression in clinical ovarian specimens and ovarian cell lines.
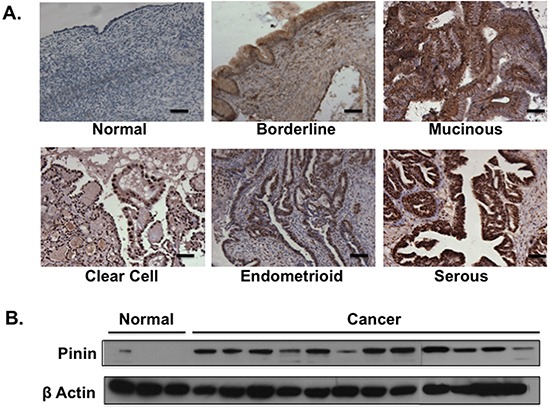
A. Representative of Pinin staining in clinical ovarian specimens. To highlight the tumor cell population, the slides were counterstained with hematoxylin (purple). The Pinin staining is in brown color. Scale bars represent 50μm. B. Western blot analysis of ovarian cell lysates for Pinin expression. β–actin was used as loading control.
Table 1. Diagnostic and histologic characteristics of Pinin expression in clinical ovarian specimens.
| Characteristics | Number of cases | Mean of scores | P-value | |
|---|---|---|---|---|
| Diagnostic | ||||
| Healthy | 8 | 0.29 | < 0.001 | |
| Benign | 6 | 3.00 | ||
| Borderline | 8 | 7.00 | ||
| Invasive | 52 | 6.89 | ||
| Histology | ||||
| Serous | 26 | 8.08 | 0.003 | |
| Mucinous | 14 | 5.18 | ||
| Endometrioid | 7 | 6.50 | ||
| Clear Cell | 5 | 6.00 |
Notes for Tukey's post hoc analysis: Significant differences between normal and borderline and between normal and invasive tumors in Diagnostic; and significant difference between serous and mucinous tumors in Histologic.
Pinin interacts with CtBP proteins in the nuclei of cancer cells
Pinin has been shown to interact with CtBP1 to act on E-cadherin promoter [30]. As we previously have shown that CtBP2 is overexpressed in ovarian cancer [14], it would be of interest to investigate whether CtBP2 also interacts with Pinin. Fluorescence microscopy of ovarian cancer cells stained with fluorescently labeled Pinin and CtBP2 antibodies showed that they were co-localized in the nuclei of the cells (Figure 2A), similar to the co-localization of CtBP1 with Pinin (data not shown). Interestingly, immunostaining also showed that whereas CtBP2 protein was lost in cells undergoing mitosis, Pinin protein remained in the cytosol of the cells (block arrow in Figure 2A). To further investigate the interaction between Pinin and CtBP proteins, co-immunoprecipitation was performed using CtBP1 and CtBP2 antibodies, respectively, to immunoprecipitate intracellular CtBP proteins. Western blot analysis of the immunoprecipitates showed that Pinin was co-immunoprecipitated with both CtBP proteins (Figure 2B). Hence, both immunofluorescence and co-immunoprecipitation assays suggest that Pinin physically associates with both CtBP1 and CtBP2 proteins in the nuclei of ovarian cancer cells.
Figure 2. CtBP and Pinin interact with each other and are co-localized in the nuclei of cells.
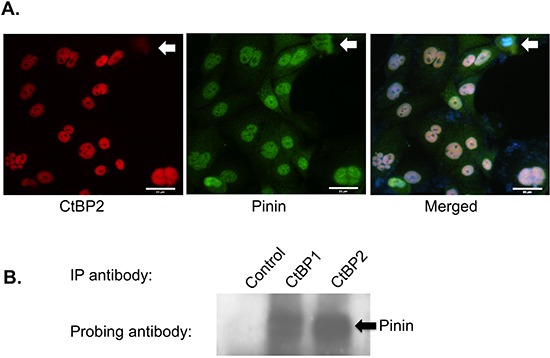
A. Immunofluorescence to demonstrate the co-localization of CtBP2 (pseudo-colored in red) and Pinin (pseudo-colored in green) proteins in the nuclei of ovarian cancer cells. Shown on the right is the overlaid image of both red and green pictures together with blue DAPI DNA stain. The block arrow indicates the cells undergoing mitosis. Size bar represents 35μm. B. Co-immunoprecipitation assay using a mouse control antibody, CtBP1 antibody, and CtBP2 antibody, respectively. The immunoprecipitated lysates were fractionated, and the proteins were transferred to PVDF membrane and probed with an anti-Pinin antibody. The block arrow indicates the position of the Pinin protein band.
SKOV3-IPLuc ovarian cancer cells with knockdown (KD) of Pinin expression showed deficiency in cell adhesion and other transformed phenotypes
To explore the potential function of Pinin in ovarian cancer, we have established three knockdown SKOV3-IPLuc ovarian cancer cell lines employing lentiviral particles harboring three different Pinin-targeting short hairpin RNA (shRNA) constructs. We compared the expression of Pinin, CtBP1, and CtBP2 in these three knockdown cell lines with the control SKOV3-IPLuc cancer cell line, and a pair of SKOV3-IPLuc ovarian cancer cell lines with knockdown of CtBP1 and CtBP2 expression, respectively. The result of the Western blot analysis (Figure 3A) shows that the three Pinin-KD cell lines together with both CtBP1-KD and CtBP2-KD cell lines had significant reduction of Pinin expression. However, a surprising observation is that the Pinin-KD cell lines also showed specific downregulation of CtBP1 expression, without significant changes of CtBP2 expression. Cell growth study did not reveal any significant growth hindrance of the Pinin knockdown cell lines. However, by day 10, all the three Pinin-KD cell lines showed a drastic reduction of MTT readings as compared with the control cell line (Figure 3B). We repeated the experiment together with CtBP1-KD and CtBP2-KD cell lines and also monitored the cells during the cell growth study (Supplementary Figure S1). By day 7, when the control cancer cells were becoming very confluent, all the Pinin and CtBP1 knockdown cell lines showed, with CtBP2-KD cells a lesser degree, excessive detachment from the culture plates. This phenomenon suggests a reduction of cell adhesion in the knockdown cancer cells, similar to what we have reported for the CtBP2-KD cancer cells [14]. The cell lines were then tested for the ability to attach on Cell Adhesion strips coated with different extracellular matrices. The results showed that the Pinin-KD cell lines adhered more poorly to different extracellular matrices than the control cells (Figure 3C).
Figure 3. Ovarian cancer cells with Pinin knockdown showed reduction in CtBP1 expression and suppression of cell adhesion and clonogenecity.
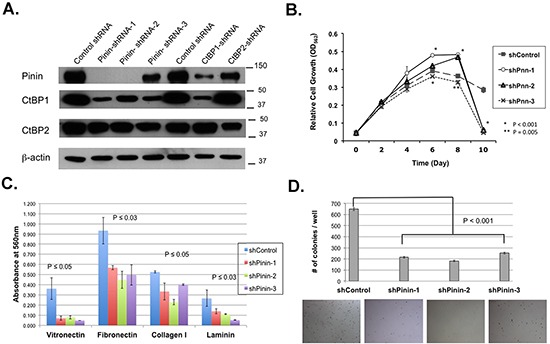
A. Western blot analysis of Control, Pinin-KD, CtBP1-KD and CtBP2-KD cell lysates for the expression of Pinin, CtBP1, CtBP2. β–actin was used as loading control. B. Cell growth assay to determine the effect of Pinin knockdown on cell growth. C. Cell adhesion assay to compare the adhesion of control and Pinin-KD cell lines to different extracellular matrices. D. Soft agar assay to compare the clonogenecity of control and Pinin-KD cells. The bottom panel shows the representative images of the cell colonies after crystal violet staining. All the data shown are averages of triplicates of data from two independent experiments.
We next tested the cell lines for anchorage-independent growth, a hallmark for transformed cells. The Pinin-KD cells formed only about 30-40% of the average number of colonies that the control line formed in the soft agar assay (Figure 3D). We also investigated whether the knockdown cells showed any differences in response to Paclitaxel, a drug used in the standard treatment regimen of ovarian cancer patients. The result (Supplementary Figure S2) showed that the Pinin-KD cell lines exhibited significantly higher sensitivity to the Paclitaxel treatment. In the meantime, CtBP1-KD and CtBP2-KD cell lines showed significant cell death only at very high doses of Paclitaxel, which we have reported previously [14].
Collectively, our functional studies illustrate the important function of Pinin in cell adhesion, clonogenicity, and chemoresponse.
Next-generation RNA sequencing revealed that Pinin-KD and CtBP-KD cancer cells showed significant overlap of differential gene expression and RNA splicing aberrations
In order to understand the underlying mechanisms by which Pinin and CtBP regulate the phenotypes of ovarian cancer cells, gene expression profiling was performed. Because previous studies have implied that Pinin associates with RNA splicing factors and is involved in alternative pre-mRNA splicing [28, 29], we therefore have opted for next-generation RNA sequencing to determine gene expression and potential aberrations in alternative mRNA splicing. Ten total RNA samples, with two separate RNA preparations for each of the control, CtBP1-KD, CtBP2-KD, Pinin-KD1 and Pinin-KD2 cancer cell lines, were submitted for cDNA library preparation and massively parallel paired-end multiplex RNA sequencing and analysis as described in Materials and Methods. Analysis of the RNA sequencing data at the gene level revealed all the significant differentially expressed genes between control cells and the three knockdown groups, which are presented in Supplementary Table S1. Supplementary Table S1 also highlights a significant representation of noncoding RNAs including microRNAs, antisense RNAs, long intergenic noncoding RNAs (lncRNAs), and small nucleolar RNAs (snoRNAs) in Pinin-KD (21.5%), CtBP1-KD (24.5%), and CtBP2-KD (23.2%) cancer cell. The heatmap for the top 50 upregulated and top 50 downregulated genes between control and Pinin-KD cells is shown in Figure 4A. A Venn diagram (Figure 4B) was drawn to illustrate the overlapping differentially expressed genes among the three knockdown groups. There are 112 differentially expressed genes shared between Pinin-KD and CtBP1-KD cells, and less than half of that number (50) between Pinin-KD and CtBP2-KD cells. There are 26 genes that are shared by all three groups. The identities and the quantitative information of these 26 genes are listed in Table 2. In Table 2, quantitative information of two interesting genes that are significant only for Pinin-KD and CtBP1-KD cells but not in CtBP2-KD cells is also presented. One differentially expressed gene in both Pinin-KD and CtBP1-KD cells but not in CtBP2-KD cells is CtBP1. This mRNA finding corroborates the Western blot analysis result (Figure 3A). The second gene is epithelial splicing regulatory protein 1 (ESRP1), which has been reported to associate with Pinin in human corneal epithelial cells [29].
Figure 4. Analysis of RNA sequencing data at the gene level indicates the overlap between Pinin-KD cells and CtBP-KD cells in gene expression and cell function.
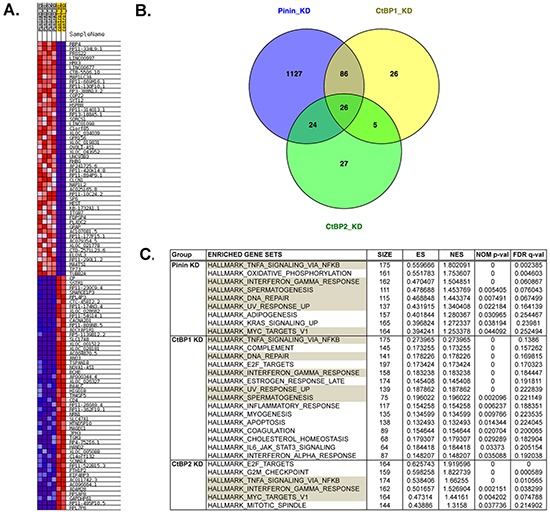
A. Top 50 up-regulated and top 50 down-regulated genes in Pinin-KD cells compared to control cells, B. Venn diagram to show the overlapping of differentially expressed genes among the three knockdown groups, and C. Significant gene set enrichments of differentially expressed genes for Pinin-KD, CtBP1-KD, and CtBP2-KD cancer cells determined by GSEA. The enriched gene sets of Pinin-KD cancer cells that are shared in the CtBP1-KD and CtBP2-KD cells are shaded in grey.
Table 2. Significant genes that are differentially expressed between control and the Pinin_KD and CtBP_KD groups.
| Gene Identifier | Locus | Gene | Log2(fold_change) | ||
|---|---|---|---|---|---|
| Pinin_KD | CtBP1_KD | CtBP2_KD | |||
| N/A | chr21:16070521-16627397 | AP000962.1 | 8.48333 | 8.25676 | 6.94265 |
| ENSG00000207863 | chr21:16070521-16627397 | MIR125B2 | 8.48333 | 8.25676 | 6.94265 |
| ENSG00000207638 | chr21:16070521-16627397 | MIR99A | 8.48333 | 8.25676 | 6.94265 |
| ENSG00000215386 | chr21:16070521-16627397 | MIR99AHG | 8.48333 | 8.25676 | 6.94265 |
| ENSG00000199030 | chr21:16070521-16627397 | MIRLET7C | 8.48333 | 8.25676 | 6.94265 |
| ENSG00000162493 | chr1:13583464-13617957 | PDPN | 6.37081 | 4.4568 | 3.95776 |
| ENSG00000126561 | chr17:42287546-42311943 | STAT5A | 5.3832 | 6.06392 | 6.11211 |
| ENSG00000147872 | chr9:19108374-19149290 | PLIN2 | 5.00948 | 5.11097 | 4.40447 |
| ENSG00000005243 | chr17:48026166-48038030 | COPZ2 | 4.66948 | 5.07214 | 3.75063 |
| ENSG00000104413 | chr8:94641073-94707466 | ESRP1* | 4.03037 | 4.46135 | 1.93086* |
| ENSG00000120915 | chr8:27490778-27545564 | EPHX2 | 3.72851 | 3.71745 | 2.76276 |
| ENSG00000111859 | chr6:11173451-11382348 | NEDD9 | 3.6817 | 3.84812 | 4.00797 |
| ENSG00000137673 | chr11:102520507-102530753 | MMP7 | 3.50457 | 5.20516 | 5.08387 |
| ENSG00000173227 | chr11:67006777-67050863 | SYT12 | 3.50038 | 4.70088 | 5.12623 |
| ENSG00000198715 | chr1:156282934-156295689 | C1orf85 | 2.91796 | 3.63491 | 2.78224 |
| ENSG00000184292 | chr1:58575422-58577773 | TACSTD2 | 2.40479 | 3.39011 | 2.11716 |
| ENSG00000182195 | chrX:141175744-141177125 | LDOC1 | 2.39325 | 3.44225 | 2.11582 |
| ENSG00000132530 | chr17:6755446-6776116 | XAF1 | 2.05745 | 2.16076 | 2.3786 |
| ENSG00000264230 | chr10:46369086-46537864 | ANXA8L1 | 1.77353 | 2.3488 | 2.32286 |
| ENSG00000279458 | chr10:46369086-46537864 | CH17-335B8.4 | 1.77353 | 2.3488 | 2.32286 |
| ENSG00000273225 | chr10:46369086-46537864 | FAM25BP | 1.77353 | 2.3488 | 2.32286 |
| N/A | chr10:46369086-46537864 | HNRNPA1P33 | 1.77353 | 2.3488 | 2.32286 |
| ENSG00000169129 | chr10:114294823-114404756 | AFAP1L2 | 1.66289 | 2.7914 | 2.49827 |
| ENSG00000159692 | chr4:1211447-1288291 | CTBP1* | −2.09237 | −2.83261 | −0.139063* |
| ENSG00000160179 | chr21:42199688-42297244 | ABCG1 | −1.94447 | −2.71968 | −3.46974 |
| ENSG00000139116 | chr12:39293227-39443390 | KIF21A | −3.46638 | −3.58121 | −3.12557 |
| ENSG00000252974 | chr12:39293227-39443390 | AC121334.1 | −3.46638 | −3.58121 | −3.12557 |
| ENSG00000108602 | chr17:19737681-19748943 | ALDH3A1 | −5.02499 | −4.20907 | −2.53341 |
Genes and differential expression that are not significant in the CtBP2_KD group.
Characterization of the differentially expressed genes of the Pinin-KD cells using Gene Set Enrichment Analysis (GSEA) demonstrated significant enrichment of gene sets in pathways for tumor necrosis factor alpha (TNFα) signaling mediated by transcription factor NFκB, interferon inflammation response, and DNA repair (Figure 4C and Supplementary Figure S3). The transcriptome of CtBP1-KD cells shares significant overlap of gene sets in the enriched pathways for Pinin-KD cells, suggesting that Pinin and CtBP1 are interacting for the similar cell function. The transcriptome of CtBP2-KD cells also had overlapping pathways with Pinin-KD cells. However, it appears that CtBP2 serves additional functions in G2M checkpoint and mitotic spindle, which are absent in both Pinin-KD and CtBP1-KD cells (Figure 4C).
In order to investigate the potential effects of gene knockdown on RNA alternative splicing or alternative transcription start site (TSS) selection, the RNA data was analyzed at transcript level. Supplementary Table S2 lists all the significant differentially expressed transcripts between control cells and the three knockdown groups. The Venn diagram (Figure 5A) shows that the number of genes with significant differentially expressed transcripts shared between Pinin-KD and CtBP1-KD cells (112) is similar to the number of genes shared between Pinin-KD and CtBP2-KD cells (98). There are 40 genes that are shared by all three knockdown groups for differentially expressed transcripts (Table 3). Most of the transcripts listed in Table 3 were significant in all of the three knockdown groups, and for the genes such as MMP7, INHBA, and HSPA1A with upregulated transcripts, these genes were also significantly upregulated at the gene level (Table 2). For the genes that had significantly downregulated transcripts, they either had a small number of alternatively spliced transcripts similar to the genes with upregulated transcripts, or the genes had moderate to larger number of transcript isoforms. One example for the genes with a small number of alternatively spliced transcripts is Secretory Leukocyte Peptidase Inhibitor (SLPI) (Figure 5B), whose gene product is a well-studied serum biomarker for ovarian cancer [31, 32]. The examples for the moderate to large number of alternative isoforms are FGFRL1 (Supplementary Figure S4) and CtBP1 (Supplementary Figure S5). The significant differentially expressed isoforms of all these genes were the same predominantly expressing protein-coding isoforms and therefore contributed to the changes of the total expression units of the genes in the knockdown groups, as defined by Fragments Per Kilobase of exon per Million fragments mapped (FPKM).
Figure 5. Analysis of RNA sequencing data at the transcript level identified significant transcript isoforms that could affect gene expression and gene function.
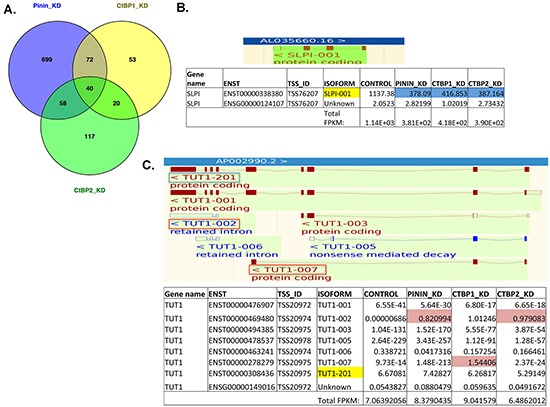
A. Venn diagram to show the overlap of differentially expressed isoforms among the three knockdown groups, B. the exon-intron structure of the known isoform (top) and the FPKM expression counts of the known and unknown isoforms of the gene SLPI in the different cell lines (bottom), and C. the exon-intron structure (top) and the FPKM expression counts of the different isoforms of the gene TUT1 in the different cell lines (bottom). For (B) and (C), the protein-coding isoforms are shown in brown, and the noncoding isoforms are shown in blue in the top panels. The discussed TUT1 isoforms are also bracketed in (C). In the bottom panels, the protein-coding isoforms are shaded in yellow, and the significantly upregulated isoforms are shaded in pink, downregulated isoforms are shaded in blue.
Table 3. Significant transcript isoforms that are differentially expressed between control and the Pinin_KD and CtBP_KD groups.
| Transcript Identifier | TSS_ID | Gene | Locus | Log2(fold_change) | ||
|---|---|---|---|---|---|---|
| Pinin_KD | CtBP1_KD | CtBP2_KD | ||||
| ENST00000469480 | TSS20974 | TUT1* | chr11:62559600-62592177 | 16.8671 | 17.1921* | 17.1437 |
| ENST00000242208 | TSS109160 | INHBA | chr7:41667167-41779388 | 3.65232 | 3.0042 | 3.92722 |
| ENST00000278742 | TSS19285 | ST14 | chr11:130159561-130210376 | 3.52693 | 4.14332 | 2.15435 |
| ENST00000260227 | TSS22249 | MMP7 | chr11:102520507-102530753 | 3.49994 | 5.19935 | 5.08377 |
| ENST00000608703 | TSS100382 | HSPA1A | chr6:31815463-31817946 | 2.76283 | 2.94962 | 1.57709 |
| ENST00000370526 | TSS124554 | LDOC1 | chrX:141175744-141177125 | 2.44441 | 3.33245 | 2.44022 |
| ENST00000371225 | TSS7656 | TACSTD2 | chr1:58575422-58577773 | 2.40479 | 3.39011 | 2.11716 |
| ENST00000375650 | TSS100383 | HSPA1B | chr6:31827734-31830255 | 2.34891 | 2.34832 | 1.32126 |
| ENST00000287590 | TSS69146 | B3GNT7 | chr2:231395542-231401164 | 2.33953 | 2.01437 | 1.81141 |
| ENST00000395748 | TSS89593 | AREG | chr4:74445133-74455009 | 2.31289 | 2.67371 | 1.52912 |
| ENST00000392452 | TSS88162 | MB21D2 | chr3:192796814-192918161 | 2.24372 | 1.72794 | 1.99704 |
| ENSG00000249306 | TSS96391 | LINC01411 | chr5:174336294-174532457 | 2.17866 | 1.8394 | 1.875 |
| ENST00000294435 | TSS376 | RBP7 | chr1:9997205-10016020 | 2.12295 | 2.34135 | 2.34447 |
| ENST00000304129 | TSS15105 | AFAP1L2 | chr10:114294823-114404756 | 1.81005 | 2.61546 | 2.61908 |
| ENST00000497571 | TSS13349 | KLF6 | chr10:3775995-3785281 | 1.69485 | 1.42906 | 1.1668 |
| ENST00000257836 | TSS16395 | PRRG4 | chr11:32829942-32858123 | 1.59563 | 1.50225 | 1.65308 |
| ENST00000309166 | TSS19897 | NRIP3 | chr11:8980575-9004049 | 1.54851 | 1.78921 | 1.35272 |
| ENST00000196371 | TSS97281 | OXCT1 | chr5:41730064-41872241 | 1.4849 | 1.77312 | 1.73092 |
| ENST00000263464 | TSS18533 | BIRC3 | chr11:102317449-102339403 | 1.3607 | 1.63618 | 1.60977 |
| ENST00000216117 | TSS79110 | HMOX1 | chr22:35380360-35394214 | 1.29473 | 1.85747 | −1.13128 |
| ENST00000368223 | TSS9315 | NES | chr1:156668762-156677397 | 1.23924 | 1.69318 | 2.23559 |
| ENST00000451311 | TSS120936 | TMSB4X* | chrX:12975107-12977227 | 1.11634 | 0.738397* | 0.588678* |
| ENST00000348367 | TSS15083 | GPAM | chr10:112149863-112215377 | 1.03841 | 1.37058 | 1.69528 |
| ENST00000339276 | TSS1000 | SFN | chr1:26863137-26864457 | 0.918878 | 0.989102 | 1.21727 |
| ENST00000449283 | TSS122506 | SPANXB2 | chrX:141002590-141003706 | −0.98586 | −1.07802 | −1.42392 |
| ENST00000369783 | TSS15002 | CALHM3 | chr10:103472803-103479240 | −1.17387 | −1.17278 | −1.97225 |
| ENST00000369409 | TSS3009 | PHGDH | chr1:119659797-119744215 | −1.46291 | −1.93556 | −3.10031 |
| ENST00000258829 | TSS35372 | NKX2-8 | chr14:36580578-36582607 | −1.58188 | −1.97299 | −1.65747 |
| ENST00000338380 | TSS76207 | SLPI | chr20:45252238-45254564 | −1.58891 | −1.42436 | −1.53095 |
| ENST00000264748 | TSS88471 | FGFRL1 | chr4:1009935-1026897 | −1.69614 | −1.08733 | −1.80221 |
| ENST00000358321 | TSS78736 | SUSD2 | chr22:24181258-24189110 | −1.71507 | −3.04531 | −2.35938 |
| ENSG00000234593 | TSS6195 | RP4-704D23.1 | chr1:14348954-14351023 | −1.92077 | −3.41104 | −2.25659 |
| ENST00000354666 | TSS102549 | ELOVL2 | chr6:10980758-11078226 | −2.14391 | −3.03229 | −1.70635 |
| ENST00000319211 | TSS94611 | F2R | chr5:76403248-76735781 | −2.17424 | −2.63607 | −1.23504 |
| ENST00000555004 | TSS34229 | C14orf132 | chr14:96039323-96094080 | −2.41648 | −2.55822 | −1.39087 |
| ENST00000217939 | TSS122913 | MXRA5 | chrX:3308564-3346641 | −4.14304 | −2.25727 | −1.66432 |
| ENSG00000234626 | TSS80398 | RP1-149A16.12 | chr22:32327170-32343105 | −4.31484 | −2.81994 | −2.53571 |
| ENST00000439647 | TSS84273 | AP2M1* | chr3:184134018-184684758 | −15.7981 | 0.015061* | −0.84884* |
| ENST00000503081 | TSS99619 | GNB2L1* | chr5:181236908-181272307 | −66.6096 | −0.601417* | −25.4927 |
| ENST00000523108 | TSS99522 | MGAT4B* | chr5:179797596-179907859 | −167.305 | 0.813388* | −89.4254 |
Genes and expression changes that are not from the same ENST isoforms.
In Table 3, there were also genes such as AP2M1, GNB2L1, and MGAT4B that had significantly downregulated isoforms not shared by all the knockdown groups. As illustrated by MGAT4B in Supplementary Figure S6, these genes had a very large number of isoforms, and the significantly altered isoforms were not the predominantly expressing protein-coding isoforms and did not affect the total FPKM expression of the genes. On the other hand, for the gene encoding nucleotidyl transferase terminal uridylyl transferase 1 (TUT1) that had the isoform (TUT1-002) with the highest differential fold-change in the knockdown groups (Table 3), this isoform and the other isoform that was significantly upregulated in CtBP1-KD cells, TUT1-007, were also not the major protein-coding transcript, which was TUT1-201 (Figure 5C). However, isoform TUT1-002 is a noncoding transcript with intron retention, and isoform TUT1-007 encodes a peptide sequence only for the first 165 amino acids of the wild-type gene product, which lacks a PAP/25A-associated domain important for polynucleotide adenylyltransferase activity. Hence, both of these two upregulated isoforms appear to be nonfunctional and would significantly contribute to the increase of the nonfunctional isoform pool (Figure 5C), which might negatively affect the function of the gene.
DISCUSSION
One characteristic of ovarian tumors is that they express many epithelial proteins [2–5]. Ectopic expression of E-cadherin, an epithelial marker, in normal ovarian surface epithelial cells caused mesenchymal-epithelial transition (MET) in vitro and tumor formation in a mouse model [8, 9]. The epithelial phenotype of ovarian tumors facilitates the activation of PI3K/AKT [10] and EGFR [11] pathways for tumor growth and survival and also for the invasion into local tissues via collective cell movement [12, 13]. Pinin has shown its importance in maintaining epithelial cell identity. Pinin depletion caused apoptosis and reduced survival of cells in vitro [27] and conditional knockout of Pinin caused defects in mouse corneal epithelial cell differentiation [25] and intestine morphogenesis [33]. In our study, we showed strong expression of Pinin in many ovarian tumors and ovarian cancer cell lines. Knockdown of Pinin expression in ovarian cancer cells resulted in significant reduction in cell adhesion, anchorage-independent growth, and increased sensitivity to the chemotherapeutic agent Paclitaxel. The results of the functional studies collectively indicated that Pinin, resembling other epithelial markers such as E-cadherin [8, 9], is important in ovarian tumorigenesis and progression.
Our characterization also indicates that Pinin interacts with both human CtBP1 and CtBP2 proteins in the nuclei of ovarian cancer cells. Interestingly, we observed that CtBP2 was absent in the mitotic cells, while Pinin was still present in the cytosol (Figure 2A). It is likely that CtBP2 expression is cell cycle-regulated and is related to its additional function in G2/M checkpoint and spindle regulation, as suggested by the GSEA analysis of the RNA sequencing data (Figure 4C). Another finding about the interaction between Pinin and CtBP proteins is that Pinin levels were reduced in both CtBP1-KD and CtBP2-KD cancer cells. In contrary, only CtBP1 expression, not CtBP2 expression, was declined in the Pinin-KD cells. This was confirmed in the RNA-sequencing analysis, which clearly demonstrated that the major protein-coding isoform and the total RNA expression of the gene were suppressed in the Pinin-KD cells (Supplementary Figure S5). The mutual suppression of the first gene's expression in the second gene's knockdown cell lines between Pinin and CtBP1 suggests the existence of a feedback loop in regulating one another's expression. Besides co-localization and mutual regulation of each other's expression, the intimate relationship between Pinin and CtBP1 is also reflected in the larger number of co-regulated genes (Figure 4B) and overlapping enriched gene sets (Figure 4C) between Pinin-KD and CtBP1-KD cell lines than between Pinin-KD and CtBP2-KD cell lines. The most significant pathways enriched in Pinin-KD and CtBP1-KD cells include the canonical NFκB signaling pathway induced by TNFα and interferon response pathway. It is well known that these two conserved cytokine pathways are involved in the response of innate immunity to inflammation caused by physiological and oxidative stress, while chronic inflammation is pro-tumorigenic and NFκB is constitutively activated in many types of cancer to upregulate anti-apoptotic genes [34–36]. In combination with the DNA repair pathway, the enrichment of the differentially expressed genes in inflammation pathways might indicate the stress response of the cancer cells to gene knockdown. These survival response pathways were also enriched in the CtBP2-KD cells. However, as stated before, CtBP2 knockdown also provoked a response to cell cycle perturbation (Figure 4C).
Deregulated RNA metabolic mechanisms, especially in RNA splicing, are underappreciated in the field of cancer research. However, there is increasing evidence to support the notion that deregulations in RNA metabolism are associated with cancer development and its phenotypes [37–39]. By examining the global adenosine-to-inosine RNA editing profiles of 6,236 patients samples from the Cancer Genome Atlas, Han et al. identified myriad clinically relevant altered RNA-editing events, many of which are in the noncoding regions, that can affect cell viability and drug sensitivity [39]. In a study to look up subtype-specific differentially spliced genes and splicing isoforms, Eswaran et al. have revealed RNA splicing signatures for triple-negative breast cancer (TNBC), non-TNBC, and HER2-positive breast cancer [38]. In another breast cancer study to employ a Bayesian model to characterize hundreds of deregulated alternative splicing events mediated by the splicing factor SRSF1 that is overexpressed in this cancer type, Ancuzuków et al. reported the positional effects of SRSF1 binding on cassette exons on the splicing results [37]. To this end, Pinin has been implicated in alternative pre-mRNA splicing [28, 29], and a Pinin loss of function study has shown the alternative splicing patterns of SRSF1 [27].
In our analysis of the RNA sequencing data for Pinin-KD cancer cells, significant aberrations of RNA processing were found. Although the RNA sequencing methodology we used was not intended to look at noncoding RNAs in ovarian cancer cells, we found significant representation of poly(A)-tailed noncoding RNAs such as lincRNAs and pre-miRNAs in the significantly altered gene list (Table 2). There are also significant changes of splicing variants in the knockdown groups (Figure 5 and Supplementary Figures S4 and S6). Given the intimate interactions between Pinin and CtBP proteins, it is not surprising that the RNA processing aberrations were also observed in CtBP1-KD and CtBP2-KD cancer cells. In order to explore the function of Pinin and CtBP proteins on RNA alternative splicing, we primarily examined the significantly altered gene expression and RNA isoforms in all three knockdown cell lines. For most of the differentially expressed genes, the altered isoforms are the predominantly expressing protein-coding transcripts and their changes affect the ultimate expression of the target genes, which might reflect the direct effects of Pinin and CtBP proteins on gene transcription. However, there are also genes like AP2M1, GNB2L1, and MGAT4B that are associated with significantly downregulated isoforms, and some genes such as CD44, CTNND1, and ENAH whose alternative splicing forms have previously been described to associate with Pinin defects [29], the common feature of these genes is that they produce a large number of splicing variants, and the altered isoforms are not the predominantly expressing protein-coding transcripts. More validation studies are required to determine whether these altered splicing variants are only spurious RNAs or they have specific meaning on gene function.
Another outcome of this comprehensive analysis of the whole alternative splicing transcriptomes in Pinin-KD and CtBP-KD cells is that we identified significant changes in some genes that have been associated with RNA processing mechanisms. One gene was ESRP1, which has been found to be associated with Pinin in a previous study [29] and whose expression was significantly upregulated in Pinin-KD and CtBP1-KD cancer cells in the present study (Table 2). A new RNA-processing gene identified in this study was TUT1 (Table 3 and Figure 5C). TUT1 is a nucleotidyl transferase that functions as a terminal uridylyltransferase for small nuclear RNAs (snRNAs) such as U6 snRNA [40], and as a poly(A) polymerase that creates and cleaves the 3′-poly(A) tail of specific mRNA [41, 42], and recent studies have shown that TUT1 is a global regulator of miRNA abundance [43, 44] and regulates cell proliferation and other cell functions. In our in-silico analysis, we identified interesting overexpressing isoforms for this gene in the knockdown cell lines, which either encodes a noncoding transcript with intron retention (TUT1-002), or an N-terminal coding transcript (TUT1-007) that contains the RNA-binding RNA Recognition Motif (RRM) domain but lacks the PAP/25A-associated domain important for polynucleotide adenylyltransferase activity (Figure 5C). As these two RNA isoforms are the highest significantly expressing isoforms in the knockdown cancer cell lines (Table 3), it would be of great interest to determine whether an overexpression of these nonfunctional transcripts in the transcript pool would significantly affect gene function and cell phenotype.
In summary, we have shown significant overexpression of Pinin in ovarian tumors and its function in cell adhesion, clonogenicity, and drug response. Pinin is an important regulator in epithelial cell identity. As a recent article shows the function of CtBP2 in epigenetic reprogramming of cells for lineage commitment [45] and the serous subtype expressed a higher level of Pinin than the mucinous subtype of ovarian tumors in our study (Table 1), Pinin and CtBP proteins may interact with each other to regulate proliferation and local invasion of epithelial ovarian cancer cells and histologic lineage differentiation. In addition, our whole transcriptomic analysis of Pinin and CtBP knockdown cancer cells provides the first comprehensive portrait of significant transcriptional and splicing variants. It would be of paramount importance to study the myriad interactions among the RNA processing or editing proteins such as Pinin, CtBP, ESRP1, SRSF1, and TUT1, and identify and validate the key altered RNA isoforms resulted from the interactions and their impacts on the functions of ovarian cancer cells.
MATERIALS AND METHODS
Clinical specimens and ovarian cell lines
Archived specimens were obtained from patients with an IRB approved protocol at Brigham and Women's Hospital in Boston. All the surgical specimens were collected with patient consents. The immortalized normal human ovarian surface epithelial (HOSE) cell lines and ovarian cancer cell lines have been described before [46]. They were maintained in medium 199 and MCDB 105 (Sigma-Aldrich, Natick, MA, USA) (1:1) supplemented with 10% FCS.
Immunohistochemistry
Immunohistochemistry (IHC) was performed on a panel of 74 archived formalin-fixed, paraffin-embedded tissues, including 8 normal ovarian tissues and 66 benign, borderline, and malignant ovarian tumors. Standard xylene deparaffinization, rehydration with a descending series of ethanol solutions, antigen retrieval (Vector Laboratories, Burlingame, CA), and blocking of endogenous peroxidases in 0.3% H2O2 were performed. The mouse anti-Pinin monoclonal antibody has been described before [22]. 3, 3 –diaminobenzidine (DAB) horseradish peroxidase substrate kit was used for color development (Vector Laboratories, Burlingame, CA). Staining was graded semiquantitatively by multiplying the proportion of the stained epithelial area (from 0 for absence to 3 for more than 95% of the total epithelial area) with the intensity of the stain (from 0 for negative staining to 3 for strongly positive staining).
Establishment of ovarian cancer cell lines with respective knockdown (KD) of expression of Pinin, CtBP1, or CtBP2, and subsequent functional assays
Mission™ lentiviral gene-targeting and non-target control lentiviral shRNA constructs were purchased from Sigma-Aldrich (Natick, MA, USA) and the production of transduction particles and infection of SKOV3-IPLuc ovarian cancer cells were performed according to manufacturer's protocol. The CtBP2 knockdown cancer cell line has been described previously [14]. The TRC numbers for the knockdown of CtBP1 and Pinin are: TRCN0000013738 for CtBP1 and TRCN0000072278, TRCN0000072279, and TRCN0000072280 for Pinin. Knockdown of gene expression in the resultant cell lines was confirmed by Western blot analysis.
Cell growth study was performed using methylthiazol tetrazolium (MTT) solution (5 mg/mL in PBS, Sigma-Aldrich, Natick, MA). Absorbance at 562 nm was determined on an ELx800 absorbance microplate reader (Bio-Tek, Winooski, VT). Cell adhesion assay was performed using the cell adhesion strips from Millicoat™ Screen kit ECM205 (EMD Millipore, Billerica, MA). For the experiment, 1×10⁴ cells were seeded to the strip wells and allowed to incubate for 1 hour. Nonadherent cells were washed away by phosphate buffered saline and the attached cells were stained using 0.2% crystal violet. The stain was solubilized in a 50:50 mixture of 0.1M NaH2PO, pH 4.5 and 50% ethanol and read at 562 nm.
For soft agar colony formation assay, 104 single cells in medium were mixed with equal volume of pre-warmed 0.66% SeaPlaque™ agarose (Lonza, Allendale, NJ) and poured over a 0.5% agarose layer in wells of a six-well plate. After about 21 days, cell colonies were fixed with 10% methanol and 1% acetic acid and stained with 0.005% crystal violet (Sigma-Aldrich, Natick, MA) and counted using a dissecting microscope. Cellular sensitivity to Paclitaxel (Sigma-Aldrich, Natick, MA) was measured by treating the cells to the drugs for 48 hours and cell survival was estimated using MTT assays. All the functional assays were performed in triplicates and repeated twice.
Immunofluorescence microscopy and co-immunoprecipitation assay
Wild-type SKOV3-IPLuc ovarian cancer cells were fixed in 4% paraformaldehyde (Sigma-Aldrich, Natick, MA) and permeabilized using 0.5% Triton X-100. After blocking with 10% fetal bovine serum (Thermo Fisher Scientific, Waltham, MA), mouse monoclonal antibodies targeting CtBP1 or CtBP2 proteins (BD Biosciences, San Jose, CA) and a rabbit antibody targeting Pinin (Bethyl Laboratories, Montgomery, TX) were added and incubated for 2 hours. Alexa Fluor 647-conjugated anti-mouse and Alexa Fluor 546-conjugated anti-rabbit secondary antibodies (Thermo Fisher Scientific, Waltham, MA) were used to stain Pinin and the CtBP proteins, respectively. The stained cells were counterstained with DAPI (Thermo Fisher Scientific, Waltham, MA). Microscopic images were captured by a Leica DM IRE2 fluorescence microscope (Leica Microsystems, Bannockburn, IL) and analyzed by the OpenLab Cell Imaging System software (Leica Microsystems, Bannockburn, IL).
For preparing cell extracts enriched with nuclear proteins for Co-immunoprecipitation assays, cells were lysed by undergoing three freeze/thaw cycles in 200μl of Buffer A (200mM Tris, pH8.0, 0.3M KCl, 5mM MgCl2, 0.1% Tween 20, 10% glycerol, 10mM mercaptoethanol, and 0.2mM of phenylmethylsulfonyl fluoride) and on ice for 30 min. 400μl of Buffer B (same ingredients as Buffer A except for the absence of KCl) were added and the mixture was centrifuged at 16,000 rpm for 30 min. Equal amounts of the cell extracts were incubated overnight with the CtBP1 and CtBP2 antibodies (BD Biosciences, San Jose, CA), and control mouse IgG, respectively. The immune complex was captured by protein A/G immobilized on agarose beads (Thermo Fisher Scientific, Waltham, MA). After extensive washes, the immune complex proteins were fractionated by standard SDS-PAGE, transferred to PVDF membrane (Thermo Fisher Scientific, Waltham, MA) and analyzed by Western blot.
Next-generation RNA sequencing and data analysis
Total RNA was extracted from the ten ovarian cancer cell lines using TRIzol reagent (Thermo Fisher Scientific, Waltham, MA). For cDNA library preparation, 500ng of total RNA with 260/280 OD greater than 1.8 were processed with KAPA Stranded mRNA-Seq Kit from Kapa Biosystems (Wilmington, MA) for mRNA purification and fragmentation, A-tailing, adapter ligation, and library amplification. During the adapter ligation step, 0.6μM NEXTflex™ RNA-Seq Barcode adaptors with different indexes (Bioo Scientific, Austin, TX) were ligated to the samples to provide unique barcodes for each of the ten libraries for multiplex sequencing. The amplified libraries were cleaned up using Agencourt AMPure XP beads (Beckman Coulter, Indianapolis, IN) and eluted in 20μL of 10 mM Tris buffer, pH 8. The quality of the libraries was tested on an Agilent 2100 Bioanalyzer (Agilent Technologies, Santa Clara, CA) and the concentrations of the libraries were determined by qPCR using KAPA Library Quantification Kit (Kapa Biosystems, Wilmington, MA). Ten libraries were pooled together to give a final library concentration of 17.7nM and a 50-bp paired-end sequencing run was performed on an Illumina HiSeq-2500 instrument (Illumina, San Diego, CA) in High-Output mode.
For the bioinformatics, HiSeq FASTQ data together with QC files were analyzed to ensure that no run-related problems occurred. Clean, adaptor-trimmed reads were aligned onto the human genome GRCh38 (accession GCA_000001405.15) using STAR v2.4.1b [47], a spliced aligner for RNA-seq reads. Transcriptome assembly and differential expression testing was performed using Cufflinks v2.2.1 [48]. Significant genes and transcripts were identified based on p < 0.05, as described by Eswaran et al. [49]. GENCODE v21 was used as the known transcript annotation database. The mask file for the tRNA, rRNA, and mitochondrial genes were generated using UCSC Table Browser. Fragments per kilobase of exon per million fragments mapped (FPKM) was employed as the RNA-sequencing expression unit for different transcript isoforms and for gene expression comparison. GSEA and Molecular Signature Database (MSigDB) v5.0 [50] were used for gene set enrichment analysis and heatmap generation. The GenePattern [51] module Read_group_trackingToGct v0.15 was used to convert the sequencing fragment counts of the genes from the transcriptome assembly into a file format suitable for input to GSEA. Venn diagrams were drawn using VENNY v2.0 (http://bioinfogp.cnb.csic.es/tools/venny/).
Statistical analysis
All calculations were performed with MINITAB statistical software (Minitab, State College, PA) unless otherwise indicated. ANOVA with post hoc Tukey's multiple comparisons test was used to determine any significant differences of immunohistochemistry scores between groups. For the functional assays, significance of differences was determined using 2-tailed T-Test, with P-value less than 0.05 was considered statistically significant.
SUPPLEMENTARY FIGURES AND TABLES
Acknowledgments
We acknowledge the support of the Robert and Deborah First Fund, the Sperling Family Fund Foundation, Ruth N. White Gynecologic Oncology Research Fund, Women's Cancer Program and Gillette Center for Women's Cancer from Dana-Farber Cancer Institute, Ovarian Cancer Research Foundation, Adler Foundation, Inc., and Friends of Dana Farber Cancer Institute to The Laboratory of Gynecologic Oncology at Brigham and Women's Hospital. Y. Z. was supported by a scholarship from the China Scholarship Council and Tongji Hospital, Wuhan, China.
Footnotes
CONFLICTS OF INTEREST
The authors have no potential conflicts of interest to disclose.
REFERENCES
- 1.Howlader N, Noone AM, Krapcho M, Garshell J, Miller D, Altekruse SF, Kosary CL, Yu M, Ruhl J, Tatalovich Z, Mariotto A, Lewis DR, Chen HS, Feuer EJ, Cronin KA. SEER Cancer Statistics Review, 1975-2012. National Cancer Institute; Bethesda, MD: 2015. [Google Scholar]
- 2.Feeley KM, Wells M. Precursor lesions of ovarian epithelial malignancy. Histopathology. 2001;38:87–95. doi: 10.1046/j.1365-2559.2001.01042.x. [DOI] [PubMed] [Google Scholar]
- 3.Auersperg N, Maines-Bandiera SL, Dyck HG. Ovarian carcinogenesis and the biology of ovarian surface epithelium. J Cell Physiol. 1997;173:261–265. doi: 10.1002/(SICI)1097-4652(199711)173:2<261::AID-JCP32>3.0.CO;2-G. [DOI] [PubMed] [Google Scholar]
- 4.Drapkin R, Crum CP, Hecht JL. Expression of candidate tumor markers in ovarian carcinoma and benign ovary: evidence for a link between epithelial phenotype and neoplasia. Hum Pathol. 2004;35:1014–1021. doi: 10.1016/j.humpath.2004.04.014. [DOI] [PubMed] [Google Scholar]
- 5.Pietzner K, Woopen H, Richter R, Joens T, Braicu EI, Dimitrova D, Mellstedt H, Darb-Esfahani S, Denkert C, Lindhofer H, Fotopoulou C, Sehouli J. Expression of epithelial cell adhesion molecule in paired tumor samples of patients with primary and recurrent serous ovarian cancer. Int J Gynecol Cancer. 2013;23:797–802. doi: 10.1097/IGC.0b013e3182929056. [DOI] [PubMed] [Google Scholar]
- 6.Sundfeldt K, Piontkewitz Y, Ivarsson K, Nilsson O, Hellberg P, Brannstrom M, Janson PO, Enerback S, Hedin L. E-cadherin expression in human epithelial ovarian cancer and normal ovary. Int J Cancer. 1997;74:275–280. doi: 10.1002/(sici)1097-0215(19970620)74:3<275::aid-ijc7>3.0.co;2-w. [DOI] [PubMed] [Google Scholar]
- 7.Matsumura N, Huang Z, Mori S, Baba T, Fujii S, Konishi I, Iversen ES, Berchuck A, Murphy SK. Epigenetic suppression of the TGF-beta pathway revealed by transcriptome profiling in ovarian cancer. Genome Res. 2011;21:74–82. doi: 10.1101/gr.108803.110. [DOI] [PMC free article] [PubMed] [Google Scholar]
- 8.Auersperg N, Pan J, Grove BD, Peterson T, Fisher J, Maines-Bandiera S, Somasiri A, Roskelley CD. E-cadherin induces mesenchymal-to-epithelial transition in human ovarian surface epithelium. Proc Natl Acad Sci U S A. 1999;96:6249–6254. doi: 10.1073/pnas.96.11.6249. [DOI] [PMC free article] [PubMed] [Google Scholar]
- 9.Ong A, Maines-Bandiera SL, Roskelley CD, Auersperg N. An ovarian adenocarcinoma line derived from SV40/E-cadherin-transfected normal human ovarian surface epithelium. Int J Cancer. 2000;85:430–437. [PubMed] [Google Scholar]
- 10.De Santis G, Miotti S, Mazzi M, Canevari S, Tomassetti A. E-cadherin directly contributes to PI3K/AKT activation by engaging the PI3K-p85 regulatory subunit to adherens junctions of ovarian carcinoma cells. Oncogene. 2009;28:1206–1217. doi: 10.1038/onc.2008.470. [DOI] [PubMed] [Google Scholar]
- 11.Shen X, Kramer RH. Adhesion-mediated squamous cell carcinoma survival through ligand-independent activation of epidermal growth factor receptor. Am J Pathol. 2004;165:1315–1329. doi: 10.1016/S0002-9440(10)63390-1. [DOI] [PMC free article] [PubMed] [Google Scholar]
- 12.Friedl P, Gilmour D. Collective cell migration in morphogenesis, regeneration and cancer. Nat Rev Mol Cell Biol. 2009;10:445–457. doi: 10.1038/nrm2720. [DOI] [PubMed] [Google Scholar]
- 13.Friedl P, Locker J, Sahai E, Segall JE. Classifying collective cancer cell invasion. Nat Cell Biol. 2012;14:777–783. doi: 10.1038/ncb2548. [DOI] [PubMed] [Google Scholar]
- 14.Barroilhet L, Yang J, Hasselblatt K, Paranal RM, Ng SK, Rauh-Hain JA, Welch WR, Bradner JE, Berkowitz RS, Ng SW. C-terminal binding protein-2 regulates response of epithelial ovarian cancer cells to histone deacetylase inhibitors. Oncogene. 2013;32:3896–3903. doi: 10.1038/onc.2012.380. [DOI] [PubMed] [Google Scholar]
- 15.Tang L, Yang J, Ng SK, Rodriguez N, Choi PW, Vitonis A, Wang K, McLachlan GJ, Caiazzo RJ, Jr, Liu BC, Welch WR, Cramer DW, Berkowitz RS, Ng SW. Autoantibody profiling to identify biomarkers of key pathogenic pathways in mucinous ovarian cancer. Eur J Cancer. 2010;46:170–179. doi: 10.1016/j.ejca.2009.10.003. [DOI] [PMC free article] [PubMed] [Google Scholar]
- 16.May T, Yang J, Shoni M, Liu S, He H, Gali R, Ng SK, Crum C, Berkowitz RS, Ng SW. BRCA1 expression is epigenetically repressed in sporadic ovarian cancer cells by overexpression of C-terminal binding protein 2. Neoplasia. 2013;15:600–608. doi: 10.1593/neo.121674. [DOI] [PMC free article] [PubMed] [Google Scholar]
- 17.Boyd JM, Subramanian T, Schaeper U, La Regina M, Bayley S, Chinnadurai G. A region in the C-terminus of adenovirus 2/5 E1a protein is required for association with a cellular phosphoprotein and important for the negative modulation of T24-ras mediated transformation, tumorigenesis and metastasis. EMBO J. 1993;12:469–478. doi: 10.1002/j.1460-2075.1993.tb05679.x. [DOI] [PMC free article] [PubMed] [Google Scholar]
- 18.Schaeper U, Boyd JM, Verma S, Uhlmann E, Subramanian T, Chinnadurai G. Molecular cloning and characterization of a cellular phosphoprotein that interacts with a conserved C-terminal domain of adenovirus E1A involved in negative modulation of oncogenic transformation. Proc Natl Acad Sci U S A. 1995;92:10467–10471. doi: 10.1073/pnas.92.23.10467. [DOI] [PMC free article] [PubMed] [Google Scholar]
- 19.Hildebrand JD, Soriano P. Overlapping and unique roles for C-terminal binding protein 1 (CtBP1) and CtBP2 during mouse development. Mol Cell Biol. 2002;22:5296–5307. doi: 10.1128/MCB.22.15.5296-5307.2002. [DOI] [PMC free article] [PubMed] [Google Scholar]
- 20.Bergman LM, Blaydes JP. C-terminal binding proteins: emerging roles in cell survival and tumorigenesis. Apoptosis. 2006;11:879–888. doi: 10.1007/s10495-006-6651-4. [DOI] [PubMed] [Google Scholar]
- 21.Bergman LM, Birts CN, Darley M, Gabrielli B, Blaydes JP. CtBPs promote cell survival through the maintenance of mitotic fidelity. Mol Cell Biol. 2009;29:4539–4551. doi: 10.1128/MCB.00439-09. [DOI] [PMC free article] [PubMed] [Google Scholar]
- 22.Alpatov R, Munguba GC, Caton P, Joo JH, Shi Y, Hunt ME, Sugrue SP. Nuclear speckle-associated protein Pnn/DRS binds to the transcriptional corepressor CtBP and relieves CtBP-mediated repression of the E-cadherin gene. Mol Cell Biol. 2004;24:10223–10235. doi: 10.1128/MCB.24.23.10223-10235.2004. [DOI] [PMC free article] [PubMed] [Google Scholar]
- 23.Ouyang P, Sugrue SP. Characterization of pinin, a novel protein associated with the desmosome-intermediate filament complex. J Cell Biol. 1996;135:1027–1042. doi: 10.1083/jcb.135.4.1027. [DOI] [PMC free article] [PubMed] [Google Scholar]
- 24.Ouyang P. Antibodies differentiate desmosome-form and nucleus-form pinin: evidence that pinin is a moonlighting protein with dual location at the desmosome and within the nucleus. Biochem Biophys Res Commun. 1999;263:192–200. doi: 10.1006/bbrc.1999.1353. [DOI] [PubMed] [Google Scholar]
- 25.Joo JH, Kim YH, Dunn NW, Sugrue SP. Disruption of mouse corneal epithelial differentiation by conditional inactivation of pnn. Invest Ophthalmol Vis Sci. 2010;51:1927–1934. doi: 10.1167/iovs.09-4591. [DOI] [PMC free article] [PubMed] [Google Scholar]
- 26.Wu HP, Hsu SY, Wu WA, Hu JW, Ouyang P. Transgenic mice expressing mutant Pinin exhibit muscular dystrophy, nebulin deficiency and elevated expression of slow-type muscle fiber genes. Biochem Biophys Res Commun. 2014;443:313–320. doi: 10.1016/j.bbrc.2013.11.108. [DOI] [PubMed] [Google Scholar]
- 27.Leu S, Lin YM, Wu CH, Ouyang P. Loss of Pnn expression results in mouse early embryonic lethality and cellular apoptosis through SRSF1-mediated alternative expression of Bcl-xS and ICAD. J Cell Sci. 2012;125:3164–3172. doi: 10.1242/jcs.100859. [DOI] [PubMed] [Google Scholar]
- 28.Wang P, Lou PJ, Leu S, Ouyang P. Modulation of alternative pre-mRNA splicing in vivo by pinin. Biochem Biophys Res Commun. 2002;294:448–455. doi: 10.1016/S0006-291X(02)00495-3. [DOI] [PubMed] [Google Scholar]
- 29.Joo JH, Correia GP, Li JL, Lopez MC, Baker HV, Sugrue SP. Transcriptomic analysis of PNN- and ESRP1-regulated alternative pre-mRNA splicing in human corneal epithelial cells. Invest Ophthalmol Vis Sci. 2013;54:697–707. doi: 10.1167/iovs.12-10695. [DOI] [PMC free article] [PubMed] [Google Scholar]
- 30.Alpatov R, Shi Y, Munguba GC, Moghimi B, Joo JH, Bungert J, Sugrue SP. Corepressor CtBP and nuclear speckle protein Pnn/DRS differentially modulate transcription and splicing of the E-cadherin gene. Mol Cell Biol. 2008;28:1584–1595. doi: 10.1128/MCB.00421-07. [DOI] [PMC free article] [PubMed] [Google Scholar]
- 31.Carlson AM, Maurer MJ, Goergen KM, Kalli KR, Erskine CL, Behrens MD, Knutson KL, Block MS. Utility of progranulin and serum leukocyte protease inhibitor as diagnostic and prognostic biomarkers in ovarian cancer. Cancer Epidemiol Biomarkers Prev. 2013;22:1730–1735. doi: 10.1158/1055-9965.EPI-12-1368. [DOI] [PMC free article] [PubMed] [Google Scholar]
- 32.Timms JF, Arslan-Low E, Kabir M, Worthington J, Camuzeaux S, Sinclair J, Szaub J, Afrough B, Podust VN, Fourkala EO, Cubizolles M, Kronenberg F, Fung ET, Gentry-Maharaj A, Menon U, Jacobs I. Discovery of serum biomarkers of ovarian cancer using complementary proteomic profiling strategies. Proteomics Clin Appl. 2014;8:982–993. doi: 10.1002/prca.201400063. [DOI] [PMC free article] [PubMed] [Google Scholar]
- 33.Joo JH, Taxter TJ, Munguba GC, Kim YH, Dhaduvai K, Dunn NW, Degan WJ, Oh SP, Sugrue SP. Pinin modulates expression of an intestinal homeobox gene, Cdx2, and plays an essential role for small intestinal morphogenesis. Dev Biol. 2010;345:191–203. doi: 10.1016/j.ydbio.2010.07.009. [DOI] [PMC free article] [PubMed] [Google Scholar]
- 34.Hoesel B, Schmid JA. The complexity of NF-kappaB signaling in inflammation and cancer. Mol Cancer. 2013;12:86. doi: 10.1186/1476-4598-12-86. [DOI] [PMC free article] [PubMed] [Google Scholar]
- 35.Karin M. NF-kappaB as a critical link between inflammation and cancer. Cold Spring Harb Perspect Biol. 2009;1:a000141. doi: 10.1101/cshperspect.a000141. [DOI] [PMC free article] [PubMed] [Google Scholar]
- 36.Zaidi MR, Merlino G. The two faces of interferon-gamma in cancer. Clin Cancer Res. 2011;17:6118–6124. doi: 10.1158/1078-0432.CCR-11-0482. [DOI] [PMC free article] [PubMed] [Google Scholar]
- 37.Anczukow O, Akerman M, Clery A, Wu J, Shen C, Shirole NH, Raimer A, Sun S, Jensen MA, Hua Y, Allain FH, Krainer AR. SRSF1-Regulated Alternative Splicing in Breast Cancer. Mol Cell. 2015;60:105–117. doi: 10.1016/j.molcel.2015.09.005. [DOI] [PMC free article] [PubMed] [Google Scholar]
- 38.Eswaran J, Horvath A, Godbole S, Reddy SD, Mudvari P, Ohshiro K, Cyanam D, Nair S, Fuqua SA, Polyak K, Florea LD, Kumar R. RNA sequencing of cancer reveals novel splicing alterations. Sci Rep. 2013;3:1689. doi: 10.1038/srep01689. [DOI] [PMC free article] [PubMed] [Google Scholar]
- 39.Han L, Diao L, Yu S, Xu X, Li J, Zhang R, Yang Y, Wemer HMJ, Eterovic AK, Yuan Y, Li J, Nair N, Minelli R, Tsang YH, Cheung LWT, Jeong KJ, et al. The genomic landscape and clinical relevance of A-to-I RNA editing in human cancers. Cancer Cell. 2015 doi: 10.1016/j.ccell.2015.08.013. in press. [DOI] [PMC free article] [PubMed] [Google Scholar]
- 40.Trippe R, Guschina E, Hossbach M, Urlaub H, Luhrmann R, Benecke BJ. Identification, cloning, and functional analysis of the human U6 snRNA-specific terminal uridylyl transferase. RNA. 2006;12:1494–1504. doi: 10.1261/rna.87706. [DOI] [PMC free article] [PubMed] [Google Scholar]
- 41.Laishram RS, Anderson RA. The poly A polymerase Star-PAP controls 3′-end cleavage by promoting CPSF interaction and specificity toward the pre-mRNA. EMBO J. 2010;29:4132–4145. doi: 10.1038/emboj.2010.287. [DOI] [PMC free article] [PubMed] [Google Scholar]
- 42.Mellman DL, Gonzales ML, Song C, Barlow CA, Wang P, Kendziorski C, Anderson RA. A PtdIns4,5P2-regulated nuclear poly(A) polymerase controls expression of select mRNAs. Nature. 2008;451:1013–1017. doi: 10.1038/nature06666. [DOI] [PubMed] [Google Scholar]
- 43.Knouf EC, Wyman SK, Tewari M. The human TUT1 nucleotidyl transferase as a global regulator of microRNA abundance. PLoS One. 2013;8:e69630. doi: 10.1371/journal.pone.0069630. [DOI] [PMC free article] [PubMed] [Google Scholar]
- 44.Wyman SK, Knouf EC, Parkin RK, Fritz BR, Lin DW, Dennis LM, Krouse MA, Webster PJ, Tewari M. Post-transcriptional generation of miRNA variants by multiple nucleotidyl transferases contributes to miRNA transcriptome complexity. Genome Res. 2011;21:1450–1461. doi: 10.1101/gr.118059.110. [DOI] [PMC free article] [PubMed] [Google Scholar]
- 45.Kim TW, Kang BH, Jang H, Kwak S, Shin J, Kim H, Lee SE, Lee SM, Lee JH, Kim JH, Kim SY, Cho EJ, Kim JH, Park KS, Che JH, Han DW, et al. Ctbp2 Modulates NuRD-Mediated Deacetylation of H3K27 and Facilitates PRC2-Mediated H3K27me3 in Active Embryonic Stem Cell Genes During Exit from Pluripotency. Stem Cells. 2015;33:2442–2455. doi: 10.1002/stem.2046. [DOI] [PubMed] [Google Scholar]
- 46.Huang KC, Park DC, Ng SK, Lee JY, Ni X, Ng WC, Bandera CA, Welch WR, Berkowitz RS, Mok SC, Ng SW. Selenium binding protein 1 in ovarian cancer. Int J Cancer. 2006;118:2433–2440. doi: 10.1002/ijc.21671. [DOI] [PubMed] [Google Scholar]
- 47.Dobin A, Davis CA, Schlesinger F, Drenkow J, Zaleski C, Jha S, Batut P, Chaisson M, Gingeras TR. STAR: ultrafast universal RNA-seq aligner. Bioinformatics. 2013;29:15–21. doi: 10.1093/bioinformatics/bts635. [DOI] [PMC free article] [PubMed] [Google Scholar]
- 48.Trapnell C, Roberts A, Goff L, Pertea G, Kim D, Kelley DR, Pimentel H, Salzberg SL, Rinn JL, Pachter L. Differential gene and transcript expression analysis of RNA-seq experiments with TopHat and Cufflinks. Nat Protoc. 2012;7:562–578. doi: 10.1038/nprot.2012.016. [DOI] [PMC free article] [PubMed] [Google Scholar]
- 49.Eswaran J, Cyanam D, Mudvari P, Reddy SD, Pakala SB, Nair SS, Florea L, Fuqua SA, Godbole S, Kumar R. Transcriptomic landscape of breast cancers through mRNA sequencing. Sci Rep. 2012;2:264. doi: 10.1038/srep00264. [DOI] [PMC free article] [PubMed] [Google Scholar]
- 50.Subramanian A, Tamayo P, Mootha VK, Mukherjee S, Ebert BL, Gillette MA, Paulovich A, Pomeroy SL, Golub TR, Lander ES, Mesirov JP. Gene set enrichment analysis: a knowledge-based approach for interpreting genome-wide expression profiles. Proc Natl Acad Sci U S A. 2005;102:15545–15550. doi: 10.1073/pnas.0506580102. [DOI] [PMC free article] [PubMed] [Google Scholar]
- 51.Reich M, Liefeld T, Gould J, Lerner J, Tamayo P, Mesirov JP. GenePattern 2. 0. Nat Genet. 2006;38:500–501. doi: 10.1038/ng0506-500. [DOI] [PubMed] [Google Scholar]
Associated Data
This section collects any data citations, data availability statements, or supplementary materials included in this article.