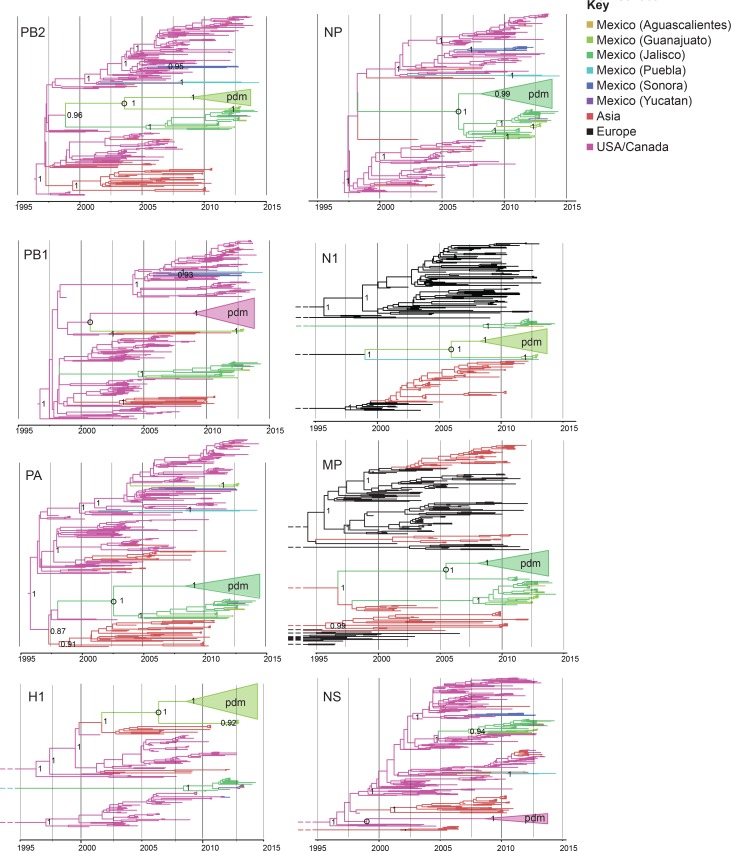
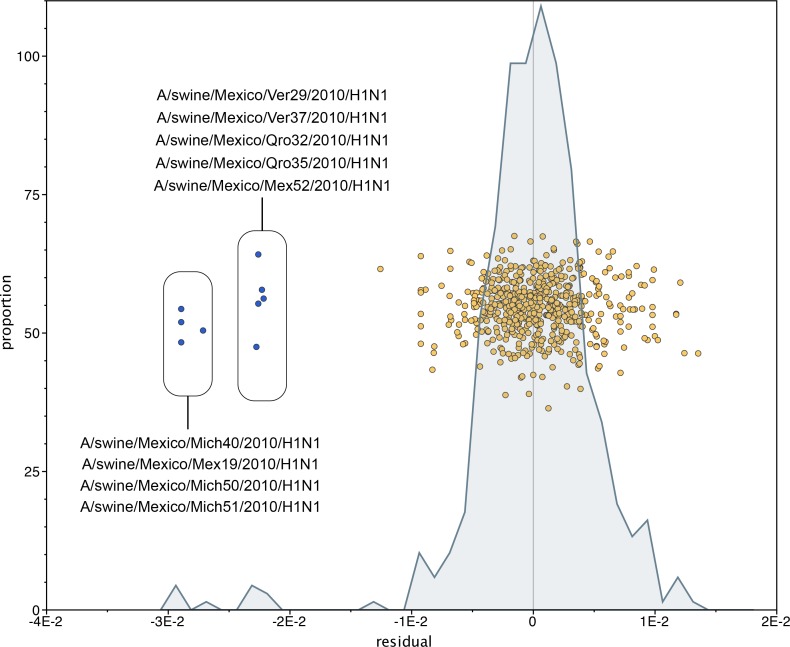
Time-scaled Bayesian MCC trees inferred for the eight segments of the IAV genome, for the lineages found in pdmH1N1: TRIG (PB2, PB1, PA, NP, and NS), classical (H1), and avian-like Eurasian (N1 and MP). Trees include the 58 swIAVs collected in Mexico for this study, representative pdmH1N1 viruses, and other related swIAVs collected globally. The color of each branch indicates the most probable location state. For clarity, the pdmH1N1 clade is depicted as a triangle, the color of which represents the inferred location state of the node representing the inferred common ancestor of pdmH1N1 and the most closely related swIAVs (indicated by an open circle). Posterior probabilities are provided for key nodes. More detailed phylogenies including tip labels are provided in Figure 3—source data 1. along with trees inferred for lineages not shown here. Similar phylogenies inferred using maximum likelihood methods are provided in Figure 3—source data 2. Similar phylogenies that use genotype instead of geographic location as a trait are provided in Figure 3—source data 3. Nine Mexican swIAVs were excluded from the phylogenetic analysis because they were outliers in root-to-tip divergence (Figure 3—figure supplement 1). More detailed phylogenies of the pdmH1N1 viruses reveal multiple independent introductions from humans into swine in Mexico (Figure 3—source data 4).
DOI:
http://dx.doi.org/10.7554/eLife.16777.007
Figure 3—source data 1. MCC trees presenting the evolutionary relationships between swIAVs collected in Mexico and swIAVs and human IAVs collected globally, for each IAV segment as well as for each IAV lineage found in Mexican swine: PB2 (TRIG/pdmH1N1), PB1 (TRIG/pdmH1N1), PA (TRIG/pdmH1N1), H1 (classical/pdmH1N1), H1 (avian-like Eurasian), H1 (human seasonal/human- like swine), H3 (human seasonal/human-like swine), NP (TRIG/classical/pdmH1N1), N1 (classical), N1 (avian-like Eurasian/pdmH1N1), N2 (human seasonal/human-like swine), MP (TRIG/classical), MP (avian-like Eurasian/pdmH1N1), NS (TRIG/classical/pdmH1N1).The color of each branch indicates the most probable location state, similar to
Figure 3. Clades of Mexican viruses are labeled. Posterior probabilities >80 are provided for key nodes. The 95% HPD values for the estimated tMRCA also are provided for key nodes with light blue bars. Viruses with genotype 1 similar to pdmH1N1 are indicated with green stars on the PB2 tree; a more detailed presentation of the evolution of genotypes in Mexico in all trees is provided in
Figure 3—source data 3.
Figure 3—source data 2. Maximum likelihood trees with tip labels.Evolutionary relationships of pdmH1N1 and swIAVs sampled in Mexico and globally for the eight segments of the IAV genome. Phylogenies and color scheme are similar to
Figure 3, except the trees are inferred using maximum likelihood methods and all horizontal branch lengths are drawn to scale (nucleotide substitutions per site). Trees are midpoint rooted for clarity and bootstrap values >70 are provided for key nodes.
Figure 3—source data 3. Time spent in a genotype using Markov rewards.Similar phylogenies as presented in
Figure 3—source data 1, but in this case Mexican swine viruses are specified by genotype instead of geography. Non-Mexican viruses remain specified by geographical location. Markov rewards representing the time spent in a genotype between state transitions are provided in the upper right. Genotype 1, which is similar to pdmH1N1 (
Figure 2), is shaded gold.
Figure 3—source data 4. Detailed phylogenetic analysis of pdmH1N1 in Mexican swine.Evolutionary relationships of pdmH1N1 viruses collected from humans and swine, 2009–2014 for the representative PB2 and HA segments. Separate viral introductions from humans into Mexican swine are indicated.


