Abstract
This article describes phenotypes observed in a prediabetic population (i.e. a population with increased risk for type 2 diabetes) from data collected at the University hospital of Tübingen. We discuss the impact of genetic variation on insulin secretion, in particular the effect on compensatory hypersecretion, and the incretin-resistant phenotype of carriers of the gene variant TCF7L2 is described. Imaging studies used to characterise subphenotypes of fat distribution, metabolically healthy obesity and metabolically unhealthy obesity are described. Also discussed are ectopic fat stores in liver and pancreas that determine the phenotype of metabolically healthy and unhealthy fatty liver and the recently recognised phenotype of fatty pancreas. The metabolic impact of perivascular adipose tissue and pancreatic fat is discussed. The role of hepatokines, particularly that of fetuin-A, in the crosstalk between these organs is described. Finally, the role of brain insulin resistance in the development of the different prediabetes phenotypes is discussed.
Keywords: Brain insulin resistance, Insulin, Liver fat, Phenotype, Prediabetes, Review, Secretion, Sensitivity
Introduction
The global increase in type 2 diabetes prevalence over recent decades puts a heavy health and socioeconomic burden on society. Lifestyle intervention with increased physical activity and a healthy diet is considered to be generally effective in preventing the development of diabetes [1–4]. Unfortunately, the prevention studies carried out so far have shown that a substantial number of prediabetic individuals (that is, those with increased risk for type 2 diabetes) seem to be non-responders to lifestyle interventions; the number needed to treat amounted to 7 in the Finnish Diabetes Prevention Study (DPS) and the US Diabetes Prevention Program (DPP) [1, 2]. Based on these studies and on pathophysiology-based studies in our population [5–7], it appears that even those individuals who are able to reduce their body fat mass adequately show a lack of improvement in hyperglycaemia and insulin resistance. To improve the efficacy of lifestyle intervention programmes, a precise understanding of the pathophysiology and the different phenotypes of the prediabetic population is needed.
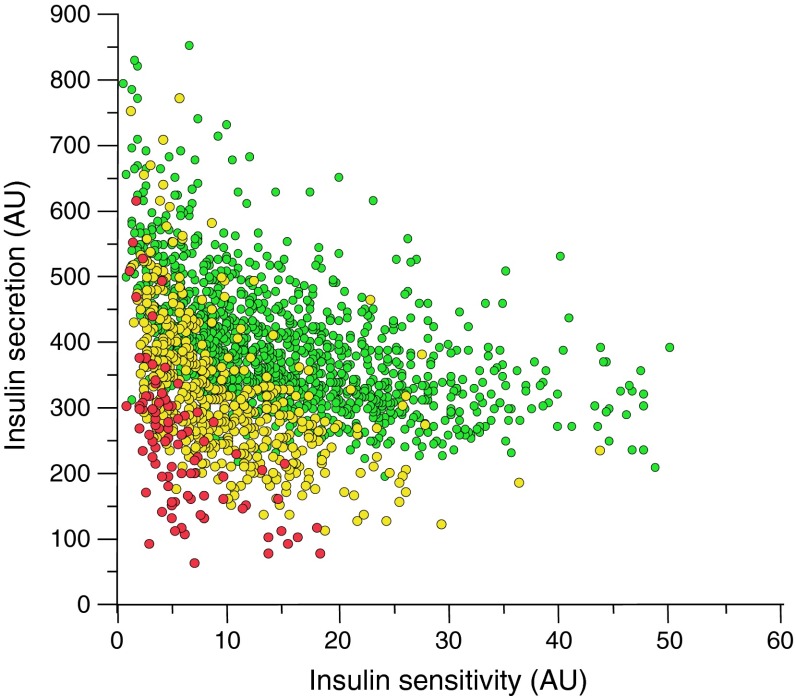
There are several prediabetes cohorts throughout the world [8–13] that provide extensive information about the natural history of disease progression from a prediabetic state to overt type 2 diabetes. Eighteen years ago at the University Hospital of Tübingen we started to build up a similar cohort, which we named the Tübingen Family Study (TÜF). Currently, the cohort comprises more than 3000 individuals from whom we have obtained values for insulin sensitivity and insulin secretion. The distribution of insulin sensitivity and insulin secretion in our cohort (Fig. 1) largely reflects the results from other groups worldwide [8–13]. It is evident that people with high insulin sensitivity very seldom display disturbed glucose tolerance. At higher values of insulin resistance individuals remain glucose tolerant only if their pancreas is able to react with a compensatory hypersecretion of insulin. Partial compensatory hypersecretion characterises individuals within the range of impaired glucose tolerance, while people with the lowest values of insulin secretion often show overt type 2 diabetes. In about 400 participants of the TÜF study, we are now studying the acute and long-term effects on insulin resistance and secretion of a lifestyle intervention programme. We found that there was a significant improvement in insulin resistance after 1 year. However, in follow-up studies after 2 years and 8 years this benefit was not only lost but also, in contrast, increased insulin resistance developed over the years (H-U Häring, unpublished data). These findings are in agreement with those of other earlier studies [8–13]. The stepwise progression towards type 2 diabetes involves increasing insulin resistance, although it is well established that only when combined with a simultaneous loss of compensatory hypersecretion of insulin does this lead to diabetes [8–13]. The major questions are therefore: what pushes people from an insulin-sensitive status to one of insulin resistance and what underlies the ability of an individual to respond with compensatory insulin hypersecretion?
Fig. 1.
Insulin sensitivity and insulin secretion of participants of the Tübingen Family Study. Insulin sensitivity is estimated from the OGTT (Matsuda–deFronzo index). Insulin secretion is estimated from the OGTT (AUC for C-peptide/glucose). Green circles, NGT; yellow circles, IGT; red circles, type 2 diabetes. AU, arbitrary units
Compensatory hypersecretion of insulin: influence of genetic variation
Using our database, we assessed the extent to which genetic variation determines the ability to produce compensatory hypersecretion of insulin. A large number of type 2 diabetes loci are known today [14–16] and we studied genotype–phenotype associations for the strongest type 2 diabetes genes [17–41].
We indeed found associations between many of the genetic variants and different features of insulin secretion [17–39]. Several of the gene variants showed interaction with other gene variants, and the degree of the effects was dependent on ligands that induce insulin secretion, such as incretins or fatty acids [17–25]. However, after quantifying the effect of these gene variants and testing for additive effects between variants and genotype–ligand interaction, it appears that the effects on insulin secretion are very small and often non-significant in insulin-sensitive individuals [30, 31]. In insulin-resistant individuals, who have higher insulin levels due to the compensatory effort of the pancreatic beta cell, the reduction in insulin secretion in association with these gene variants is more pronounced and significant [30, 31]. The quantitative effect, however, remains quite small, reaching only 15–20% of the compensatory response observed in individuals with normal glucose tolerance (NGT) vs impaired glucose tolerance (IGT) vs diabetes. This suggests that the type 2 diabetes genes known so far have only minor effects on insulin secretion and that variation in these genes does not contribute much to the large difference in compensatory hypersecretion of insulin that is seen when NGT, IGT and diabetic individuals are compared (Fig. 1).
TCF7L2 variants
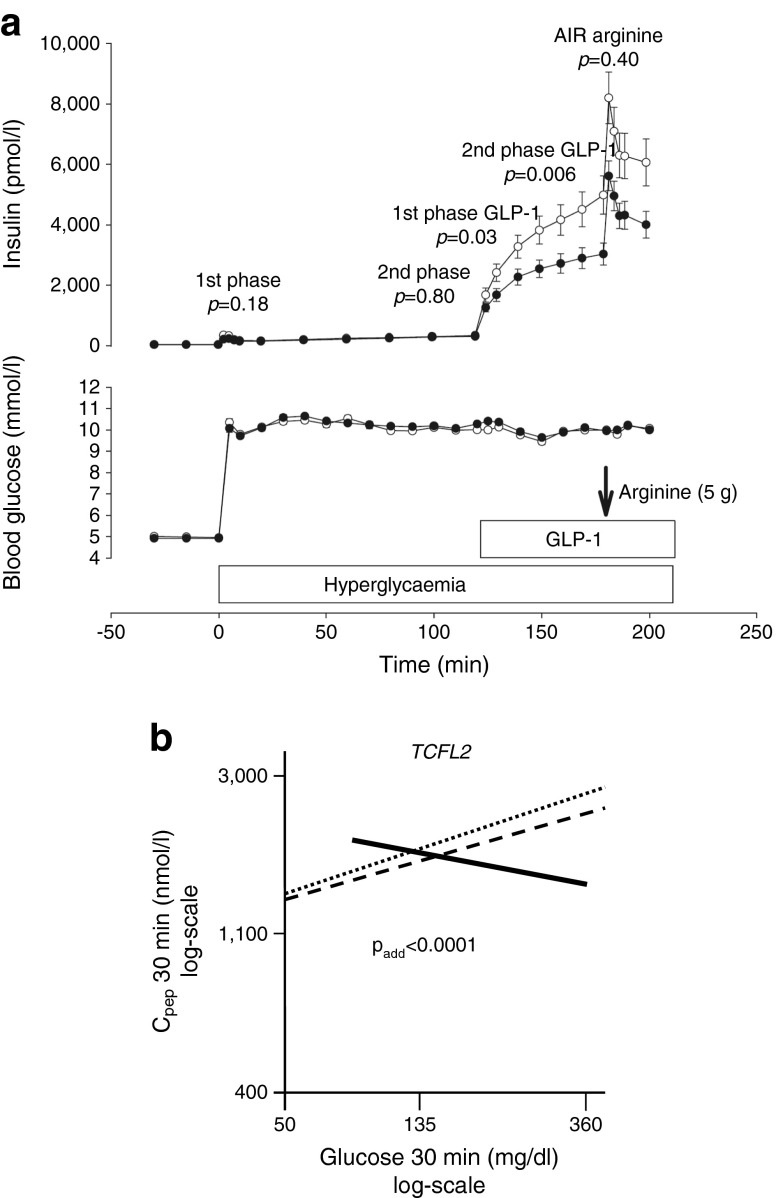
An exception to this picture emerges with genetic variants in TCF7L2, a diabetes risk gene associated with incretin resistance [20]. Glucagon-like peptide-1 (GLP-1) infusion strongly induces insulin secretion in the experimental setting of a hyperglycaemic–euglycaemic clamp and this effect is clearly reduced in carriers of the TCF7L2 risk allele (Fig. 2a). When the glucose level increases, this gene variant seems to affect the ability of an individual to respond with a compensatory secretion of insulin [23] (Fig. 2b). Figure 2b shows that individuals with the wild-type C allele of the rs7903146 single-nucleotide polymorphism (SNP) and individuals who are heterozygous for this SNP adequately respond to increasing glucose with increasing insulin secretion. In contrast, homozygous carriers of the T allele even show decreased insulin secretion at increasing glucose concentrations. This finding can be explained by reduced incretin signalling in these individuals [42].
Fig. 2.
(a) Associations between the genotypes of rs7903146 polymorphism in TCF7L2 with insulin secretion during a hyperglycaemic clamp in 73 German individuals. White circles, CC; black circles, CT and TT. AIR, acute insulin response. The p values are for comparison between the genotypes for the first and second phases of glucose-induced insulin secretion, first and second phases of GLP-1-induced insulin secretion and acute insulin secretory response to arginine; figure reproduced with permission from [20]. (b) Association between C-peptide levels at 30 min of the OGTT and glucose levels at 30 min during the OGTT by TCF7L2 SNP rs7903146. Regression lines are shown. Dotted line, CC; dashed line, CT; solid line TT genotype of TCF7L2 SNP rs7903146; figure reproduced with permission from [23]. To convert glucose values from from mg/dl to mmol/l, please multiply by 0.0555
This phenomenon has also been described by other groups [43–45]. A recent pharmacogenetic study showed that homozygous T allele carriers of the rs7903146 SNP of TCF7L2 are partially resistant to therapy with dipeptidyl peptidase-4 (DPP-4) inhibitors, which are known to increase GLP-1 availability [46]. Approximately 10% of individuals in our database are homozygous carriers of this T allele, and the gene variant probably contributes to an inability to upregulate insulin secretion. It is important to note that a reduction in glucose levels through lifestyle intervention can reverse the reduced insulin secretion [23, 47]. Therefore, attempts to lower glucose levels both by lifestyle intervention and by pharmacotherapy might be able to slow down the disease progression in this subgroup of prediabetic individuals. Clinical studies to test this hypothesis are on the way. The role of this gene variant in glucose-induced insulin secretion and glucose metabolism has been addressed in many studies [48–51], some of which suggest that the gene variant affects glucose-induced insulin secretion and the conversion of proinsulin to insulin [38] as well as affecting glucose metabolism [50].
Body fat composition
Metabolically healthy and unhealthy obesity
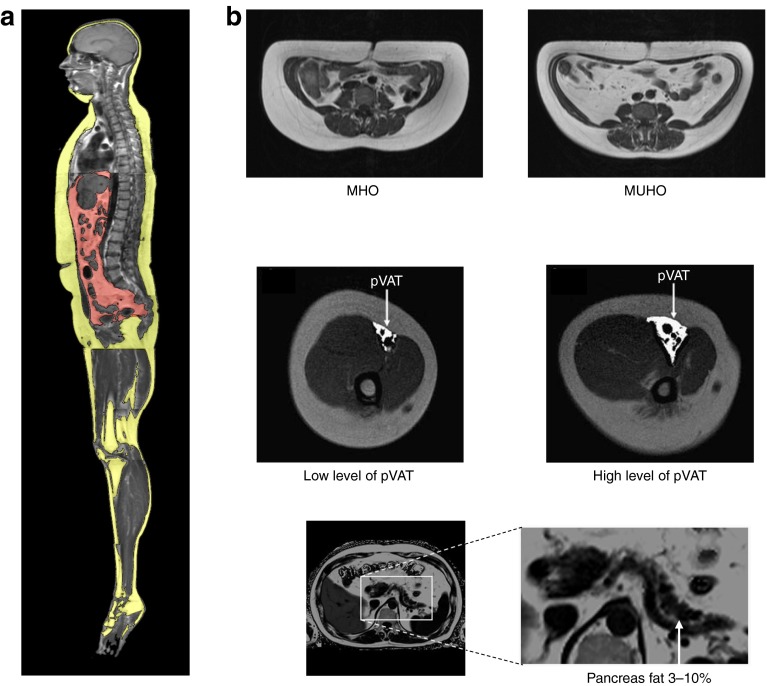
Studies using whole-body MRI not only allow identification of established metabolically relevant fat compartments [52] but also show new fat compartments like neck fat [53] and perivascular fat [54]. Furthermore, magnetic resonance spectroscopy technology allows determination of ectopic fat storage in the liver and the skeletal muscle [52]. A key observation made in such studies has been the description of subphenotypes of obesity: metabolically healthy obesity (MHO) and metabolically unhealthy obesity (MUHO) (Fig. 3).
Fig. 3.
Subphenotypes of obesity. Whole-body MRI measurements are used to quantify fat compartments [52–58]. (a) Yellow, subcutaneous adipose tissue; red, visceral adipose tissue. (b) pVAT, perivascular visceral adipose tissue
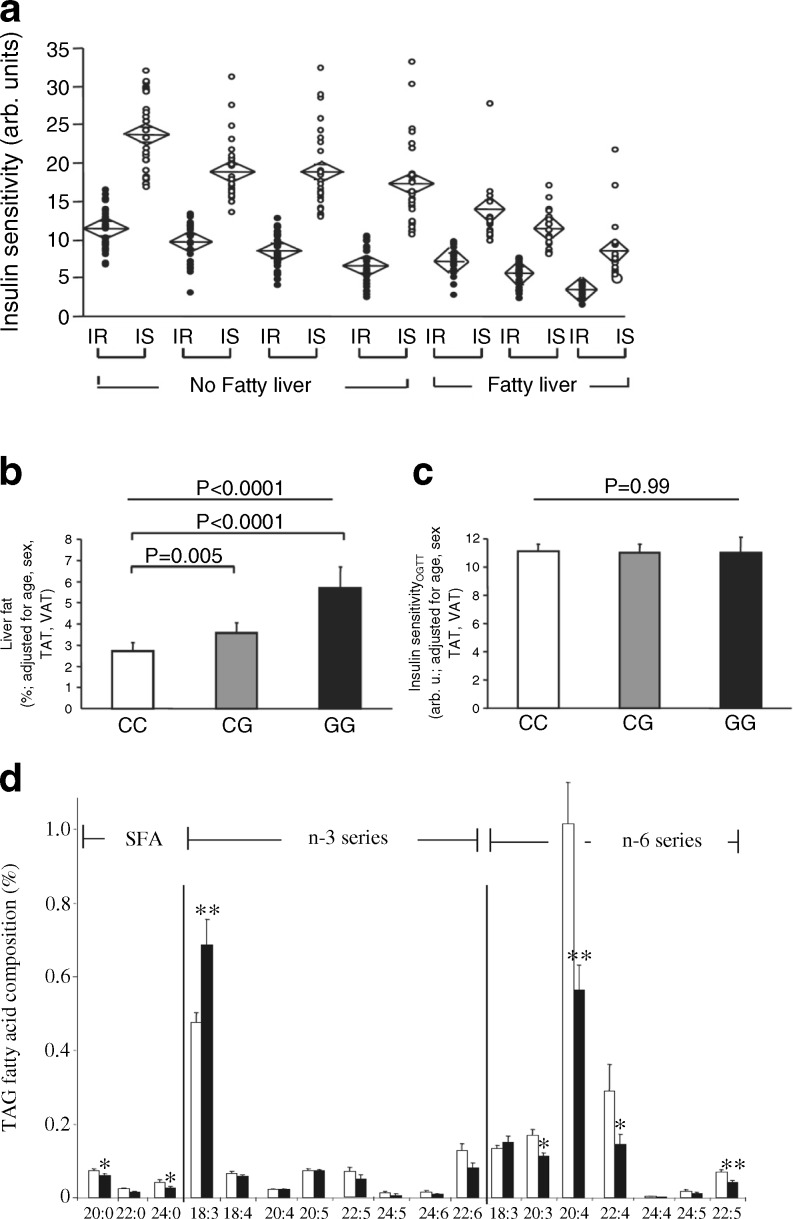
We found that approximately 25% of the obese individuals in our cohort displayed a metabolically healthy phenotype [55–57]. These individuals predominantly accumulate less fat in the liver and store less fat in the visceral compartment, while fat storage in the subcutaneous compartment is high. Furthermore, they display high insulin sensitivity despite having a high BMI [58]. However, most of the obese individuals in our cohort had a metabolically unhealthy phenotype of fat distribution, characterised by decreased subcutaneous fat storage and increased fat storage in the visceral compartment and by non-alcoholic fatty liver disease (NAFLD) (Fig. 3). The insulin resistance of these individuals is associated with the amount of liver fat (Fig. 4a). However, it is evident that at each level of liver fat content a more-insulin-resistant group can be distinguished from a less-insulin-resistant group [57, 58] (Fig. 4a). We saw these data as evidence for distinct liver phenotypes—metabolically benign and metabolically malignant fatty liver [58].
Fig. 4.
(a) Association of insulin resistance with the amount of liver fat. Individuals were divided into seven groups: quartiles of liver fat in individuals without fatty liver (liver fat <5.56%, n=225) and tertiles of liver fat in individuals with fatty liver (liver fat ≥5.56%, n = 112). Each group was then divided by the median insulin sensitivity into an insulin-sensitive (IS, white circles) and an insulin-resistant (IR, black circles) subgroup. Diamonds indicate mean and the 95% CI. Within each of the seven groups, the subgroups did not differ in liver fat. However, insulin sensitivity was lower in each group; figure reproduced with permission from [58]. (b, c) Liver fat content (b) and insulin sensitivity (c) associated with the I148M variant of PNPLA3,; figure reproduced with permission from [60]. (d) Fatty-acid profiles of hepatic triacylglycerol stores are dependent on the I148M variant of PNPLA3. White bars, wild-type individuals; black bars, PNPLA3 I148M individuals; figure reproduced with permission from [61]. TAG, triacylglycerol; TAT, total adipose tissue; VAT, visceral adipose tissue
Genetic predisposition
A genetic predisposition seems to contribute to these phenotypes. Genome-wide association studies have identified a number of genetic variants for NAFLD [59]. The I148M variant of PNPLA3, the gene encoding patatin-like phospholipase domain-containing protein 3, is most strongly associated with increased liver fat content (Fig. 4b) [59]. Surprisingly, however, no insulin resistance is observed in individuals possessing this variant (Fig. 4c) [60]. We found that this genotype appears to cause a different fatty-acid composition in the lipid stores of the hepatocytes—decreased levels of stearate and increased levels of polyunsaturated fatty acids (Fig. 4d) [61, 62].
Role of hepatokines
The different fatty-acid pattern might be responsible for an alteration in the interaction between hepatocytes and the cells of the immune system in the liver. In contrast to the metabolically benign fatty liver, the metabolically malignant fatty liver secretes an altered pattern of hepatokines [63]. The hepatokine fetuin-A is associated with insulin resistance, diabetes and cardiovascular outcomes [63–67]. Saturated fatty acids, such as palmitate, stearate and myristate, have been found to increase hepatic fetuin-A mRNA and protein expression in the human liver cell line HepG2 by increasing NFkB binding to its promoter [68]. Palmitate dose- and time-dependently increases the secretion of fetuin-A from HepG2 cells [68]. Also, high glucose levels dose-dependently increase fetuin-A mRNA and protein expression in HepG2 cells via activation of the extracellular signal-regulated kinase-1/2 (ERK-1–ERK-2) signalling pathway [69]. Finally, preliminary data suggests that exendin-4 may attenuate the expression of fetuin-A in HepG2 cells by improving palmitate-induced endoplasmic reticulum stress through AMP-activated protein kinase [70]. The exact mode of action of fetuin-A is still not fully understood.
George Grunberger’s group was the first to show that fetuin-A inhibits signalling through the insulin receptor [71]) and we and others have confirmed fetuin-A’s inhibitory effect on the insulin receptor tyrosine kinase [reviewed in 63, 64, 72]. Downstream effects on stress kinases and NFkB were observed [72].
Another signalling pathway that is modulated by fetuin-A is the fatty-acid signalling pathway, through the Toll-like receptor. Based on mouse data, it has been proposed that fetuin-A acts as an endogenous ligand of Toll-like receptor 4 to promote lipid-induced insulin resistance [73]. This concept seems to be relevant in humans, as we were able to show that, indeed, circulating fetuin-A levels and NEFA interacted to predict insulin resistance in participants of the TÜF study [64]. These data support the concept that organ crosstalk through hepatokines plays a key role in the pathophysiology of prediabetes.
Perivascular adipose tissue
Perivascular fat cells seem to be a particularly important target of hepatokines, which might function as transducers of organ crosstalk [54, 74–78]. The whole-body MRI data led us to study another interesting fat compartment—perivascular adipose tissue (Fig. 3). Perivascular adipose tissue is a specific fat depot with impact on organ functions [54, 74–78]. The adipose tissue surrounding arteries seems to have an influence on whole-body insulin sensitivity. This effect is independent of other fat compartments like hepatic fat and visceral fat [54]. Due to the strong effect on whole-body insulin sensitivity, we hypothesised that perivascular adipocytes would have specific characteristics that distinguish them from visceral or subcutaneous fat cells. This is indeed the case, as perivascular fat cells produce and secrete higher quantities of angiogenic factors, cytokines and chemoattractants like monocyte chemoattractant protein-1 (MCP-1) [76]. Furthermore, these fat cells seem to be particularly susceptible to organ crosstalk signals from the fatty liver [72]. The hepatokine fetuin-A stimulates, together with fatty acids, cytokine release and MCP-1 expression in these cells [72].
Fat cells are also found around the renal artery in the hilus of the kidney. As the amount of kidney fat in the hilus correlates with hypertension-inducible albuminuria in individuals with prediabetes [77, 78], we speculate that this fat compartment might be relevant in the pathogenesis of diabetic kidney disease. We further observed that these renal fat cells are particularly responsive to crosstalk signals from the fatty liver (i. e. fetuin-A). Thus, the fatty kidney might be a subphenotype of prediabetes that defines a higher risk of developing kidney disease in the context of MUHO and NAFLD. This is of course at the moment a pure speculation that has to be tested in prospective studies.
The fatty pancreas: non-alcoholic fatty pancreas disease
Ectopic fat storage is also observed in the pancreas. In MRI studies, about 3–10% of fat is detected in the pancreas (Fig. 3). The pancreatic fat content does not correlate with insulin secretion in individuals with NGT, although it does correlate strongly with insulin secretion in individuals with IGT [79]. We recently demonstrated that these magnetic resonance-derived fat signals reflect clusters of fat cells in the pancreas, found in close vicinity to islets and sometimes even within islets (Fig. 5a). Macrophages were also detectable. We speculate that fat cells, islets and macrophages are engaged in a cell-to-cell crosstalk (Fig. 5e), which alters the expression of chemoattractants and cytokines. It is likely that this process modifies lipolysis of fat cells and, thereby, fatty-acid signalling. This cell crosstalk is probably silent in the situation of normal glycaemia, while in IGT additional stimulators are present, most likely glucose, cytokines, adipokines and hepatokines. In this respect, we could show that insulin secretion is correlated to the level of circulating fetuin-A in individuals with IGT [80]. Based on this data, we favour the following concept of organ crosstalk in prediabetes: MUHO might induce the development of fatty liver and organ crosstalk, which involves fetuin-A; in the presence of a fatty pancreas, this hepatokine could amplify the cellular crosstalk described in Fig. 5 and this might finally affect islet function and survival and therefore the capacity for compensatory insulin hypersecretion.
Fig. 5.
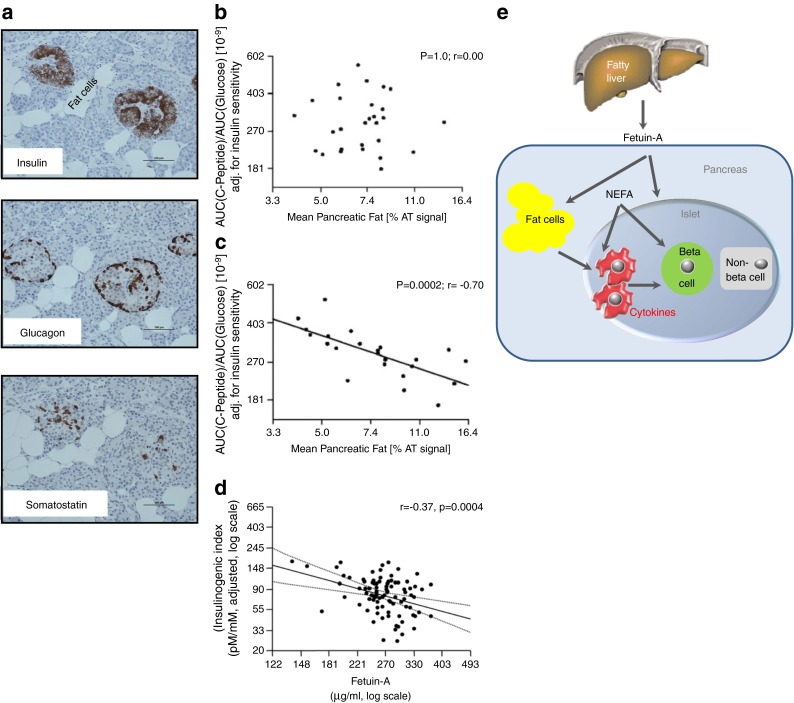
The fatty pancreas. (a) Histochemistry of pancreas sections. (b, c) Association of pancreatic fat and insulin secretion in people with NGT (b) and IGT (c); figure reproduced with permission from [79]. (d) Association of increased fetuin-A from fatty liver with impaired insulin secretion; figure reproduced from [80]. (e) Cell-to-cell crosstalk between intrapancreatic fat cells, islets and macrophages
Response to lifestyle intervention
All these observations support a key role for NAFLD in the pathogenesis of insulin resistance and the progression from NGT to IGT and finally to type 2 diabetes. Furthermore, our lifestyle intervention study has clearly shown that lifestyle intervention has limited success in improving glycaemia in prediabetic individuals who have NAFLD [7]. Therefore, other approaches to reduce liver fat content are extremely important.
Dietary intervention is a powerful tool with which to reduce liver fat [81–86]. However, there is evidence that the susceptibility to carbohydrate-dependent induction of liver fat shows a large inter-individual variation [81], suggesting the existence of diet non-responders. A study in patients with biopsy-proven NAFLD showed that a 2 week administration of a very-low-carbohydrate diet (20 g/day) vs energy restriction (5000–6300 kJ/day) reduced hepatic triacylglycerol levels by a greater amount (−55% vs −28%, respectively), while weight loss was similar in both groups (−4.0 kg vs −4.6 kg) [82].
In another study carried out over 16 weeks in 52 individuals with obesity, insulin resistance and suspected NAFLD, a normal carbohydrate (60% carbohydrate, 25% fat, 15% protein) or moderately restricted carbohydrate (40% carbohydrate, 45% fat, 15% protein) diet again resulted in a similar decrease in body weight, daily insulin requirement and plasma liver enzymes levels. However, the moderately restricted carbohydrate intervention was associated with a larger decrease in insulin resistance and liver enzymes [83].
The effect of an isoenergetic diet with restricted fat, restricted saturated fat (LSAT) and restricted glycaemic index (GI) (LSAT: 23% fat [7% saturated fat], GI < 55) on liver fat content was compared with the effect of a high-fat, high-saturated fat (HSAT) and high-GI (HSAT: 43% fat [24% saturated fat] GI > 70) diet in an elderly population. In the LSAT group, but not in the HSAT group, liver fat content decreased significantly [84].
In most studies intake of n-3 polyunsaturated fatty-acid supplements is associated with a reduction in liver fat content, with the doses ranging from 0.83 to 6 g/day, and duration of therapy ranging from 8 weeks to 18 months [85, 86].
The microbiome is probably important as well, although targeted interventions are not feasible as yet.
The phenotype of non-response to exercise
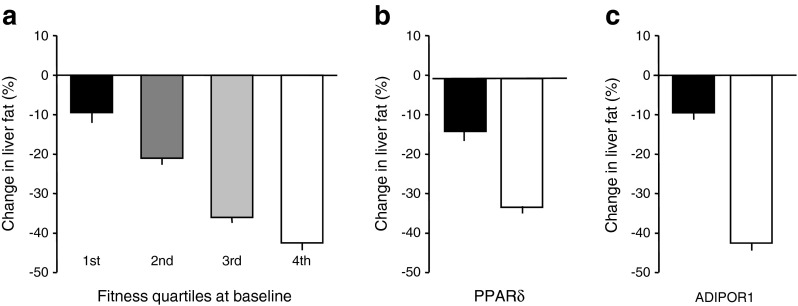
From our own experience in the Tübingen lifestyle intervention program (TULIP) study, we suggest that effective reduction of liver fat content during lifestyle intervention is very much related to physical fitness and to variants in the genes for the adiponectin receptor ADIPOR1 [87] and the transcription factor PPARδ (also known as PPARD) [6, 88] (Fig. 6).
Fig. 6.
Reduction of liver fat content during a lifestyle intervention is very much related to physical fitness at baseline (p = 0.004) (a) and to genetic factors (b, c). Genetic variation in transcription factor PPARδ: black bar, carriers of the risk allele; white bar, non-carriers of the risk allele (p = 0.001). Genetic variation in the receptor for adiponectin ADIPOR1: black bar, carriers of the risk allele; white bar, non-carriers of the risk allele (p = 0.004). Error bars are SEM. Figures plotted using data from [91] (a), [88] (b) and [87] (c)
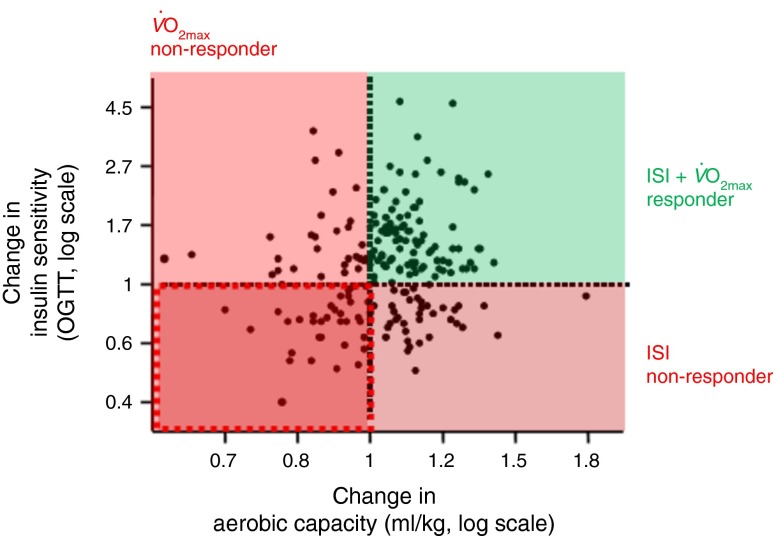
Exercise is a key factor in influencing metabolism [89, 90] and reducing liver fat content [91]. However, response to exercise is highly variable. Studies by different groups [90–98; for review see 92] have shown that a certain proportion of prediabetic individuals does not adequately respond to exercise, with respect to fitness variables, like and lactate threshold, and insulin sensitivity. We have made the same observation in our lifestyle intervention study (Fig. 7). Understanding the cause of exercise non-response is crucial for improving the success of a lifestyle intervention. We have performed controlled exercise studies in responders and non-responders and have used muscle biopsies to study the underlying molecular mechanisms. It appears that differences in the transcriptional response of muscle cells of the responders and non-responders might explain the different phenotypes as well as differences in the exercise-induced release of myokines [96–98].
Fig. 7.
Change in aerobic capacity plotted against change in insulin sensitivity during lifestyle intervention. ISI, Insulin Sensitivity Index calculated from OGTT
As a consequence, differences in the adaptation of fuel oxidation are potentially responsible for these phenotypes.
Insulin action in the human brain: the phenotype of brain insulin resistance
For a long time the brain was not considered to be a classical target organ of insulin action. However, as early as 1978, Roth and colleagues showed that mouse and rat brain express high levels of insulin receptors [99, 100]. Later, around 2000, several groups showed that alteration of the insulin signalling chain in the brain by knockdown of the insulin receptor or docking proteins causes brain insulin resistance, leading to a diabetes-like phenotype in mice [101–103].
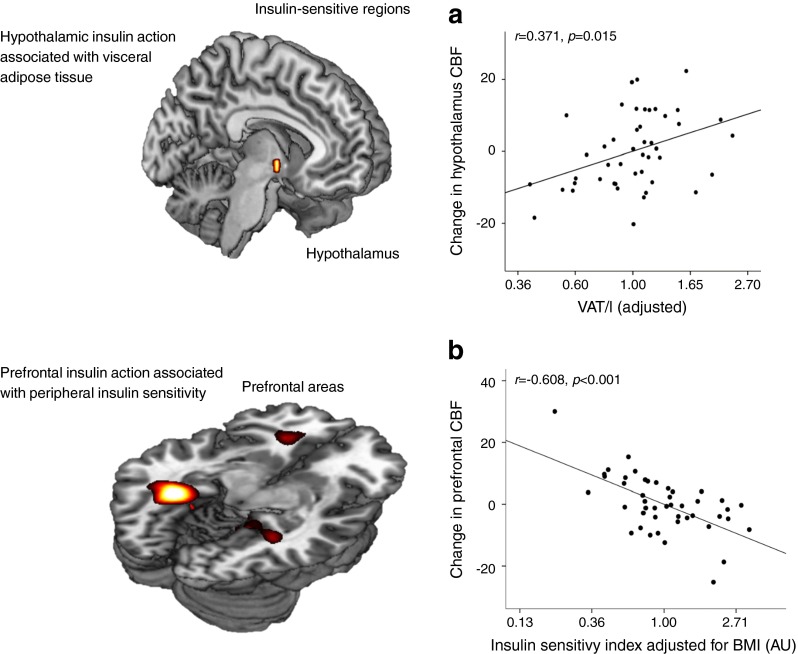
For technical reasons it is difficult to demonstrate brain insulin action in humans. We used magneto-encephalography (MEG) to examine insulin effects under the condition of a euglycaemic–hyperinsulinaemic clamp and showed that insulin infusion induces a strong MEG signal in lean individuals but not in obese individuals [104]. We interpreted this as a sign of brain insulin resistance in obese people. In many subsequent studies using functional MRI (fMRI) we further characterised insulin action in the human brain and identified the major insulin-sensitive areas. We have recently reviewed these studies and therein discussed the causes and consequences of brain insulin resistance [105]. Brain insulin signals are detected in the hypothalamus, frontal areas, hippocampus and fusiform gyrus and modulate behavioural functions. We have shown that brain insulin resistance affects very specifically the interaction of the hypothalamus with frontal areas and is associated with insulin sensitivity and amount of visceral fat (Fig. 8) [106]. Very recently, we also showed that brain insulin signalling affects peripheral glucose metabolism [107]. In clamp studies using submaximally active peripheral insulin concentrations, the application of nasal insulin produced an additional increase of glucose uptake in the periphery. Nasal insulin is an efficient tool with which to directly stimulate the human brain [107–111]. This effect of intranasal insulin is closely associated with insulin-dependent activation of the hypothalamus and seems to be transmitted through the autonomous nervous system.
Fig. 8.
Insulin-sensitive regions in the human brain. (a) Hypothalamus. (b) Prefrontal area. Data from studies with intranasal insulin application. Figure modified with permission from [106]. CBF, cerebral blood flow; VAT, visceral adipose tissue
Brain insulin sensitivity: cause or consequence of adipose tissue distribution?
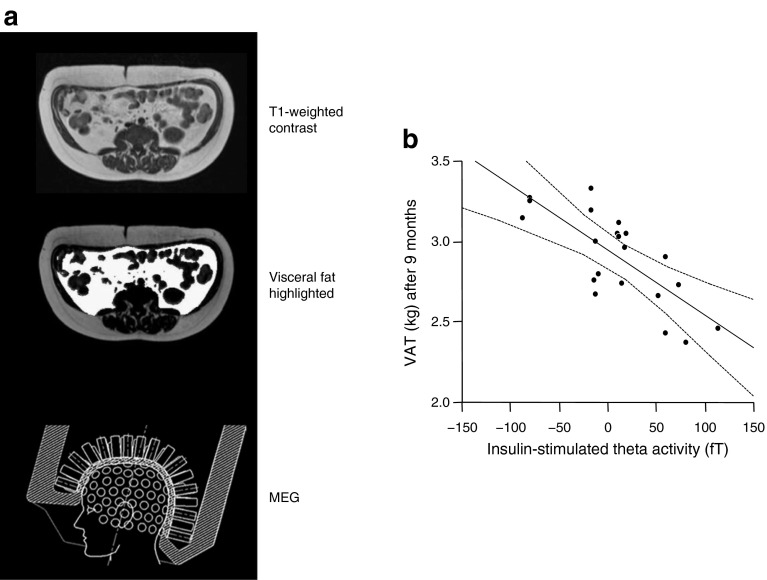
In our lifestyle intervention study (TULIP) we investigated whether the response to lifestyle intervention is related to brain insulin sensitivity. We found that brain insulin sensitivity was closely related to the change in visceral adipose tissue during lifestyle intervention (Fig. 9) [112]. A potential explanation for this observation might involve autonomous nervous signalling induced by brain insulin action which controls visceral adipose tissue storage. High hypothalamic brain insulin sensitivity associates with increased subcutaneous fat and decreased visceral fat. Low hypothalamic brain insulin sensitivity correlates with high visceral fat and low subcutaneous fat (Fig. 8). This suggests that brain insulin resistance might contribute to the phenotype of MUHO. MHO might depend on strong hypothalamic brain insulin signalling. However, this concept is still very speculative and future studies need to discover whether this hypothesis is valid. While proof from human data is still lacking, several animal models suggest that there is an interaction between brain insulin signalling and the described phenotypes, in particular for fatty liver [113–116]. In accordance with these animal data it has recently been shown that nasal insulin alters fuel flux in the liver in humans [117]. In as yet unpublished studies (M. Heni and A. Fritsche) we recently showed, with the use of stable isotopes, that nasal insulin affects substrate distribution between liver and peripheral tissues. Thus, a crucial role for brain insulin signalling in body fat distribution seems likely.
Fig. 9.
(a) Diagrams illustrating the investigation of visceral adipose tissue with magnetic resonance imaging (MRI) and the measurement of cerebral insulin sensitivity using the technique of magnetoencephalography (MEG). (b) Brain insulin sensitivity before lifestyle intervention (as insulin-stimulated theta activity) and its association with the change in visceral adipose tissue (adjusted for baseline) during lifestyle intervention; r = −0.76; p = 0.001; figure reproduced with permission from [112]. VAT, visceral adipose tissue
Effects of gestational diabetes on fetal brain: does primary brain insulin resistance exist?
Brain insulin resistance can already be found in young obese people [106–111]. This observation allows one to speculate that brain insulin resistance might indeed precede the development of obesity. To further test this hypothesis we studied fetal brain development in pregnancies of insulin-sensitive mothers, insulin-resistant mothers and mothers with gestational diabetes [118, 119]. Fetal brain functions were tested by fetal MEG (fMEG) and the findings suggested that indeed the metabolic situation of the mothers might influence fetal brain insulin sensitivity. It seems therefore conceivable that brain insulin resistance is induced already in utero. Further studies are required to show whether this leads to altered behaviour, altered eating habits and altered weight gain in the postnatal life of these children.
Brain insulin resistance: starting point for organ crosstalk defining prediabetic phenotypes?
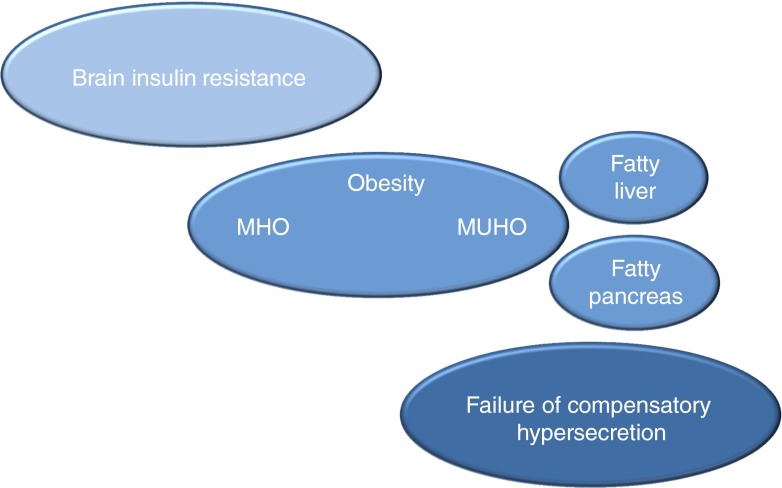
Major phenotypes of prediabetic individuals include brain insulin resistance, subphenotypes of obesity (MHO and MUHO), fatty liver, fatty pancreas and variations in perivascular fat. At the level of the pancreas both compensatory insulin hypersecretion and beta cell dysfunction are observed. We speculate that the chronological development of the organ crosstalk is a key feature of the progression from NGT to the prediabetic situation and to type 2 diabetes. Figure 10 illustrates this speculative concept. Brain insulin resistance might occur very early in life and may be the first event contributing to an unfavourable fat distribution pattern (increased visceral fat). MUHO might then be a stepping stone to the development of fatty liver. Hepatokines provide the communication with other organs. Fat cells from perivascular tissue, perihilar fat of the kidney and fat cells in the pancreas seem to be particularly responsive to combined signals of saturated fatty acids and fetuin. These fat cells respond with a pattern of inflammation that probably activates macrophages. The fatty liver might, through these mechanisms, influence both key pathomechanisms of prediabetes, namely insulin resistance and inability to produce compensatory insulin hypersecretion. This scenario is of course very speculative at present but it might be useful as a roadmap for further studies aimed at understanding the chronology underlying the pathophysiology of prediabetes development.
Fig. 10.
Concept of the pathogenesis of type 2 diabetes mellitus. Chronological development of disadvantageous organ crosstalk involved in the progression from NGT to the prediabetic situation and to type 2 diabetes
Acknowledgements
I wish to thank all my collaborators from the University Hospital and the University of Tübingen, Germany for their consistent support over many years. I am particularly grateful to N. Birbaumer, C. D. Claussen, A. Fritsche, B. Gallwitz, F. Gerst, M. Heni, M. Hrabe de Angelis, A. Königsrainer, S. Kullmann, R. Lehmann, J. Machann, F. Machicao, A. Peter, H. Preißl, K. Rittig, N. Stefan, F. Schick, E. Schleicher, D. Siegel-Axel, H. Staiger, S. Ullrich and C. Weigert.
Abbreviations
- GI
Glycaemic index
- GLP-1
Glucagon-like peptide-1
- HSAT
High saturated fat
- IGT
Impaired glucose tolerance
- LSAT
Restricted saturated fat
- MCP-1
Monocyte chemoattractant protein-1
- MEG
Magneto-encephalography
- MHO
Metabolically healthy obesity
- MUHO
Metabolically unhealthy obesity
- NAFLD
Non-alcoholic fatty liver disease
- NGT
Normal glucose tolerance
- SNP
Single-nucleotide polymorphism
- TÜF
Tübingen Family Study
- TULIP
Tübingen lifestyle intervention program
Duality of interest
The author declares that there is no duality of interest associated with this manuscript.
Contribution statement
The author was the sole contributor to this paper.
References
- 1.Tuomilehto J, Lindström J, Eriksson JG, et al. Prevention of type 2 diabetes mellitus by changes in lifestyle among subjects with impaired glucose tolerance. N Engl J Med. 2001;344:1343–1350. doi: 10.1056/NEJM200105033441801. [DOI] [PubMed] [Google Scholar]
- 2.Knowler WC, Barrett-Connor E, et al. Reduction in the incidence of type 2 diabetes with lifestyle intervention or metformin. N Engl J Med. 2002;346:393–403. doi: 10.1056/NEJMoa012512. [DOI] [PMC free article] [PubMed] [Google Scholar]
- 3.Li G, Zhang P, Wang J, et al. The long-term effect of lifestyle interventions to prevent diabetes in the China Da Qing Diabetes Prevention Study: a 20-year follow-up study. Lancet. 2008;371:1783–1789. doi: 10.1016/S0140-6736(08)60766-7. [DOI] [PubMed] [Google Scholar]
- 4.Perreault L, Pan Q, Mather KJ, et al. Effect of regression from prediabetes to normal glucose regulation on long-term reduction in diabetes risk: results from the Diabetes Prevention Program Outcomes Study. Lancet. 2012;379:2243–2251. doi: 10.1016/S0140-6736(12)60525-X. [DOI] [PMC free article] [PubMed] [Google Scholar]
- 5.Thamer C, Machann J, Stefan N, et al. High visceral fat mass and high liver fat are associated with resistance to lifestyle intervention. Obesity (Silver Spring) 2007;15:531–538. doi: 10.1038/oby.2007.568. [DOI] [PubMed] [Google Scholar]
- 6.Stefan N, Thamer C, Staiger H, et al. Genetic variations in PPARD and PPARGC1A determine mitochondrial function and change in aerobic physical fitness and insulin sensitivity during lifestyle intervention. J Clin Endocrinol Metab. 2007;92:1827–1833. doi: 10.1210/jc.2006-1785. [DOI] [PubMed] [Google Scholar]
- 7.Stefan N, Staiger H, Wagner R, et al. A high-risk phenotype associates with reduced improvement in glycaemia during a lifestyle intervention in prediabetes. Diabetologia. 2015;58:2877–2884. doi: 10.1007/s00125-015-3760-z. [DOI] [PubMed] [Google Scholar]
- 8.Weyer C, Bogardus C, Mott DM, Pratley RE. The natural history of insulin secretory dysfunction and insulin resistance in the pathogenesis of type 2 diabetes mellitus. J Clin Invest. 1999;104:787–794. doi: 10.1172/JCI7231. [DOI] [PMC free article] [PubMed] [Google Scholar]
- 9.Ferrannini E. Definition of intervention points in prediabetes. Lancet Diabetes Endocrinol. 2014;2:667–675. doi: 10.1016/S2213-8587(13)70175-X. [DOI] [PubMed] [Google Scholar]
- 10.Kahn SE, Hull RL, Utzschneider KM. Mechanisms linking obesity to insulin resistance and type 2 diabetes. Nature. 2006;444:840–846. doi: 10.1038/nature05482. [DOI] [PubMed] [Google Scholar]
- 11.Bergman RN, Ader M, Huecking K, Van Citters G. Accurate assessment of beta-cell function: the hyperbolic correction. Diabetes. 2002;51(Suppl 1):S212–S220. doi: 10.2337/diabetes.51.2007.S212. [DOI] [PubMed] [Google Scholar]
- 12.Stancáková A, Javorský M, Kuulasmaa T, Haffner SM, Kuusisto J, Laakso M. Changes in insulin sensitivity and insulin release in relation to glycemia and glucose tolerance in 6,414 Finnish men. Diabetes. 2009;58:1212–1221. doi: 10.2337/db08-1607. [DOI] [PMC free article] [PubMed] [Google Scholar]
- 13.Eriksson J, Franssila-Kallunki A, Ekstrand A, et al. Early metabolic defects in persons at increased risk for non-insulin-dependent diabetes mellitus. N Engl J Med. 1989;321:337–343. doi: 10.1056/NEJM198908103210601. [DOI] [PubMed] [Google Scholar]
- 14.Lyssenko V, Jonsson A, Almgren P, et al. Clinical risk factors, DNA variants, and the development of type 2 diabetes. N Engl J Med. 2008;359:2220–2232. doi: 10.1056/NEJMoa0801869. [DOI] [PubMed] [Google Scholar]
- 15.Mohlke KL, Boehnke M. Recent advances in understanding the genetic architecture of type 2 diabetes. Hum Mol Genet. 2015;24:R85–R92. doi: 10.1093/hmg/ddv264. [DOI] [PMC free article] [PubMed] [Google Scholar]
- 16.DIAbetes Genetics Replication and Meta-analysis (DIAGRAM) Consortium, Asian Genetic Epidemiology Network Type 2 Diabetes (AGEN-T2D) Consortium, South Asian Type 2 Diabetes (SAT2D) Consortium et al. Genome-wide trans-ancestry meta-analysis provides insight into the genetic architecture of type 2 diabetes susceptibility. Nat Genet. 2014;46:234–244. doi: 10.1038/ng.2897. [DOI] [PMC free article] [PubMed] [Google Scholar]
- 17.Wagner R, Hieronimus A, Lamprinou A, et al. Peroxisome proliferator-activated receptor gamma (PPARG) modulates free fatty acid receptor 1 (FFAR1) dependent insulin secretion in humans. Mol Metab. 2014;3:676–680. doi: 10.1016/j.molmet.2014.07.001. [DOI] [PMC free article] [PubMed] [Google Scholar]
- 18.Wagner R, Staiger H, Ullrich S, Stefan N, Fritsche A, Häring HU. Untangling the interplay of genetic and metabolic influences on beta-cell function: examples of potential therapeutic implications involving TCF7L2 and FFAR1. Mol Metab. 2014;3:261–267. doi: 10.1016/j.molmet.2014.01.001. [DOI] [PMC free article] [PubMed] [Google Scholar]
- 19.Ordelheide AM, Gerst F, Rothfuss O, et al. Nor-1, a novel incretin-responsive regulator of insulin genes and insulin secretion. Mol Metab. 2013;2:243–255. doi: 10.1016/j.molmet.2013.06.003. [DOI] [PMC free article] [PubMed] [Google Scholar]
- 20.Schäfer SA, Tschritter O, Machicao F, et al. Impaired glucagon-like peptide-1-induced insulin secretion in carriers of transcription factor 7-like 2 (TCF7L2) gene polymorphisms. Diabetologia. 2007;50:2443–2450. doi: 10.1007/s00125-007-0753-6. [DOI] [PMC free article] [PubMed] [Google Scholar]
- 21.Schäfer SA, Müssig K, Staiger H, et al. A common genetic variant in WFS1 determines impaired glucagon-like peptide-1-induced insulin secretion. Diabetologia. 2009;52:1075–1082. doi: 10.1007/s00125-009-1344-5. [DOI] [PubMed] [Google Scholar]
- 22.Müssig K, Staiger H, Machicao F, et al. Association of type 2 diabetes candidate polymorphisms in KCNQ1 with incretin and insulin secretion. Diabetes. 2009;58:1715–1720. doi: 10.2337/db08-1589. [DOI] [PMC free article] [PubMed] [Google Scholar]
- 23.Heni M, Ketterer C, Thamer C, et al. Glycemia determines the effect of type 2 diabetes risk genes on insulin secretion. Diabetes. 2010;59:3247–3252. doi: 10.2337/db10-0674. [DOI] [PMC free article] [PubMed] [Google Scholar]
- 24.Stefan N, Fritsche A, Häring H, Stumvoll M. Effect of experimental elevation of free fatty acids on insulin secretion and insulin sensitivity in healthy carriers of the Pro12Ala polymorphism of the peroxisome proliferator—activated receptor-gamma2 gene. Diabetes. 2001;50:1143–1148. doi: 10.2337/diabetes.50.5.1143. [DOI] [PubMed] [Google Scholar]
- 25.Wagner R, Kaiser G, Gerst F, et al. Reevaluation of fatty acid receptor 1 (FFAR1/GPR40) as drug target for the stimulation of insulin secretion in humans. Diabetes. 2013;62:2106–2111. doi: 10.2337/db12-1249. [DOI] [PMC free article] [PubMed] [Google Scholar]
- 26.Wagner R, Li J, Kenar E, et al. Clinical and non-targeted metabolomic profiling of homozygous carriers of transcription factor 7-like 2 variant rs7903146. Sci Rep. 2014;4:5296. doi: 10.1038/srep05296. [DOI] [PMC free article] [PubMed] [Google Scholar]
- 27.Hribal ML, Presta I, Procopio T, et al. Glucose tolerance, insulin sensitivity and insulin release in European non-diabetic carriers of a polymorphism upstream of CDKN2A and CDKN2B. Diabetologia. 2011;54:795–802. doi: 10.1007/s00125-010-2038-8. [DOI] [PubMed] [Google Scholar]
- 28.Wagner R, Dudziak K, Herzberg-Schäfer SA, et al. Glucose-raising genetic variants in MADD and ADCY5 impair conversion of proinsulin to insulin. PLoS One. 2011;6 doi: 10.1371/journal.pone.0023639. [DOI] [PMC free article] [PubMed] [Google Scholar]
- 29.‘t Hart LM, Simonis-Bik AM, Nijpels G, et al. Combined risk allele score of eight type 2 diabetes genes is associated with reduced first-phase glucose-stimulated insulin secretion during hyperglycemic clamps. Diabetes. 2010;59:287–292. doi: 10.2337/db09-0736. [DOI] [PMC free article] [PubMed] [Google Scholar]
- 30.Haupt A, Guthoff M, Schäfer SA, et al. The inhibitory effect of recent type 2 diabetes risk loci on insulin secretion is modulated by insulin sensitivity. J Clin Endocrinol Metab. 2009;94:1775–1780. doi: 10.1210/jc.2008-1876. [DOI] [PubMed] [Google Scholar]
- 31.Haupt A, Staiger H, Schäfer SA, et al. The risk allele load accelerates the age-dependent decline in beta cell function. Diabetologia. 2009;52:457–462. doi: 10.1007/s00125-008-1250-2. [DOI] [PubMed] [Google Scholar]
- 32.Groenewoud MJ, Dekker JM, Fritsche A, et al. Variants of CDKAL1 and IGF2BP2 affect first-phase insulin secretion during hyperglycaemic clamps. Diabetologia. 2008;51:1659–1663. doi: 10.1007/s00125-008-1083-z. [DOI] [PubMed] [Google Scholar]
- 33.Boesgaard TW, Zilinskaite J, Vänttinen M, et al. The common SLC30A8 Arg325Trp variant is associated with reduced first-phase insulin release in 846 non-diabetic offspring of type 2 diabetes patients—the EUGENE2 study. Diabetologia. 2008;51:816–820. doi: 10.1007/s00125-008-0955-6. [DOI] [PubMed] [Google Scholar]
- 34.Staiger H, Stancáková A, Zilinskaite J, et al. A candidate type 2 diabetes polymorphism near the HHEX locus affects acute glucose-stimulated insulin release in European populations: results from the EUGENE2 study. Diabetes. 2008;57:514–517. doi: 10.2337/db07-1254. [DOI] [PubMed] [Google Scholar]
- 35.Stancáková A, Pihlajamäki J, Kuusisto J, et al. Single-nucleotide polymorphism rs7754840 of CDKAL1 is associated with impaired insulin secretion in nondiabetic offspring of type 2 diabetic subjects and in a large sample of men with normal glucose tolerance. J Clin Endocrinol Metab. 2008;93:1924–1930. doi: 10.1210/jc.2007-2218. [DOI] [PubMed] [Google Scholar]
- 36.Staiger H, Machicao F, Schäfer SA, et al. Polymorphisms within the novel type 2 diabetes risk locus MTNR1B determine beta-cell function. PLoS One. 2008;3 doi: 10.1371/journal.pone.0003962. [DOI] [PMC free article] [PubMed] [Google Scholar]
- 37.Staiger H, Machicao F, Kantartzis K, et al. Novel meta-analysis-derived type 2 diabetes risk loci do not determine prediabetic phenotypes. PLoS One. 2008;3 doi: 10.1371/journal.pone.0003019. [DOI] [PMC free article] [PubMed] [Google Scholar]
- 38.Kirchhoff K, Machicao F, Haupt A, et al. Polymorphisms in the TCF7L2, CDKAL1 and SLC30A8 genes are associated with impaired proinsulin conversion. Diabetologia. 2008;51:597–601. doi: 10.1007/s00125-008-0926-y. [DOI] [PubMed] [Google Scholar]
- 39.Staiger H, Machicao F, Stefan N, et al. Polymorphisms within novel risk loci for type 2 diabetes determine beta-cell function. PLoS One. 2007;2 doi: 10.1371/journal.pone.0000832. [DOI] [PMC free article] [PubMed] [Google Scholar]
- 40.Haupt A, Thamer C, Heni M, et al. Gene variants of TCF7L2 influence weight loss and body composition during lifestyle intervention in a population at risk for type 2 diabetes. Diabetes. 2010;59:747–750. doi: 10.2337/db09-1050. [DOI] [PMC free article] [PubMed] [Google Scholar]
- 41.Heni M, Herzberg-Schäfer S, Machicao F, Häring HU, Fritsche A. Dietary fiber intake modulates the association between variants in TCF7L2 and weight loss during a lifestyle intervention. Diabetes Care. 2012;35 doi: 10.2337/dc11-2012. [DOI] [PMC free article] [PubMed] [Google Scholar]
- 42.Shu L, Sauter NS, Schulthess FT, Matveyenko AV, Oberholzer J, Maedler K. Transcription factor 7-like 2 regulates beta-cell survival and function in human pancreatic islets. Diabetes. 2008;57:645–653. doi: 10.2337/db07-0847. [DOI] [PubMed] [Google Scholar]
- 43.Pilgaard K, Jensen CB, Schou JH, et al. The T allele of rs7903146 TCF7L2 is associated with impaired insulinotropic action of incretin hormones, reduced 24 h profiles of plasma insulin and glucagon, and increased hepatic glucose production in young healthy men. Diabetologia. 2009;52:1298–1307. doi: 10.1007/s00125-009-1307-x. [DOI] [PubMed] [Google Scholar]
- 44.Villareal DT, Robertson H, Bell GI, et al. TCF7L2 variant rs7903146 affects the risk of type 2 diabetes by modulating incretin action. Diabetes. 2010;59:479–485. doi: 10.2337/db09-1169. [DOI] [PMC free article] [PubMed] [Google Scholar]
- 45.Lyssenko V, Lupi R, Marchetti P, et al. Mechanisms by which common variants in the TCF7L2 gene increase risk of type 2 diabetes. J Clin Invest. 2007;117:2155–2163. doi: 10.1172/JCI30706. [DOI] [PMC free article] [PubMed] [Google Scholar]
- 46.Zimdahl H, Ittrich C, Graefe-Mody U, et al. Influence of TCF7L2 gene variants on the therapeutic response to the dipeptidylpeptidase-4 inhibitor linagliptin. Diabetologia. 2014;57:1869–1875. doi: 10.1007/s00125-014-3276-y. [DOI] [PMC free article] [PubMed] [Google Scholar]
- 47.Florez JC, Jablonski KA, Bayley N, et al. TCF7L2 polymorphisms and progression to diabetes in the Diabetes Prevention Program. N Engl J Med. 2006;355:241–250. doi: 10.1056/NEJMoa062418. [DOI] [PMC free article] [PubMed] [Google Scholar]
- 48.Wegner L, Hussain MS, Pilgaard K, et al. Impact of TCF7L2 rs7903146 on insulin secretion and action in young and elderly Danish twins. Clin Endocrinol Metab. 2008;93:4013–4019. doi: 10.1210/jc.2008-0855. [DOI] [PubMed] [Google Scholar]
- 49.Alibegovic AC, Sonne MP, Højbjerre L, et al. The T-allele of TCF7L2 rs7903146 associates with a reduced compensation of insulin secretion for insulin resistance induced by 9 days of bed rest. Diabetes. 2010;59:836–843. doi: 10.2337/db09-0918. [DOI] [PMC free article] [PubMed] [Google Scholar]
- 50.Daniele G, Gaggini M, Comassi M, et al. Glucose metabolism in high-risk subjects for type 2 diabetes carrying the rs7903146 TCF7L2 gene variant. J Clin Endocrinol Metab. 2015;100:E1160–E1167. doi: 10.1210/jc.2015-1172. [DOI] [PubMed] [Google Scholar]
- 51.Le Bacquer O, Kerr-Conte J, Gargani S, et al. TCF7L2 rs7903146 impairs islet function and morphology in non-diabetic individuals. Diabetologia. 2012;55:2677–2681. doi: 10.1007/s00125-012-2660-8. [DOI] [PubMed] [Google Scholar]
- 52.Machann J, Thamer C, Stefan N, et al. Follow-up whole-body assessment of adipose tissue compartments during a lifestyle intervention in a large cohort at increased risk for type 2 diabetes. Radiology. 2010;257:353–363. doi: 10.1148/radiol.10092284. [DOI] [PubMed] [Google Scholar]
- 53.Thamer C, Machann J, Staiger H, et al. Interscapular fat is strongly associated with insulin resistance. J Clin Endocrinol Metab. 2010;95:4736–4742. doi: 10.1210/jc.2009-1942. [DOI] [PubMed] [Google Scholar]
- 54.Rittig K, Staib K, Machann J, et al. Perivascular fatty tissue at the brachial artery is linked to insulin resistance but not to local endothelial dysfunction. Diabetologia. 2008;51:2093–2099. doi: 10.1007/s00125-008-1128-3. [DOI] [PubMed] [Google Scholar]
- 55.Stefan N, Kantartzis K, Machann J, et al. Identification and characterization of metabolically benign obesity in humans. Arch Intern Med. 2008;168:1609–1616. doi: 10.1001/archinte.168.15.1609. [DOI] [PubMed] [Google Scholar]
- 56.Kantartzis K, Machann J, Schick F, et al. Effects of a lifestyle intervention in metabolically benign and malign obesity. Diabetologia. 2011;54:864–868. doi: 10.1007/s00125-010-2006-3. [DOI] [PubMed] [Google Scholar]
- 57.Stefan N, Häring HU, Hu FB, Schulze MB. Metabolically healthy obesity: epidemiology, mechanisms, and clinical implications. Lancet Diabetes Endocrinol. 2013;1:152–162. doi: 10.1016/S2213-8587(13)70062-7. [DOI] [PubMed] [Google Scholar]
- 58.Stefan N, Häring HU. The metabolically benign and malignant fatty liver. Diabetes. 2011;60:2011–2017. doi: 10.2337/db11-0231. [DOI] [PMC free article] [PubMed] [Google Scholar]
- 59.Romeo S, Kozlitina J, Xing C, et al. Genetic variation in PNPLA3 confers susceptibility to nonalcoholic fatty liver disease. Nat Genet. 2008;40:1461–1465. doi: 10.1038/ng.257. [DOI] [PMC free article] [PubMed] [Google Scholar]
- 60.Kantartzis K, Peter A, Machicao F, et al. Dissociation between fatty liver and insulin resistance in humans carrying a variant of the patatin-like phospholipase 3 gene. Diabetes. 2009;58:2616–2623. doi: 10.2337/db09-0279. [DOI] [PMC free article] [PubMed] [Google Scholar]
- 61.Peter A, Kovarova M, Nadalin S, et al. PNPLA3 variant I148M is associated with altered hepatic lipid composition in humans. Diabetologia. 2014;57:2103–2107. doi: 10.1007/s00125-014-3310-0. [DOI] [PubMed] [Google Scholar]
- 62.Kovarova M, Königsrainer I, Königsrainer A, et al. The genetic variant I148M in PNPLA3 is associated with increased hepatic retinyl-palmitate storage in humans. J Clin Endocrinol Metab. 2015;100:E1568–E1574. doi: 10.1210/jc.2015-2978. [DOI] [PubMed] [Google Scholar]
- 63.Stefan N, Häring HU. The role of hepatokines in metabolism. Nat Rev Endocrinol. 2013;9:144–152. doi: 10.1038/nrendo.2012.258. [DOI] [PubMed] [Google Scholar]
- 64.Stefan N, Häring HU. Circulating fetuin-A and free fatty acids interact to predict insulin resistance in humans. Nat Med. 2013;19:394–395. doi: 10.1038/nm.3116. [DOI] [PubMed] [Google Scholar]
- 65.Stefan N, Schick F, Häring HU. Ectopic fat in insulin resistance, dyslipidemia, and cardiometabolic disease. N Engl J Med. 2014;371:2236–2237. doi: 10.1056/NEJMc1412427. [DOI] [PubMed] [Google Scholar]
- 66.Stefan N, Fritsche A, Weikert C, et al. Plasma fetuin-A levels and the risk of type 2 diabetes. Diabetes. 2008;57:2762–2767. doi: 10.2337/db08-0538. [DOI] [PMC free article] [PubMed] [Google Scholar]
- 67.Weikert C, Stefan N, Schulze MB, et al. Plasma fetuin-a levels and the risk of myocardial infarction and ischemic stroke. Circulation. 2008;118:2555–2562. doi: 10.1161/CIRCULATIONAHA.108.814418. [DOI] [PubMed] [Google Scholar]
- 68.Dasgupta S, Bhattacharya S, Biswas A, et al. NF-kB mediates lipid-induced fetuin-A expression in hepatocytes that impairs adipocyte function effecting insulin resistance. Biochem J. 2010;429:451–462. doi: 10.1042/BJ20100330. [DOI] [PubMed] [Google Scholar]
- 69.Takata H, Ikeda Y, Suehiro T, et al. High glucose induces transactivation of the alpha2-HS glycoprotein gene through the ERK1/2 signaling pathway. J Atheroscler Thromb. 2009;16:448–456. doi: 10.5551/jat.No950. [DOI] [PubMed] [Google Scholar]
- 70.Lee J, Hong SW, Park SE, et al. Exendin-4 inhibits the expression of SEPP1 and fetuin-A via improvement of palmitic acid-induced endoplasmic reticulum stress by AMPK. Endocrinol Metab (Seoul) 2015;2015:177–184. doi: 10.3803/EnM.2015.30.2.177. [DOI] [PMC free article] [PubMed] [Google Scholar]
- 71.Srinivas PR, Wagner AS, Reddy LV, et al. Serum alpha 2-HS-glycoprotein is an inhibitor of the human insulin receptor at the tyrosine kinase level. Mol Endocrinol. 1993;7:1445–1455. doi: 10.1210/mend.7.11.7906861. [DOI] [PubMed] [Google Scholar]
- 72.Siegel-Axel DI, Ullrich S, Stefan N, et al. Fetuin-A influences vascular cell growth and production of proinflammatory and angiogenic proteins by human perivascular fat cells. Diabetologia. 2014;57:1057–1066. doi: 10.1007/s00125-014-3177-0. [DOI] [PubMed] [Google Scholar]
- 73.Pal D, Dasgupta S, Kundu R, et al. Fetuin-A acts as an endogenous ligand of TLR4 to promote lipid-induced insulin resistance. Nat Med. 2012;18:1279–1285. doi: 10.1038/nm.2851. [DOI] [PubMed] [Google Scholar]
- 74.Yudkin JS, Eringa E, Stehouwer CD. “Vasocrine” signalling from perivascular fat: a mechanism linking insulin resistance to vascular disease. Lancet. 2005;365:1817–1820. doi: 10.1016/S0140-6736(05)66585-3. [DOI] [PubMed] [Google Scholar]
- 75.Meijer RI, Serne EH, Smulders YM, van Hinsbergh VW, Yudkin JS, Eringa EC. Perivascular adipose tissue and its role in type 2 diabetes and cardiovascular disease. Curr Diab Rep. 2011;11:211–217. doi: 10.1007/s11892-011-0186-y. [DOI] [PMC free article] [PubMed] [Google Scholar]
- 76.Rittig K, Dolderer JH, Balletshofer B, et al. The secretion pattern of perivascular fat cells is different from that of subcutaneous and visceral fat cells. Diabetologia. 2012;55:1514–1525. doi: 10.1007/s00125-012-2481-9. [DOI] [PubMed] [Google Scholar]
- 77.Wagner R, Machann J, Lehmann R, et al. Exercise-induced albuminuria is associated with perivascular renal sinus fat in individuals at increased risk of type 2 diabetes. Diabetologia. 2012;55:2054–2058. doi: 10.1007/s00125-012-2551-z. [DOI] [PubMed] [Google Scholar]
- 78.Stefan N, Artunc F, Heyne N, Machann J, Schleicher ED, Häring HU. Obesity and renal disease: not all fat is created equal and not all obesity is harmful to the kidneys. Nephrol Dial Transplant. 2016;31:726–730. doi: 10.1093/ndt/gfu081. [DOI] [PubMed] [Google Scholar]
- 79.Heni M, Machann J, Staiger H, et al. Pancreatic fat is negatively associated with insulin secretion in individuals with impaired fasting glucose and/or impaired glucose tolerance: a nuclear magnetic resonance study. Diabetes Metab Res Rev. 2010;26:200–205. doi: 10.1002/dmrr.1073. [DOI] [PubMed] [Google Scholar]
- 80.Stefan N, Sun Q, Fritsche A, et al. Impact of the adipokine adiponectin and the hepatokine fetuin-A on the development of type 2 diabetes: prospective cohort- and cross-sectional phenotyping studies. PLoS One. 2014;9 doi: 10.1371/journal.pone.0092238. [DOI] [PMC free article] [PubMed] [Google Scholar]
- 81.Silbernagel G, Kovarova M, Cegan A, et al. High hepatic SCD1 activity is associated with low liver fat content in healthy subjects under a lipogenic diet. J Clin Endocrinol Metab. 2012;97:E2288–E2292. doi: 10.1210/jc.2012-2152. [DOI] [PubMed] [Google Scholar]
- 82.Browning JD, Baker JA, Rogers T, Davis J, Satapati S, Burgess SC. Short-term weight loss and hepatic triglyceride reduction: evidence of a metabolic advantage with dietary carbohydrate restriction. Am J Clin Nutr. 2011;93:1048–1052. doi: 10.3945/ajcn.110.007674. [DOI] [PMC free article] [PubMed] [Google Scholar]
- 83.Ryan MC, Abbasi F, Lamendola C, Carter S, McLaughlin T. Serum alanine aminotransferase levels decrease further with carbohydrate than fat restriction in insulin-resistant adults. Diabetes Care. 2007;30:1075–1080. doi: 10.2337/dc06-2169. [DOI] [PubMed] [Google Scholar]
- 84.Utzschneider KM, Bayer-Carter JL, Arbuckle MD, Tidwell JM, Richards TL, Craft S. Beneficial effect of a weight-stable, low fat/ low-saturated fat/low-glycaemic index diet to reduce liver fat in older subjects. Br J Nutr. 2013;109:1096–1104. doi: 10.1017/S0007114512002966. [DOI] [PMC free article] [PubMed] [Google Scholar]
- 85.Cussons AJ, Watts GF, Mori TA, Stuckey BG. Omega-3 fatty acid supplementation decreases liver fat content in polycystic ovary syndrome: a randomized controlled trial employing proton magnetic resonance spectroscopy. J Clin Endocrinol Metab. 2009;94:3842–3848. doi: 10.1210/jc.2009-0870. [DOI] [PubMed] [Google Scholar]
- 86.Scorletti E, Bhatia L, McCormick KG, et al. Effects of purified eicosapentaenoic and docosahexaenoic acids in nonalcoholic fatty liver disease: results from the Welcome study. Hepatology. 2014;60:1211–1221. doi: 10.1002/hep.27289. [DOI] [PubMed] [Google Scholar]
- 87.Stefan N, Machicao F, Staiger H, et al. Polymorphisms in the gene encoding adiponectin receptor 1 are associated with insulin resistance and high liver fat. Diabetologia. 2005;48:2282–2291. doi: 10.1007/s00125-005-1948-3. [DOI] [PubMed] [Google Scholar]
- 88.Thamer C, Machann J, Stefan N, et al. Variations in PPARD determine the change in body composition during lifestyle intervention: a whole-body magnetic resonance study. J Clin Endocrinol Metab. 2008;93:1497–1500. doi: 10.1210/jc.2007-1209. [DOI] [PubMed] [Google Scholar]
- 89.Hawley JA, Hargreaves M, Joyner MJ, Zierath JR. Integrative biology of exercise. Cell. 2014;159:738–749. doi: 10.1016/j.cell.2014.10.029. [DOI] [PubMed] [Google Scholar]
- 90.Osler ME, Fritz T, Caidahl K, et al. Changes in gene expression in responders and nonresponders to a low-intensity walking intervention. Diabetes Care. 2015;38:1154–1160. doi: 10.2337/dc14-2606. [DOI] [PubMed] [Google Scholar]
- 91.Kantartzis K, Thamer C, Peter A, et al. High cardiorespiratory fitness is an independent predictor of the reduction in liver fat during a lifestyle intervention in non-alcoholic fatty liver disease. Gut. 2009;58:1281–1288. doi: 10.1136/gut.2008.151977. [DOI] [PubMed] [Google Scholar]
- 92.Böhm A, Weigert C, Staiger H, Häring HU. Exercise and diabetes: relevance and causes for response variability. Endocrine. 2016;51:390–401. doi: 10.1007/s12020-015-0792-6. [DOI] [PMC free article] [PubMed] [Google Scholar]
- 93.Stephens NA, Xie H, Johannsen NM, Church TS, Smith SR, Sparks LM. A transcriptional signature of ‘exercise resistance’ in skeletal muscle of individuals with type 2 diabetes mellitus. Metabolism. 2015;64:999–1004. doi: 10.1016/j.metabol.2015.06.008. [DOI] [PMC free article] [PubMed] [Google Scholar]
- 94.Boulé NG, Weisnagel SJ, Lakka TA, et al. Effects of exercise training on glucose homeostasis: the HERITAGE Family Study. Diabetes Care. 2005;28:108–114. doi: 10.2337/diacare.28.1.108. [DOI] [PubMed] [Google Scholar]
- 95.Hoene M, Runge H, Häring HU, Schleicher ED, Weigert C. Interleukin-6 promotes myogenic differentiation of mouse skeletal muscle cells: role of the STAT3 pathway. Am J Physiol Cell Physiol. 2013;304:C128–C136. doi: 10.1152/ajpcell.00025.2012. [DOI] [PubMed] [Google Scholar]
- 96.Scheler M, Irmler M, Lehr S, et al. Cytokine response of primary human myotubes in an in vitro exercise model. Am J Physiol Cell Physiol. 2013;305:C877–C886. doi: 10.1152/ajpcell.00043.2013. [DOI] [PubMed] [Google Scholar]
- 97.Hansen JS, Zhao X, Irmler M, et al. Type 2 diabetes alters metabolic and transcriptional signatures of glucose and amino acid metabolism during exercise and recovery. Diabetologia. 2015;58:1845–1854. doi: 10.1007/s00125-015-3584-x. [DOI] [PubMed] [Google Scholar]
- 98.Weigert C, Lehmann R, Hartwig S, Lehr S. The secretome of the working human skeletal muscle—a promising opportunity to combat the metabolic disaster? Proteomics Clin Appl. 2014;8:5–18. doi: 10.1002/prca.201300094. [DOI] [PubMed] [Google Scholar]
- 99.Havrankova J, Brownstein M, Roth J. Insulin and insulin receptors in rodent brain. Diabetologia. 1981;20(Suppl):268–273. doi: 10.1007/BF00254492. [DOI] [PubMed] [Google Scholar]
- 100.Havrankova J, Roth J, Brownstein M. Insulin receptors are widely distributed in the central nervous system of the rat. Nature. 1978;272:827–829. doi: 10.1038/272827a0. [DOI] [PubMed] [Google Scholar]
- 101.Brüning JC, Gautam D, Burks DJ, et al. Role of brain insulin receptor in control of body weight and reproduction. Science. 2000;289:2122–2125. doi: 10.1126/science.289.5487.2122. [DOI] [PubMed] [Google Scholar]
- 102.Okamoto H, Nakae J, Kitamura T, Park BC, Dragatsis I, Accili D. Transgenic rescue of insulin receptor-deficient mice. J Clin Invest. 2004;114:214–223. doi: 10.1172/JCI200421645. [DOI] [PMC free article] [PubMed] [Google Scholar]
- 103.Lin X, Taguchi A, Park S, et al. Dysregulation of insulin receptor substrate 2 in beta cells and brain causes obesity and diabetes. J Clin Invest. 2004;114:908–916. doi: 10.1172/JCI22217. [DOI] [PMC free article] [PubMed] [Google Scholar]
- 104.Tschritter O, Preissl H, Hennige AM, et al. The cerebrocortical response to hyperinsulinemia is reduced in overweight humans: a magnetoencephalographic study. Proc Natl Acad Sci U S A. 2006;103:12103–12108. doi: 10.1073/pnas.0604404103. [DOI] [PMC free article] [PubMed] [Google Scholar]
- 105.Heni M, Kullmann S, Preissl H, Fritsche A, Häring HU. Impaired insulin action in the human brain: causes and metabolic consequences. Nat Rev Endocrinol. 2015;11:701–711. doi: 10.1038/nrendo.2015.173. [DOI] [PubMed] [Google Scholar]
- 106.Kullmann S, Heni M, Veit R, et al. Selective insulin resistance in homeostatic and cognitive control brain areas in overweight and obese adults. Diabetes Care. 2015;38:1044–1050. doi: 10.2337/dc14-2319. [DOI] [PubMed] [Google Scholar]
- 107.Heni M, Wagner R, Kullmann S, et al. Central insulin administration improves whole-body insulin sensitivity via hypothalamus and parasympathetic outputs in men. Diabetes. 2014;63:4083–4088. doi: 10.2337/db14-0477. [DOI] [PubMed] [Google Scholar]
- 108.Guthoff M, Grichisch Y, Canova C, et al. Insulin modulates food-related activity in the central nervous system. J Clin Endocrinol Metab. 2010;95:748–755. doi: 10.1210/jc.2009-1677. [DOI] [PubMed] [Google Scholar]
- 109.Grichisch Y, Çavuşoğlu M, Preissl H, et al. Differential effects of intranasal insulin and caffeine on cerebral blood flow. Hum Brain Mapp. 2012;33:280–287. doi: 10.1002/hbm.21216. [DOI] [PMC free article] [PubMed] [Google Scholar]
- 110.Heni M, Kullmann S, Ketterer C, et al. Nasal insulin changes peripheral insulin sensitivity simultaneously with altered activity in homeostatic and reward-related human brain regions. Diabetologia. 2012;55:1773–1782. doi: 10.1007/s00125-012-2528-y. [DOI] [PubMed] [Google Scholar]
- 111.Kullmann S, Frank S, Heni M, et al. Intranasal insulin modulates intrinsic reward and prefrontal circuitry of the human brain in lean women. Neuroendocrinology. 2013;97:176–182. doi: 10.1159/000341406. [DOI] [PubMed] [Google Scholar]
- 112.Tschritter O, Preissl H, Hennige AM, et al. High cerebral insulin sensitivity is associated with loss of body fat during lifestyle intervention. Diabetologia. 2012;55:175–178. doi: 10.1007/s00125-011-2309-z. [DOI] [PubMed] [Google Scholar]
- 113.Scherer T, Lindtner C, O’Hare J, et al. Insulin regulates hepatic triglyceride secretion and lipid content via signaling in the brain. Diabetes. 2016 doi: 10.2337/db15-1552. [DOI] [PMC free article] [PubMed] [Google Scholar]
- 114.Kleinridders A, Ferris HA, Cai W, Kahn CR. Insulin action in brain regulates systemic metabolism and brain function. Diabetes. 2014;63:2232–2243. doi: 10.2337/db14-0568. [DOI] [PMC free article] [PubMed] [Google Scholar]
- 115.Pocai A, Lam TK, Gutierrez-Juarez R, et al. Hypothalamic K(ATP) channels control hepatic glucose production. Nature. 2005;434:1026–1031. doi: 10.1038/nature03439. [DOI] [PubMed] [Google Scholar]
- 116.Obici S, Feng Z, Karkanias G, Baskin DG, Rossetti L. Decreasing hypothalamic insulin receptors causes hyperphagia and insulin resistance in rats. Nat Neurosci. 2002;5:566–572. doi: 10.1038/nn0602-861. [DOI] [PubMed] [Google Scholar]
- 117.Gancheva S, Koliaki C, Bierwagen A, et al. Effects of intranasal insulin on hepatic fat accumulation and energy metabolism in humans. Diabetes. 2015;64:1966–1975. doi: 10.2337/db14-0892. [DOI] [PubMed] [Google Scholar]
- 118.Linder K, Schleger F, Ketterer C, et al. Maternal insulin sensitivity is associated with oral glucose-induced changes in fetal brain activity. Diabetologia. 2014;57:1192–1198. doi: 10.1007/s00125-014-3217-9. [DOI] [PubMed] [Google Scholar]
- 119.Linder K, Schleger F, Kiefer-Schmidt I, et al. Gestational diabetes impairs human fetal postprandial brain activity. J Clin Endocrinol Metab. 2015;100:4029–4036. doi: 10.1210/jc.2015-2692. [DOI] [PubMed] [Google Scholar]


