Abstract
Accelerated insertion of nanocomposites into advanced applications is predicated on the ability to perform a priori property predictions on the resulting materials. In this paper, a paradigm for the virtual design of spherical nanoparticle-filled polymers is demonstrated. A key component of this “Materials Genomics” approach is the development and use of Materials Quantitative Structure-Property Relationship (MQSPR) models trained on atomic-level features of nanofiller and polymer constituents and used to predict the polar and dispersive components of their surface energies. Surface energy differences are then correlated with the nanofiller dispersion morphology and filler/matrix interface properties and integrated into a numerical analysis approach that allows the prediction of thermomechanical properties of the spherical nanofilled polymer composites. Systematic experimental studies of silica nanoparticles modified with three different surface chemistries in polystyrene (PS), poly(methyl methacrylate) (PMMA), poly(ethyl methacrylate) (PEMA) and poly(2-vinyl pyridine) (P2VP) are used to validate the models. While demonstrated here as effective for the prediction of meso-scale morphologies and macro-scale properties under quasi-equilibrium processing conditions, the protocol has far ranging implications for Virtual Design.
1. Introduction
The holy grail of materials science and engineering is the ability to predict the properties of materials a priori—a goal recently elevated to a Grand Challenge by the Materials Genome Initiative.[1] A set of computational tools for a priori prediction would allow for virtual exploration of new materials and circumvent the experimental Edisonian approach that currently dominates materials development and deployment. The most rigorous approach to a priori property prediction is multiscale modeling beginning with ab initio models at the atomic and molecular level that are connected across multiple length scales using models that preserve the dominant physics at each length scale. Developing and implementing pure physics-based scale-bridging methods is, however, fraught with difficulty and limited by both the availability of computational power and appropriate scale linking algorithms. An alternative approach to bridging length scales is to use heuristic Materials Quantitative Structure Property Relationships (MQSPR) methods that are trained using a set of descriptors (grounded in the physics appropriate to the smaller length scale) to characterize the fundamental controlling features critical to the prediction of behavior at a larger scale.[2] Heuristic techniques have been shown, previously, to be very powerful in chemistry and biology for predicting, for example, the behavior of drug-like molecules as potential therapeutic agents.[3,4]
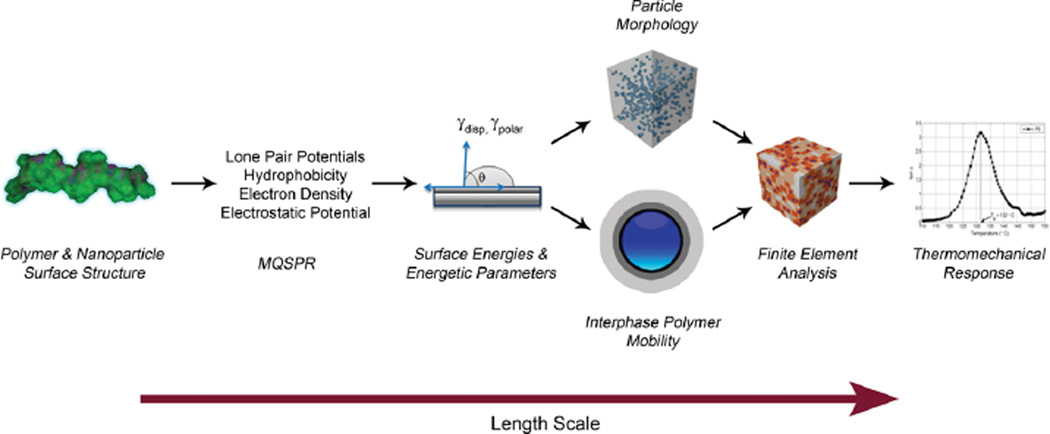
In this work, we use a heuristic informatics-based approach (MQSPR) coupled with physics-based continuum models and experimental validation to predict the thermomechanical properties of silane-modified spherical nanoparticle filled polymers (nanocomposites) as illustrated in Figure 1. This effort represents the first time that MQSPR methods have been used to fully connect a set of length scales, and presents a tremendous opportunity to predict bulk nanocomposite properties that are related ultimately to the fundamental underlying chemistry of the polymer and nanoparticle surfaces and the nanoparticle dispersion state.
Figure 1.
A schematic showing the genomics approach to predicting the thermomechanical response. From left to right shows: MQSPR is used to relate the polymer and nanoparticle surface structure to the polar and dispersive components of the polymer and nanoparticle surface energy. The surface energies are then used to quantitatively predict the dispersion state of the nanoparticles and the properties of the filler/polymer interface. Using Finite Element Analysis (FEA), the microstructure is reconstructed and the filler, polymer, and interphase properties used as input. The FEA provides an a-priori prediction of the thermomechanical properties from MQSPR calculated surface energies.
The hypothesis driving this strategy is that the dispersion and distribution of the nanofillers as well as the mobility of the polymer chains near the nanoparticles (“filler” and “particle” are interchangeably used) can each be predicted beginning with the polar and dispersive components of the surface energies of the polymer and functionalized nanofillers. From knowledge of the dispersion and distribution of the nanofillers, as well as the relaxation times of the polymers in the nanoparticle/matrix interfacial region, a 3D continuum model can be used to predict the thermomechanical response of the resulting nanocomposites. There is significant qualitative support in the literature for such a strategy,[5–9] and important components of this approach have been shown to be quantitatively correct, such as the relationship between glass transition temperature (Tg) and dispersion.[10,11]
2. Results and Discussion
2.1. MQSPR to Predict Polymer and Nanoparticle Surface Energies
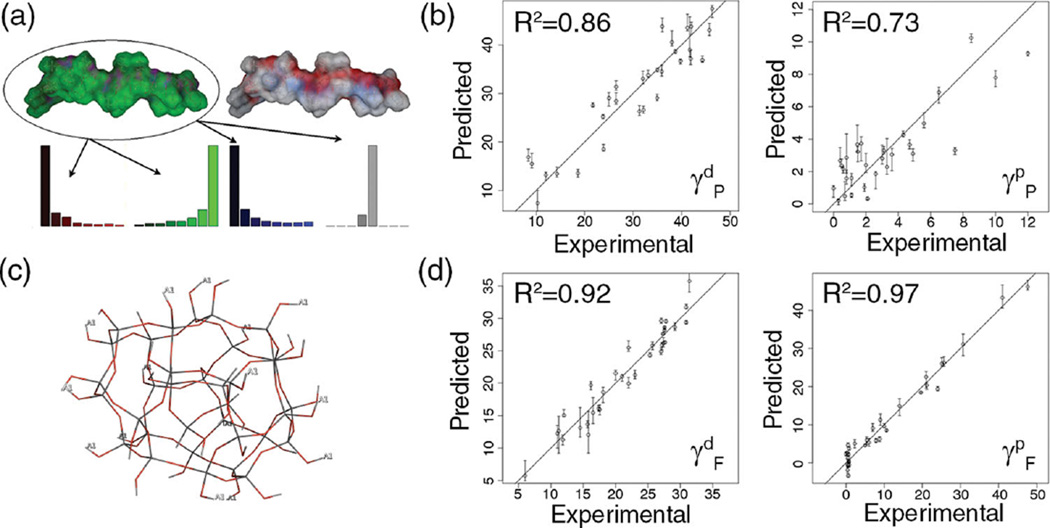
The first critical jump in length scale within this a priori prediction approach involves calculating surface energies for each polymer and functionalized nanoparticle using heuristic MQSPR models based on the chemical properties of the constituents rather than using ab initio computations to evaluate each new case. Carefully curated literature data for the polar and dispersive components of surface energy of 30 polymers[12–22] and 33 functionalized silica surfaces,[23–25] all obtained by the contact angle method and geometric mean formulation[26] were used to train and validate the surface energy MQSPR models using Multiple Linear Regression (MLR), Partial Least-Squares (PLS), or Support Vector Machine (SVM) regression, based on “best practices” methods in machine learning and model validation.[3] The model with the best performance was then selected for use in the modeling workflow system. The descriptors used in the polymer MQSPR models are based on electron density distribution topology as well as the distribution of Electrostatic Potential (EP) and Active Lone Pair (ALP) potential on the molecular van der Waals surfaces evaluated using MOE (Molecular Operating Environment) software (Figure 2a). The molecular surface property histogram descriptors that result have been shown in previous studies to effectively represent both the electrostatic and hydrophobic characteristics that correlate with surface energies.[27] Descriptors used in filler MQSPR models included surface property histograms to represent the polar component of surface energy, and the i3D suite of descriptors bundled with MOE software to model the dispersive component (excluding semi-empirical AM1, PM3, and MNDO descriptors). For filler descriptor calculations, filler beads were modeled as spherical filled silica shells with outward-facing–OH groups functionalized at an approximate density of 1/nm2 (Figure 2c).
Figure 2.
a) Histogram descriptors for a 20-mer energy-minimized structure of poly(n-butyl acrylate), b) Correlation between experimental data and predicted data by bootstrap aggregate MQSPR model for polymers. Left: Dispersion. Right: Polar. c) Depiction of silica scaffold used to model filler particles. Hydrogens labeled with A1 indicate functional group attachment locations. d) Correlation between experimental data and predicted data by bootstrap aggregate MQSPR model for filler particles. Left: Dispersion. Right: Polar.
All models were validated using a 10×10 bootstrap scheme. Three key findings resulting from the polymer matrix MQSPR modeling were observed: 1) End-capped 20-mers (N=20) were found to be optimal for producing polymer descriptors appropriate for predicting surface energies (balancing accuracy with computational time). As described in the Supporting Information, different oligomeric sizes scales were tested to identify the smallest system that could consistently represent the properties of the polymer. In these studies, despite their slight conformational sensitivity, EP and ALP surface property descriptors were found to converge as N increases. 2) Surface distribution of EP was found to be most important in correlating with the polar component of the polymer surface energy. 3) EP, ALP and surface electron density distrbution topology descriptors (RECON/TAE descriptors) were found to represent the dispersive component of the surface energy. Figure 2b shows the correlation between results predicted by bootstrap aggregate MQSPR models for the polar (left) and dispersive (right) components of the polymers compared to reported literature values. Note that while the model predicting the dispersive component performs better than the current version of the polar component model, these models can nevertheless be applied to any polymer construct. Corresponding findings from filler MQSPR modeling were: 1) Representing filler particles as functionalized spheres allows the underlying silica to influence their surface properties, effectively mimicking the planar silica used in surface energy experiments.[23–25] 2) As with polymer modeling, EP and ALP distributions were found to best predict the polar component of surface energy. 3) MOE i3D descriptors were used to model the dispersive component of surface energy. Figure 2d is analogous to Figure 2b for filler particles.
2.2. Property Prediction Hypothesis
The hybrid predictive modeling approach presented here is predicated on the hypothesis that the relative nanoparticle and polymer surface energy components control both nanoparticle dispersion and polymer chain mobility near the nanoparticle.[8, 28–30] In this work, we have built on that hypothesis and developed quantitative correlations that prove its utility. We note that there are three interfacial parameters that can be calculated from the surface energies of the interacting species that are used in discussions of dispersion and mobility: The equilibrium contact angle, θ, the relative work of adhesion, ΔWa, and the work of spreading, Ws.
The contact angle (θ) can be calculated using Equation (1), which is based on a modification of Young’s equation[26] and assumes that the polar and dispersive components of the surface energy approximately make additive contributions to the total surface energy of a system, and that the interaction magnitude between two dissimilar materials can be approximated by the geometric mean of their surface tension components.[31,32] While more sophisticated approximations for surface energies have emerged in recent years,[33,34] this approach is commonly used, and given other uncertainties in this study, is accurate enough to be powerful in predicting the response.
| (1) |
where and are the dispersive components of the filler and polymer surface energies (respectively); and are the polar components of the filler and polymer surface energies (respectively); and γF is the total filler surface energy, which is given by the sum of and , as per Fowkes approximation. WPF is the work of adhesion of polymer to filler and WFF is the work of adhesion of filler to filler (2γF). We note, from Equation (1), that the ratio of these terms controls the contact angle. We also note that while WPF/WFF can take a continuous range of values, θ is truncated to 0°, for WPF/WFF values greater than or equal to 1. The relative work of adhesion, which is a representation of the potential energy change of forming a filler/filler and a polymer/polymer interface from two filler/polymer interfaces, can be calculated using Equation (2).[35]
| (2) |
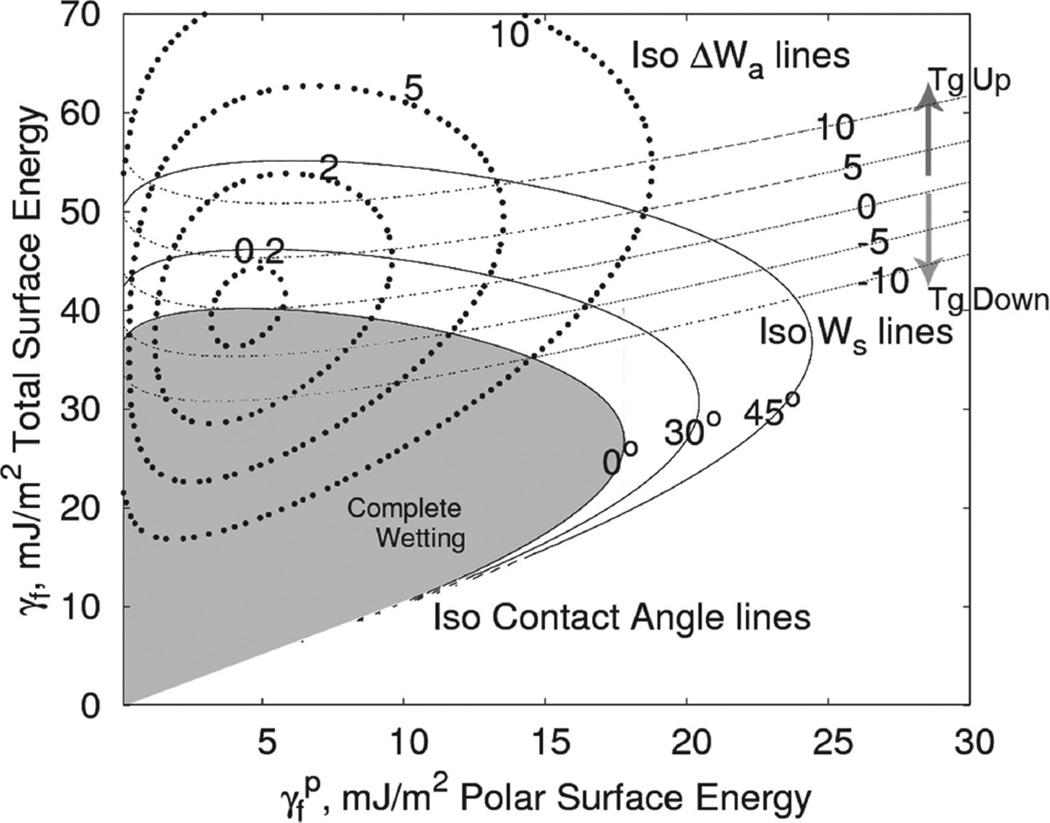
We hypothesize that we can use these two equations to predict dispersion. Figure 3 illustrates the domains of the energetic parameters for Poly(Methyl Methacrylate) (PMMA) for all possible filler surface energies. As suggested by Stöckelhuber,[6,7] composites that fall within the complete wetting envelope and have a small relative work of adhesion will have a good intial dispersion that remains good during high-temperature processing. Composites that fall outside the wetting envelope (θ > 0°) are all poorly dispersed. This framework is consistent with the findings of Starr et al.,[9] who noted that the dominant enthalpic factor in dispersion was the ratio between the interaction strength of the matrix and particle and the interaction strength between the particle and particle i.e., a stronger particle-matrix interaction leads to better dispersions. This interaction strength ratio is qualitatively similar to the work of adhesion ratio (WPF/WFF), which defines cosθ as seen in Equation (1). Considering these domains, if the contact angle is greater than zero, the initial agglomerates will be large. Further agglomeration during annealing will be difficult even if the relative work of adhesion is high, since the diffusion constant of agglomerates varies inversely with cluster size.[35] However, if θ = 0°, ΔWa controls the degree of reagglomeration during annealing. Larger ΔWa will lead to more re-agglomeration.
Figure 3.
A plot of total surface energy as a function of the polar component of the surface energy for PMMA with isocontact angle, iso-work of adhesion and iso-work of spreading lines delineated.
Turning now to the interface properties, it has been hypothesized[36] that the mobility of the polymer chains in the interface is related to the work of spreading (Equation (3)).
| (3) |
As indicated in Figure 3, for all fillers with surface energies below the threshold Ws = 0 line the mobility increases, and thus we hypothesize that the Tg will decrease. Above this threshold the opposite holds. The amount of mobility change in the interphase is affected by Ws, whereas the amount of interphase present (and thus to a large extent the impact of that change in mobility) depends on the dispersion state.
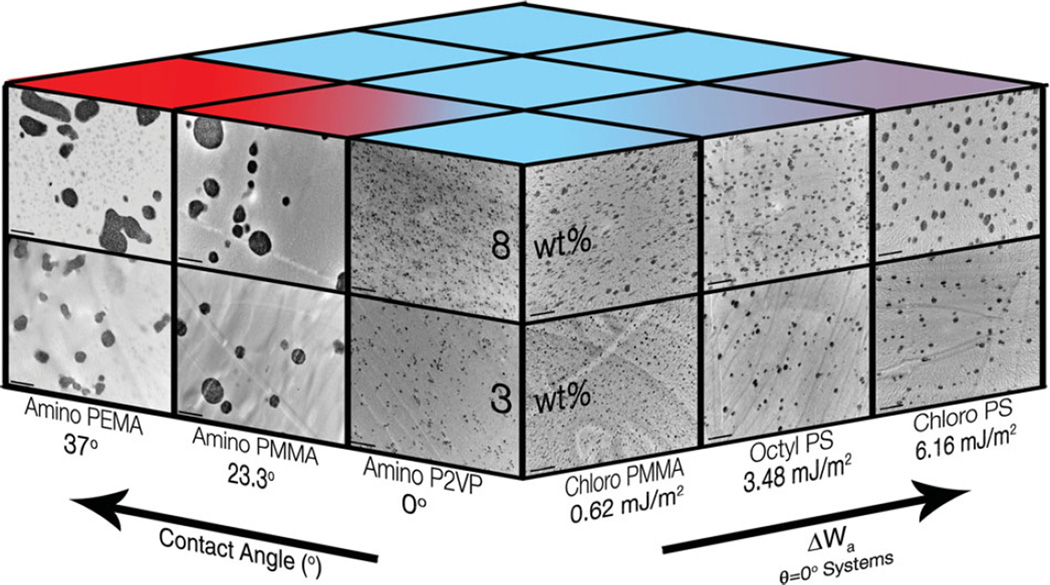
In order to test the aforementioned hypotheses and to train and validate our model linking dispersion and interface mobility to energetic parameters, we perform systematic experiments on a set of nanocomposites with a wide range of particlepolymer interactions. Octyldimethylmethoxysilane, chloropropyldimethylethoxysilane and aminopropyldimethylethoxysilane modified 14 nm silica nanoparticles are embedded in polystyrene (PS), PMMA, poly(ethyl methacrylate) (PEMA) and poly(2-vinyl pyridine) (P2VP). The details of sample preparation, surface energy measurement and characterization are presented in the supporting information. The results in Figure 4, illustrate the role of θ and ΔWa in determining dispersion. It is seen that, as θ increases above 0° the dispersion abruptly becomes poor (Amino-Silica/P2VP to Amino-Silica/PEMA). In the wetting systems (θ = 0°) the dispersion is found to vary with ΔWa. This observation suggests that the proposed property prediction hypothesis is qualitatively true.
Figure 4.
A representative schematic showing the effect of the Contact Angle and ΔWa on dispersion. An increasing θ is shown to significantly decrease the quality of dispersion. In the wetting systems an increasing ΔWa is found to cause agglomeration. The inset TEM micrographs were obtained at a magnification of 20 000×. The scale bars represent 1 µm. We note that the θ and ΔWa values indicated are calculated from the literature and experimentally measured surface energy values for polymer and particles respectively.
2.3. Mesoscale to Continuum
The second critical jump in length scale is to use the polar and dispersive surface energy components of polymer and nanoparticle, predicted by MQSPR, to create a continuum level model of composite properties providing a priori prediction of the bulk properties of a polymer nanocomposite. The essential features of the continuum approach are: 1) A 3D representation of nanoparticle dispersion and distribution determined by θ and ΔWa, 2) a gradient interphase region surrounding the nanoparticles, which has relaxation times different from the bulk polymer that are correlated with the work of spreading, Ws, and 3) a predictive finite element viscoelastic model shown to be very effective in other systems.[11, 37] Since dispersion is a controlling factor for bulk properties, we do not use analytical homogenization for continuum predictions. For these trial correlations, we use the surface energies of the polymer and nanoparticle calculated using our MQSPR approach.
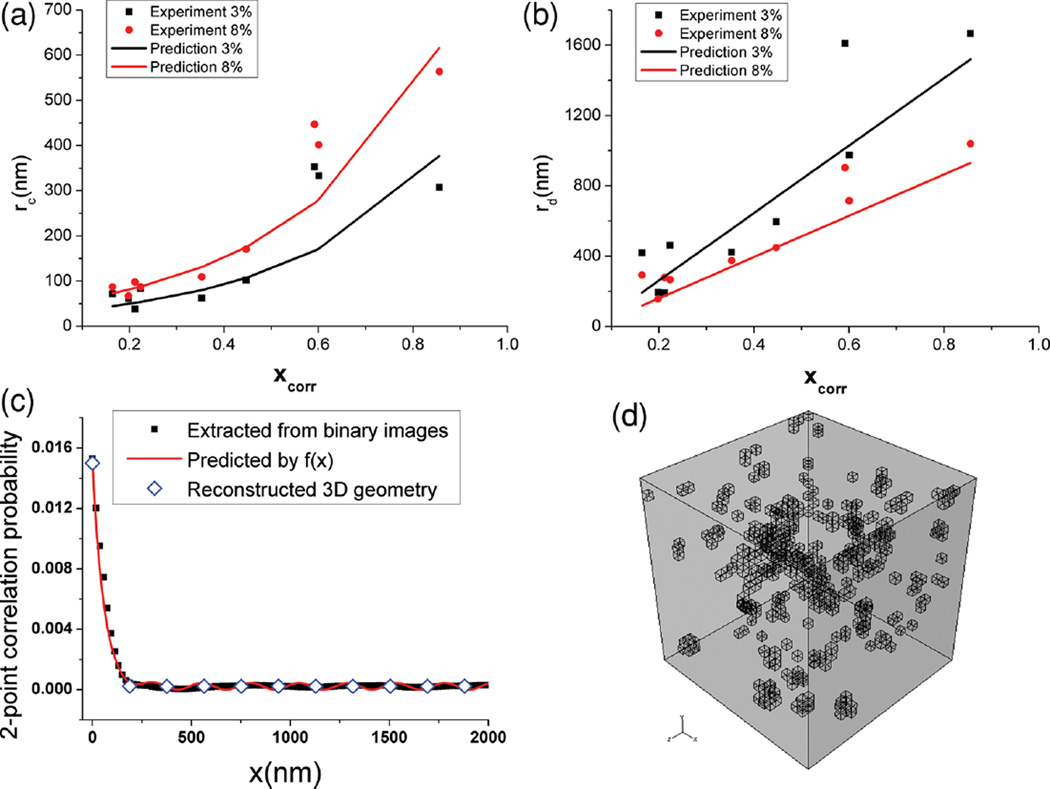
Dispersion of fillers within the composites can be characterized using morphological descriptors, such as mean radius of the fillers or filler aggregates (rc) and mean distance between nearest neighbor fillers (rd).[37–42] These parameters can also be used to reconstruct a statistically equivalent microstructure for the simulation process using an emperically determined two-point correlation function, where the probability that two arbitrary points belonging to the same phase is expressed as a function of the relative distance between the two points.[38] In order to predict the dispersion state, the morphological descriptors, rc and rd, of the various composites are obtained from image analysis of transmission electron microscope (TEM) micrographs and the two-point correlation probability is calculated. It is found that the two-point correlation function of our samples can be expressed as:
| (4) |
where VF is volume fraction of fillers, x is the relative distance between two arbitrary points in the microscopic image and f(x) is the correlation probability that the two points are both in the filler phase. Details of image analysis process can be found in the Supporting Information.
The morphological descriptors are then correlated with MQSPR predicted surface energy parameters. It is observed from image analysis that large values of rc and rd are found for composites outside the wetting envelope, while significantly smaller rc and rd are seen for composites within the wetting envelope. In order to capture this trend, an empirical dimensionless energetic parameter xcorr, which is a function of θ and ΔWa, is proposed as shown in Equation (5).
| (5) |
This form of Equation (5) ensures that the value of xcorr is dominated by the cosθ term for θ = 0°, thereby keeping the influence of ΔWa term fairly small when large agglomerates form during the initial casting. When θ = 0° (i.e., when particle surface energies lie within the complete wetting envelope), the value of xcorr is determined purely by ΔWa normalized by WPF. Functions relating rc and rd to xcorr, the primary particle size (ro = 14 nm) and VF, Equations (6) and (7), are then constructed heuristically.
| (6) |
| (7) |
where Ac = 15.7, Bc = 3.1, Ad = 29.7 and Bd = −1.9 are dimensionless parameters obtained through least square fitting with rc and rd measured in image analysis.
As shown in Figure 5a,b, predicted rc and rd generally match with the results obtained from image analysis with the exception that the predicted rc results for Amino-Silica/PS (xcorr = 0.60) and Amino-Silica/PMMA (xcorr = 0.59) deviate from values measured from the TEM images. Now, using energetic descriptors and Equation (5)–(7), the resulting correlation function (Equation (4)) can be determined from which we construct a statistically representative 3D microstructure of the composite using a stochastic searching algorithm.[42] For this reconstruction, particles are initially placed inside a 3D representative volume element (RVE) and their positions sequentially reallocated under the control of a simulated annealing algorithm until their dispersion follows the target two-point correlation function described by Equation (4). An example of reconstructed 3D geometry is shown in Figure 5d.
Figure 5.
a,b) Comparison between rc and rd obtained from analyzing TEM images from experiment and Equations (6) and (7). c) An example of the validation of the two-point correlation function constructed by Equation (4) with 3 wt% Octyl-Silica/PS. d) A 3D microstructure is then reconstructed in FEA with this two-point correlation function.
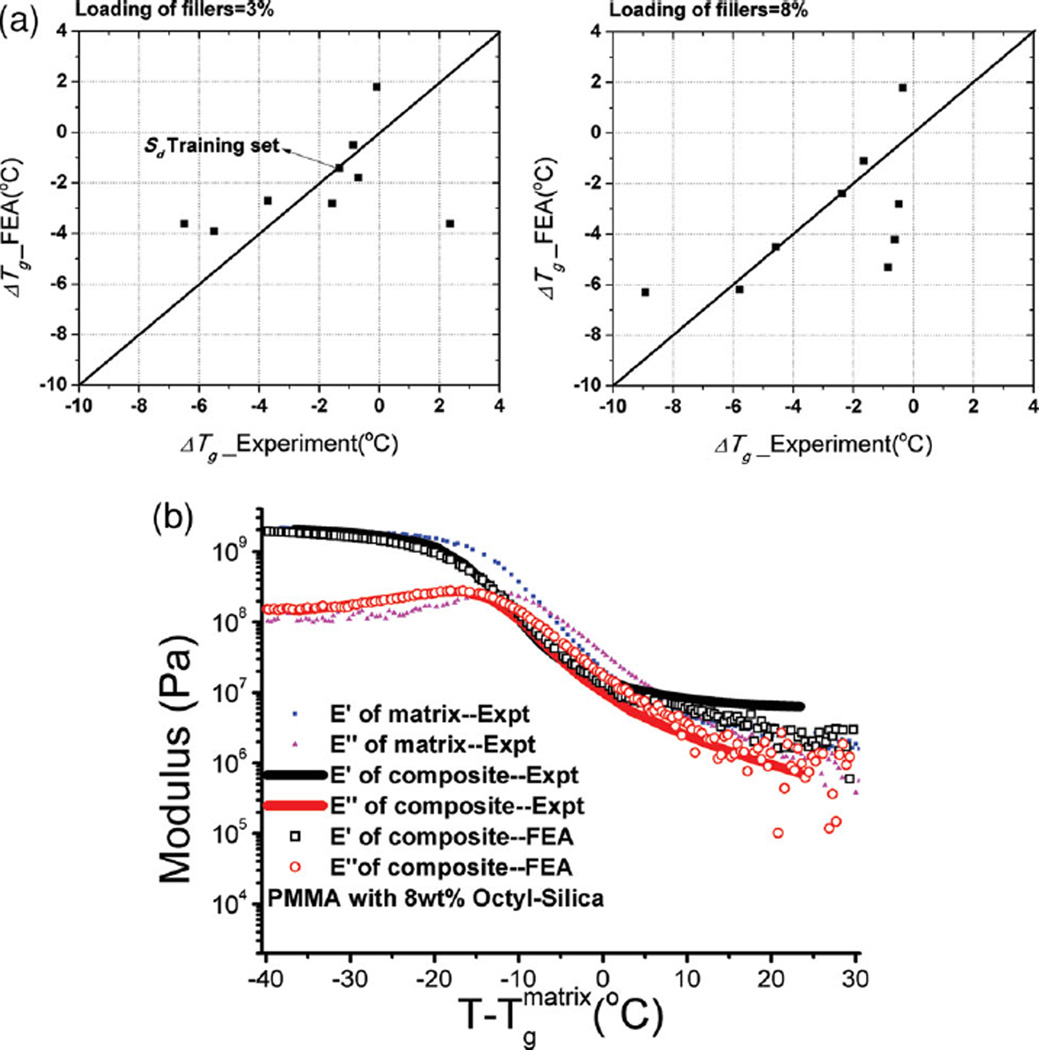
To obtain bulk properties of the material, a continuum level FEA simulation is performed on the microstructure created from the above process. The polymer and particle properties are known and the properties of the interphase surrounding the fillers are based on the correlation of the work of spreading to the ΔTg (difference between Tg of composites and matrix polymer) for a set of training results. In the simulation, we use a simple two-layer gradient interphase model, corresponding to a physical thickness of ≈300 nm,[10] to simulate the change in properties of the interfacial polymer away from the particle surfaces. This estimated thickness is close to other predictions made earlier.[10,11,43,44] The interphase properties are related to those of the bulk polymer matrix by a simple shift in the frequency domain, representing a change in mobility of the polymer, similar to the approach taken in literature.[10,11,43] In order to determine the amount of shifting (Sd) in the interphase layers, PS with 3 wt% Chloro-Silica is selected as the training set in which Sd is chosen such that ΔTg from FEA matches experimental results. It is found that Sd is well expressed by (Ws/5ΔWa) for the inner layer of interphase and half of this value for outer layer. This relation for Sd is then extrapolated and applied directly to the other composite systems. With the microstructure and its properties thus fully determined, a simulated DMTA temperature sweep test is performed and the relaxation spectra of the polymer composites, E′ (storage modulus) and E″ (loss modulus) vs T, are predicted from FEA of the 3D RVE. Tg of the composites is obtained as the temperature at which tan δ = E′/E″ reaches a maximum and ΔTg is calculated. Figure 6a shows the comparison between predicted ΔTg from FEA and experimental ΔTg via DMTA and DSC test. Predicted and experimental E′ and E″ data of PMMA with 8 wt% Octyl-Silica are shown in Figure 6b The agreement is remarkable given the breadth of systems considered. Thus, we now have a tool for a priori prediction of thermomechanical response (in particular ΔTg) in polymer nanocomposites with spherical particles. Additionally we have incorporated these models into a web-tool, on whose front end, the user can choose a matrix and particle to obtain predicted dispersion states and thermomechanical properties.[45] Further details on the webtool are available in the supporting information.
Figure 6.
Summary of comparison of ΔTg between Experiment and FEA simulation is shown in a) for polymer composites with 3 and 8 wt% of silica particles as fillers, respectively. b) Results from simulated DMTA temperature sweep test showing remarkable agreement between FEA and Experiment for 8 wt% Octyl-Silica/PMMA.
3. Conclusion
We have developed a Materials Genome-based approach for predicting the thermomechanical properties of spherical nanofilled polymers that can be used for the virtual design of new materials. As part of this process, we have also developed tools that can be used for predicting a number of other pertinent material properties including:
An MQSPR method to predict surface energies of polymers and functionalized nanoparticles, as well as their compatibilities.
A quantitative method for using contact angle, relative work of adhesion and the work of spreading to predict spherical nanoparticle dispersion distributions and change in Tg from bulk.
An approach to statistically reconstruct 3D microstructures of composites based on these energetic parameters.
The hybrid MQSPR tools developed during the course of this work can also be used as a starting point for predicting toughness, loss modulus, strength, melting temperature or even dielectric properties of materials for energy storage and insulation applications–these predictions will require additional analysis to tune the descriptors and relations. With the addition of property benchmarks, the flexibility and applicability range of the toolkit described above will be aligned with the priorities of the Materials Genome Initiative, and provide a new way for material scientists to perform “what if” experiments on potentially interesting nanocomposite compounds, and to optimize their thermomechanical properties prior to synthesis.
Supplementary Material
Acknowledgments
The authors gratefully acknowledge the Office of Naval Research and Dr. Kenny Lipkowitz for their financial backing (ONR grant N000141-01-02-4-4) and scientific support, as well as the Rensselaer Center for Biotechnology and Interdisciplinary Studies (CBIS) for providing a collaborative infrastructure for research. Additionally, we acknowledge the guidance of Prof. Wei Chen at Northwestern University in statistical reconstruction techniques.
Footnotes
Supporting Information
Supporting Information is available from the Wiley Online Library or from the author.
Contributor Information
Prof. Curt M. Breneman, Email: brenec@rpi.edu, Department of Chemistry and Chemical Biology, Rensselaer Polytechnic Institute, Troy, NY 12180, USA.
Prof. L. Catherine Brinson, Email: cbrinson@northwestern.edu, Department of Mechanical Engineering, Northwestern University, Evanston, IL 60208, USA.
Prof. Linda S. Schadler, Email: schadl@rpi.edu, Department of Materials Science and Engineering, Rensselaer Polytechnic Institute, Troy, NY 12180, USA.
Bharath Natarajan, Department of Materials Science and Engineering, Rensselaer Polytechnic Institute, Troy, NY 12180, USA.
Dr. Michael Krein, Department of Chemistry and Chemical Biology, Rensselaer Polytechnic Institute, Troy, NY 12180, USA
Ke Wu, Department of Chemistry and Chemical Biology, Rensselaer Polytechnic Institute, Troy, NY 12180, USA.
Lisa Morkowchuk, Department of Chemistry and Chemical Biology, Rensselaer Polytechnic Institute, Troy, NY 12180, USA.
Yang Li, Department of Mechanical Engineering, Northwestern University, Evanston, IL 60208, USA.
Dr. Hua Deng, Department of Mechanical Engineering, Northwestern University, Evanston, IL 60208, USA
Hongyi Xu, Department of Mechanical Engineering, Northwestern University, Evanston, IL 60208, USA.
References
- 1. [accessed December, 2012]; http://www.whitehouse.gov/mgi.
- 2.Le T, Epa VC, Burden FR, Winkler DA. Chem. Rev. 2012;112:2889–2919. doi: 10.1021/cr200066h. [DOI] [PubMed] [Google Scholar]
- 3.Krein M, Huang T, Morkowchuk L, Agrafiotis DK, Breneman CM. In: Statistical Modelling of Molecular Descriptors in QSAR/QSPR. Dehmer M, Varmuza K, Bonchev D, editors. Weinheim, Germany: Wiley-VCH Verlag GmbH & Co. KGaA; 2012. [Google Scholar]
- 4.Puzyn T, Leszczynski J, Cronin MT, editors. Recent Advances in QSAR Studies. Springer Netherlands, Dordrecht: 2010. [Google Scholar]
- 5.Bansal A, Yang H, Li C, Cho K, Benicewicz BC, Kumar SK, Schadler LS. Nat. Mater. 2005;4:693–698. doi: 10.1038/nmat1447. [DOI] [PubMed] [Google Scholar]
- 6.Stöckelhuber KW, Das A, Jurk R, Heinrich G. Polymer. 2010;51:1954–1963. [Google Scholar]
- 7.Stöckelhuber KW, Svistkov AS, Pelevin AG, Heinrich G. Macromolecules. 2011;44:4366–4381. [Google Scholar]
- 8.Rittigstein P, Priestley RD, Broadbelt LJ, Torkelson JM. Nat. Mater. 2007;6:278–282. doi: 10.1038/nmat1870. [DOI] [PubMed] [Google Scholar]
- 9.Starr FW, Douglas JF, Glotzer SC. J Chem. Phys. 2003;119:1777. [Google Scholar]
- 10.Deng H, Liu Y, Gai D, Dikin Da, Putz KW, Chen W, Catherine Brinson L, Burkhart C, Poldneff M, Jiang B, Papakonstantopoulos GJ. Compos. Sci. Technol. 2012;72:1725–1732. [Google Scholar]
- 11.Hamming LM, Qiao R, Messersmith PB, Brinson LC. Compos. Sci. Technol. 2009;69:1880–1886. doi: 10.1016/j.compscitech.2009.04.005. [DOI] [PMC free article] [PubMed] [Google Scholar]
- 12.Nowlin TE, Smith DF. J Appl. Polym. Sci. 1980;25:1619–1632. [Google Scholar]
- 13.Falsafi A, Mangipudi S, Owen M. In: Physical Properties of Polymers Handbook. Mark J, editor. New York, USA: Springer; 2007. pp. 1011–1020. [Google Scholar]
- 14.Wu S. Org. Coat. Plast. Chem. 1971;31:27–38. [Google Scholar]
- 15.Berta D. In: Coatings Of Polymers And Plastics. Ryntz RA, Yaneff PV, editors. New York, NY: Marcel Dekker Inc.; 2003. [Google Scholar]
- 16.Wu S. J Polym. Sci., Part C. 1971;34:19–30. [Google Scholar]
- 17.Naim JO, van Oss CJ. Immunol. Invest. 1992;21:649–662. doi: 10.3109/08820139209069401. [DOI] [PubMed] [Google Scholar]
- 18.Kitazaki Y, Hata T. JourJ. Adhes. Soc. Jpn. 1972;8:9–20. [Google Scholar]
- 19.Janczuk B, Bialopiotrowicz T, Wójcik W. J Colloid Interface Sci. 1989;127:59–66. [Google Scholar]
- 20.van Oss CJ, Chaudhury MK, Good RJ. Sep. Sci. Technol. 1989;24:15–30. [Google Scholar]
- 21.Wu S. In: Polymer Handbook. Brandrup J, Immergut EH, editors. New York: Wiley-Interscience; 1989. pp. 414–426. [Google Scholar]
- 22.Ebnesajjad S, Ebnesajjad CF. Surface Treatment of Materials for Adhesion Bonding. Norwich, NY: William Andrew Publishing; 2006. [Google Scholar]
- 23.Horng P, Brindza MR, Walker RA, Fourkas JT. J Phys. Chem. C. 2010;114:394–402. [Google Scholar]
- 24.Fadeev AY, McCarthy TJ. Langmuir. 1999;15:3759–3766. [Google Scholar]
- 25.Janssen D, Depalma R, Verlaak S, Heremans P, Dehaen W. Thin Solid Films. 2006;515:1433–1438. [Google Scholar]
- 26.Owens DK, Wendt RC. J Appl. Polym. Sci. 1969;13:1741–1747. [Google Scholar]
- 27.Breneman CM, Rhem M. J Comput. Chem. 1997;18:182–197. [Google Scholar]
- 28.Schadler LS, Kumar SK, Benicewicz BC, Lewis SL, Harton SE. MRS Bull. 2007;32:335–340. [Google Scholar]
- 29.Kumar SK, Krishnamoorti R. Annu. Rev. Chem. Biomol. Eng. 2010;1:37–58. doi: 10.1146/annurev-chembioeng-073009-100856. [DOI] [PubMed] [Google Scholar]
- 30.Ganesan V, Ellison CJ, Pryamitsyn V. Soft Matter. 2010;6:4010. [Google Scholar]
- 31.Good R, Girifalco L, Good J. J Phys. Chem. 1960;64:561–565. [Google Scholar]
- 32.Fowkes FM. Ind. Eng. Chem. 1964;56:40. [Google Scholar]
- 33.van Oss CJ, Chaudhury M, Good R. Adv. Colloid Interface Sci. 1987;28:35–64. doi: 10.1016/0001-8686(87)80008-8. [DOI] [PubMed] [Google Scholar]
- 34.Granqvist B, Järn M, Rosenholm JB. Colloids Surf., A. 2007;296:248–263. [Google Scholar]
- 35.Wang MJ. Rubber Chem. Technol. 1998;71:520–589. [Google Scholar]
- 36.Pangelinan AB, McCullough R, Kelley MJ. J Thermoplast. Compos. Mater. 1994;7:192. [Google Scholar]
- 37.Karasek L, Sumita M. J Mater. Sci. 1996;31:281–289. [Google Scholar]
- 38.Jiao Y, Stillinger F, Torquato S. Phys. Rev. E. 2007;76:1–15. doi: 10.1103/PhysRevE.76.031110. [DOI] [PubMed] [Google Scholar]
- 39.Tewari A, Gokhale AM. Mater. Sci. Eng., A. 2004;385:332–341. [Google Scholar]
- 40.Al-Ostaz A, Diwakar A, Alzebdeh KI. J Mater. Sci. 2007;42:7016–7030. [Google Scholar]
- 41.Tong WS, Rickman JM, Barmak K. Acta Mater. 1999;47:435–445. [Google Scholar]
- 42.Yeong C, Torquato S. Phys. Rev. E. 1998;58:224–233. [Google Scholar]
- 43.Qiao R, Deng H, Putz KW, Brinson LC. J Polym. Sci., Part B. Polym. Phys. 2011;49:740–748. [Google Scholar]
- 44.Watcharotone S, Wood CD, Friedrich R, Chen X, Qiao R, Putz K, Brinson LC. Adv. Eng. Mater. 2011;13:400–404. [Google Scholar]
- 45. [accessed January, 2013]; http://reccr.chem.rpi.edu/polymerizer. [Google Scholar]
Associated Data
This section collects any data citations, data availability statements, or supplementary materials included in this article.


