Abstract
Synaptic transmission is maintained by a delicate, subsynaptic molecular architecture, and even mild alterations in synapse structure drive functional changes during experience-dependent plasticity and pathological disorder1,2. Key to this architecture is how the distribution of presynaptic vesicle fusion sites corresponds to the position of receptors in the postsynaptic density. However, despite long recognition that this spatial relationship modulates synaptic strength3, it has not been precisely described, due in part to the limited resolution of light microscopy. Using localization microscopy, we report here that key proteins mediating vesicle priming and fusion are mutually co-enriched within nanometer-scaled subregions of the presynaptic active zone. Through development of a new method to map vesicle fusion positions within single synapses, we found that action potential evoked fusion was guided by this protein gradient and occurred preferentially in confined areas with higher local density of RIM within the active zones. These presynaptic RIM nanoclusters closely aligned with concentrated postsynaptic receptors and scaffolding proteins4–6, suggesting a transsynaptic molecular “nanocolumn.” Thus, we propose that the nanoarchitecture of the active zone directs action potential evoked vesicle fusion to occur preferentially at sites directly opposing postsynaptic receptor-scaffold ensembles. Remarkably, NMDA receptor activation triggered distinct phases of plasticity in which postsynaptic reorganization was followed by transsynaptic nanoscale realignment. This architecture thus suggests a simple organizational principle of CNS synapses to maintain and modulate synaptic efficiency.
The location of vesicle fusion within an active zone (AZ) is likely dictated by a few key members of the presynaptic proteome, including RIM1/2, Munc13, and Bassoon7 (Fig. 1a). To explore the organization of these proteins, we studied their subsynaptic distribution relative to postsynaptic scaffolding protein PSD-95 in cultured hippocampal neurons using 3D-STORM8 following immunolabeling using primary antibodies and Alexa647- or Cy3-tagged secondary antibodies (Fig. 1b). Paired synaptic clusters of AZ protein and PSD-95 with clear borders were selected. As a confirmation that these pairs constituted synapses, we measured the peak-to-peak distances between pre- and postsynaptic clusters and found them to be consistent with previous measurements9 (Extended Data Fig. 1).
Figure 1. Vesicle release proteins form subsynaptic nanoclusters.
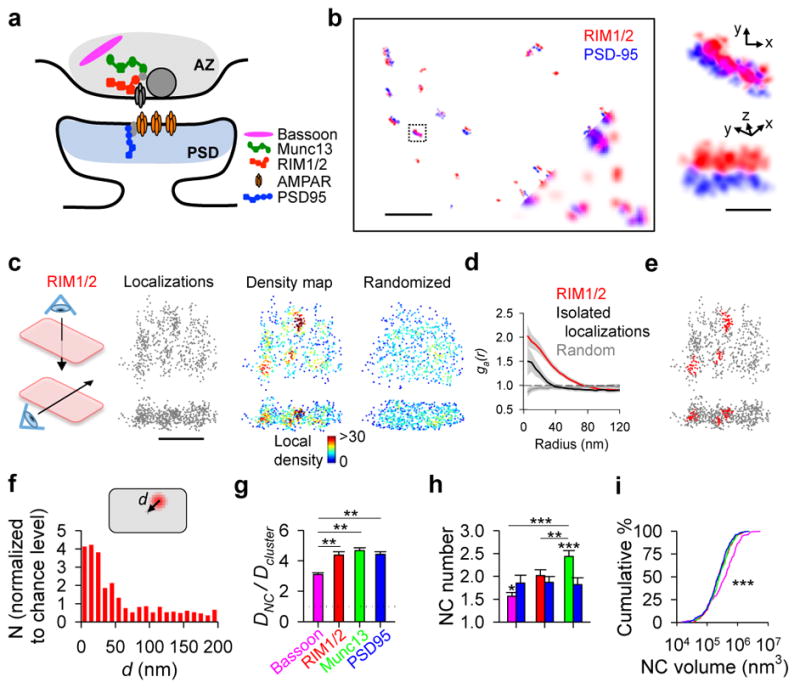
a, Color-coded schematic of studied synaptic proteins. b, Synapses labeled with RIM1/2 and PSD-95 imaged using 3D-STORM (10 nm pixels) compared to wide-field composite (bottom corner, 100 nm pixels), scale 2 μm. Boxed synapse enlarged in original (top) and rotated (bottom) angles, scale 200 nm. c, En-face (top) and side (bottom) views of a RIM1/2 cluster showing all localizations and local density maps for a measured synaptic cluster compared to a simulated randomized cluster, scale 200 nm. d, Auto-correlation functions of measured RIM1/2 (n = 115), isolated non-synaptic small groups of localizations due to repetitive switching of fluorophores (n = 42), and simulated randomized (n = 115) distributions. e, RIM1/2 nanoclusters (NCs, red) within a synaptic cluster. f, Distribution of NC distances from the center of synapses normalized to randomized distribution. g, Molecule density inside NCs normalized to synaptic average. h, Average number of protein NCs per synapse. i, Cumulative distributions of NC volumes. *p < 0.05, **p < 0.01, ***p < 0.001, One-way ANOVA on ranks with pairwise comparison procedures (Dunn’s method) for g–h and K–S test for i. All experiments were repeated ≥3 times. Also see Extended Data Fig. 3 and Supplementary Table 1.
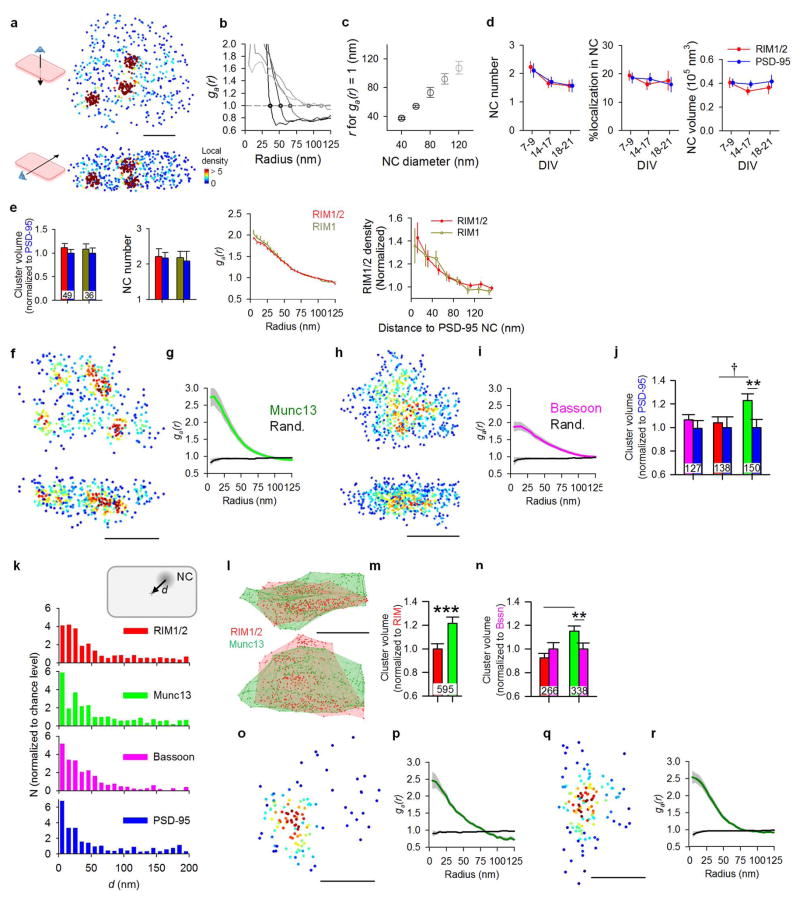
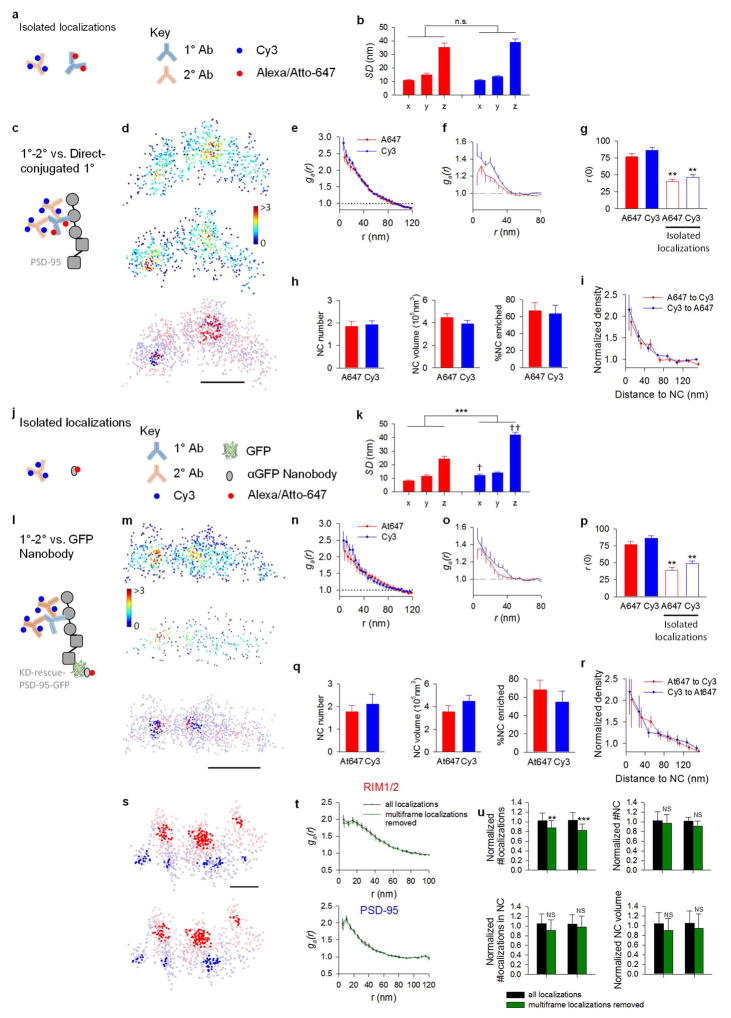
The distribution of RIM1/2 within the AZ, measured as 3D local density, was distinctively nonuniform with notable high-density peaks, which we characterized as nanoclusters (NCs, Fig. 1c, e). We adapted an auto-correlation function (ACF) to test whether this distribution occurs more frequently than expected by chance. The measured ACF showed significant nonuniformity compared to random ensembles (Fig. 1d). Simulations showed that the distance for which the ACF was significantly elevated provided a means to estimate the NC diameter (Extended Data Fig. 2a–c). The average estimated diameter of ~80 nm for RIM1/2 NCs was very close to the reported size of PSD-95 and AMPA receptor (AMPAR) NCs4–6. Similar distribution and NC properties were found using a different antibody targeted toward a separate epitope in RIM1 (Extended Data Fig. 2d). Isolated non-synaptic small groups of localizations showed a weaker ACF that was significant over a much smaller distance (Fig. 1d). This and other experiments suggest that the measured nonuniformity was not likely due to over-counting molecules or to potential artifacts of primary-secondary antibody labeling (Extended Data Fig. 3).
To directly compare the nanoscale organization of key AZ proteins, we developed an algorithm that identified NCs based on local densities (Fig. 1e). NCs of each protein were more likely to be located near the center of synapses than near the edge (Fig. 1f, Extended Data Fig. 2i). Compared to PSD-95 as the common control in pairwise two-color experiments, there were similar numbers of RIM1/2, more Munc13, and fewer Bassoon NCs per synapse (Fig. 1h). Comparisons between these three proteins suggested that Munc13 had a wider distribution than RIM1/2 across the AZ and the distribution of Bassoon was closer to uniform throughout the synapse (Fig. 1g–i, Extended Data Fig. 2f–n). Together, these observations revealed a complex and heterogeneous molecular architecture within single synapses, typified by dense assemblies of fusion-associated proteins nearer the center.
To examine the potential functional impact of the AZ nanoclusters on vesicle fusion10,11, we sought to directly map the distribution of vesicle fusion sites over multiple release events within individual boutons. To do so, we adapted analysis for single-molecule localization to signals from single-vesicle fusion obtained with vGlut1-pHluorin-mCherry (vGpH). Neurons were cotransfected with synapsin1a-CFP (Syn1a), a vesicle-associated protein that marks boutons, and vGpH, which increases in green fluorescence intensity upon vesicle fusion12. Single electrical field stimuli evoked vesicle fusion (Fig. 2a–b, Extended Data Fig. 4a) with a release probability (Pr) of 0.11 ± 0.01 per bouton, comparable to previous measurements, which was also sensitive to extracellular Ca2+ (Extended Data Fig. 4b–d), as expected. The frequency of action potential (AP)-independent spontaneous release events observed in TTX detected with vGpH was similar to the frequency of NMDA receptor (NMDAR)-dependent postsynaptic Ca2+ transients measured separately using the Ca2+ sensor GCaMP6f (Extended Data Fig. 5a).
Figure 2. Release site mapping by pHuse in single synapses shows RIM predicts evoked fusion distribution.
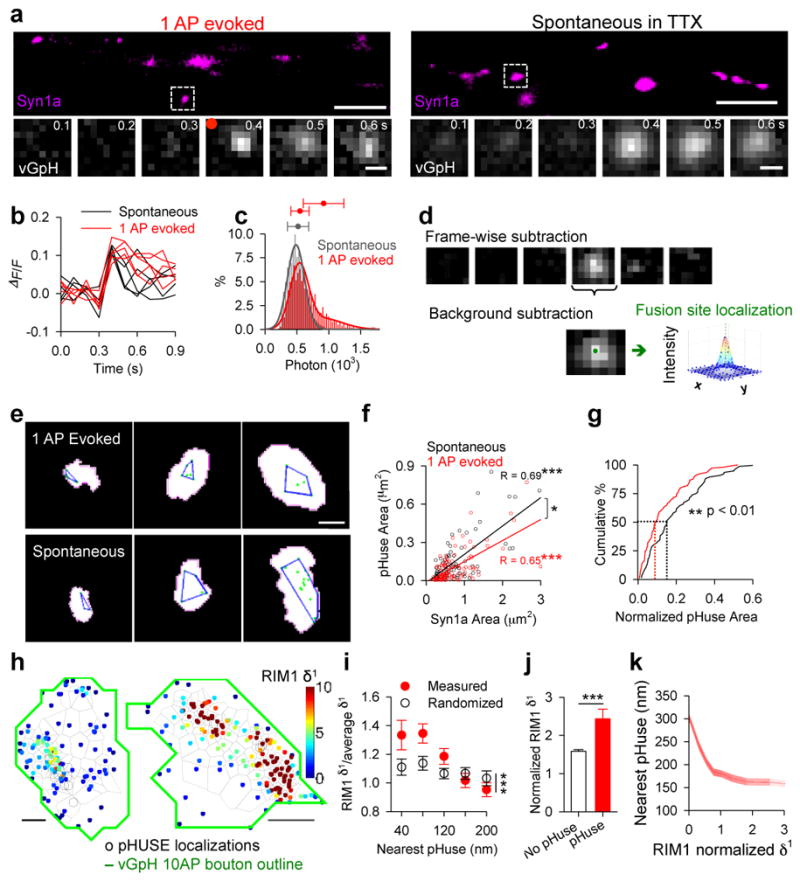
a, Neurons co-expressing Syn1a-CFP (top, scale 5 μm), identifying synaptic boutons, and vGpH (bottom, scale 500 nm), used to detect vesicle fusion with fluorescence increases from 1 AP-evoked and spontaneous release. b, Example of fluorescence traces from evoked and spontaneous events over repeated trials at single boutons. c, Photon count distributions for detected spontaneous events fit with a normal distribution (μ = 512, σ = 167) and evoked events fit with a mixture of 2 normal distributions (μ1 = 542, σ1 = 143, μ2 = 912, σ2 = 319). Filled circles with error bars show μ ± σ of normal curves. d, Image processing steps in pHuse to determine fusion site locations. e, Fusion sites (green points) and area of fusion (blue line) from boutons of different sizes defined with Syn1a (white), scale 500 nm. f, Correlation between fusion area and bouton size, linear fit. Correlations are significantly different, ANCOVA, F1, 171 = 5.01. g, Cumulative distributions of fusion areas normalized to bouton size (K–S test, D=0.26**). f–g, nspontaneous = 77/22, nevoked = 104/28. h. Tessellated RIM1-mEos and pHuse localizations over the same boutons, scale 200 nm. i. Tesseler first-rank density (δ1) for RIM1 measured vs randomized distributions as a function of distance from pHuse localizations. j. Comparison within boutons of average δ1 for RIM1 localizations within 40 nm to a pHuse localization vs not. k. Average nearest pHuse distance as a function of RIM1 δ1. j–i, n = 26/13 *p < 0.05, **p < 0.01, ***p < 0.001. n given in synapses/experiments. All experiments were repeated ≥3 times. Also see Extended Data Figs. 4–6.
To determine whether these evoked fusion events represent single- or multi-vesicular fusion, we compared them with spontaneous release in TTX (Fig. 2a–c), which most likely arises from single vesicle fusion13. By fitting the photon number distributions of evoked and spontaneous events, we estimated that ~72–82% of evoked events arose from single-vesicle fusion (Fig. 2c). With the majority of evoked release stemming from single-vesicle fusion, the location of fusion may be deduced by mathematically fitting the fluorescence profile captured immediately after fusion (Fig. 2d), analogous to single-molecule localization techniques14. For our median count of 518 photons/localization, the effective localization precision was in practice limited by vesicle diameter. In individual boutons, multiple evoked or spontaneous single-vesicle fusion events were used to generate maps that defined the areas over which vesicle fusion occurred (Fig. 2e, Extended Data Fig. 4e–l). We called this approach “pHluorin uncovering sites of exocytosis” or pHuse.
Fusion site areas for spontaneous and evoked vesicle fusion tightly correlated with bouton areas measured by Syn1a (Fig. 2f), as expected. However, the slopes of the correlations differed, even though the bouton sizes were similar between groups (Extended Data Fig. 5b). In fact, evoked fusion site areas were significantly smaller (median smaller by 48%) and occurred over a significantly smaller proportion of the bouton (median smaller by 39%) than spontaneous fusion (Fig. 2g, Extended Data Fig. 5c–d, h–j).
One interpretation is that the concentration of vesicle priming proteins in NCs favors evoked fusion in these subregions of the AZ. This predicts that pHuse events would be associated with higher local RIM1 density and conversely that high local density of RIM1 increases the probability of nearby fusion. To assess these predictions, we mapped vesicle fusion sites relative to Eos3-tagged RIM1 using sequential PALM-pHuse imaging on the same live boutons (Fig. 2h, Extended Data Fig. 6d–e). As a local density metric for RIM1, we applied Voronoï tessellation and measured the first-rank density (δ1) for each RIM1-mEos3 localization (as described in Levet et al, 2015). The distribution of RIM1-mEos3 was nonuniform and contained NCs with an average diameter of 80.95 ± 5.34 nm and 78.93 ± 5.85 nm using either an adapted SR-Tesseler analysis15 or nearest neighbor distance analysis4, respectively (Extended Data Fig. 6f), consistent with our 3D-STORM results (Fig. 1). We then compared δ1 as a function of distance from the nearest pHuse localization for the measured RIM1 distributions versus randomized RIM1 distributions generated from the same number of localizations over the same area. Indeed, near pHuse sites, the average RIM1 δ1 was significantly greater than chance (Fig. 2i). Furthermore, within individual boutons, RIM1 molecules within 40 nm of a pHuse location had significantly higher δ1 than those further away (Fig. 2j). Conversely, considering all individual RIM1 localizations, the distance from the nearest pHuse localization decreased as a function of RIM1 δ1 (Fig. 2k). Thus, nanodistribution of RIM predicts the local probability of evoked fusion.
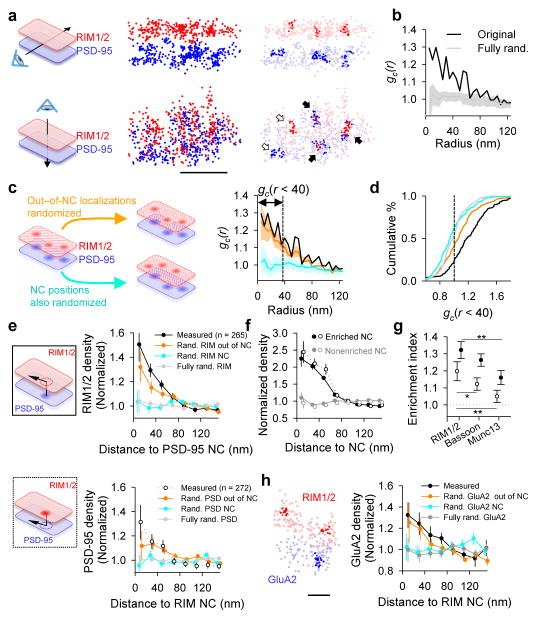
For the synapse as a whole, the impact of presynaptic nanoscale organization and confined vesicle sites (Fig. 1, 2) will depend strongly on whether these RIM NCs align with postsynaptic receptor NCs4. To assess this, we compared the distribution of PSD-95 over the face of individual synapses to the corresponding distributions of RIM1/2, as the PSD-95 NCs concentrate higher density of receptors7. An example synapse, presented in Fig. 3a (suppl. Video 1), shows three RIM1/2 NCs and three PSD-95 NCs that appear well-aligned and one pair not aligned. We used two independent approaches to assess the relationship between AZ and postsynaptic density (PSD) protein distributions. First we adapted a pair cross-correlation function (PCF) to measure the spatial relationship between the two distributions (see Methods). The measured AZ-PSD distributions showed a significantly elevated PCF compared to simulated AZ-PSD distributions with either distribution fully randomized (Fig. 3b). We then tested the contribution of NC positions to this elevated PCF (Fig. 3c). Randomizing NC positions and out-of-NC molecules (keeping localizations within NC borders intact) abolished the PCF to chance level, while randomizing just the out-of-NC molecules only modestly reduced the PCF, indicating that the precise positioning of the NCs themselves dominate the overall correlation of protein distributions (Fig. 3c–d).
Figure 3. Transsynaptic nanoscale alignment of AZ and PSD proteins.
a, Distributions of synaptic RIM1/2 and PSD-95 pair as the original localizations (left) and with NCs highlighted (right), scale 200 nm. Filled arrows indicate aligned NCs, open arrows non-aligned NCs. b, Paired correlation function (PCF) of measured RIM1/2 and PSD-95 compared to PCF with either distribution randomized. c, PCF of simulated distributions with (cyan) and without (orange) shuffling NC positions. d, Cumulative distributions of cross-correlation index (n = 143 synapses). e, RIM1/2 protein enrichment as a function of distance from translated PSD-95 NC centers (top, filled points) and PSD-95 enrichment relative to RIM1/2 NCs (bottom, open points). Simulations with same randomizations as in d–e were performed for each synapse. f, Protein density profile for enriched vs non-enriched NCs, n = 119 PSD-95 NCs, 90 RIM1/2 NCs. g, Enrichment indices for RIM1/2, Munc13, and Bassoon relative to PSD-95 NCs (filled) and for the opposite direction (open), n >260 NCs, *p < 0.05, **p< 0.01, ANOVA on ranks with Dunn’s method. h, GluA2 enrichment with respect to RIM1/2 NCs, n = 36 synapses, scale 100 nm. All experiments were repeated ≥3 times. Also see Extended Data Fig. 6 and Supplementary Table 2.
Second, we reasoned that if synapses were transsynaptically aligned on the nanoscale level, the protein distribution on one side of the synapse would predict protein density in the opposing neuron. To test this, we measured RIM1/2 localization densities as a function of radial distance from the centers of PSD-95 NCs as translated across the synaptic cleft (Fig. 3e). RIM1/2 localization densities within a 60 nm radius were significantly higher than the synaptic cluster average, decaying e-fold per 43.2 ± 12.1 nm away from the peak. This enrichment was again principally dependent on the relative positioning of NCs within synaptic clusters (Fig. 3e). For each individual NC, we defined an enrichment index as the average molecular density of the opposed protein within a 60 nm radius from the NC center (Extended Data Fig. 7a). NCs with enrichment indices significantly greater than that of the fully randomized distribution were considered enriched (Fig. 3f). We found 44.4 ± 3.0 % of PSD-95 NCs to be enriched (Extended Data Fig. 7b), and these NCs were opposed to RIM1/2 molecule densities that were 2.0 ± 0.1 times the average RIM1/2 synaptic cluster density (Fig. 3f). A similar PSD-95 protein enrichment profile was found relative to the centers of RIM1/2 NCs (Fig. 3e). Thus, this detailed metric for assessing nanoscale alignment revealed strong co-enrichment of these key proteins along narrow, transcellular columns. In comparison to RIM1/2, the enrichment of Munc13 with respect to PSD-95 NCs was considerably weaker, and Bassoon intermediate (Fig. 3d, g, Extended Data Fig. 7c–e, Suppl. Table 2). Together, both the PCFs and protein enrichment analyses revealed significant trans-synaptic alignment between RIM1/2 and PSD-95 distributions, largely stemming from the correlated positions of their respective NCs. We likewise found quantitatively similar number, characteristics, and alignment of pre- and postsynaptic NCs in acute hippocampal slices from adult rats (Extended Data Fig. 7f–h).
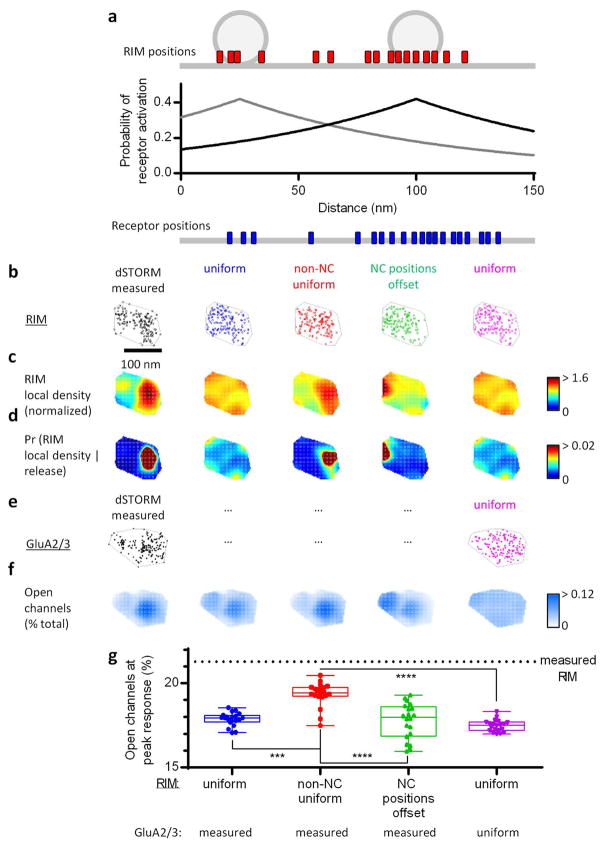
To determine whether evoked release aligns with postsynaptic receptors, we compared distributions of GluA2-containing AMPARs with RIM1/2 (Fig. 3h). Similar to PSD-95, GluA2 was significantly enriched relative to RIM1/2 NCs, decaying e-fold per 66.9 ± 15.4 nm. This was further confirmed with a different GluA2/3 antibody (Suppl. Table 2). Importantly, given that the probability of AMPAR activation declines with distance from glutamate release sites has previously been deduced3,16, we can predict synaptic potency by using the observed RIM1/2 and receptor distributions. To estimate the physiological impact of this transsynaptic alignment, we calculated receptor activation in a measured synapse versus randomized distributions. Consistent with effect sizes posited by previous models4,5,17, the measured distribution with transsynaptic alignment gained 21.8 ± 0.5% in synaptic strength compared to a uniform distribution of AZ and PSD proteins (Extended Data Fig. 8), suggesting this synaptic architecture facilitates higher single vesicle response potency. For comparison, long-term depression induces a very similar magnitude decrease in synaptic strength18.
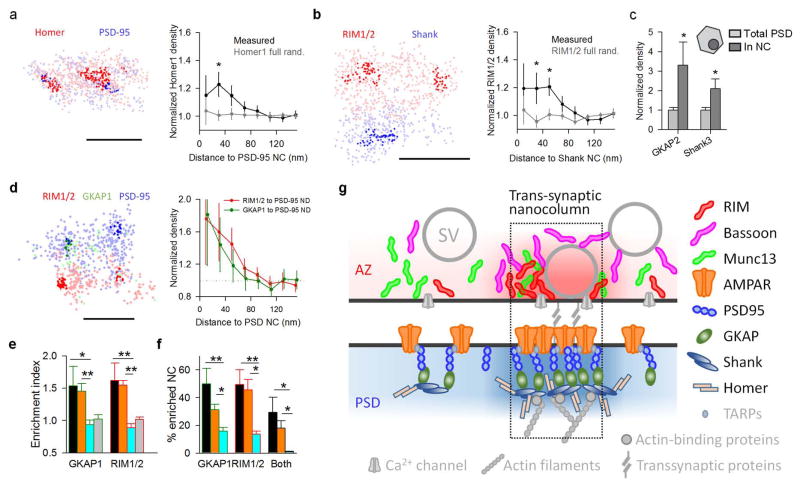
Notably, we found that transsynaptic molecular alignment may extend deeper into the postsynaptic cell, as postsynaptic scaffold molecules farther from the plasma membrane also colocalized with PSD-95 NCs (Extended Data Fig. 9a,c), and RIM1/2 was correspondingly enriched with respect to Shank NCs (Extended Data Fig. 9b). 3D-STORM imaging of RIM1/2, PSD-95, and GKAP1 at the same synapses further confirmed their mutual co-enrichment (Extended Data Fig. 9d–f). Altogether, these results revealed an axially oriented molecular ensemble spanning the cleft within the bounds of the synapse, evoking the concept of a transsynaptic “nanocolumn” enriched with key proteins that regulate synaptic transmission (Extended Data Fig. 9g). The graded protein densities involved suggest this may not be a clearly delineated structural element. Nevertheless, sensitivity of PSD-95 NC size to latrunculin4 further suggests that the spine cytoskeleton is engaged at the “base” of the column. Because actin executes many aspects of synaptic plasticity, this provides a potential means by which synaptic strength may be dynamically tuned.
Consequently, we speculated that nanoscale alignment might be altered during synaptic plasticity. To test this, we induced long-term potentiation via APV withdrawal and glycine stimulation19 which resulted in an increase in PSD-95 localization density within NCs, the percentage of PSD-95 NCs enriched with RIM1/2, and the enrichment index of PSD-95 NCs (Fig. 4a–c, Extended Data Fig. 10m). These changes were prevented by co-application of the NMDAR antagonist APV (Fig 4a–c, Extended Data Fig. 10m). Notably, no changes in RIM1/2 were observed, consistent with LTP as a primarily postsynaptic phenomenon.
Figure 4. Retrograde plasticity of synaptic nanoscale alignment.
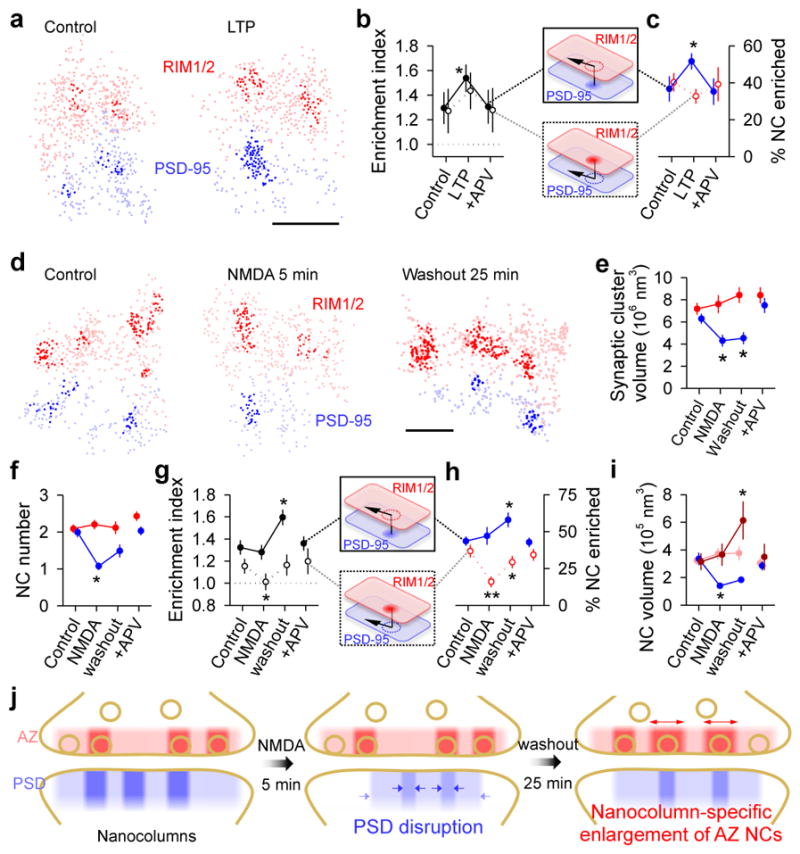
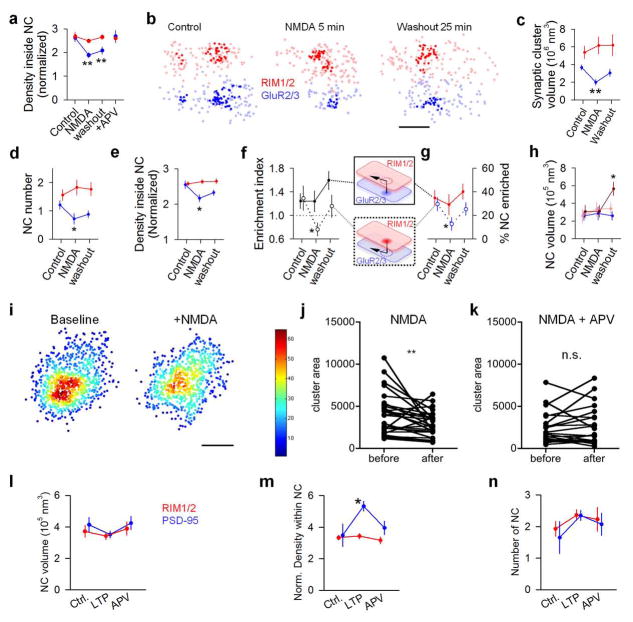
a, Distributions of synaptic RIM1/2 and PSD-95 for control and post-LTP induction conditions with NCs highlighted. b–c, Across-condition comparison of enrichment index and percentage of NCs enriched (n = 45, 87 and 42 synapses for control, LTP, and APV, respectively). d, Distributions of RIM1/2 and PSD-95 for conditions following NMDA stimulation. Scale 100 nm. e–i, Across-conditions comparison of RIM1/2 and PSD-95. Dark red in i represents RIM1/2 NCs enriched with PSD-95 and light red the unenriched NCs. n = 61, 96, 77 and 74 synapses for control, NMDA, washout, and APV, respectively. j, Schematic summarizing the reorganization of NCs during NMDA-induced plasticity and recovery. *p < 0.05, **p < 0.01, ANOVA on ranks with pairwise comparison (Dunn’s method), and χ2 test for the proportion. All experiments were repeated ≥3 times.
We next tested an acute 5-minute activation of NMDARs, known to induce a sustained depression of synaptic strength20,21. Following this stimulus, postsynaptic nanostructure was markedly disrupted in the generally opposite manner, with the synaptic cluster volume of PSD-95 and the number, volume, and protein density of PSD-95 NCs all reduced (Figs. 4d–f, Suppl. Table 3). These effects were long-lasting, and during the subsequent 25 minutes, most parameters underwent only partial recovery. In contrast, presynaptic nanostructure underwent a strikingly different pattern of reorganization that was detectable only in relation to PSD-95 NCs. Unlike PSD-95, RIM1/2 distributions were not affected immediately following the stimulus (Fig. 4d–f). However, following the 25-minute recovery, the enrichment index of RIM1/2 with respect to PSD-95 NCs increased with a corresponding increase in the percentage of enriched PSD-95 NCs (Fig. 4g–h). Remarkably, while RIM1/2 NCs altogether remained constant in number and enriched percentage, there was in fact an increase in the size of those RIM1/2 NCs that were enriched with PSD-95, whereas the other non-enriched RIM1/2 NCs remained constant (Fig. 4i). Similar results were found when we studied NMDA-induced changes on RIM1/2 and GluA2/3 alignment (Extended Data Fig. 10a–h). Note that on a traditional microscopic level, these changes to presynaptic organization were essentially undetectable: RIM1/2 staining revealed no change in synaptic cluster size or intensity at any point. Because the delayed presynaptic modification was specific to aligned NCs, it may be that nanocolumns point to an alignment-specific, retrograde presynaptic compensation following postsynaptic depression (Fig. 4j), potentially relating to previous reports of presynaptic homeostatic plasticity22.
Overall, the gradients of protein density we observed suggest a nanocolumn model, in which AZ regions with the highest likelihood of release are aligned to the densest receptor areas, optimizing the potency of neurotransmission (Suppl. Video 2). This provides a simple organizational principle that may hold for many small, CNS synapses, and will have the largest influence at synapses that typically release only one vesicle following an AP. The compartmentalized AZ architecture is reminiscent of protein organization in Drosophila neuromuscular junction23 and vertebrate ribbon synapses, where vesicles and priming proteins are arrayed around tight clusters of Ca2+ channels. However, observations in small CNS synapses of both clustered24,25 and random distribution of Ca2+ channels26, and emerging evidence for channel mobility as an equalizer of Pr for vesicles independent of channel positioning27 suggest that their precise distribution may not be the sole determinant of the AZ release likelihood landscape.
The alignment of pre and postsynaptic nanoscale subdomains4–6 suggests that even small synapses may be composed of dynamic functional modules28,29. We hypothesize that the nanocolumn represents an especially sensitive point whereby disease-associated pathways, frequently known to alter synaptic plasticity1,2, may disrupt synapse function. It will be important to identify which, if any, of the numerous cleft-spanning adhesion systems30 or retrograde signaling mechanisms mediate release-receptor alignment and permit dynamic transsynaptic realignment.
Methods
All experimental protocols were approved by the University of Maryland, Baltimore School of Medicine Institutional Animal Care and Use Committee. Dissociated hippocampal neurons from E18 SD rats of both sexes were prepared as described31. To increase the experiment efficiency, for three-color STORM experiments we used the ‘sandwich’ cultures with a supporting astroglial monolayer as described32 in which most neuronal structures were in the same focal plane. All experiments were performed on neurons 14–21DIV and repeated on 3 or more separate cultures unless otherwise specified.
Immunostaining
Cells were fixed with 4% paraformaldehyde (PFA) and 4% sucrose in PBS (pH 7.4) for 10 minutes at room temperature (RT), followed by washing with 50mM Glycine in PBS. Cells were then permeabilized and blocked using 3% BSA or 5–10% donkey or goat serum in PBS with 0.1% Triton X-100, followed by incubation with primary antibody (3 hours RT or 4°C overnight) and secondary antibodies (1 hour RT).
For comparisons of Munc13 or RIM1/2 with Bassoon made using 3D-STORM, mouse anti-Bassoon (1:500, Enzo) was used with either rabbit anti-RIM1/2 (1:500; Synaptic Systems No. 140203) or rabbit anti-Munc13 (1:500; Synaptic Systems No. 126103). Cy3 or Alexa-647 conjugated goat or donkey anti-rabbit or anti-mouse secondary antibodies (1:200 in PBS; JacksonImmuno) were used33. For comparisons of Munc13 and RIM1/2, staining was performed sequentially separated by additional blocking steps of incubation with rabbit serum at RT for 30 minutes followed by incubation with excess unconjugated anti-rabbit Fab antibody for 1 hour at RT. For this set of experiments, all permutations of the order in which the primary antibody was applied and the fluorophore used to label each protein were included. For transsynaptic measurements, rabbit anti-Munc13, anti-RIM1/2, anti-RIM1 (1:500; Synaptic Systems No.140003) or anti-Bassoon (1:500, Cell Signaling), were used with mouse anti-PSD-95 (1:200; Neuromab), mouse anti-GluA2 (1:100, Millipore), or rabbit anti-GluR2/3 (1:100, Millipore). Unless specified otherwise, presynaptic proteins were labeled with donkey anti-rabbit IgG conjugated with Alexa-647 and postsynaptic PSD-95 were labeled with donkey anti-mouse IgG conjugated with Cy3. For comparison of directly labeled primary antibody with primary-secondary antibody labeling, we directly conjugated Alexa-647 dye to anti-PSD-95 antibody and purified antibody using illustra NAP Columns (GE Healthcare). For comparison of nanobody labeling of expressed GFP-tagged knockdown-rescue PSD-95 with primary-secondary antibody labeling, we used GFP-booster (1:200, Chromotek). More information on antibodies used can be found in the supplementary information.
Tissue slice staining was performed essentially as previously described9,34. Briefly, 1 mm thick blocks of hippocampal tissue from 5–7 wk old male SD rats were fixed with ice-cold 4% PFA for 15 min and then dehydrated with 30% sucrose in PBS. Cryostat sections with 40 μm thickness were made, permeabilized and blocked with 10% donkey serum and 0.3% Triton X-100 in PBS/Glycine for 1 hours. PSD-95 and RIM1/2 were labeled with the same antibody concentration as was used in cell culture.
3D STORM Imaging
Imaging was performed on an Olympus IX81 ZDC2 inverted microscope with a 100X/1.49 TIRF oil immersion objective. Excitation light was reflected to the sample via a 405/488/561/638 quad-band polychroic (Chroma). The typical incident power was ~30 mW for 647 nm and ~60 mW for 561 nm (measured through the objective). To reduce background fluorescence while maximizing the depth of view, we adjusted the incident angle of the excitation beam to near but less than the critical angle, to achieve oblique illumination of the sample. Emission was passed through a Photometrics DV2 which split the emission at 565 nm and directed the red and far-red bands through matched filters (595/50 and 655 long-pass) onto an iXon+ 897 EM-CCD camera (Andor). A cylindrical lens (focal length = 30 cm) was inserted in each path of the splitting cassette of the DV2 to create the astigmatism for 3D imaging. All hardware was controlled via iQ software (Andor). Z stability was maintained by the Olympus ZDC2 feedback positioning system. Lateral drift was corrected with a cross-correlation drift-correction approach35,36.
Labeled cells and tissue slices were imaged in a STORM imaging buffer freshly made before experiments containing 50 mM Tris, 10 mM NaCl, 10% glucose, 0.5 mg/ml glucose oxidase (Sigma), 40 μg/ml catalase (Sigma), and 0.1 M cysteamine (Sigma). For tissue slices, the focal plane was set to within 1.5 μm from the glass coverslip to obtain the best signal-to-noise ratio. Imaging was performed as previously described4,33. TetraSpeck beads (100 nm; Invitrogen) deposited on a coverslip were localized to correct alignment between the two channels as described4. The average deviation of the bead localizations after correction was between 10 and 15 nm. To calibrate the 3D positions of localizations, a z-stack with 30 nm steps was collected on the same coverslip with beads. The average deviation of localized z-positions of immobilized fluorophores was 40–50 nm.
Three-color 3D-STORM
Three-color STORM were performed with two sequential sets of two-color 3D-STORM on RIM1/2-PSD-95 as a pair and then GKAP1-PSD-95 as a pair. Cells were immunolabeled with mouse anti-PSD-95, rabbit anti-RIM1/2, and mouse anti-GKAP1 (1:200, Neuromab). PSD-95 and RIM1/2 were then immunolabeled with secondary antibodies conjugated to Alexa 647 and Cy3, respectively. After >20 minutes of continuous excitation by high-powered lasers during the first round of imaging, the majority of Cy3 molecules (RIM1/2) become bleached. After acquisition of the first set of data, GKAP1 was then labeled with secondary antibody conjugated to Cy3 while the coverslip remained on the microscope. The two sets of data were aligned post-hoc based on Alexa 647 (PSD-95) localizations. Because RIM1/2 and GKAP1 are not overlapping proteins, in the second imaging set, those Cy3 localizations within the RIM cluster borders potentially arising from the small, unbleached fraction of RIM-Cy3 were rejected from GKAP1 localizations.
PALM-STORM Imaging
PALM imaging of PSD-95 concurrent with STORM imaging of GKAP or Shank (1:200, Neuromab) was performed as previously described4.
Single molecule localization and analysis
All data analysis was performed offline using custom routines in MATLAB (Mathworks). Molecule locations were determined by fitting an elliptical 2D Gaussian function to an 11×11 pixel array (pixel size 100 nm) surrounding the peak4. The lateral (x, y) and axial (z) coordinates of the fluorophore were determined from the centroid position and ellipiticity of the fitted peak, respectively8. Only molecules localized with an x-y precision <10 nm37, fitting R2 > 0.6, and comprising >200 photons were used for further analysis.
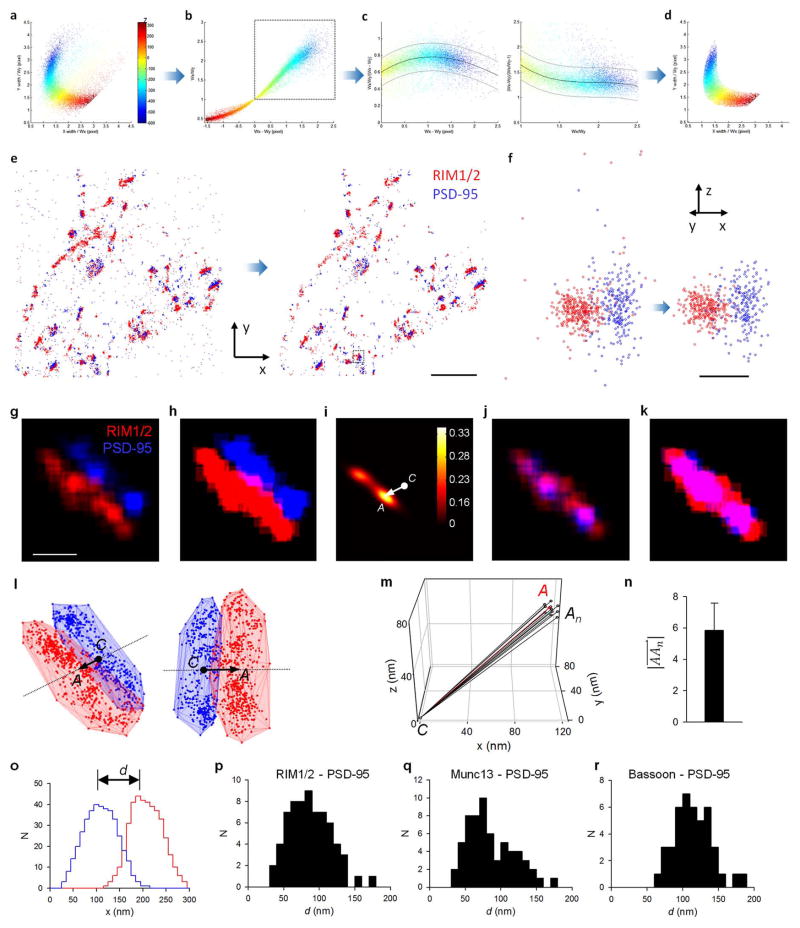
To remove the localizations from those fittings of multiple overlapping peaks, we developed a rejection criteria based on the shape of peaks. For peaks arising from single fluorophores, the fitted width in x and y (Wx and Wy, respectively) should correlate in a manner mainly determined by the cylindrical lens. All localizations away from this correlation would come from multiple overlapping or poorly fitted peaks and therefore were rejected (Extended Data Fig. 1a–f).
Single molecule tracking was employed to remove the overcounted localizations from peaks lasting for more than one frame. Tracking was accomplished with available algorithms (http://physics.georgetown.edu/matlab/). Particles appearing in consecutive frames separated by no more than 200 nm were collapsed into one track and considered one molecule by taking only the location in the first frame for further analysis.
Analysis of synaptic clusters
A potential synapse could be identified by a juxtaposed pair of synaptic proteins in a 2D scatter plot of all accepted localizations from both channels. By rotating a 3D scatterplot of localizations of a selected potential synapse, we evaluated the data quality and selected only those with clear pre- and postsynaptic components (e.g. no nearby third cluster which may indicate two synapses in close proximity) for further analysis. To define the border of a synaptic cluster, the nearest neighbor distances (NND) between localizations were calculated and the mean + 2 × standard deviation of NND was used as a cutoff to divide the localizations into sub-clusters. All localizations outside of the primary sub-clusters were considered to be background and discarded.
Due to the irregularly curved shapes of some synapses, using the convex hull to define synaptic cluster shape would overestimate the synaptic cluster volume. We thus defined the synaptic cluster using the alpha shape of the set of 3D localizations with α = 150 nm. This value was determined based on series of tests on >100 synapses to obtain the best synaptic cluster shape while avoiding dramatic changes in volume when individual localizations near the border were added or removed. This alpha shape algorithm gave a synaptic cluster volume of 81 ± 3 % of the convex hull volume (n = 156 synapses). Subsequently, this alpha shape was used as the cluster border when localizations were randomized.
A synaptic cluster was only considered for analysis if the volume was between 2 × 10⁻³ μm3 and 30 × 10−3 μm3 (Cit.38), and contained an average density of > 8 × 10³ localizations/μm3. Local density was defined as the number of molecules within a radius of 2.5 times the standard median nearest neighbor distance (MdNND) for the synaptic cluster density. The standard MdNND was calculated from a standard correlation curve (unit per 100 nm voxel for d) where d is the averaged localization density. This equation is derived from fitting MdNND with d in a series of simulations of uniformly distributed synaptic clusters with different densities. The reason we used this standard MdNND instead of the median NND from the original synaptic cluster was to reduce the deviation caused by local assembles.
Nanocluster analysis
Localizations with local densities ≥ 14 were selected and divided into agglomerative sub-clusters with a node height cutoff of 40 nm using Matlab functions linkage() and cluster(). For each sub-cluster, we then calculated the NND and discarded those localizations with NND > MdMND if any. Only those sub-clusters containing ≥ 4 localizations were counted as nanoclusters (NCs).
These criteria were chosen based on a conservative strategy such that no NCs were identified in simulations of randomly distributed synaptic clusters with different densities. Consequently, they may have prevented detection of small or weakly enriched NCs. In principal, we cannot completely exclude the possibility of overcounting, so a certain fraction of detected NCs are potentially artificial. However, we employed the same standard on all datasets. Since all the transsynaptic analyses were well controlled by randomizing simulations, this contamination is not able to produce false positives for transsynaptic alignment analyses. On the contrary, it may attenuate the significance of the differences in transsynaptic analyses based on NCs, including cross-correlation, protein enrichment and the fraction of enriched NCs.
Since the number of localizations in one NC was typically small, using convex hull or alpha shape would greatly under-estimate the NC volume due to the border effect. Therefore, we tessellated the synaptic cluster with polyhedrons using Matlab function voronoin(), with each Voroni cell containing one localization. The NC volume was calculated as a summation of volumes of all polyhedrons containing the NC localizations. To avoid unexpected unbounded voronoin cells and over-estimating the volume of cells near the cluster surface, we introduced ~10% background noise by adding randomly distributed localizations around the cluster15. Polyhedron volume for each localization was averaged across ten independent simulations.
Autocorrelation function (ACF) analysis
To quantify the self-clustering of synaptic proteins, we adapted an autocorrelation function4,39 for our 3D data. The autocorrelation function g(r) is a measure of density correlations, which reports increased probability of finding a second localized signal a distance r away from a given localized signal. It was tabulated in Matlab using Fast Fourier Transforms (FFTs), as in Eq. 1.
| (1) |
FFT−1 is an inverse Fast Fourier Transform, I is the reconstructed 3D density matrix of localized fluorophores (pixel size of 5 nm), ρ is the general localization density inside the synaptic cluster, and W is a shape function that has the value of 1 inside the synaptic cluster as defined above with an alpha shape and the value of 0 elsewhere. The matrix I was padded with zeros in all three directions out to a distance larger than the range of the desired correlation function (we used 200 nm) to avoid artifacts due to the periodic nature of FFT functions. W was also padded by an equal number of zeros. FFT−1(|FFT(W)|2) is a normalization factor accounting for the general shape of the synaptic cluster itself so that the output of the ga(r⃗) represented only the internal structure of the measured synaptic cluster. ga(r⃗) was symmetric to rotations around the center of matrix C(xc, yc, zc), and it could be averaged over angles to obtain ga(r) by converting to polar coordinates. ga(r) was then binned by radius (r). Correlation functions were plotted for r > 0, as ga(r = 0) was a trivial contribution.
For a uniform distribution, e.g. when all localizations were uniformly randomized within the alpha shape, ga(r) = 1 (Fig. 1d). Any heterogeneity will result in a ga(r) > 1. The extent of ga(r) over 1, i.e. r0 for ga(r0) =1, is related to the pattern size of the internal heterogeneity (Extended Data Figure 2b–c)39.
Isolated, non-synaptic small groups of localizations were taken from our experimental data. These localization groups likely represent an overestimate of a single-dye-molecule localization spread. Nevertheless, we find that they are still significantly smaller than the large majority of the nanoclusters we detected.
Imaging vesicle exocytosis
For imaging vesicle fusion, vGluT-pHluorin-mCherry (a gift from Timothy Ryan)40,41, was cotransfected with Synapsin1a-CFP (a gift from George Augustine) using Lipofectamine 2000 (Invitrogen) for 4–6 days before imaging cells at 14–20DIV. Optical measurements were performed using a laminar-flow perfusion and stimulation chamber. Images were acquired at 10 Hz with an Andor iXon 887 EM-CCD camera on an Olympus IX81 ZDC2 inverted microscope with a 100X/1.49 TIRF oil immersion objective. Temperature was controlled using an objective heater set at either room temperature (~25°C) or 32°C. Action potentials were evoked by passing 1 ms current pulses yielding fields of ≈10-V/cm via platinum-iridium electrodes. Terminals were selected for imaging by assessing their responsiveness, as indicated by a fluorescence increase, to a 10 AP train at 20 Hz. A widefield Syn1a image was then taken at the imaging plane. Single AP-evoked release was measured over 60 trials of (1) 1 s acquisition of baseline fluorescence, (2) stimulus, (3) 2.5 s acquisition of post-stimulus fluorescence, (4) 7 s recovery during which the laser is off. Spontaneous release was measured over 5 min of continuous acquisition. Cells were imaged in a saline solution containing 120 mM NaCl, 3 mM KCl, 2 mM CaCl2, 2 mM MgCl2, 10 mM glucose, and 10 mM HEPES, pH adjusted to 7.4 with NaOH, 10 μM 6,7-dinitroquinoxaline-2,3-dione (DNQX; Sigma), 50 μM D,L-2-amino-5-phosphonovaleric acid (AP5; Sigma), and 500 nM Jasplikinolide (Jasp; Millipore) at room temperature (~25C). When higher [CaCl2] was used, [MgCl2] was reduced to keep the divalent ion concentration constant. For measurements of spontaneous events, 500 nM tetrodotoxin (TTX; Enzo) was added after identifying terminals using AP-evoked fluorescence increase.
For calculating normalized changes in fluorescence (dF/F), images were analyzed in ImageJ by custom-written plugins12. Average fluorescence intensities were measured over a circular region of interest (ROI) of radius 800 nm for each bouton. Change in fluorescence (dF) was calculated as the difference in intensity of the frame after the stimulus was delivered and the average ROI intensity of 5 baseline frames not including the first frame or the frame immediately before the stimulus (Fbaseline). dF/F was calculated by normalizing each dF to Fbaseline.
pHuse localization and analysis
Data analysis was performed offline using custom routines in MATLAB (Mathworks). Boundaries for individual boutons were determined using widefield images of Syn1a-CFP centered at the focal plane of the pHuse experiments thresholded at 50% of the peak intensity (33% and 67% thresholds were also compared and showed no significant difference on the effect of mode of release, shown in Extended Data Fig. 5i). Binary images were created from the thresholded image, and Syn1a-CFP puncta area calculated as a measure of bouton area, which correlated with pHuse area, as expected42. Images for each fusion event were processed using frame-by-frame subtraction followed by background subtraction to isolate fluorescence increases (Fig. 2d)43. Similar detection thresholds were set for spontaneous (75 ± 15) and evoked (78 ± 14, t = 0.88, p = 0.40) release, at ~3–4 times above background noise, on an individual imaging field basis. Spatial localization of the fusion events were determined by fitting an elliptical 2-dimensional Gaussian function to a 9×9 pixel array surrounding the peak. Only molecules localized with a precision <25 nm37,44, elliptical form <1.3, and comprising >100 photons were used for further analysis. An additional criterion to exclude evoked pHuse localizations with photon counts > mean + 2SD of spontaneous photon count distribution was used in Extended Data Fig. 5d and showed no significant difference compared to the distribution lacking this criterion. Localizations from multiple fusion events over time at individual boutons were mapped. A 2D convex hull algorithm was used to calculate the minimal convex polygon that incorporated all fusion site localization points. The area of the resulting polygon was used as the fusion site (pHuse) area.
Photon count distributions analysis
Data analysis was performed offline using custom routines in MATLAB (Mathworks). The distribution for spontaneous fusion events was fit with a normal distribution using normfit(), which uses maximal likelihood estimation for optimization. The distribution of evoked fusion events was fit with a custom univariate distribution for a mixture of two normal distributions with a probability density function (pdf) defined in Eq. 2. This fitting also used maximal likelihood estimation for optimization of five parameters, including the mixture probability (p), and the population means (μ1, μ1) and variance (σ1, σ2) for each component, over 300 iterations using normpdf() to compute the pdf for each of the two component normal distributions.
| (2) |
Here p was constrained between 0 and 1, and σ had a lower bound of 0. This mixture probability defined the lower estimate (72%) for the percentage of single stimulus evoked fusion arising from single vesicles. We calculated the higher estimate (82%) by calculating the percent of evoked fusion events with photon counts within two standard deviations of the mean spontaneous fusion event photon count. To assess the influence of multivesicular events on evoked pHuse area, we used this as a cutoff to exclude localizations above this photon count. We found no significant difference between evoked area with and without excluding these events (Extended Data Fig. 5d).
Ca2+ imaging and analysis
For Ca2+ imaging, the genetically encoded indicator GCaMP6f45 was transfected at 14 DIV and imaged 3 days after transfection. GCaMP6f was used to detect postsynaptic miniature spontaneous Ca2+ transients (mSCaTs) that arose in dendritic spines following NMDA receptor activation by spontaneous release46. Coverslips were placed in custom-made chambers in saline solution containing 1 μM TTX, 10 μM DNQX, 25 μM picrotoxin (Sigma), and 5 μM nifedipine (Sigma). Imaging was performed on a spinning disk confocal system (Andor Technology), consisting of a CSU-22 confocal (Yokagawa) with a Zyla 4.2 CCD camera detector (Andor) mounted on the side port of an Olympus IX-81 inverted microscope, using a 60X/1.42 oil-immersion objective, yielding a final effective pixel size of 108 nm. Continuous acquisition at 20 Hz was collected for 3 minutes, controlled by iQ software (Andor).
Data analysis was performed offline using custom routines in Metamorph (Molecular Devices), Clampex (Molecular Devices), and Matlab (Mathworks). First, using Metamorph, a baseline image was created by averaging the first three and last three image frames and a maximum intensity projection was made by averaging all image frames. Image subtraction of the baseline from the maximum intensity projection revealed spines that showed an increase in GCaMP intensity. Regions of interest (ROIs) were drawn around these “active” spines as well as a background region and then transferred to the original timelapse. For each ROI the averaged intensity was measured per frame. The average intensity of the background ROI was subtracted from the average intensity of “active” spine ROIs. From this, an average fluorescence intensity was calculated for every 10 frames, and within every minute interval of imaging the lowest positive value was used as the baseline fluorescence intensity for that minute (Fbaseline,1min). A normalized change in fluorescence (dF/F) was calculated for each frame as (Fframe − Fbaseline,1min) / Fbaseline,1min. The dF/F values were then fed into Clampex, and mSCaTs were detected using a template search that identified peaks based on a shape profile determined from mSCaT examples with near-average rise and decay time courses.
Confocal imaging of presynaptic proteins
Neurons 14–20DIV were cotransfected for 3 days with RIM1-mVenus (a gift from P. Kaeser) and Synapsin1a-CFP to assess colocalization. Neurons transfected with only RIM1-mVenus were immunostained with chicken anti-GFP (1:200, Chemicon) labeled with secondary anti-chicken-Alexa-488, rabbit anti-RIM1/2 labeled with secondary anti-rabbit-Cy-3, and mouse anti-Bassoon labeled with secondary anti-mouse-Alexa-647 to assess expression levels. Imaging was performed on a spinning disk confocal system as described above. ImageJ was used to analyze fluorescence intensity of RIM1/2 and Bassoon at transfected compared to neighboring untransfected boutons.
PALM-pHuse
RIM1-mEos3.1 was constructed by subcloning mEos3.1 from mEos3.1-N1 (a gift from S. McKinney) into pCMV5-RIM1-mVenus (P. Kaeser) in place of mVenus at NotI-AscI. PALM was performed on RIM1, and nanoclusters identified using local density measured by nearest neighbor distance as previously described4, or using an adapted form of SR-Tesseler first rank neighbor density (δ1), using 2× mean δ1 of the whole synapse as the threshold for identifying nanoclusters, as described in Levet et al. (2015)15. Nanoclusters identified by both methods were similar in size (Extended Data Fig. 6). To map vesicle fusion to AZ nanostructure, RIM1-mEos3.1 was cotransfected with vGpH at 10–14DIV and imaged at 14–18DIV. RIM1 PALM and pHuse of 1-AP-evoked release was performed as described above sequentially on the same boutons. Overlapping RIM1 and pHuse localizations were analyzed at boutons containing > 10 RIM1 localizations and > 3 pHuse localizations offline using custom routines in MATLAB (Mathworks). vGpH fluorescence increase following a 10 AP-train stimulus was used to outline the border of individual boutons. Randomized distributions of RIM1 were simulated for each synapse by randomly placing the same number of RIM1 localizations within the same area of RIM1 as calculated by convex hull of the measured RIM1 distribution. RIM1 local density within these randomized distributions was similarly calculated. Normalized RIM1 δ1 was calculated with respect to overall synaptic localization density.
3D Pair cross-correlation function (PCF) analysis
The 3D PCF was adapted from a similar function previously used to quantify colocalization in 2D data39. It was computed using two matrices (I1 and I2) reconstructed from two image channels (Eq. 3).
| (3) |
Here, conj[] is a complex conjugate, ρ1 and ρ2 are the averaged localization densities in the pair of synaptic clusters, W1 and W2 are shape functions of the two synaptic clusters, and Re{} indicates the real part. Different from the ACF, the symmetric origin of gc(r⃗) here is no longer the matrix center C(xc, yc, zc), but a different point A(x, y, z), and the vector represents the direction and distance for the translation of PSD-95 synaptic clusters (I2) to get the best overlap with presynaptic clusters (I1). We computed the direct correlation between I1 and I2 with Eq. 4.
| (4) |
A is the point with the peak G value. Because the originally constructed matrix I1 and I2 were not continuous, to reduce the noise of the correlation, we first convoluted the two matrixes with an 11×11×11 kernel (Extended Data Fig. 1g). To avoid having the correlation be dominated by local domains with high localization density, we cut the peaks of the convoluted matrixes to 1/4 of the mean localization density within synaptic clusters (ρ1/4 and ρ2/4) (Extended Data Figure 1h) so that G only represented the relationship between the general 3D shapes of the two synaptic clusters (I1′, I2′) without internal heterogeneity (Extended Data Figure 1m–n). Around A, gc(r⃗) is symmetric and could be angularly averaged to get gc(r).
Since the information of synaptic cluster shape and overall density had been normalized, gc(r) was fully dependent on the internal organizations of the two synaptic clusters. If localization assemblies inside the two synaptic clusters organized in a similar pattern and opposed each other, gc(r) > 1. If either synaptic cluster had a uniform distribution of localizations (Fig. 3b) or the internal assemblies were not aligned (Fig. 3c), gc(r) = 1. Different from the ACF, overcounting has no effect on the PCF39.
Protein enrichment analysis
The protein enrichment profile of protein-A relative to a protein-B NC, EA→B (r), was calculated as the angularly averaged localization density of protein-A around the aligned center of a protein-B NC normalized to the average localization density in synaptic cluster A. The aligned NC center was found as shown in Extended Data Fig. 1. To avoid potential problems caused by boundary conditions, we calculated the enrichment profile as Eq. 5.
| (5) |
NA→B (r) is the binned distribution of protein-A localization number to the aligned protein-B NC center, NAr(m)→B (r) is the distribution of localization number for a uniformly randomized synaptic cluster A with m times of original localization density, and m is a factor set to 15 to reduce the effect of fluctuations. A protein-B NC was considered to be significantly enriched with protein A if EA→B (r) > Mean[EAr→B (r)] + 1.96 × Standard Deviation[EAr→B (r)], where EA→B (r) represents the enrichment profile of 10 simulated uniformly randomized A synaptic clusters with the original density and the same alignment to the NC center of protein-B.
Chemical LTP and LTD
Chemical LTP was performed using a combination of APV withdrawal and application of glycine as described in Araki et al. (2015)19 Briefly, 3–4 weeks old cultures were treated with 200 μM DL-APV in culture medium for two days and then transferred to ACSF (150 NaCl, 3 KCl, 2 CaCl2, 1 MgCl2, 10 HEPES-Na, 10 D-Glucose, all in mM, pH 7.4) with 100 μM picrotoxin, 1 μM strychnine, 0.5 μM TTX and 200 μM APV. After preincubation for 1–2 hours, chemical LTP was induced with 15 min incubation in the similar solution with 200 μM glycine but without Mg2+ and APV. Neurons were fixed directly following induction. Chemical LTD was performed using application of NMDA as described in Lee et al. (1998)20. Control solutions of regular saline solution or coapplication with APV were paired with experimental conditions. Cells were fixed either immediately after plasticity induction or washed with saline and incubated for 25 min at 37°C to allow recovery prior to fixing. Cells were then immunostained and imaged as described above.
Synaptic modeling
We used an experimentally constrained deterministic approach to study the dependence of synaptic strength on the spatial distribution of release sites and AMPARs. Central to this approach is the relationship between channel opening probability and its distance from a release site, determined previously by stochastic modeling approaches3,16,47:
| (6) |
where r is the lateral distance between an AMPAR and a release site. In brief, the distribution of RIM1/2 proteins and GluA2/3-containing AMPA receptors measured by STORM were used to determine the spatial coordinates of release sites and AMPARs on a model synapse. Since the precise photophysics and blink distribution of dyes are complicated and the exact efficiency of antibody labeling is unknown, we calculated gradient maps of spatial coordinates to determine putative RIM1/2 protein and AMPAR locations from the single-molecule images. First, the 3D spatial coordinates were projected onto 2D planes orthogonal to the manually determined axodendritic axis. Each projected point was assigned a Gaussian function, the amplitude and width of which were determined by the normalized local density and the lateral STORM localization precision (20 nm). Overlapping Gaussian functions within the AZ or PSD convex hull were integrated to create the pre- and post-synaptic gradient maps. The sampling pixel size was 2.5 nm (the calculated synaptic response was independent of pixilation level for sampling size from 1 to 20 nm, data not shown). The pre- and post-synaptic gradient maps were separated by 20 nm, the cleft distance used to determine Equation 63.
The model synaptic response for a single synapse was computed as the expected fraction of receptors that would open given a single release, averaged over all possible release locations in the AZ. For any single release event, the expected open fraction of channels at the peak of the response was calculated as follows:
| (7) |
where rij is the lateral distance between the ith pixel in the presynaptic gradient map and the jth pixel in the postsynaptic gradient map; the expected fraction of open channels O(i) from the ith release site is sum of channel opening probabilities at all pixels in the postsynaptic gradient map, where each jth pixel is weighted by its normalized local density LDj (i.e. the channel fraction is assumed to be directly proportional to the channel local density). To constrain the location of release events in the AZ, we utilized the live-cell pHuse-PALM data, which showed that release events preferentially occurred in regions with normalized RIM local density greater than 1.5, and these events occurred over 20–60% of the AZ area (spontaneous pHuse area / PALMed RIM area, and evoked pHuse area / spontaneous pHuse area). To account for these measured features, we modeled the spatial likelihood of release as a piecewise sigmoidal function dependent on the normalized local RIM density:
| (8) |
where s is the steepness of the sigmoid transition, LDi is the normalized local density of RIM at the ith pixel of the presynaptic gradient map, LDinflect is the point of inflection in the sigmoidal function, and LDmax is the maximum normalized local density of RIM in the STORM measured example shown in Extended Data Fig. 8b. LDinflect and s were fitted to be 1.5 and 0.959 in order to yield a fractional release area of 40%. To calculate the average peak synaptic response per release, we calculated the expected open channel fraction averaged over all possible release sites weighted by the spatial probabilities of release:
| (9) |
Code availability
All codes used in the paper are available upon request.
Statistical analysis
Statistical tests were performed with Sigmastat, Matlab, Graphpad, or R. No statistical methods were used to predetermine sample size. The sample sizes were determined based on numbers reported in previous studies. For comparison of two or more distributions, all samples were assessed for normality using Shapiro-Wilk or Kolmogorov-Smirnov tests. If samples met criteria for normality, we used a student’s t-test to compare two groups, a paired t-test for comparison of the same group before and after a treatment, or ANOVA for more than two groups. If ANOVAs were significant, we used a post-hoc Tukey test to compare between groups. For groups with combinations of discrete and continuous variables, we used MANCOVAs. We only performed two-tailed tests. Homogeneity of variances was tested using an F-test and found to be similar between compared groups. If samples did not meet criteria for parametric tests, we used Kolmogorov-Smirnov or Wilcoxon rank-sum tests for comparison of two groups and Kruskal-Wallis or Friedman ANOVA for comparison of more than two groups, with post-hoc analysis using Dunn’s test. Data are presented as mean ± s.e.m unless otherwise specified. Also see supplemental tables.
Extended Data
Extended Data Figure 1. Filtering of localizations and automatic algorithm to detect the synaptic axis.
a, Scatterplot of fitted peak width in y (Wy) against that in x (Wx). The color codes the position in z. All localizations away from this center dense region arise from multiple overlapping or poorly fitted peaks and should be rejected. b, The ellipticity (Wx/Wy) and the width difference (Wx − Wy) formed an approximate linear relationship when Wx > Wy (dotted box). c, We fitted the ratios between ellipticity and the width difference to the denominators with third degree polynomial functions (black line) and rejected all localizations out of 95% confidence intervals (gray lines) of the curve (> 1.96 × standard deviation). The same criteria was applied to the other fraction of localizations with Wx < Wy. d, The same scatterplot as in a after rejection of all of the diffuse localizations (about 20–25%). e–f, The filtering protocol cleared up most of the localizations from multiple overlapping peaks or poorly fitted peaks, including most of the nonrelevant background localizations (e, scale 2 μm) and those localizations with poorly calibrated z positions (f, scale 200 nm). The synapse in f corresponds to the boxed synapse in e. g, A 2D section through the center of the convoluted constructed 3D distribution matrix of a synapse. h, Peak density of the matrix set to a quarter of the mean molecule density of the synaptic cluster. i, 2D section at the same position of the 3D matrix of direct cross-correlation of the two channels (equation 3 in methods). C is the center of matrix, and A is the peak of the cross-correlation. j–k, Best overlap of the two synaptic clusters after PSD-95 was moved in 3D space along the vector . l, 3D scatter plots of the synapse in two different view angles. The arrow denotes the vector and the extended line (dotted) represents the synaptic axis. m, 3D plot of detected synaptic axis when the positions of high density peaks in RIM1/2 (nanoclusters) were randomized within the synaptic cluster. This simulation was performed 35 times, but only 10 representative results are presented here to avoid overlapping. The red denotes the synaptic axis of the original synaptic cluster. n, Averaged distance between the detected Cn positions from 35 simulated clusters to the C position of the original cluster. Data shown in mean ± s.d. This < 6 nm distance confirms that the high density peaks have negligible effect on the detection of the synaptic axis in this method. o, Distribution of all localizations along the synaptic axis with bin size of 10 nm. Peak-to-peak distance between the synaptic protein pair can be measured from this distribution. p–r, Distribution of peak-to-peak distances for three pairs of synaptic proteins.
Extended Data Figure 2. Nanocluster organization of vesicle release machinery proteins in the active zone and postsynaptic AMPA receptors.
a, En-face (top) and side (bottom) views of local density maps of a simulated synapse with artificial NCs with 40 nm diameters, scale 100 nm. b, Autocorrelation function of simulated clusters with different sized NCs. The points represent the radius where g(r) = 1. c, Pooled data from 15 sets of simulations showing that the radius where g(r) first crosses 1 reasonably estimates the average NC diameters. d, Comparison of NC number, fraction of localization in NC, and NC volume across different developmental stages shows no significant difference, though the young DIV9 culture shows a trend toward increased NC numbers (one-way ANOVA on ranks for NC number and volume, one-way ANOVA for %localization in NC). Data were from 143 RIM NCs and 135 PSD NCs of 64 DIV9 synapses, 63 RIM NCs and 65 PSD NCs of 38 DIV14 synapses, and 44 RIM NCs and 41 PSD NCs from 28 DIV21 synapses. e, Comparison of two RIM antibodies (from left to right) in whole synaptic cluster volume, number of NCs, autocorrelation function estimating average NC diameter, and protein density relative to PSD-95 NC centers. Anti-RIM1/2 (Synaptic Systems #140–203) targets the Zn-finger domain and anti-RIM1 targets the PDZ domain of RIM1 (Synaptic Systems #140–003). These tests suggest that there is no significant difference between these two antibodies. The numbers in bars denote the group sizes. f, Local density maps of en-face (top) and side (bottom) views of an example Munc13 cluster, scale 200 nm. g, Auto-correlation functions for Munc13 distributions compared to simulated randomized distributions. h–i, Local density maps and ACF of Bassoon cluster, scale 200 nm. j, Pooled cluster volumes, normalized to PSD-95 volumes within each synapse. Each bar pair represents data from a set of RIM1/2-PSD-95, Munc13-PSD-95 or Bassoon-PSD-95 staining. The numbers in bars denote the group sizes. k, Distribution of en-face distances between NC center and synapse center. Data were normalized to the distribution of simulated clusters with the same number of NCs as the original synapse but randomized positions. l, An example synapse with RIM1/2 and Munc13 staining of the same synapse, shown in two different angles. The translucent surfaces represent the alpha shapes that define the synaptic cluster borders. m, Pooled RIM1/2 and Munc13 cluster volumes, normalized to RIM1/2 within each synapse. n, Pooled RIM1/2, Munc13 and Bassoon cluster volumes from staining of RIM1/2-Bassoon and Munc13-Bassoon, normalized to Bassoon within each synapse. *p<0.05, ***p<0.001, Wilcoxon signed-rank test. †p<0.05, one-way ANOVA on ranks with pairwise comparison procedures (Dunn’s method). o, Local density map of a GluA2 cluster. p, Auto-correlation functions for GluA2 distributions compared to simulated randomized distributions. q, Local density map of a GluR2/3 cluster. r, Auto-correlation functions for GluR2/3 distributions compared to simulated randomized distributions.
Extended Data Figure 3. Detected nanoclusters unlikely due to labeling artifact or overcounting of molecules.
a–i, Comparison of PSD-95 labeled with monoclonal primary antibodies directly conjugated to Alexa 647 dye (1°-A647, red) with the same molecules labeled with primary and secondary antibodies conjugated to Cy3 (1°-2°-Cy3, blue) as represented in c. a–b, Comparison between non-synaptic small groups of localizations arising from isolated primary antibodies and secondary antibodies. Schematic shown in (a). Standard deviation of localizations in both groups along different dimensions (n = 32 for A647; n = 36 for Cy3) in (b). The two types of localizations groups showed similar variation in all dimensions. d, Local density maps of the same PSD-95 cluster labeled with 1°-A647 (top) and 1°-2°-Cy3 (middle) and overlapped distribution of 1°-A647 and 2°-Cy3 with detected nanoclusters highlighted in darker colors (bottom), scale 200 nm. e, Autocorrelation of synaptic clusters labeled with 1°-A647 and 1°-2°-Cy3. f, Autocorrelation of isolated small groups of localizations of A647 and Cy3 dyes. g, Comparison of the radius at which the autocorrelation function crossed with the random level (g(r) = 1). There was no difference between PSD-95 clusters with different labeling methods, but the r(0) for isolated localization groups were significantly less than r(0) for PSD-95 clusters. . **p < 0.01, t-test between the filled and open bars of the same color. h, NCs detected in both channels displayed no difference in number, volume, or the fraction of NCs enriched with localizations from the other channel. i, Protein enrichment of localizations detected in each channels with those in the other channel (n = 32 synapses). These results demonstrate that the NCs we detected in our study were not due to aggregation of multiple secondary antibodies to the primary antibodies. j–r, Cells transfected with knockdown-rescue-PSD-95-GFP were labeled with nanobodies against GFP conjugated at a 1:1 ratio with Atto647 (Nb-At647, red) and primary/secondary antibodies against PSD-95 (1°-2°-Cy3, blue) as depicted in l. j–k, Comparison between non-synaptic small groups of localizations arising from isolated Nb-At647 and 1°-2°-Cy3 (as depicted in j, n = 26 and 28, respectively). k, The nanobodies showed a significant smaller size than antibodies. ***p < 0.001, two-way ANOVA, †p<0.05, ††p<0.01, pairwise comparison (Tukey Test) between nanobodies and antibodies. m–r, Similar comparison as in d–i between PSD-95 clusters labeled with Nb-At647 and 1°-2°-Cy3 (n = 13 synapses). Scale 200 nm. Overall, these results demonstrated that the NCs we detected in our study were unlikely due to artifacts of antibody binding and labeling. The difference between the size of the isolated localizations groups and PSD-95 clusters calculated by autocorrelation also argues against the possibility that the nanoclusters we detected were due to repetitive switching of one or a few fluorophores. **p < 0.01, t-test between the filled and open bars of the same color. s, An example synapse with nanoclusters highlighted before (upper) and after (lower) removal of localizations resulting from fluorophores lasting for multiple frames, scale 100 nm. t, Paired autocorrelation function of synaptic clusters with and without multiple-frame molecules. p = 0.77, n = 25 synapses for RIM1/2; p = 0.58, n = 25 synapses for PSD-95, two-way ANOVA with repeated measures. u, The tracking removed 13 ± 8% and 17 ± 9% of the localizations for RIM1/2 and PSD-95, respectively, but had no significant effects on autocorrelation function results, NC numbers, or NC volumes. ** p < 0.01, *** p < 0.001, NS p > 0.05, Wilcoxon signed-rank test.
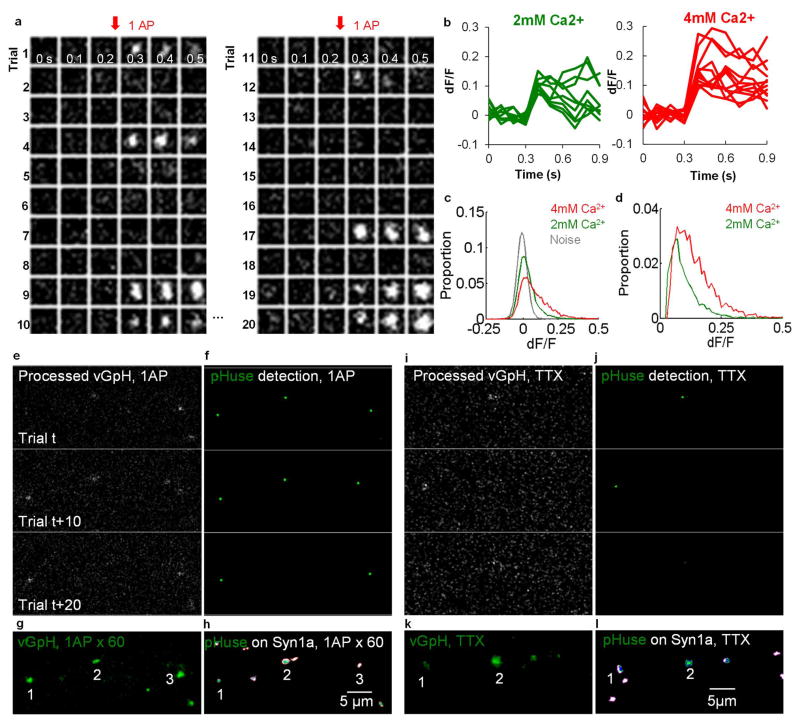
Extended Data Figure 4. 1AP evoked release is [Ca2+] dependent and mainly univesicular48.
a, Example of fluorescence signals at a single bouton over repeated trials of 1 AP stimulation. b, Single event traces of vGpH fluorescence increase following 1 AP stimuli in standard (2 mM) or heightened extracellular [Ca2+] (4 mM). c, Comparison of distributions of fluorescence changes in 2 mM (n = 233/27) and 4 mM (n = 115/12) extracellular [Ca2+], relative to noise distributions obtained from the baseline frames prior to stimulation. d, Comparison of noise-subtracted distributions of fluorescence changes in different [Ca2+]. e, Processed images of vGpH fluorescence increase following 1 AP stimuli from 3 trials 10 trials apart. f, Automatic detection using pHuse of events shown in e. g, Summed projection of framewise and background subtracted vGpH fluorescence increases over 60 trials. h, pHuse localizations on Syn1a (white). i–l. Same as e–h for spontaneous events in TTX over 5 minutes. n given in synapses/experiments.
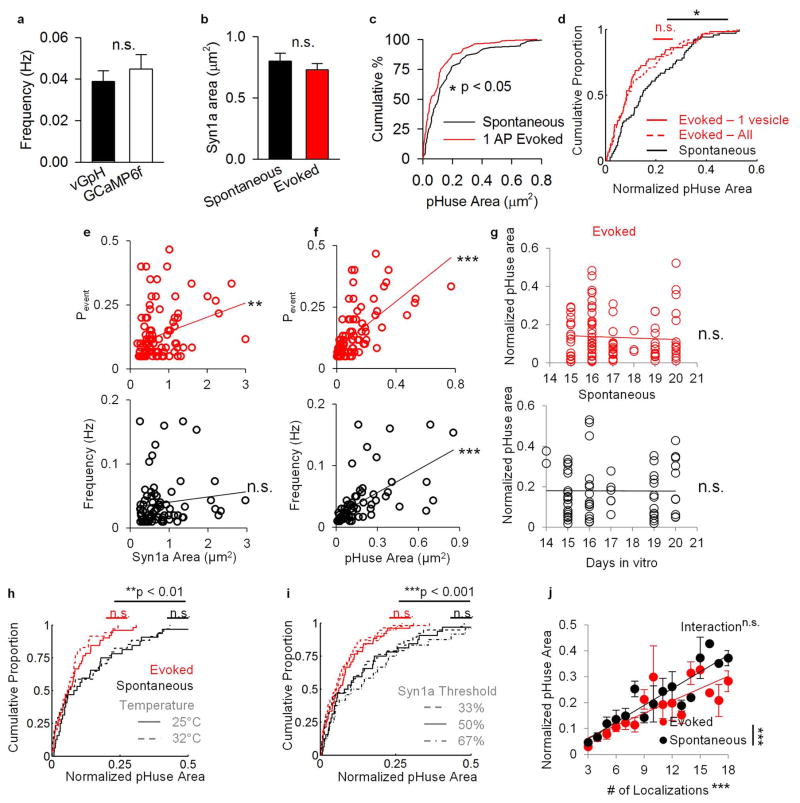
Extended Data Figure 5. pHuse reveals differences between evoked and spontaneous fusion site areas.
a. Comparison of spontaneous frequency measured presynaptically using vGpH (n = 77/22) and postsynaptically using GCaMP6f 45(n = 61/5), t = 1.02, n.s. b. Average bouton areas across groups, t = 0.87, n.s. c. Cumulative distributions of fusion areas for spontaneous and evoked release (K–S test, D = 0.23*) d. Cumulative distributions of normalized fusion areas for 1 AP evoked fusion excluding events with photon counts > mean + 2SD of spontaneous events (n = 91/27) compared to all evoked events (n = 104/28, K–S test, D = 0.05, n.s.) and spontaneous events (n = 77/22, K–S test, D = 0.25*) e–f. Interestingly, while evoked Pr was significantly positively correlated with Syn1a area, as reported previously50, spontaneous event frequency showed no relationship with Syn1a area (e, linear fit, evoked R = 0.30**, spontaneous R = 0.12, n.s.). On the other hand, both spontaneous event frequency and evoked Pr significantly positively correlated with pHuse area (f, linear fit, evoked R = 0.64***, spontaneous R = 0.60***). This suggests that pHuse area may be a better approximate for AZ area and the functional parameters of a synapse than bouton area. g. Normalized pHuse area as a function of cell age shows no significant correlation (evoked R = 0.03, n.s., spont R = 0.004, n.s.). e–g: nevoked = 104/28, nspont = 77/22. h. Normalized pHuse area was not significantly different at RT (nevoked = 51/10, nspont = 32/7) vs physiological temperature (nevoked = 35/9, nspont = 34/4) within modes of release but still significantly different between modes of release. i. Normalized pHuse area was not significantly different at different thresholds for Syn1a within modes of release but still significantly different between modes of release (n = 51/10). j. Both numbers of events and mode of release are significant factors for pHuse area, but they do not have a significant interaction nevoked = 155/38, nspont = 109/29. (For i–j, see Supplementary Tables for statistics.) n given in synapses/experiments, n.s. = not significant, *p < 0.05, **p < 0.01, ***p < 0.001.
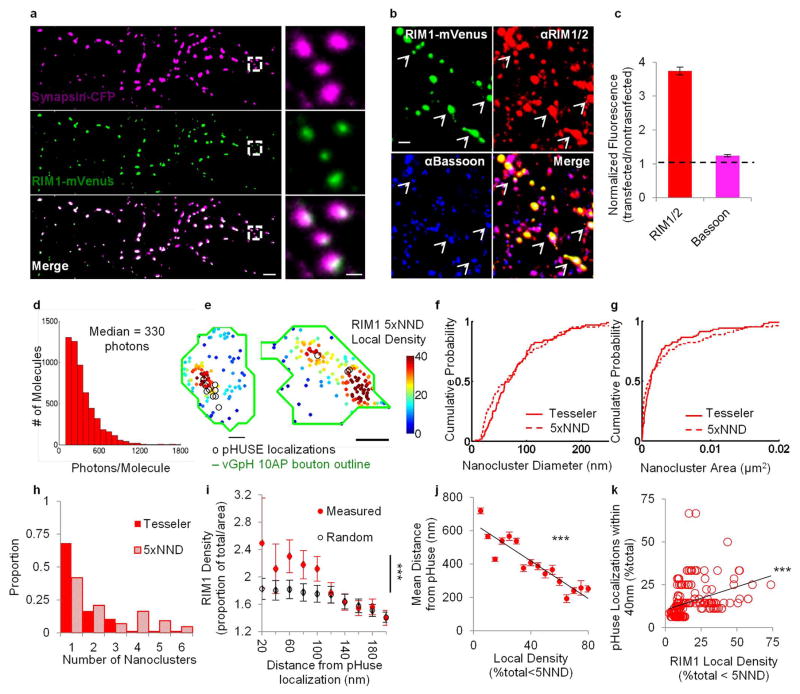
Extended Data Figure 6. RIM1-mEos3.1 PALM identifies NCs.
a. Neurons coexpressing RIM1-mVenus (a generous gift from Pascal Kaesar) and Syn1a-CFP colocalize to the same boutons. Right panels show enlargement of areas within the white boxes, scale 5 μm (left) and 1 μm (right). b. Neurons expressing RIM1-mVenus immunostained for RIM1/2 and Bassoon. Arrowheads point to some colocalized AZs, scale 2 μm. c. Immunofluorescence intensity of transfected cells normalized to nearby untransfected cells show 3.74 ± 0.11-fold overexpression of RIM and 1.24 ± 0.03-fold increase in Bassoon (n = 262 synapses/7 cells). d. Photon count distribution of RIM1-mEos3.1 (3997 localizations). e. Same boutons shown in Fig. 2 visualized using 5 × Nearest Neighbor Density (NND) as a measure of local density. f–h. Cumulative distributions of PALMed RIM1 NCs diameter, area, and number, respectfully, identified using adapted Tesseler analysis and 5 × NND analysis (n = 65/13). i. RIM1 localization density as a function of radial distance from pHuse localizations. (See Supplementary Tables for statistics.) j. Mean distance from pHuse localizations as a function of local density measured by 5 × NND (Raw data R = 0.23***, n = 26/13). k. Proportion of pHuse localizations within 40 nm of a RIM1 localization as a function of RIM1 local density measured by 5 × NND (R = 0.35***). n given in synapses/experiments unless otherwise specified, ***p < 0.001.
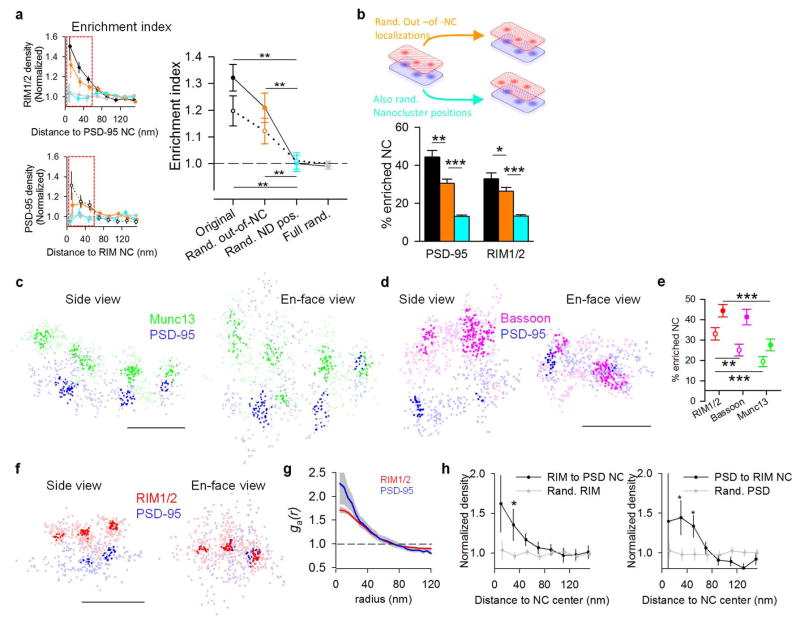
Extended Data Figure 7. Protein enrichment within nanocolumns.
a, Enrichment index between RIM1/2 and PSD-95. The left insets are replicas of Fig. 3e, and the enrichment index is defined as the average of the first three bins in the enrichment profile (boxed), i.e. normalized localization density within 60 nm from the projection center of a given NC. Filled points show RIM1/2 relative to PSD-95 NCs, open points show PSD-95 relative to RIM1/2 NCs. Same randomizations as in Fig. 3e and depicted again in b. **p<0.01, ***p<0.001, one-way ANOVA on ranks with pairwise comparison procedures (Dunn’s method). b, The fraction of enriched NCs is significantly above chance level, and is also dependent on the relative position of the two sets of NCs. c–d, Side and en-face views of a synaptic Munc13 and PSD-95 pair and a synaptic Bassoon and PSD-95 pair with highlighted nanoclusters, scale 200 nm. e, Pooled enrichment index of three AZ proteins and PSD-95, scale 200 nm. Filled points show AZ proteins relative to PSD-95 NCs, open points show PSD-95 relative to AZ protein NCs. **p<0.01, ***p<0.001, one-way ANOVA on ranks with pairwise comparison procedures (Dunn’s method). f, Example of RIM1/2 and PSD-95 in adult hippocampal slices. g, Auto-correlation functions of RIM1/2 and PSD-95 (n = 192 and 43 synapses, respectively). There were, on average, 2.02 ± 0.08 and 1.32 ± 0.21 NCs with a volume of (3.6 ± 0.2) and (4.2 ± 0.7) × 105 nm3 for RIM1/2 and PSD-95, respectively. Except PSD NC number which was significantly less than that in cultures (p = 0.03), all other parameters were similar (Wilcoxon signed-rank test). h, Enrichment profile between RIM1/2 and PSD-95 in tissue slices (28 synapses from 7 sections, 4 animals). *p<0.05 between measured and randomized synapses, two way ANOVA with pairwise comparison procedures (Dunn’s method).
Extended Data Figure 8. Preferential release in nanocolumns can increase synaptic strength.
a, Schematic of the experimentally constrained, deterministic approach used to study the dependence of synaptic strength on the spatial distribution of release sites and AMPARs. The simulated release site distribution at a synapse was drawn from its measured RIM positions and the average measured relationship between RIM density and pHuse locations (Fig 2). b, Distributions of measured RIM localizations within a single active zone (AZ) boundary (grey), and the same cluster with randomized positions of the indicated subsets of molecules. c, Maps of RIM local density normalized to the overall densities within the AZs. d, Probability density maps of possible release sites given that a release occurs. e, Distributions of GluA2/3 locations within the PSD boundary (grey) of the same measured synapse (ellipses refer to this distribution) and randomized. f, Maps of fraction of open channels at peak response per average release from the respective AZs directly above them in d. g, Calculated open channels at peak response, n = 20 randomly generated molecular distributions. See methods for more details.
Extended Data Figure 9. Enrichment of other scaffolding proteins within nanocolumns.
a, Enrichment of Homer1 with PSD-95 NCs, n = 118 NCs from 48 synapses, scale 100 nm. b, Enrichment of RIM1/2 to Shank NCs, n = 80 NCs from 32 synapses, scale 200 nm. *p<0.05, ANOVA on ranks with pairwise comparison procedures (Dunn’s method) in a and b. c, GKAP2 and Shank3 densities (determined with STORM, n = 6 and 12, respectively) within PSD-95 NCs (determined with PALM of transfected knockdown-replacement-PSD-95-mEos2) normalized to total PSD densities. Both proteins showed significant enrichment in PSD-95 NCs, *p<0.05, paired t-tests. d, Three-color STORM imaging of RIM1/2, GKAP1 and PSD-95 on the same synapses example (left) and protein enrichment profiles of RIM1/2 and GKAP1 with respect to PSD-95 NCs (right), n = 32 NCs from 17 synapses, scale 200 nm. e, Enrichment indices of RIM1/2 and GKAP1 relative to PSD-95 NCs. Color-coded bars represent the same set of randomizations as performed in Fig. 3c: orange denotes randomization of only out-of-NC localizations, cyan denotes randomization of NC positions within synaptic clusters and grey denotes randomization of all localizations. f, The percentage of PSD-95 NCs that were enriched with GKAP1, RIM1/2 or both with color-coded randomizations. *p<0.05, **p<0.01, ANOVA on ranks with pairwise comparison procedures (Dunn’s method), n = 32 NCs from 17 synapses in 7 different cultures. g, Schematic summary of the distribution of synaptic proteins within nanocolumns. The distributions of color-coded proteins are based on our results and the proteins in grey are hypothetical, some, such as Ca2+ channels, have been suggested previously to be clustered49,50.
Extended Data Figure 10. Plasticity within nanocolumns.
a, Changes in the localization density within RIM1/2 (red) and PSD-95 (blue) NCs under control, 5 min NMDA treatment, 25 min washout, and NMDA + APV treatment conditions. b–h, Reorganization of RIM1/2 and GluR2/3 under control, 5 min NMDA treatment, 25 min washout conditions examples (b), comparison of whole synaptic cluster sizes (c), NC number per synapse (d), localization density within NCs (e), enrichment indices (f), percentage of NCs that were enriched (g), and NC volumes (h). Note that similar to the results from the RIM1/2-PSD-95 analyses, only those RIM1/2 NCs that were enriched with GluR2/3 (dark red) were increased in volume. *p<0.05, **p<0.01, ANOVA on ranks with pairwise comparison to control group (Dunn’s method), and χ2 test for the proportion. Data from 62, 21 and 37 NCs from 34, 18 and 24 synapses for control, NMDA, and washout, respectively. i, Color coded local density map of an example live-PALMed PSD-95 cluster before and after NMDA treatment. Scale 100 nm. j–k, Changes in PSD-95 NC area induced by NMDA and blocked by APV (n = 28 and 21, respectively). **p<0.01, n.s. = not significant, paired t-test. l–n, LTP stimulation induced changes in NC volumes (l), localization density within NCs (m) and NC numbers (n). *p<0.05, ANOVA on ranks with pairwise comparison to control group (Dunn’s method).
Supplementary Material
Acknowledgments
We thank Scott Thompson, Thomas Abrams, Sandra Jurado, and George Wittenberg for advice and comments, Pascal Kaeser for advice on RIM expression and RIM antibodies, Yoichi Araki and Richard Huganir for advice on chemLTP, and Sai Sachin Divakaruni for advice and initial tests of chemLTP. We thank Pascal Kaeser for the generous gift of RIM1-mVenus, Timothy Ryan for vGlut1-pHluorin-mCherry, George Augustine for Synapsin1a-CFP, and M. Contreras for excellent technical assistance. This work was supported by F30-MH105111 to H.C., F30MH102891 to T.P.L., F31-MH105105 to S.R.M., T31GM008181 to H.C. and S.R.M., R01-MH080046 and NS090644 to T.A.B, and a gift from the Kahlert Foundation to T.A.B.
Footnotes
The authors declare no competing financial interests.
Author Contributions
A.T. and H.C. performed STORM experiments, A.T. designed 3D-STORM analysis, H.C. performed and analyzed pHuse and RIM PALM experiments, T.P.L. and A.T. performed simulations, S.R.M. performed GCaMP imaging and nanobody STORM experiments, H.D.M. performed PSD PALM experiments, and A.T., H.C., and T.A.B. designed the experiments and wrote the manuscript.
Supplementary Information is linked to the online version of the paper at www.nature.com/nature.
References
- 1.Fromer M, et al. De novo mutations in schizophrenia implicate synaptic networks. Nature. 2014 doi: 10.1038/nature12929. [DOI] [PMC free article] [PubMed] [Google Scholar]
- 2.Volk L, Chiu SL, Sharma K, Huganir RL. Glutamate Synapses in Human Cognitive Disorders. Annu Rev Neurosci. 2015;38:127–149. doi: 10.1146/annurev-neuro-071714-033821. [DOI] [PubMed] [Google Scholar]
- 3.Franks KM, Stevens CF, Sejnowski TJ. Independent sources of quantal variability at single glutamatergic synapses. The Journal of Neuroscience. 2003;23:3186–3195. doi: 10.1523/JNEUROSCI.23-08-03186.2003. [DOI] [PMC free article] [PubMed] [Google Scholar]
- 4.MacGillavry HD, Song Y, Raghavachari S, Blanpied TA. Nanoscale Scaffolding Domains within the Postsynaptic Density Concentrate Synaptic AMPA Receptors. Neuron. 2013;78:615–622. doi: 10.1016/j.neuron.2013.03.009. [DOI] [PMC free article] [PubMed] [Google Scholar]
- 5.Nair D, et al. Super-resolution imaging reveals that AMPA receptors inside synapses are dynamically organized in nanodomains regulated by PSD95. The Journal of Neuroscience. 2013;33:13204–13224. doi: 10.1523/JNEUROSCI.2381-12.2013. [DOI] [PMC free article] [PubMed] [Google Scholar]
- 6.Fukata Y, et al. Local palmitoylation cycles define activity-regulated postsynaptic subdomains. The Journal of cell biology. 2013;202:145–161. doi: 10.1083/jcb.201302071. [DOI] [PMC free article] [PubMed] [Google Scholar]
- 7.Sudhof TC. The presynaptic active zone. Neuron. 2012;75:11–25. doi: 10.1016/j.neuron.2012.06.012. [DOI] [PMC free article] [PubMed] [Google Scholar]
- 8.Huang B, Wang W, Bates M, Zhuang X. Three-dimensional super-resolution imaging by stochastic optical reconstruction microscopy. Science. 2008;319:810–813. doi: 10.1126/science.1153529. [DOI] [PMC free article] [PubMed] [Google Scholar]
- 9.Dani A, Huang B, Bergan J, Dulac C, Zhuang X. Superresolution imaging of chemical synapses in the brain. Neuron. 2010;68:843–856. doi: 10.1016/j.neuron.2010.11.021. [DOI] [PMC free article] [PubMed] [Google Scholar]
- 10.Park H, Li Y, Tsien RW. Influence of synaptic vesicle position on release probability and exocytotic fusion mode. Science. 2012;335:1362–1366. doi: 10.1126/science.1216937. [DOI] [PMC free article] [PubMed] [Google Scholar]
- 11.Watanabe S, et al. Ultrafast endocytosis at mouse hippocampal synapses. Nature. 2013;504:242–247. doi: 10.1038/nature12809. [DOI] [PMC free article] [PubMed] [Google Scholar]
- 12.Balaji J, Ryan T. Single-vesicle imaging reveals that synaptic vesicle exocytosis and endocytosis are coupled by a single stochastic mode. Proceedings of the National Academy of Sciences. 2007;104:20576–20581. doi: 10.1073/pnas.0707574105. [DOI] [PMC free article] [PubMed] [Google Scholar]
- 13.Leitz J, Kavalali ET. Fast retrieval and autonomous regulation of single spontaneously recycling synaptic vesicles. eLife. 2014;3:e03658. doi: 10.7554/eLife.03658. [DOI] [PMC free article] [PubMed] [Google Scholar]
- 14.Betzig E. Single Molecules, Cells, and Super-Resolution Optics (Nobel Lecture) Angewandte Chemie International Edition. 2015;54:8034–8053. doi: 10.1002/anie.201501003. [DOI] [PubMed] [Google Scholar]
- 15.Levet F, et al. SR-Tesseler: a method to segment and quantify localization-based super-resolution microscopy data. Nature methods. 2015;12:1065–1071. doi: 10.1038/nmeth.3579. [DOI] [PubMed] [Google Scholar]
- 16.Raghavachari S, Lisman JE. Properties of quantal transmission at CA1 synapses. Journal of neurophysiology. 2004;92:2456–2467. doi: 10.1152/jn.00258.2004. [DOI] [PubMed] [Google Scholar]
- 17.Tarusawa E, et al. Input-specific intrasynaptic arrangements of ionotropic glutamate receptors and their impact on postsynaptic responses. The Journal of Neuroscience. 2009;29:12896–12908. doi: 10.1523/JNEUROSCI.6160-08.2009. [DOI] [PMC free article] [PubMed] [Google Scholar]
- 18.Dudek SM, Bear MF. Homosynaptic long-term depression in area CA1 of hippocampus and effects of N-methyl-D-aspartate receptor blockade. Proceedings of the National Academy of Sciences. 1992;89:4363–4367. doi: 10.1073/pnas.89.10.4363. [DOI] [PMC free article] [PubMed] [Google Scholar]
- 19.Araki Y, Zeng M, Zhang M, Huganir RL. Rapid dispersion of SynGAP from synaptic spines triggers AMPA receptor insertion and spine enlargement during LTP. Neuron. 2015;85:173–189. doi: 10.1016/j.neuron.2014.12.023. [DOI] [PMC free article] [PubMed] [Google Scholar]
- 20.Lee HK, Kameyama K, Huganir RL, Bear MF. NMDA induces long-term synaptic depression and dephosphorylation of the GluR1 subunit of AMPA receptors in hippocampus. Neuron. 1998;21:1151–1162. doi: 10.1016/s0896-6273(00)80632-7. [DOI] [PubMed] [Google Scholar]
- 21.Sanderson JL, et al. AKAP150-anchored calcineurin regulates synaptic plasticity by limiting synaptic incorporation of Ca2+-permeable AMPA receptors. The Journal of Neuroscience. 2012;32:15036–15052. doi: 10.1523/JNEUROSCI.3326-12.2012. [DOI] [PMC free article] [PubMed] [Google Scholar]
- 22.Davis GW, Müller M. Homeostatic control of presynaptic neurotransmitter release. Annual review of physiology. 2015;77:251–270. doi: 10.1146/annurev-physiol-021014-071740. [DOI] [PubMed] [Google Scholar]
- 23.Liu KS, et al. RIM-binding protein, a central part of the active zone, is essential for neurotransmitter release. Science. 2011;334:1565–1569. doi: 10.1126/science.1212991. [DOI] [PubMed] [Google Scholar]
- 24.Holderith N, et al. Release probability of hippocampal glutamatergic terminals scales with the size of the active zone. Nature Neuroscience. 2012 doi: 10.1038/nn.3137. [DOI] [PMC free article] [PubMed] [Google Scholar]
- 25.Nakamura Y, et al. Nanoscale distribution of presynaptic Ca 2+ channels and its impact on vesicular release during development. Neuron. 2015;85:145–158. doi: 10.1016/j.neuron.2014.11.019. [DOI] [PMC free article] [PubMed] [Google Scholar]
- 26.Scimemi A, Diamond JS. The Number and Organization of Ca2+ Channels in the Active Zone Shapes Neurotransmitter Release from Schaffer Collateral Synapses. The Journal of Neuroscience. 2012;32:18157–18176. doi: 10.1523/JNEUROSCI.3827-12.2012. [DOI] [PMC free article] [PubMed] [Google Scholar]
- 27.Schneider R, et al. Mobility of Calcium Channels in the Presynaptic Membrane. Neuron. 2015;86:672–679. doi: 10.1016/j.neuron.2015.03.050. [DOI] [PubMed] [Google Scholar]
- 28.Tarr TB, Dittrich M, Meriney SD. Are unreliable release mechanisms conserved from NMJ to CNS? Trends in neurosciences. 2013;36:14–22. doi: 10.1016/j.tins.2012.09.009. [DOI] [PMC free article] [PubMed] [Google Scholar]
- 29.Lisman J, Raghavachari S. A unified model of the presynaptic and postsynaptic changes during LTP at CA1 synapses. Sci STKE. 2006;2006:re11–re11. doi: 10.1126/stke.3562006re11. [DOI] [PubMed] [Google Scholar]
- 30.Missler M, Südhof TC, Biederer T. Synaptic cell adhesion. Cold Spring Harbor perspectives in biology. 2012;4:a005694. doi: 10.1101/cshperspect.a005694. [DOI] [PMC free article] [PubMed] [Google Scholar]
- 31.Frost NA, Shroff H, Kong H, Betzig E, Blanpied TA. Single-molecule discrimination of discrete perisynaptic and distributed sites of actin filament assembly within dendritic spines. Neuron. 2010;67:86–99. doi: 10.1016/j.neuron.2010.05.026. [DOI] [PMC free article] [PubMed] [Google Scholar]
- 32.Kaech S, Banker G. Culturing hippocampal neurons. Nature protocols. 2006;1:2406–2415. doi: 10.1038/nprot.2006.356. [DOI] [PubMed] [Google Scholar]
- 33.van de Linde S, et al. Direct stochastic optical reconstruction microscopy with standard fluorescent probes. Nature protocols. 2011;6:991–1009. doi: 10.1038/nprot.2011.336. [DOI] [PubMed] [Google Scholar]
- 34.Gasser EMS, et al. Immunofluorescence in brain sections: simultaneous detection of presynaptic and postsynaptic proteins in identified neurons. Nature protocols. 2006;1:1887–1897. doi: 10.1038/nprot.2006.265. [DOI] [PubMed] [Google Scholar]
- 35.Geisler C, et al. Drift estimation for single marker switching based imaging schemes. Optics express. 2012;20:7274–7289. doi: 10.1364/OE.20.007274. [DOI] [PubMed] [Google Scholar]
- 36.Mlodzianoski MJ, et al. Sample drift correction in 3D fluorescence photoactivation localization microscopy. Optics express. 2011;19:15009–15019. doi: 10.1364/OE.19.015009. [DOI] [PubMed] [Google Scholar]
- 37.Thompson RE, Larson DR, Webb WW. Precise nanometer localization analysis for individual fluorescent probes. Biophysical journal. 2002;82:2775–2783. doi: 10.1016/S0006-3495(02)75618-X. [DOI] [PMC free article] [PubMed] [Google Scholar]
- 38.Schikorski T, Stevens CF. Quantitative ultrastructural analysis of hippocampal excitatory synapses. The Journal of Neuroscience. 1997;17:5858–5867. doi: 10.1523/JNEUROSCI.17-15-05858.1997. [DOI] [PMC free article] [PubMed] [Google Scholar]
- 39.Veatch SL, et al. Correlation functions quantify super-resolution images and estimate apparent clustering due to over-counting. PloS one. 2012:7. doi: 10.1371/journal.pone.0031457. [DOI] [PMC free article] [PubMed] [Google Scholar]
- 40.Kim SH, Ryan TA. CDK5 serves as a major control point in neurotransmitter release. Neuron. 2010;67:797–809. doi: 10.1016/j.neuron.2010.08.003. [DOI] [PMC free article] [PubMed] [Google Scholar]
- 41.Voglmaier SM, et al. Distinct endocytic pathways control the rate and extent of synaptic vesicle protein recycling. Neuron. 2006;51:71–84. doi: 10.1016/j.neuron.2006.05.027. [DOI] [PubMed] [Google Scholar]
- 42.Harris KM, Stevens JK. Dendritic spines of CA 1 pyramidal cells in the rat hippocampus: serial electron microscopy with reference to their biophysical characteristics. The Journal of Neuroscience. 1989;9:2982–2997. doi: 10.1523/JNEUROSCI.09-08-02982.1989. [DOI] [PMC free article] [PubMed] [Google Scholar]
- 43.Simonson PD, Rothenberg E, Selvin PR. Single-molecule-based super-resolution images in the presence of multiple fluorophores. Nano letters. 2011;11:5090–5096. doi: 10.1021/nl203560r. [DOI] [PMC free article] [PubMed] [Google Scholar]
- 44.Thompson MA, Lew MD, Moerner W. Extending microscopic resolution with single-molecule imaging and active control. Annual review of biophysics. 2012;41:321–342. doi: 10.1146/annurev-biophys-050511-102250. [DOI] [PubMed] [Google Scholar]
- 45.Chen TW, et al. Ultrasensitive fluorescent proteins for imaging neuronal activity. Nature. 2013;499:295–300. doi: 10.1038/nature12354. [DOI] [PMC free article] [PubMed] [Google Scholar]
- 46.Murthy VN, Sejnowski TJ, Stevens CF. Dynamics of dendritic calcium transients evoked by quantal release at excitatory hippocampal synapses. Proceedings of the National Academy of Sciences. 2000;97:901–906. doi: 10.1073/pnas.97.2.901. [DOI] [PMC free article] [PubMed] [Google Scholar]
- 47.Xie X, Liaw JS, Baudry M, Berger TW. Novel expression mechanism for synaptic potentiation: alignment of presynaptic release site and postsynaptic receptor. Proceedings of the National Academy of Sciences. 1997;94:6983–6988. doi: 10.1073/pnas.94.13.6983. [DOI] [PMC free article] [PubMed] [Google Scholar]
- 48.Kavalali ET, et al. Spontaneous neurotransmission: an independent pathway for neuronal signaling? Physiology. 2011;26:45–53. doi: 10.1152/physiol.00040.2010. [DOI] [PubMed] [Google Scholar]
- 49.Ermolyuk Y, et al. Differential triggering of spontaneous glutamate release by P/Q-, N-and R-type Ca2+ channels. Nature Neuroscience. 2013 doi: 10.1038/nn.3563. [DOI] [PMC free article] [PubMed] [Google Scholar]
- 50.Frank T, et al. Bassoon and the synaptic ribbon organize Ca 2+ channels and vesicles to add release sites and promote refilling. Neuron. 2010;68:724–738. doi: 10.1016/j.neuron.2010.10.027. [DOI] [PMC free article] [PubMed] [Google Scholar]
Associated Data
This section collects any data citations, data availability statements, or supplementary materials included in this article.


