Abstract
While numerous RNA-seq data analysis pipelines are available, research has shown that the choice of pipeline influences the results of differentially expressed gene detection and gene expression estimation. Gene expression estimation is a key step in RNA-seq data analysis, since the accuracy of gene expression estimates profoundly affects the subsequent analysis. Generally, gene expression estimation involves sequence alignment and quantification, and accurate gene expression estimation requires accurate alignment. However, the impact of aligners on gene expression estimation remains unclear. We address this need by constructing nine pipelines consisting of nine spliced aligners and one quantifier. We then use simulated data to investigate the impact of aligners on gene expression estimation. To evaluate alignment, we introduce three alignment performance metrics, (1) the percentage of reads aligned, (2) the percentage of reads aligned with zero mismatch (ZeroMismatchPercentage), and (3) the percentage of reads aligned with at most one mismatch (ZeroOneMismatchPercentage). We then evaluate the impact of alignment performance on gene expression estimation using three metrics, (1) gene detection accuracy, (2) the number of genes falsely quantified (FalseExpNum), and (3) the number of genes with falsely estimated fold changes (FalseFcNum). We found that among various pipelines, FalseExpNum and FalseFcNum are correlated. Moreover, FalseExpNum is linearly correlated with the percentage of reads aligned and ZeroMismatchPercentage, and FalseFcNum is linearly correlated with ZeroMismatchPercentage. Because of this correlation, the percentage of reads aligned and ZeroMismatchPercentage may be used to assess the performance of gene expression estimation for all RNA-seq datasets.
1. INTRODUCTION
RNA sequencing (i.e., RNA-seq) refers to the technologies and applications for high-throughput sequencing of RNA [1]. With the development of next-generation sequencing technology, RNA-seq has evolved to be a promising technology that plays an important role in several applications such as differential expression analysis, single nucleotide variation discovery, fusion gene detection, and co-expression network construction [2–6].
Typically, an RNA-seq data analysis pipeline includes (1) sequence read alignment, (2) expression quantification, (3) expression normalization, and (4) differentially expressed gene (DEG) detection. For each step of the pipeline, many algorithms or tools have been developed. Being aware of a large amount of combinations of RNA-seq data analysis pipelines, researchers have conducted comparative and quality control studies [7–14] for quantifying the performance of tools or algorithms and ensuring the accuracy and reproducibility of RNA-seq. Conclusions from most studies support that the choice of pipelines affects the analysis results. For example, Grant et al. [13] evaluated various alignment algorithms and observed the discrepancy of alignment performance. Fonseca et al. [8] combined various alignment algorithms and three quantification tools to analyze the variance of detected and true gene expression levels, and proved that different analysis pipelines affected the gene expression levels. Soneson et al. [9] compared methods for differential expression analysis and found that shared differentially expressed genes detected by different methods varied significantly. Most of these studies focus on the comparison of algorithms or tools belonging to each step, which cannot illustrate how the impact propagates through the steps of RNA-seq analysis pipelines. Although Fonseca et al. [8] combined aligners and quantifiers to investigate the variance of detected and true gene expression, they mainly compared the performance of the pipelines, and did not explain how alignment pipelines affected the gene expression estimates. The SEQC/MAQC-III consortium conducted a large-scale, multisite, cross-platform RNA-seq study that aimed to build standards for RNA-seq research from sample preparation to downstream analytics. They found that RNA-seq measurement performance depended on platforms and data analysis pipelines [7]. However, the choice of which pipeline researchers should apply still remains unclear. To solve this problem, the intuition is to conduct a pipeline-level comparative study for RNA-seq data analysis. However, the huge amount of pipelines impedes a comprehensive evaluation. Even though a comprehensive comparative study could be realized for some datasets, we cannot be assured of finding a pipeline that always outperforms other pipelines for all datasets. To ensure the accuracy and reproducibility of RNA-seq data analysis results, we need to investigate the cause of the performance variance among RNA-seq data analysis pipelines. Indeed, if we can identify the impact of error propagation of the RNA-seq data analysis pipelines, we might be able to design the pipeline or redesign the tool or algorithms of each step to achieve better performance.
Gene expression quantification is a key step in the RNA-seq data analysis pipeline, and the accuracy of expression quantification can profoundly affect the subsequent analysis. However, accurate gene expression quantification requires accurate sequence read alignment. As previously mentioned, Fonseca et al. [8] evaluated the effect of different analysis pipelines on gene expression estimation and assessed the difference between true and estimated expression, but they mainly focused on the comparison of the pipelines and cannot reveal why and how the choice of aligners and quantifiers influences the gene expression level. We investigate the impact of aligners on gene expression estimation and try to find indicators which can correlate the performance of aligners and gene expression estimation.
2. METHODS
The workflow of our study is shown in Figure 1. To investigate the impact of RNA-seq aligners on gene expression estimation, we vary aligners which are specifically designed for genome alignment. For quantification tool, we use a fixed tool: HTSeq [15].
Figure 1.
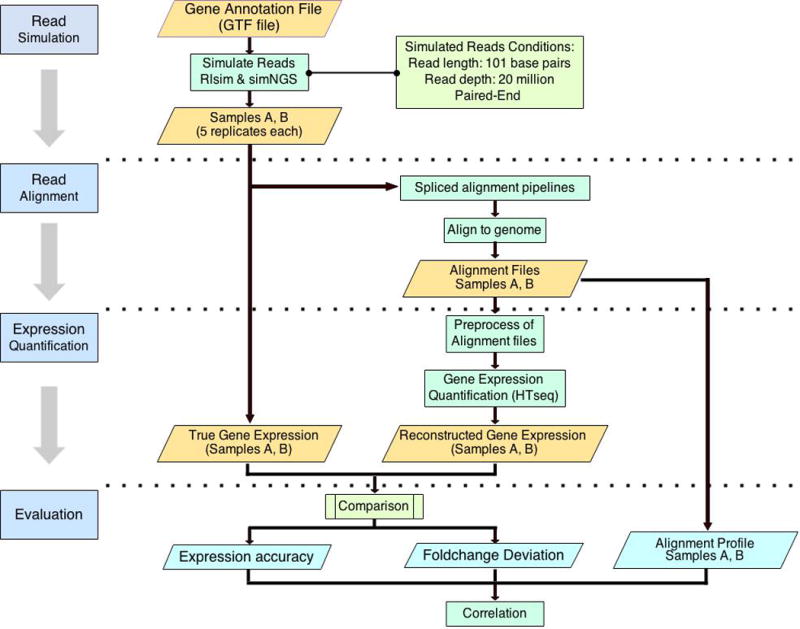
The workflow of experimental design and data analysis
2.1 Simulation of RNA-seq Dataset
Real RNA-seq datasets do not contain ground-truth information. To facilitate the investigation of the impact of RNA-seq aligners on gene expression estimation, we need to know the true expression level of every gene. Therefore, we use a simulated RNA-seq dataset for this study. We employ rlsim [16] with simNGS [17] to generate RNA-seq data. rlsim integrates a collection of tools to simulate RNA-seq library construction [16] and can generate the simulated RNA fragments. simNGS can simulate observed reads from Illumina sequencing machines and incorporate noise due to sequencing. We apply rlsim to generate RNA fragments and simNGS to simulate RNA-seq reads.
For constructing the RNA library, we use the default setting of rlsim to generate 20 million RNA fragments based on the RefSeq gene annotation and the UCSC hg19 reference genome. First, we employ the “sel” tool from rlsim package to sample the expression level of each transcript from a mixture of gamma distributions including Gamma(5000, 0.1) and Gamma(10000, 100). Second, we adopt rlsim to generate RNA fragments from the previous FASTA file. With RNA fragments, we then employ simNGS to simulate paired-end reads: we use “s_6_4x.runfile”, which is shipped with the simNGS package, to simulate 101bp paired-end reads from each fragment. Besides the absolute expression of each gene, we are also interested in the relative gene expression levels. Thus, we simulate two samples—Samples A and B—each of which has five replicates, and each replicate has 20 million paired-end reads. For gene expression fold changes, we follow the simulation strategy proposed by Zheng et al. [18]. Using the same simulated expression levels generated by “sel”, we artificially introduce some differentially expressed genes with predefined fold changes. Sample A was simulated by using the original expression profile. For Sample B, we randomly choose ~10% genes to be overexpressed, ~10% genes underexpressed, and the rest ~80% genes remain unchanged. Among all overexpressed and underexpressed genes, we randomly and equally assign a predefined fold change to each gene. Table 1 summarizes the preset gene expression fold change. With these settings, we obtain two samples with built-in truths about absolute gene expression and relative expression fold changes.
Table 1.
Simulation strategy
| Gene Types | Gene expression levels | Number of genes (25,678)a | Gene expression fold change A vs. B | |
|---|---|---|---|---|
| Sample A | Sample B | |||
| I | Normal | Over expressed | 576 | 1:2 |
| 568 | 1:3 | |||
| 579 | 1:4 | |||
| 557 | 1:5 | |||
| II | Normal | Under expressed | 576 | 2:1 |
| 589 | 3:1 | |||
| 598 | 4:1 | |||
| 519 | 5:1 | |||
| III | Normal | Normal | 21116 | 1:1 |
Total number of genes
2.2 Sequence Alignment
To analyze the impact of alignment on gene expression estimation, we use various alignment tools and a fixed quantification tool to control variables. Until now, researchers have developed many RNA-seq alignment tools or pipelines, which can be categorized as transcriptome aligners and genome aligners. Transcriptome aligners can reduce the alignment complexity by aligning sequence reads to known transcripts, while genome aligners directly align the reads to the genome and must address the reads derived from splice junctions [19]. However, transcriptome aligners are usually combined with isoform expression quantification, which need to be translated to gene expression levels if we are interested in the latter. Therefore, we select nine recently released spliced aligners, including Tophat2 [20], STAR [21], MapSplice [22], GSNAP_spliced [23], PASSION [24], OLego [25], Subread [26], SOAPSplice [27], and GEM [28]. We use UCSC hg19 as the reference genome. If the alignment tool supports multiple-hit mapping strategy, such as Tophat2, GSNAP_spliced, OLEGO, STAR, and Subread, we allow up to twenty hits for each read. For other options, we follow default settings.
2.3 Expression Quantification
For gene expression quantification, we use HTSeq (the intersection-nonempty mode) with RefSeq as the genome annotation. HTSeq is a count-based quantification tool, enabling us to compare the estimated gene expression to the built-in truth. Because counting multiple-hit reads (reads that have multiple mapping locations) might cause false positive differentially expressed genes [15], the default setting of HTSeq tends to discard all of these multiple-hit reads. However, discarding the multiple-hit reads may also incur false negative errors in terms of gene detection. For example, if one and only one mapping of a multiple-hit read is correct and we discard it, then the expression of the associated gene will be underestimated. In this study, we choose to keep all multiple-hit reads by removing the tag that HTSeq uses to identify the multiple-hit reads.
2.4 Performance Evaluation
2.4.1 Alignment Profile Construction
Here we propose to use the percentage of reads aligned (ReadsAlignedPercentage), the percentage of reads aligned with zero mismatch (ZeroMismatchPercentage) and at most one mismatch (ZeroOneMismatchPercentage) as the metrics for assessing alignment quality. We hypothesize that the percentage of reads aligned can quantify the mapping capability of an alignment pipeline, and reads aligned with less than one mismatch are more reliable for downstream expression estimates.
2.4.2 Gene Expression Evaluation
After quantifying the gene expression, we get the gene count number for each gene. Since we already know the true expression for each gene, we can compare the estimated gene expression to the built-in truth. However, not all reads can be aligned through alignment, and not all reads will be assigned to a specific gene (e.g., assigned to no-feature and ambiguous) during quantification, which indicates a portion of reads will be discarded and cannot account for the gene expression. If we directly compare estimated expression to true expression, discrepancy between them is definitely expected. To compensate for this discrepancy, we propose to use the following two metrics to measure expression accuracy: (1) the detection ability of genes (Table 2) measured by Accuracy = (TP + TN)/(TP + TN + FP + FN) and (2) the number of genes falsely quantified (Notation: FalseExpNum) measured by (Equation 1), which normalizes the difference between gene counts by median gene expression in the ground truth and estimated expression respectively.
| (Equation 1) |
where Ti and Ri represent the true and estimated expression level of the i-th gene after normalization, respectively; I is the indicator function (I = 1 if the formula in parentheses is true; I = 0 otherwise; we consider 0/0 = 1); Threshold is between 0.2 and 1; and n is the total number of genes. To determine a falsely quantified gene, we incoporate the threshold, which quantifies the deviations compared with true expression level. Generally, a larger threshold indicates more tolerance to the deviations.
Table 2.
Definition of gene detection accuracy
| True expression | |||
|---|---|---|---|
| Total Gene # | Expressed | Not Expressed | |
| Reconstructed expression | Expressed | TP | FP |
| Not Expressed | FN | TN | |
2.4.3 Fold-change Variance Evaluation
Besides the absolute expression accuracy, we also evaluate the relative expression accuracy (fold changes). We compute gene expression fold changes between Samples A and B using estimated gene expression. We then compare the estimated fold changes to the ground truth. We count the number of genes with falsely estimated fold changes (Notation: FalseFcNum) given by Equation 2.
| (Equation 2) |
where TFCi and EFCi means the true and estimated fold change of the i-th gene, respectively; I is the indicator function (I = 1 if the formula in parentheses is true; I = 0 otherwise; we consider 0/0 = 1); Threshold is between 0.2 and 1; and n is the total number of genes. Also, threshold is used to quantify the deviations of true fold change.
2.4.4 Correlation
Once we acquire the alignment profile (i.e., ReadsAlignedPercentage, ZeroMismatchPercentage, and ZeroOneMismatchPercentage) and the aforementioned evaluation metrics (i.e., the gene detection accuracy, FalseExpNum, and FalseFcNum) we apply linear regression analysis to model their relationship. Since the only difference among the gene expression estimation pipelines we use is the aligner, if any discrepancy exists in the gene expression, the only source would be aligner. Thus, the logic would be treating alignment profile as the explanatory variable, and the evaluation of gene expression as dependent variable. For real data, we do not know the built-in truth, and we can only compute the metrics for alignment profiles. If we can observe some correlation between alignment profile and expression evaluation, we might be able to predict the expression performance based on the alignment profile. Therefore, we fit linear regression between alignment profile and the evaluation metrics under various threshold values (to verify if the alignment profiles correlate with expression evaluation), and we compute adjusted R2 value for each one.
RESULTS AND DISCUSSION
3.1 Alignment Profile
At the first sight, we might total the ratio of correctly aligned reads as the metric of alignment pipeline’s performance, since we know the true mapping location of each read. However, for real data, we are not aware of the true alignment of every read, which negates the feasibility to employ the alignment accuracy as the metric. Thus, we introduce alternative metrics. The first metric in the alignment profile is the percentage of reads aligned. For every aligner, we observed that the percentage of reads aligned (ReadsAlignedPercentage) were almost of the same value in both Samples A and B, therefore we plotted them in one figure (Figure 2). The small error bars indicate consistent performance among both Samples A and B. Except GEM, the ReadsAlignedPercentage of most aligners were over 90%.
Figure 2.
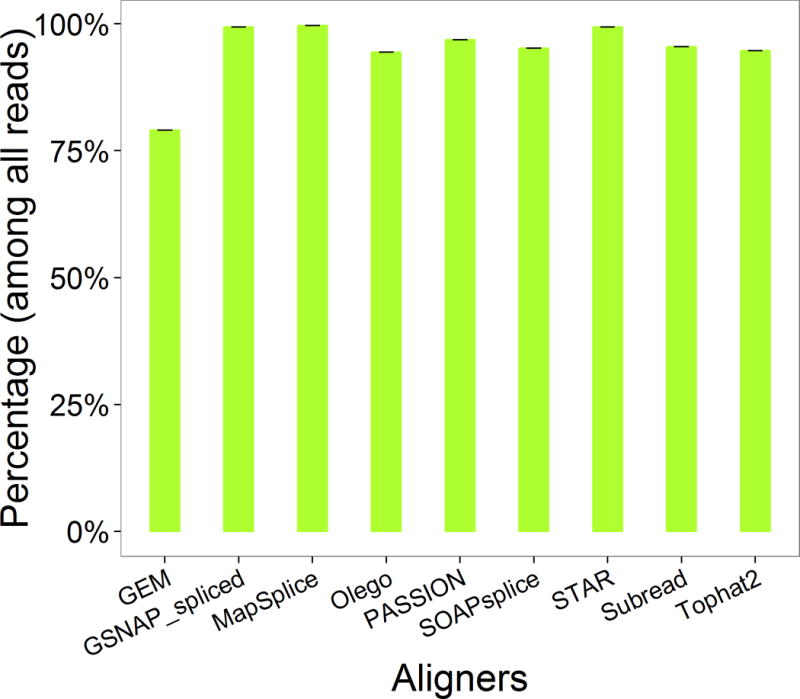
The percentage of reads aligned
Then, with the alignment results, we computed the percentage of reads aligned with zero or one mismatch. For each aligner, we found that both ZeroMismatchPercentage and ZeroOneMismatchPercentage were almost the same in Samples A and B. As we can see from Figure 3 (each column includes all the replicates of Samples A and B), the reads aligned with zero and one mismatch can account for the majority of the aligned reads (over 80%). In addition, we used ANOVA to analyze the difference among the metrics of all the aligners (we apply ANOVA to any two aligners’ metrics). And we observed that ReadsAlignedMismatch, ZeroMismatchPercentage and ZeroOneMismatchPercentage are all significantly different among different aligners since all the p-values are less than 0.001. We also ranked the aligners according to the above three metrics separately (Table 3).
Figure 3.
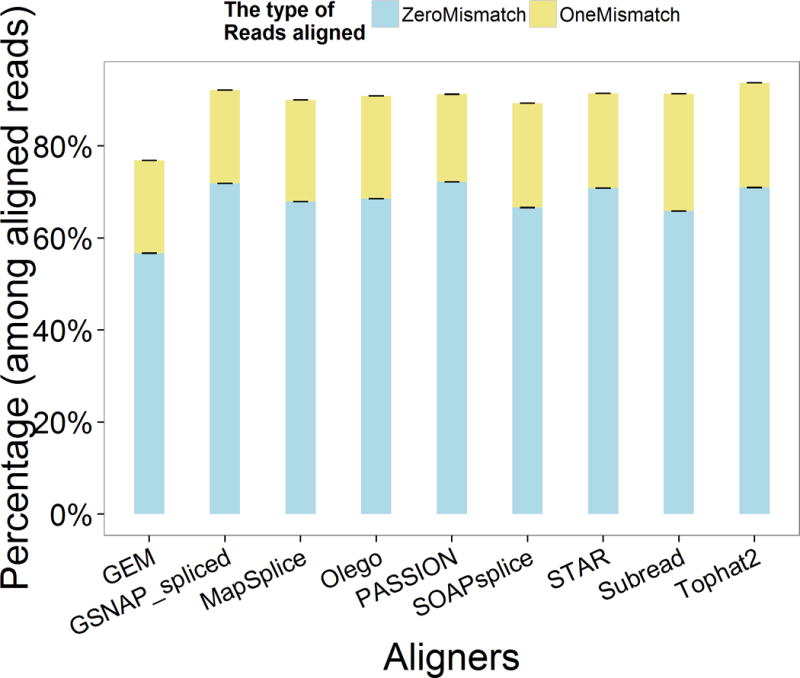
The percentage of reads aligned with 0 or 1 mismatch
Table 3.
The rank of alignment profiles
| Aligner | ReadsAlignedPercentage | ZeroMismatchPercentage | OneMismatchPercentage |
|---|---|---|---|
| GEM | 9 | 9 | 9 |
| GSNAP_spliced | 3 | 2 | 2 |
| MapSplice | 1 | 6 | 7 |
| Olego | 8 | 5 | 6 |
| PASSION | 4 | 1 | 5 |
| SOAPsplice | 6 | 7 | 8 |
| STAR | 2 | 4 | 3 |
| Subread | 5 | 8 | 4 |
| Tophat2 | 7 | 3 | 1 |
3.2 Expression and Fold-change Evaluation
Figure 4 displays the gene detection accuracy of each pipeline. For most pipelines, gene detection accuracy is at the same level (up to 90%), and show little difference, indicating that the gene detection accuracy might not be an appropriate metric for the evaluation of gene expression.
Figure 4.
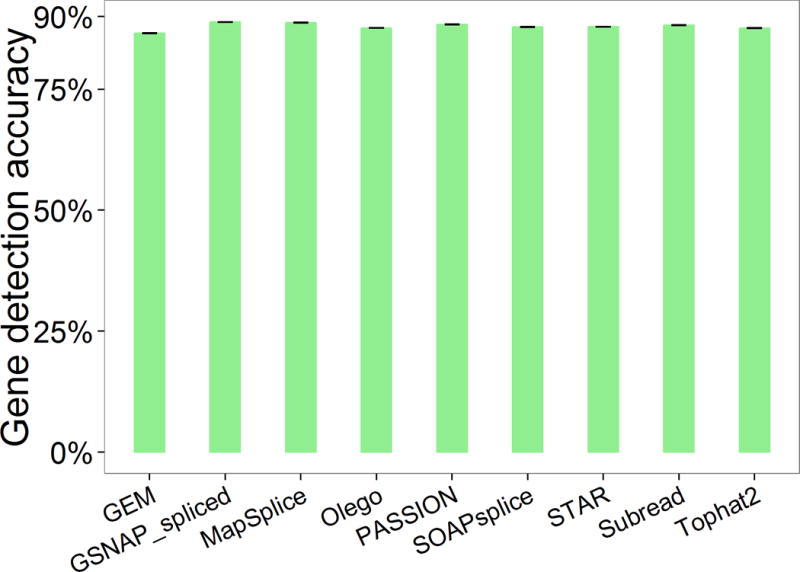
The accuracy of gene detection
For the number of genes falsely quantified (FalseExpNum), we observed significant discrepancy among pipelines (Figure 5). With the threshold increases, FalseExpNum decreases. This is reasonable because a larger threshold means higher tolerance to false quantified genes, which results in less number of genes falsely quantified. From Figure 6, we can observe that the number of genes with falsely estimated fold changes (FalseFcNum) also varies among pipelines and shows a similar trend with increase of threshold.
Figure 5.
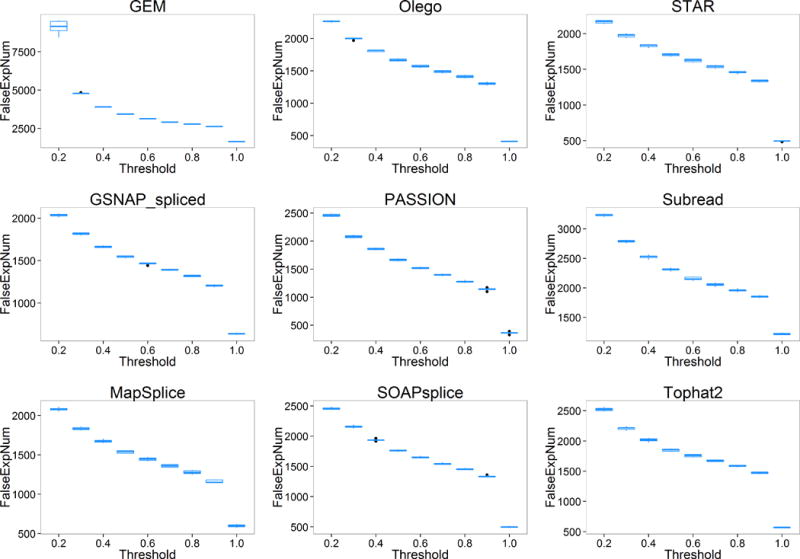
The number of genes falsely quantified
Figure 6.
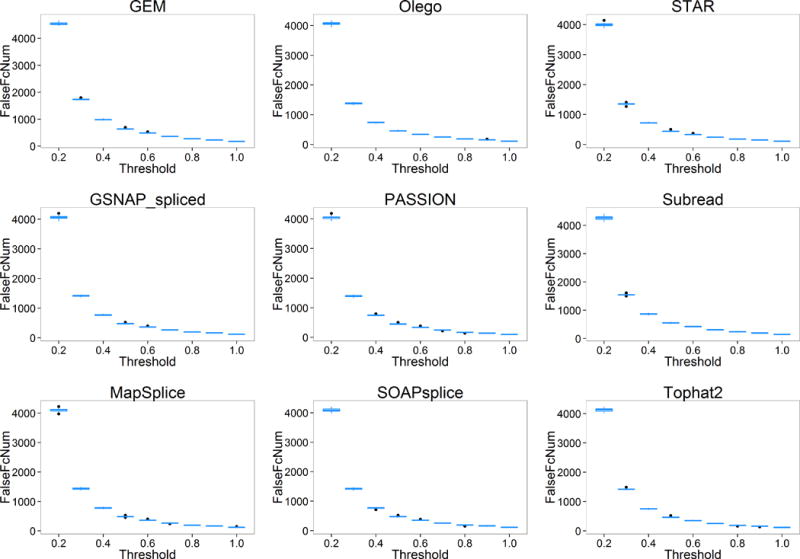
The number of genes with falsely estimated fold-change
Logically, only the genes falsely quantified might have false estimated fold change. To investigate the consistency between the two metrics (FalseExpNum and FalseFcNum), we computed the Pearson correlation coefficient (Table 4). As we can see in Table 4, FalseExpNum and FalseFcNum show significant linear correlation with each other, suggesting that both FalseExpNum and FalseFcNum can be equally employed as the metric of gene expression estimates. However, comparing FalseExpNum and FalseFcNum, we observed that FalseExpNum was generally larger than FalseFcNum, indicating that even though some genes have been falsely quantified, the fold changes of these genes will not be affected.
Table 4.
Correlation efficient of FalseExpNum and FalseFcNum
| Variance threshold | r2 | P value |
|---|---|---|
| 0.2 | 0.8879 | 0.0001 |
| 0.3 | 0.9173 | 0.0000 |
| 0.4 | 0.8945 | 0.0001 |
| 0.5 | 0.8949 | 0.0001 |
| 0.6 | 0.8864 | 0.0002 |
| 0.7 | 0.8938 | 0.0001 |
| 0.8 | 0.8906 | 0.0001 |
| 0.9 | 0.8956 | 0.0001 |
| 1 | 0.9613 | 0.0000 |
3.3 Correlation
Obtaining the alignment profile (ReadsAlignedPercentage, ZeroMismatchPercentage and ZeroOneMismatchPercentage) and the expression evaluation (FalseExpNum and FalseFcNum), we applied linear regression to fit their relationship. Since three metrics of alignment profile were available, we fitted the model (1) with only ReadsAlignedPercentage, (2) with ZeroMismatchPercentage, (3) with ZeroOneMismatchPercentage, (4) with both ReadsAlignedPercentage and ZeroMismatchPercentage, and (5) with both ReadsAlignedPercentage and ZeroOneMismatchPercentage. From Table 5, for FalseExpNum, we can see among all the linear regressions, when fitting with both ReadsAlignedPercentage and ZeroMismatchPercentage, the adjusted R2 is generally larger than others. In contrast, for FalseFcNum (Table 6), we found that when fitting with ZeroMismatchPercentage, the adjusted R2 is larger.
Table 5.
Linear regression of FalseExpNum
| FalseExpNum | ~ReadsAligned Percentage |
~ZeroMismatch Percentage |
~OneMismatch Percentage |
~ReadsAligned Percentage + ZeroMismatch Percentage |
~ReadsAligned Percentage + ZeroOneMisma tchPercentage |
|||||
|---|---|---|---|---|---|---|---|---|---|---|
| Threshold | R2(adj) | p-value | R2(adj) | p-value | R2(adj) | p-value | R2(adj) | p-value | R2 (adj) | p-value |
| 0.2 | 0.9140 | 0.0000 | 0.7978 | 0.0007 | 0.8922 | 0.0001 | 0.9187 | 0.0001 | 0.9502 | 0.0000 |
| 0.3 | 0.9010 | 0.0001 | 0.8172 | 0.0005 | 0.8086 | 0.0006 | 0.9148 | 0.0001 | 0.9024 | 0.0001 |
| 0.4 | 0.8762 | 0.0001 | 0.8075 | 0.0006 | 0.7612 | 0.0013 | 0.8909 | 0.0002 | 0.8656 | 0.0003 |
| 0.5 | 0.8597 | 0.0002 | 0.8043 | 0.0006 | 0.7386 | 0.0018 | 0.8767 | 0.0003 | 0.8441 | 0.0005 |
| 0.6 | 0.8492 | 0.0003 | 0.8004 | 0.0007 | 0.7172 | 0.0024 | 0.8670 | 0.0004 | 0.8292 | 0.0007 |
| 0.7 | 0.8327 | 0.0004 | 0.7927 | 0.0008 | 0.6906 | 0.0034 | 0.8510 | 0.0005 | 0.8077 | 0.0010 |
| 0.8 | 0.8200 | 0.0005 | 0.7909 | 0.0008 | 0.6736 | 0.0041 | 0.8412 | 0.0006 | 0.7920 | 0.0013 |
| 0.9 | 0.8101 | 0.0006 | 0.7894 | 0.0008 | 0.6572 | 0.0049 | 0.8336 | 0.0007 | 0.7796 | 0.0015 |
| 1 | 0.5562 | 0.0128 | 0.7169 | 0.0025 | 0.5394 | 0.0147 | 0.6709 | 0.0084 | 0.5144 | 0.0192 |
Table 6.
Linear regression of FalseFcNum
| FalseFcNum | ~ReadsAligned Percentage |
~ZeroMismatch Percentage |
~OneMismatch Percentage |
~ReadsAligned Percentage + ZeroMismatch Percentage |
~ReadsAligned Percentage + ZeroOneMisma tchPercentage |
|||||
|---|---|---|---|---|---|---|---|---|---|---|
| Threshold | R2(adj) | p-value | R2(adj) | p-value | R2(adj) | p-value | R2(adj) | p-value | R2(adj) | p-value |
| 0.2 | 0.7897 | 0.0008 | 0.8361 | 0.0003 | 0.6997 | 0.0030 | 0.8520 | 0.0006 | 0.7682 | 0.0018 |
| 0.3 | 0.7378 | 0.0019 | 0.8365 | 0.0003 | 0.7172 | 0.0024 | 0.8300 | 0.0009 | 0.7349 | 0.0029 |
| 0.4 | 0.6859 | 0.0036 | 0.8338 | 0.0004 | 0.7086 | 0.0027 | 0.8128 | 0.0014 | 0.6980 | 0.0047 |
| 0.5 | 0.6756 | 0.0040 | 0.8389 | 0.0003 | 0.6945 | 0.0032 | 0.8160 | 0.0014 | 0.6827 | 0.0054 |
| 0.6 | 0.6664 | 0.0045 | 0.8281 | 0.0004 | 0.6933 | 0.0033 | 0.8034 | 0.0017 | 0.6770 | 0.0058 |
| 0.7 | 0.6708 | 0.0042 | 0.8383 | 0.0003 | 0.6872 | 0.0035 | 0.8147 | 0.0015 | 0.6752 | 0.0058 |
| 0.8 | 0.6524 | 0.0052 | 0.8489 | 0.0003 | 0.6643 | 0.0046 | 0.8243 | 0.0013 | 0.6496 | 0.0072 |
| 0.9 | 0.6600 | 0.0048 | 0.8501 | 0.0003 | 0.6772 | 0.0040 | 0.8261 | 0.0013 | 0.6625 | 0.0065 |
| 1 | 0.6628 | 0.0046 | 0.8535 | 0.0002 | 0.6718 | 0.0042 | 0.8301 | 0.0012 | 0.6605 | 0.0065 |
Overall, combined with Tables 5 and 6, Figures 7 and 8 show the key findings of our study. FalseExpNum shows linear correlation with ReadsAlignedPercentage and ZeroMismatchPercentage, and FalseFcNum shows linear correlation with ZeroMismatchPercentage. Since FalseExpNum and FalseFcNum are the metrics of gene expression estimation, and ReadsAlignedPercentage and ZeroMismatchPercentage are metrics of alignment, the linear correlation implies that with the increase of ReadsAlignedPercentage and ZeroMismatchPercentage, the performance of gene expression estimation will improve. We believe our foremost hypothesis might help to explain this phenomenon: reads aligned with zero mismatch have higher probability to be correctly mapped, and ReadsAlignedPercentage quantifies the portion of reads that have been mapped. Combining ReadsAlignedPercentage and ZeroMismatchPercentage, we might assess the performance of alignment, while the better the performance of alignment, the better gene expression estimates. Our finding also suggests applying aligners which can produce higher ReadsAlignedPercentage and ZeroMismatchPercentage when conducting gene expression estimates-related analysis, such as DEG detection.
Figure 7.
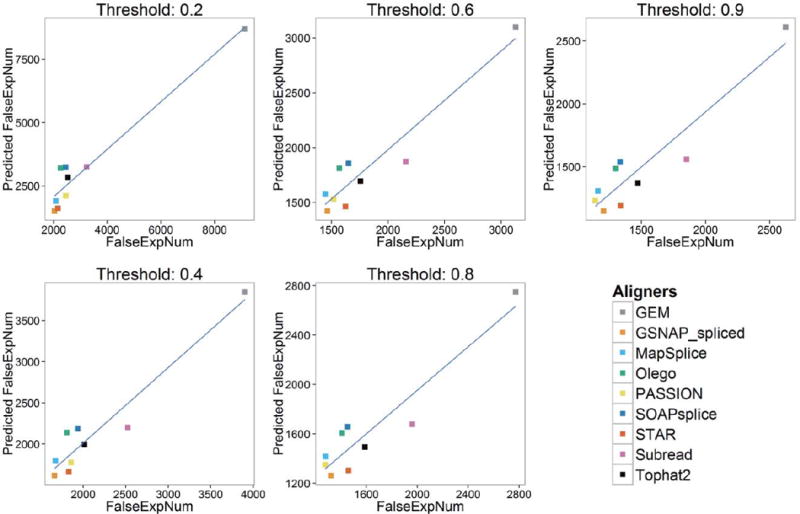
Correlation between predicted FalseExpNum (with ReadsAlignedPercentage and ZeroMismatchPercentage) and true FalseExpNum
Figure 8.
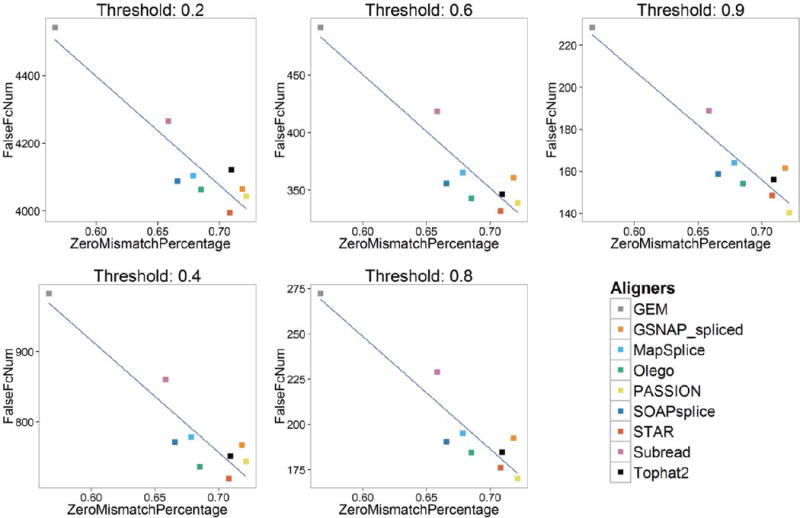
Correlation between FalseFcNum and ZeroMismatchPercentage
CONCLUSIONS
We analyzed the impact of RNA-seq aligners on gene expression estimation by constructing RNA-seq data analysis pipelines with nine different aligners and one quantification tool, HTSeq. Using simulated RNA-seq data, we have the true gene expression and true gene fold change between samples.
We profiled the alignment performance with (1) the percentage of reads aligned (ReadsAlignedPercentage), (2) the percentage of reads aligned with zero mismatch (ZeroMismatchPercentage), and the percentage of reads aligned with at most one mismatch (ZeroOneMismatchPercentage). We observed that for most aligners, the ReadsAlignedPercentage can be over 90%, and the reads aligned with zero or one mismatch can account for over 80% of aligned reads.
We evaluated the gene expression estimation with three metrics: (1) the accuracy of gene detection, (2) the number of genes falsely quantified (FalseExpNum), and (3) the number of genes with falsely estimated fold change (FalseFcNum). We found that for most pipelines, the accuracy of gene detection shows few discrepancies suggesting gene detection accuracy might not be a suitable metric for gene expression estimation. In contrast, for FalseExpNum and FalseFcNum, the discrepancy among pipelines is more significant. In addition, we observed linear correlation between FalseExpNum and FalseFcNum, suggesting both FalseExpNum and FalseFcNum might be equally applied as the metric of gene expression estimation. However, FalseExpNum is generally larger than FalseFcNum, implying that the fold change of some genes will not be affected even though they are falsely quantified.
We applied linear regression to model the relationship between the alignment profile (ReadsAlignedPercentage, ZeroMismatchPercentage and ZeroOneMismatchPercentage) and the evaluation of gene expression (FalseExpNum and FalseFcNum). We observed that FalseExpNum shows linear correlation with ReadsAlignedPercentage and ZeroMismatchPercentage, and FalseFcNum shows linear correlation with ZeroMismatchPercentage. An explanation might be: (1) the reads aligned with zero mismatch are more likely to be correctly mapped, which contributes more to accurate quantification; (2) the percentage of reads aligned represents the amount of reads that might be correctly mapped. Therefore, ZeroMismatchPercentage and ReadsAlignedPercentage might be combined as predictors of the performance of gene expression estimates. We plan to verify this by applying our method to real data in a future study. Since ZeroMismatchPercentage and ReadsAlignedPercentage can be calculated without knowing the true alignment, indicating we can calculate these two metrics for real data. Once got the above two alignment metrics, we might assess the performance of gene expression estimation.
Overall, based on the results of our experiment, when conducting gene expression estimation, we suggest applying aligners that produce higher ReadsAlignedPercentage and ZeroMismatchPercentage. Using this criterion, STAR, PASSION and GSNAP_spliced aligners outperform other aligners when applied to our simulated dataset (Table 3).
Acknowledgments
This work was supported in part by grants from the National Institutes of Health (NHLBI 5U01HL080711, U54CA119338, 1RC2CA148265), the Georgia Cancer Coalition (Distinguished Cancer Scholar Award to Professor May D. Wang), the Children’s Healthcare of Atlanta, Microsoft Research, the Hewlett-Packard Company, and China Scholarship Council (201306010292).
The authors also would like to thank Dr. Chanchala Kaddi for her valuable assistance.
Contributor Information
Cheng Yang, Email: ycheng@gatech.edu, Department of Biomedical Engineering, Georgia Institute of Technology, Emory University, and Peking University, Atlanta, GA 30332, USA.
Po-Yen Wu, Email: pwu33@gatech.edu, School of Electrical and Computer Engineering, Georgia Institute of Technology, Atlanta, GA, 30332, USA.
Li Tong, Email: ltong9@gatech.edu, Department of Biomedical Engineering, Georgia Institute of Technology and Emory University, Atlanta, GA 30332, USA.
John H. Phan, Email: jhphan@gatech.edu, Department of Biomedical Engineering, Georgia Institute of Technology and Emory University, Atlanta, GA 30332, USA.
May D. Wang, Email: maywang@bme.gatech.edu, Department of Biomedical Engineering, Georgia Institute of Technology and Emory University, Atlanta, GA 30332, USA.
References
- 1.Wang Z, Gerstein M, Snyder M. RNA-Seq: a revolutionary tool for transcriptomics. Nature Reviews Genetics. 2009;10:57–63. doi: 10.1038/nrg2484. [DOI] [PMC free article] [PubMed] [Google Scholar]
- 2.Trapnell C, Roberts A, Goff L, Pertea G, Kim D, Kelley DR, et al. Differential gene and transcript expression analysis of RNA-seq experiments with TopHat and Cufflinks. Nature protocols. 2012;7:562–578. doi: 10.1038/nprot.2012.016. [DOI] [PMC free article] [PubMed] [Google Scholar]
- 3.Marioni JC, Mason CE, Mane SM, Stephens M, Gilad Y. RNA-seq: an assessment of technical reproducibility and comparison with gene expression arrays. Genome research. 2008;18:1509–1517. doi: 10.1101/gr.079558.108. [DOI] [PMC free article] [PubMed] [Google Scholar]
- 4.Peng Z, Cheng Y, Tan BC-M, Kang L, Tian Z, Zhu Y, et al. Comprehensive analysis of RNA-Seq data reveals extensive RNA editing in a human transcriptome. Nature biotechnology. 2012;30:253–260. doi: 10.1038/nbt.2122. [DOI] [PubMed] [Google Scholar]
- 5.Oshlack A, Robinson MD, Young MD. From RNA-seq reads to differential expression results. Genome biol. 2010;11:220. doi: 10.1186/gb-2010-11-12-220. [DOI] [PMC free article] [PubMed] [Google Scholar]
- 6.Iancu OD, Kawane S, Bottomly D, Searles R, Hitzemann R, McWeeney S. Utilizing RNA-Seq data for de novo coexpression network inference. Bioinformatics. 2012;28:1592–1597. doi: 10.1093/bioinformatics/bts245. [DOI] [PMC free article] [PubMed] [Google Scholar]
- 7.S. M.-I. Consortium. A comprehensive assessment of RNA-seq accuracy, reproducibility and information content by the Sequencing Quality Control Consortium. Nat Biotech. 2014 doi: 10.1038/nbt.2957. advance online publication, 08/24/online. [DOI] [PMC free article] [PubMed] [Google Scholar]
- 8.Fonseca NA, Marioni J, Brazma A. RNA-seq gene profiling-a systematic empirical comparison. PloS one. 2014;9:e107026. doi: 10.1371/journal.pone.0107026. [DOI] [PMC free article] [PubMed] [Google Scholar]
- 9.Soneson C, Delorenzi M. A comparison of methods for differential expression analysis of RNA-seq data. BMC bioinformatics. 2013;14:91. doi: 10.1186/1471-2105-14-91. [DOI] [PMC free article] [PubMed] [Google Scholar]
- 10.Li H, Homer N. A survey of sequence alignment algorithms for next-generation sequencing. Briefings in bioinformatics. 2010;11:473–483. doi: 10.1093/bib/bbq015. [DOI] [PMC free article] [PubMed] [Google Scholar]
- 11.Chandramohan R, Wu P-Y, Phan JH, Wang MD. Systematic Assessment of RNA-Seq Quantification Tools Using Simulated Sequence Data,” in Proceedings of the International Conference on Bioinformatics. Computational Biology and Biomedical Informatics. 2013:623. doi: 10.1145/2506583.2506648. [DOI] [PMC free article] [PubMed] [Google Scholar]
- 12.Robles JA, Qureshi SE, Stephen SJ, Wilson SR, Burden CJ, Taylor JM. Efficient experimental design and analysis strategies for the detection of differential expression using RNA-Sequencing. BMC genomics. 2012;13:484. doi: 10.1186/1471-2164-13-484. [DOI] [PMC free article] [PubMed] [Google Scholar]
- 13.Grant GR, Farkas MH, Pizarro AD, Lahens NF, Schug J, Brunk BP, et al. Comparative analysis of RNA-Seq alignment algorithms and the RNA-Seq unified mapper (RUM) Bioinformatics. 2011 Sep 15;27:2518–28. doi: 10.1093/bioinformatics/btr427. [DOI] [PMC free article] [PubMed] [Google Scholar]
- 14.Engström PG, Steijger T, Sipos B, Grant GR, Kahles A, Rätsch G, et al. Systematic evaluation of spliced alignment programs for RNA-seq data. Nature methods. 2013;10:1185–1191. doi: 10.1038/nmeth.2722. [DOI] [PMC free article] [PubMed] [Google Scholar]
- 15.Anders S, Pyl PT, Huber W. HTSeq–A Python framework to work with high-throughput sequencing data. Bioinformatics. 2014:btu638. doi: 10.1093/bioinformatics/btu638. [DOI] [PMC free article] [PubMed] [Google Scholar]
- 16.Sipos B, Slodkowicz G, Massingham T, Goldman N. Realistic simulations reveal extensive sample-specificity of RNA-seq biases. arXiv preprint arXiv:1308.3172. 2013 [Google Scholar]
- 17.Massingham T. simNGS – software for simulating next-generation sequencing data. 2012 http://www.ebi.ac.uk/goldman-srv/simNGS/
- 18.Zheng X, Moriyama EN. Comparative studies of differential gene calling using RNA-Seq data. BMC bioinformatics. 2013;14:S7. doi: 10.1186/1471-2105-14-S13-S7. [DOI] [PMC free article] [PubMed] [Google Scholar]
- 19.Munger SC, Raghupathy N, Choi K, Simons AK, Gatti DM, Hinerfeld DA, et al. Rna-seq alignment to individualized genomes improves transcript abundance estimates in multiparent populations. Genetics. 2014;198:59–73. doi: 10.1534/genetics.114.165886. [DOI] [PMC free article] [PubMed] [Google Scholar]
- 20.Kim D, Pertea G, Trapnell C, Pimentel H, Kelley R, Salzberg SL. TopHat2: accurate alignment of transcriptomes in the presence of insertions, deletions and gene fusions. Genome Biol. 2013;14:R36. doi: 10.1186/gb-2013-14-4-r36. [DOI] [PMC free article] [PubMed] [Google Scholar]
- 21.Dobin A, Davis CA, Schlesinger F, Drenkow J, Zaleski C, Jha S, et al. STAR: ultrafast universal RNA-seq aligner. Bioinformatics. 2013;29:15–21. doi: 10.1093/bioinformatics/bts635. [DOI] [PMC free article] [PubMed] [Google Scholar]
- 22.Wang K, Singh D, Zeng Z, Coleman SJ, Huang Y, Savich GL, et al. MapSplice: accurate mapping of RNA-seq reads for splice junction discovery. Nucleic acids research. 2010:gkq622. doi: 10.1093/nar/gkq622. [DOI] [PMC free article] [PubMed] [Google Scholar]
- 23.Wu TD, Nacu S. Fast and SNP-tolerant detection of complex variants and splicing in short reads. Bioinformatics. 2010;26:873–881. doi: 10.1093/bioinformatics/btq057. [DOI] [PMC free article] [PubMed] [Google Scholar]
- 24.Zhang Y, Lameijer E-W, AC’t Hoen P, Ning Z, Slagboom PE, Ye K. PASSion: a pattern growth algorithm-based pipeline for splice junction detection in paired-end RNA-Seq data. Bioinformatics. 2012;28:479–486. doi: 10.1093/bioinformatics/btr712. [DOI] [PMC free article] [PubMed] [Google Scholar]
- 25.Wu J, Anczuków O, Krainer AR, Zhang MQ, Zhang C. OLego: fast and sensitive mapping of spliced mRNA-Seq reads using small seeds. Nucleic acids research. 2013;41:5149–5163. doi: 10.1093/nar/gkt216. [DOI] [PMC free article] [PubMed] [Google Scholar]
- 26.Liao Y, Smyth GK, Shi W. The Subread aligner: fast, accurate and scalable read mapping by seed-and-vote. Nucleic acids research. 2013;41:e108–e108. doi: 10.1093/nar/gkt214. [DOI] [PMC free article] [PubMed] [Google Scholar]
- 27.Huang S, Zhang J, Li R, Zhang W, He Z, Lam T-W, et al. SOAPsplice: genome-wide ab initio detection of splice junctions from RNA-Seq data. Frontiers in genetics. 2011;2 doi: 10.3389/fgene.2011.00046. [DOI] [PMC free article] [PubMed] [Google Scholar]
- 28.Marco-Sola S, Sammeth M, Guigó R, Ribeca P. The GEM mapper: fast, accurate and versatile alignment by filtration. Nature methods. 2012;9:1185–1188. doi: 10.1038/nmeth.2221. [DOI] [PubMed] [Google Scholar]


