Summary
Somatic mutations have been extensively characterized in breast cancer, but the effects of these genetic alterations on the proteomic landscape remain poorly understood. We describe quantitative mass spectrometry-based proteomic and phosphoproteomic analyses of 105 genomically annotated breast cancers of which 77 provided high-quality data. Integrated analyses allowed insights into the somatic cancer genome including the consequences of chromosomal loss, such as the 5q deletion characteristic of basal-like breast cancer. The 5q trans effects were interrogated against the Library of Integrated Network-based Cellular Signatures, thereby connecting CETN3 and SKP1 loss to elevated expression of EGFR, and SKP1 loss also to increased SRC. Global proteomic data confirmed a stromal-enriched group in addition to basal and luminal clusters and pathway analysis of the phosphoproteome identified a G Protein-coupled receptor cluster that was not readily identified at the mRNA level. Besides ERBB2, other amplicon-associated, highly phosphorylated kinases were identified, including CDK12, PAK1, PTK2, RIPK2 and TLK2. We demonstrate that proteogenomic analysis of breast cancer elucidates functional consequences of somatic mutations, narrows candidate nominations for driver genes within large deletions and amplified regions, and identifies therapeutic targets.
Introduction
A central deficiency in our knowledge of cancer concerns how genomic changes drive the proteome and phosphoproteome to execute phenotypic characteristics1–4. The initial proteomic characterization in the TCGA breast study was performed using reversed phase protein arrays; however this approach is restricted by antibody availability. To provide greater analytical breadth, the NCI Clinical Proteomic Tumor Analysis Consortium (CPTAC) is analyzing the proteomes of genome-annotated TCGA tumor specimens using mass spectrometry5,6. Herein we describe integrated proteogenomic analyses of TCGA breast cancer samples representing the four principal mRNA-defined breast cancer intrinsic subtypes7,8.
Proteogenomic analysis of TCGA samples
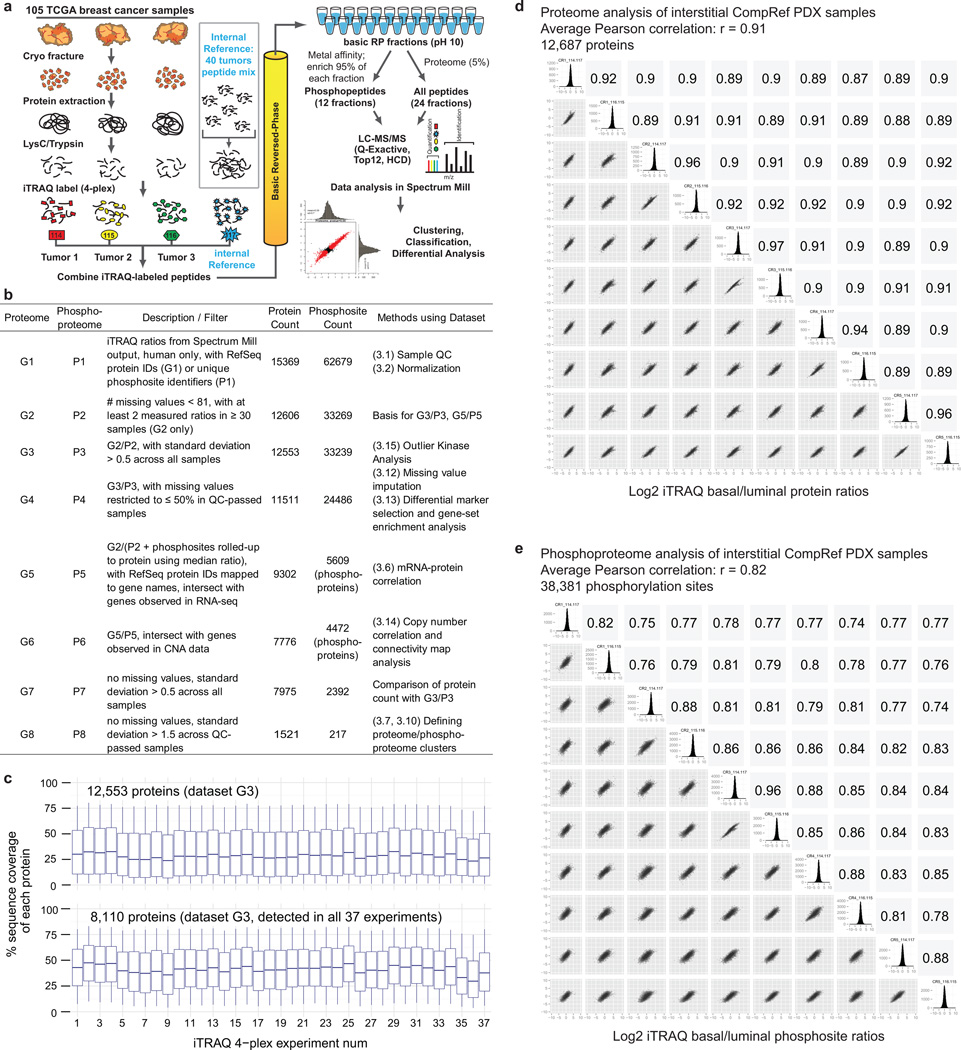
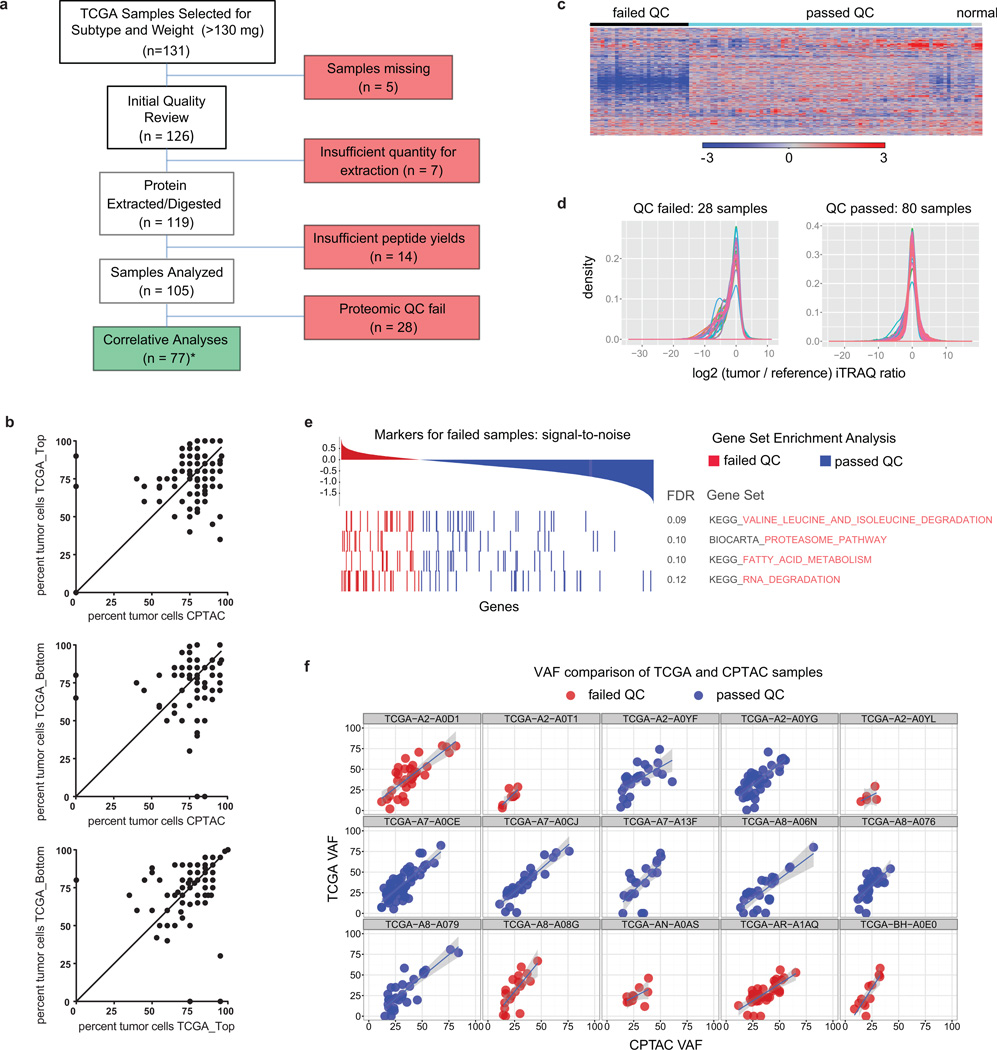
105 breast tumors previously characterized by the TCGA were selected for proteomic analysis after histopathological documentation (Supplementary Tables 1 and 2). The cohort included a balanced representation of PAM50-defined intrinsic subtypes9 including 25 basal-like, 29 luminal A, 33 luminal B, and 18 HER2 (ERBB2)-enriched tumors, along with 3 normal breast tissue samples. Samples were analyzed by high-resolution, accurate mass, tandem mass spectrometry (MS) that included extensive peptide fractionation and phosphopeptide enrichment (Extended Data Fig. 1a). An isobaric peptide labeling approach (iTRAQ) was employed to quantify protein and phosphosite levels across samples, with 37 iTRAQ 4-plexes analyzed in total. A total of 15,369 proteins (12,405 genes) and 62,679 phosphosites were confidently identified with 11,632 proteins/tumor and 26,310 phosphosites/tumor on average (Supplementary Tables 3, 4 and Supplementary Methods). After filtering for observation in at least a quarter of the samples (Supplementary Methods, Extended Data Fig. 1b) 12,553 proteins (10,062 genes) and 33,239 phosphosites, with their relative abundances quantified across tumors, were used in subsequent analyses in this study. Stable longitudinal performance and low technical noise were demonstrated by repeated, interspersed analyses of a single batch of patient-derived luminal and basal breast cancer xenograft samples10 (Extended Data Fig. 1d,e). Due to the heterogeneous nature of breast tumors11–13, and because proteomic analyses were performed on tumor fragments that were different from those used in the genomic analyses, rigorous pre-specified sample and data QC metrics were implemented14,15 (Supplementary Discussion and Extended Data Figures 2, 3). Extensive analyses concluded that 28 of the 105 samples were compromised by protein degradation. These samples were excluded from further analysis with subsequent informatics focused on the 77 tumor samples and three biological replicates.
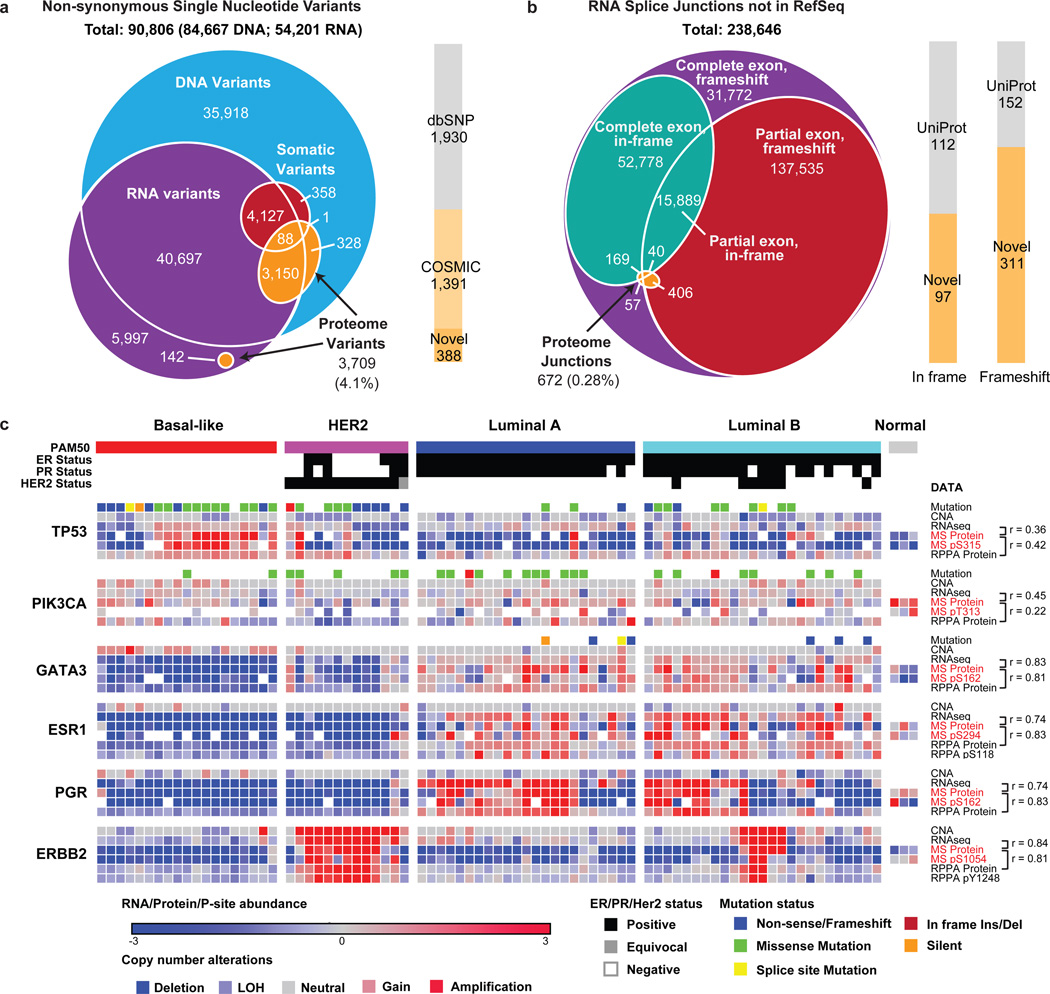
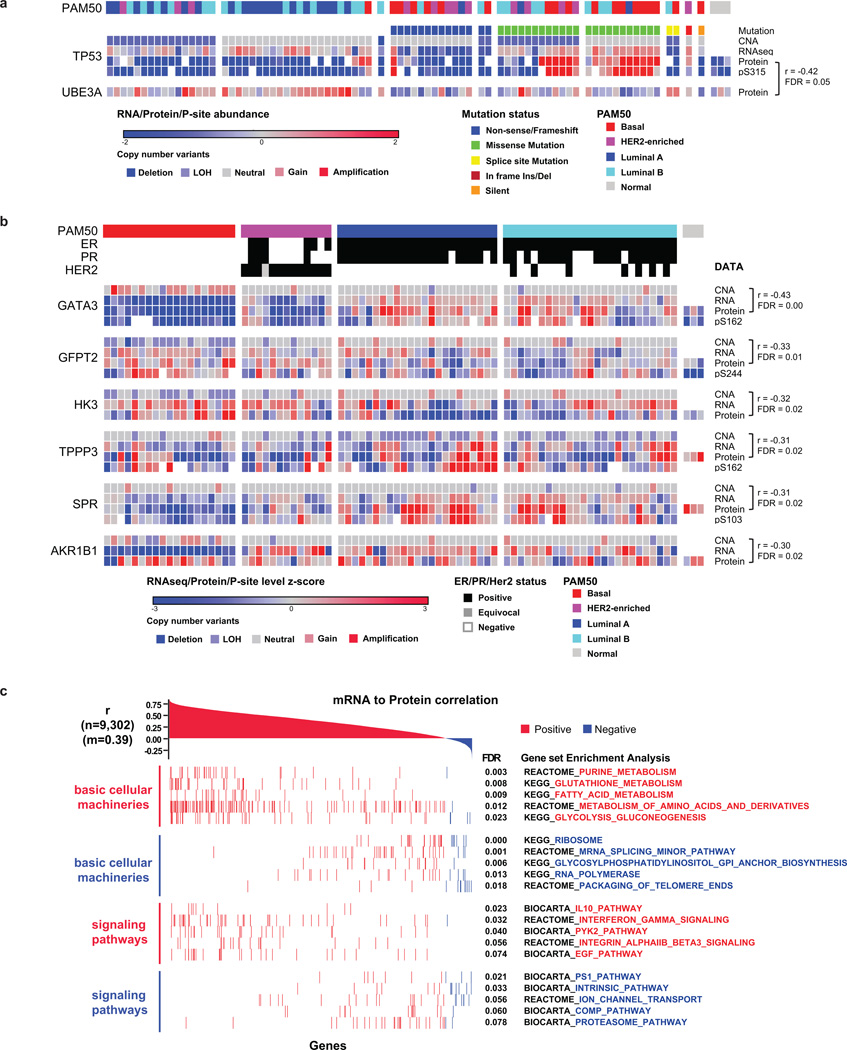
Genome and transcriptomic variation was observed at the peptide level by searching MS/MS spectra not matched to RefSeq against a patient-specific sequence database (Fig. 1a). The database was constructed using the QUILTS software package16 leveraging RefSeq gene models based on whole exome and RNA-seq data generated from portions of the same tumors and matched germline DNA (Fig. 1a, Supplementary Table 5). While these analyses detected a number of single amino-acid variants (SAAVs), frameshifts, and splice junctions, including splice isoforms that had been detected as only single transcript reads by RNA-seq (Fig. 1b, Supplementary Table 5), the number of genomic and transcriptomic variants that were confirmed as peptides by MS was low (Supplementary Discussion). Sparse detection of individual genomic variants by peptide sequencing has been noted in our previous studies16 and reflects limited coverage at the single amino-acid level with current technology. However quantitative MS analysis of multiple peptides for each protein is used to reliably infer overall protein levels. This is an advantage for MS since antibody-based protein expression analysis is typically based on a single epitope. To illustrate this capability in the current data set an initial analysis of three frequently mutated genes in breast cancer (TP53, PIK3CA, and GATA3) and three clinical biomarkers (ER, PGR, and ERBB2) was conducted (Fig. 1c, Supplementary Table 6, 7 and Supplementary Discussion). As expected, TP53 missense mutations were associated with elevated MS-based protein levels, as observed by RPPA (Reverse Phase Protein Array), especially in basal-like breast cancer. TP53 nonsense and frame-shift mutations were associated with a decrease in TP53 protein levels that was particularly striking in the MS data. In contrast, the mostly C-terminal GATA3 frame-shift alterations did not result in decreased protein expression when measured by the median of all GATA3 peptides, suggesting these proteins are expressed despite truncation. No consistent effect of somatic PIK3CA mutation was observed at the level of protein expression. Good correlations between RNA-seq and MS-protein expression levels were found for ESR1 (r=0.74), PGR (r=0.74), ERBB2 (r=0.84) and GATA3 (r=0.83) with moderate correlations observed for PIK3CA (r=0.45) and TP53 (r=0.36). Lower TP53 protein abundance levels compared to mRNA levels were especially prevalent in luminal tumors, suggesting post-transcriptional regulatory mechanisms such as proteasomal degradation. To explore this hypothesis a search was made for E3 ligases that showed negative correlation to p53 protein (Supplementary Table 8). These analyses identified UBE3A (r=−0.42; adj. pval=0.05) (Extended Data Fig. 4a), an established TP53 E3 ligase17. In comparing CNA, RNA, and protein levels for GATA3, copy number gains in chromosome 10q were anti-correlated with RNA and protein levels in basal-like tumors. This observation prompted a search for other gains or losses that were anticorrelated with RNA and/or protein levels (see Extended Data Fig. 4b for further analyses). Overall, six genes were identified that significantly anti-correlated at an FDR<0.05 on both RNA and protein level to their CNA signals (Extended Data Fig. 4b). GATA3 amplification on 10q in basal-like breast cancer showed the strongest anti-correlation, followed by the hexosamine and glycolysis pathway enzymes GFPT2 and HK3, which are upregulated in basal-like breast cancer despite being subjected to frequent chromosomal deletion on 5q. Global analysis of the correlation of mRNA-to-protein yielded a median Pearson value of r=0.39, with 6,135 out of 9,302 protein/mRNA pairs (66.0%) correlating significantly at an FDR<0.05 (Extended Data Fig. 4c, Supplementary Table 9 and Supplementary Discussion). Similar to the colon cancer analysis6 metabolic functions such as amino acid, sugar and fatty acid metabolism were found to be enriched among positively correlated genes18 whereas ribosomal, RNA polymerase and mRNA splicing functions were negatively correlated. Overall these analyses demonstrate the utility of global proteome correlation analysis for both confirmation of suspected regulatory mechanisms and identification of candidate regulators meriting further investigation.
Figure 1. Proteogenomic analysis of human breast cancer. Direct effects of genomic alterations on protein level.
Overlap of a, protein coding single amino acid variants (SAAVs) and b, RNA splice junctions not present in RefSeq v60 detected by DNA exome sequencing, RNA-seq, and LC-MS/MS. Proportions of novel variants are noted. c, Heatmap of mutations/CNA and their effects on RNA and protein expression of breast cancer-relevant genes across tumor and normal samples. ER, PR, HER2 and PAM50 status are annotated. Median iTRAQ protein abundance ratio and the most frequently detected and differential phosphosite ratio are shown for each gene. Pearson correlations between MS protein vs RNA-seq and MS protein vs RPPA are indicated.
Copy Number Alterations
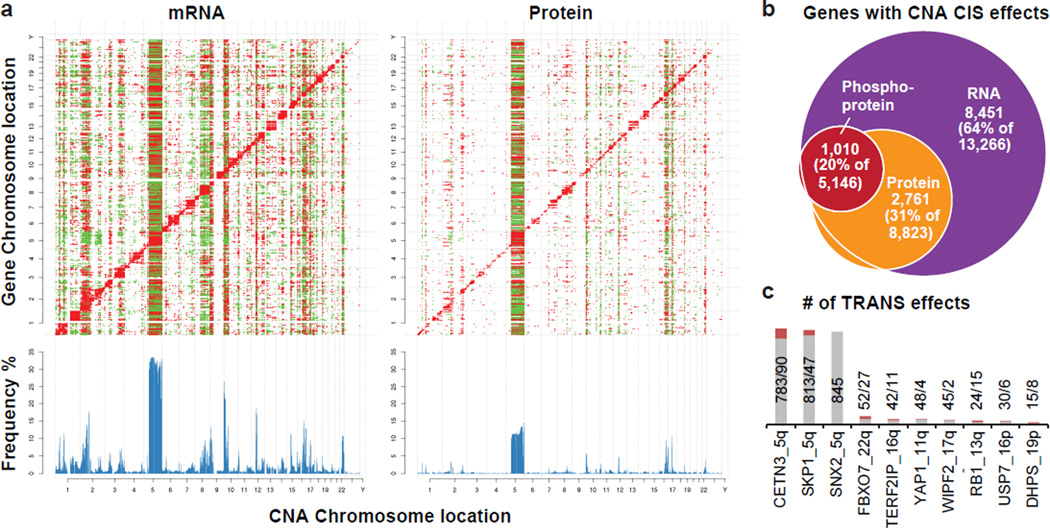
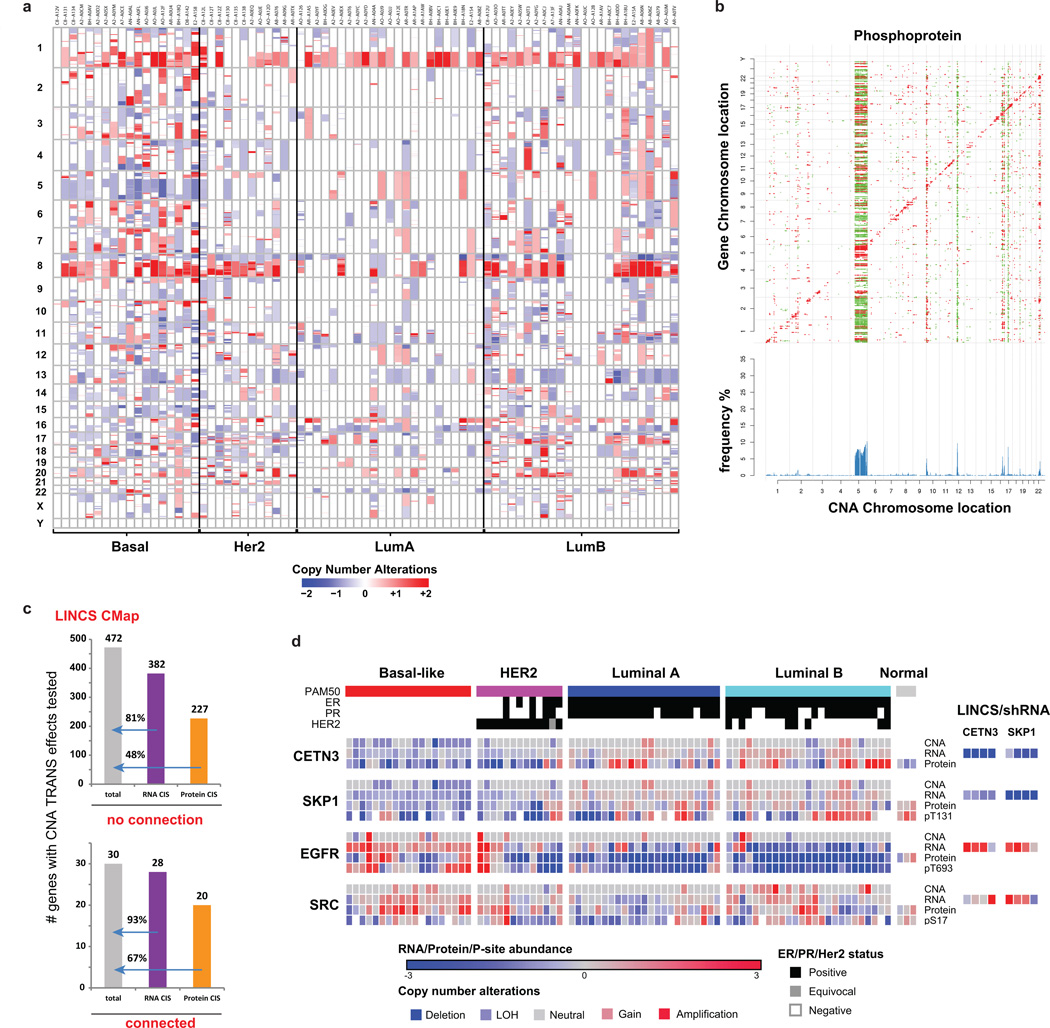
To determine the consequences of CNA on mRNA, protein and phosphoprotein abundance, both in “cis” on genes within the aberrant locus and in “trans” on genes encoded elsewhere, univariate correlation analysis was used as previously described6. A total of 7,776 genes with CNA, mRNA and protein measurements were analyzed by calculating Pearson correlation and associated statistical significance (Benjamini-Hochberg corrected p-value) for all possible CNA-mRNA and CNA-protein pairs (Fig. 2a, Supplementary Table 10, Extended Data Fig. 5a, see Methods). For the phosphoproteome, 4,472 CNA-phosphoprotein pairs were analyzed (Extended Data Fig. 5b). Significant positive correlations (cis) were observed for 64% of all CNA-mRNA, 31% of all CNA-protein, and 20% of all CNA-phosphoprotein pairs Fig. 2b. Proteins and phosphoproteins correlated in cis to CNA were, for the most part, a subset of the cis effects observed in mRNA-to-CNA correlation (Fig. 2b, Supplementary Table 10). The fractional difference of well-annotated oncogenes and tumor suppressor genes among the significantly cis-correlated CNA-to-mRNA and -protein gene pairs was analyzed. Based on a reference list of 487 oncogenes and tumor suppressors (Supplementary Table 10), these cancer relevant genes occur 37.6% more frequently in the subset of genes that correlate both on CNA/mRNA and CNA/protein levels than in the subset that only correlate on CNA/mRNA but not on CNA/protein level (Fisher exact p-value=0.02). This suggests that CNA events with a tumor promoting outcome more likely lead to cis regulatory effects on both the protein and mRNA level, whereas CNA events with no documented role in tumorigenesis are more likely to be neutralized on the protein level than on the RNA level. Trans effects (Fig. 2a) appear as vertical bands, with accompanying frequency histograms (in blue) highlighting “hot spots” of significant trans effects. Using a minimum threshold of 50 trans-affected genes, 68% of the tested genes were associated with trans effects on the mRNA level, whereas only 13% were associated with effects on the protein level and 8% on the phosphoprotein level. Importantly, CNA-protein correlations appeared to be a reduced representation of CNA-mRNA correlations. Furthermore, for many CNA regions correlations were more directionally uniform on the protein level than on the mRNA level. CNA regions exhibiting the most trans associations at the protein level were found on chromosomes 5q (LOH in basal; gain in LumB), 10p (gain in basal), 12 (gain in basal), 16q (LumA deletion), 17q (LumB amplification), and 22q (LOH in luminal and basal) (Extended Data Fig. 5a).
Figure 2. Effects of copy number alterations (CNA) on mRNA, protein, and phosphoprotein abundance.
a, Correlations of CNA (x-axes) to RNA and protein expression levels (y-axes) highlight new CNA cis and trans effects. Significant (FDR<0.05) positive (red) and negative (green) correlations between CNA and mRNAs or proteins are indicated. CNA cis effects appear as a red diagonal line, CNA trans effects as vertical stripes. Histograms show the fraction [%] of significant CNA trans effects for each CNA gene. b, Overlap of cis effects observed at RNA, protein, and phosphoprotein levels (FDR<0.05). c, Trans-effect regulatory candidates identified among those with significant protein cis-effects using LINCS CMap. Bars indicate total numbers of significant CNA/protein trans effects (gray; FDR<0.05) and overlap with regulated genes in LINCS knock-down profiles (red; 4 cell lines; moderated T-test FDR<0.1).
Trans associations are not necessarily direct consequences of the chromosomal aberration. For example since 5q loss occurs in at least 50% of basal-like breast cancers19, many of the trans effects involve genes that mark the basal-subtype. To identify candidate driver genes whose copy number alterations are direct drivers of trans effects, results were compared with functional knock-down data on 3,797 genes in the Library of Integrated Cellular Signatures (LINCS) database (http://www.lincsproject.org/)20–22. For any given gene with copy number alterations (“CNA-gene”), sets of genes were identified corresponding to proteins that changed where there was gain (“CNA-gain trans gene set”) or loss (“CNA-loss trans gene set”). These gene sets were then compared to the effects of gene knock down in the LINCS database (see Methods). Queries for 502 different CNA-genes meeting the criteria defined above identified 10 CNA-genes that could be functionally connected to both CNA-gain and CNA-loss trans protein-level effects (Extended Data Fig. 5c, Supplementary Table 11). A permutation-based approach implemented to test significance (see Supplementary Methods) yielded an FDR < 0.05 for 10 genes affected by both CNA gains and losses (Fig. 2c). These proteins were defined as potential regulatory candidates for the CNA trans effects observed on the proteome level in this study, since in a gene-dependent manner on average 17% of these trans effects were consistent with the knockdown profiles. Notably, the established oncogenic receptor tyrosine kinase ERBB2 was functionally connected only to CNA gain trans effects (Supplementary Table 11). The E3 ligase SKP123 and the ribonucleoprotein export factor CETN3, both located on chromosome arm 5q with frequent losses in basal-like breast cancer and less frequent gains in luminal B breast cancer, were detected as potential regulators affecting the expression of the tyrosine kinase and therapeutic target EGFR, and SKP1 also was linked to SRC (Extended Data Fig. 5d). Another potential regulator, FBXO7, (a substrate recognition component of the SCF (SKP1-CUL1-F-box protein)-type E3 ubiquitin ligase complex), was affected mostly by LOH events on chromosome 22q. Interestingly, in a recent human interaction proteome study SKP1 and FBXO7 were listed as interaction partners24.
Clustering and Network analysis
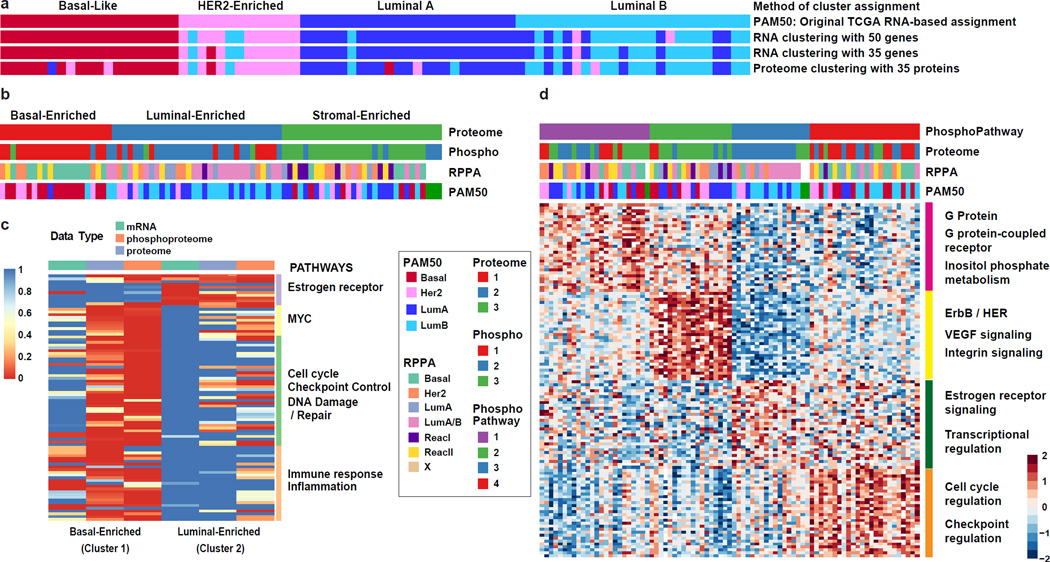
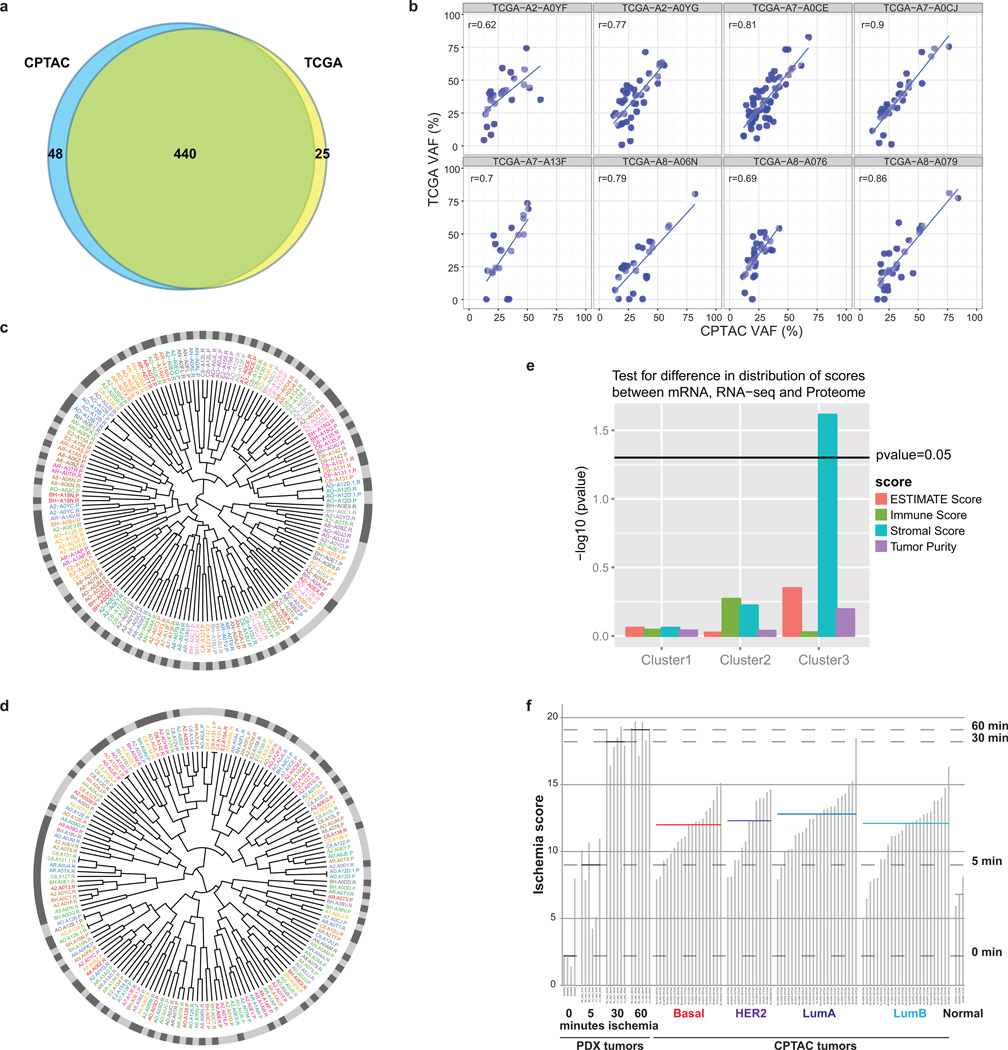
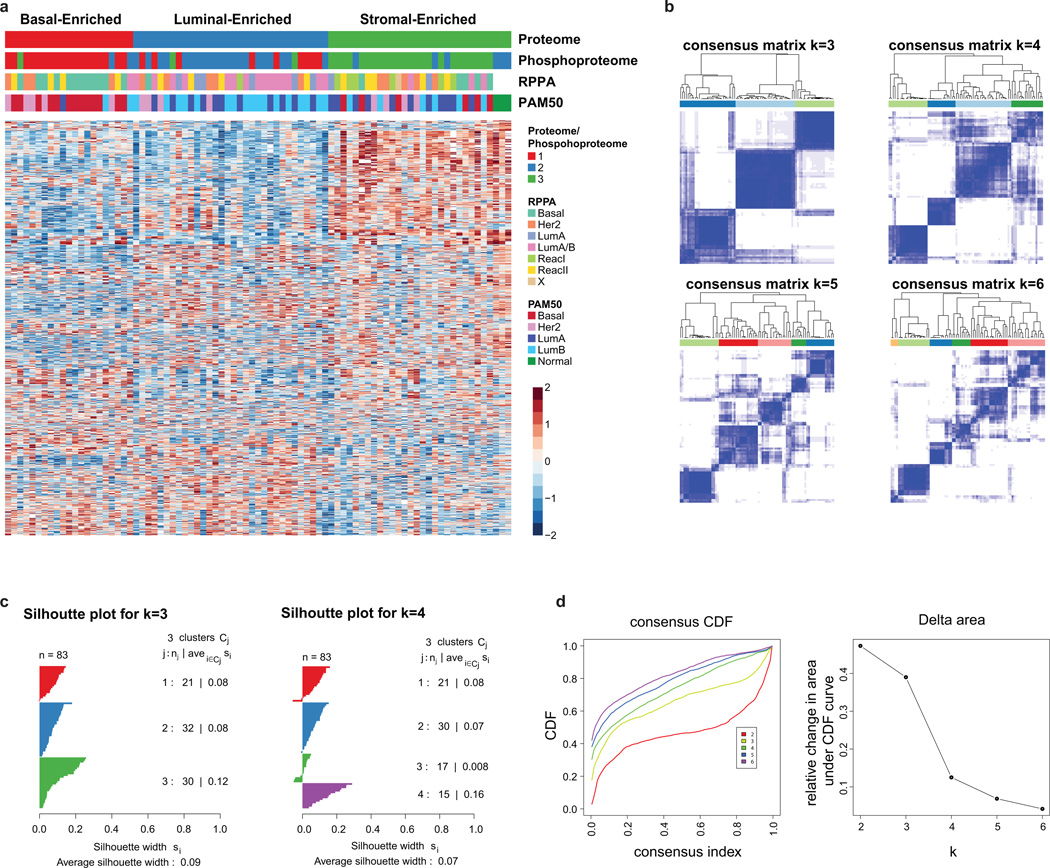
Transcriptional profiling has converged on four major breast cancer subtypes: Luminal A and B, basal and HER2-enriched1,9. To investigate the extent to which the PAM50 “intrinsic” breast cancer classification scheme is reflected or refined on the proteome level in the CPTAC samples, clustering analyses were first restricted to the reduced set of PAM50 genes. When RNA data for the 50 PAM50 genes were clustered directly (without using a classifier), the clustering was similar to the TCGA PAM50 annotation (second annotation bar in Fig. 3a). Restricting both the RNA and proteome data to the set of 35 PAM50 genes observed in the proteome produced a similar result (bottom two annotation bars in Fig. 3a), and all the major PAM50 groups were recapitulated in the proteome almost as well as in the RNA data. This indicates that although different tissue sections of the same tumors were used for RNA-seq and protein analysis, very similar subtype-defining features can be observed in both data types. Global proteome and phosphoproteome data were then used to identify proteome subtypes in an unsupervised manner. Consensus clustering identified basal-enriched, luminal-enriched, and stromal-enriched clusters (Extended Data Figs. 6a–d, 7a). Unlike the clustering observed with PAM50 genes, mRNA-defined HER2-enriched tumors were distributed across these three proteomic subgroups. The basal-enriched and luminal-enriched groups showed a strong overlap with the mRNA-based PAM50 basal-like and luminal subgroups, whereas stromal-enriched proteome subtype represented a mix of all PAM50 mRNA-based subtypes, and has a significantly enriched stromal signature (Extended Data Fig. 3e). Among the stromal-enriched tumors there was strong representation of reactive type I tumors as classified by RPPA (Supplementary Table 12), showing agreement between the RPPA and mass spectrometry-based protein analyses for the detection of a tumor subgroup characterized by stromal gene expression1.
Figure 3. Proteomic and phosphoproteomic subtypes of breast cancer and subtype-specific pathway enrichment.
a, Unsupervised clustering of RNA-seq and proteomics data restricted to PAM50 genes and subset of 35 detected proteins reveal high similarity to PAM50 (TCGA) sample annotation. b, K-means consensus clustering of proteome and phosphoproteome data identifies basal-enriched, luminal-enriched, and stromal-enriched subgroups. c, Gene set enrichment analysis highlights sets of pathways significantly differential between basal-enriched and luminal-enriched tumors (detailed in Extended Data Fig. 7b). d, K-means consensus clustering performed on pathways derived from single sample GSEA analysis of phosphopeptide data identifies four distinct clusters.
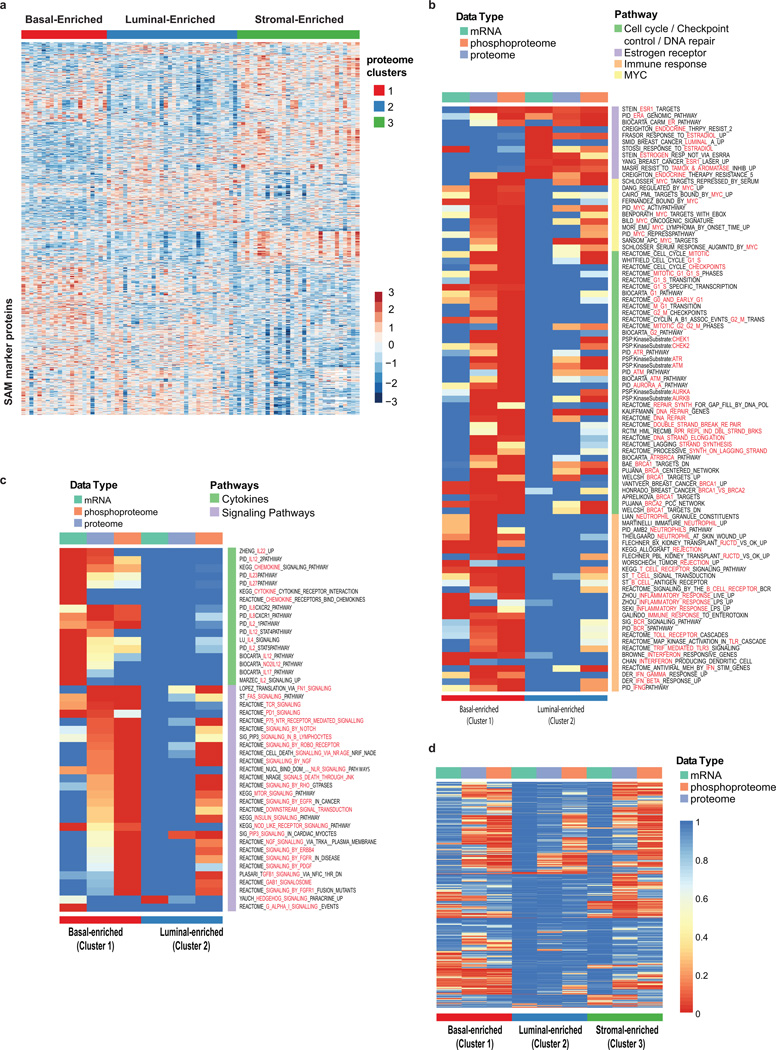
Since the basal- and luminal-enriched proteome subgroups are coherent, pathway analyses were conducted on these two subtypes, using the stromal-enriched subgroup as a control to assess specificity. (Fig. 3c, Extended Data Fig. 7b, Supplementary Table 13). The luminal-enriched subgroup was exclusively enriched for estradiol and ESR1-driven gene sets. In contrast, multiple gene sets were enriched and upregulated specifically in the basal-like tumors. Particularly extensive basal-like enrichment was seen for MYC target genes; for cell cycle, checkpoint, and DNA repair pathways including regulators AURKA/B, ATM, ATR, CHEK1/2, and BRCA1/2; and for immune response/inflammation, including T-cell, B-cell, and neutrophil signatures. The complementarity of transcriptional, proteomic, and phosphoproteomic data was also highlighted in these analyses (Extended Data Fig. 7c, d).
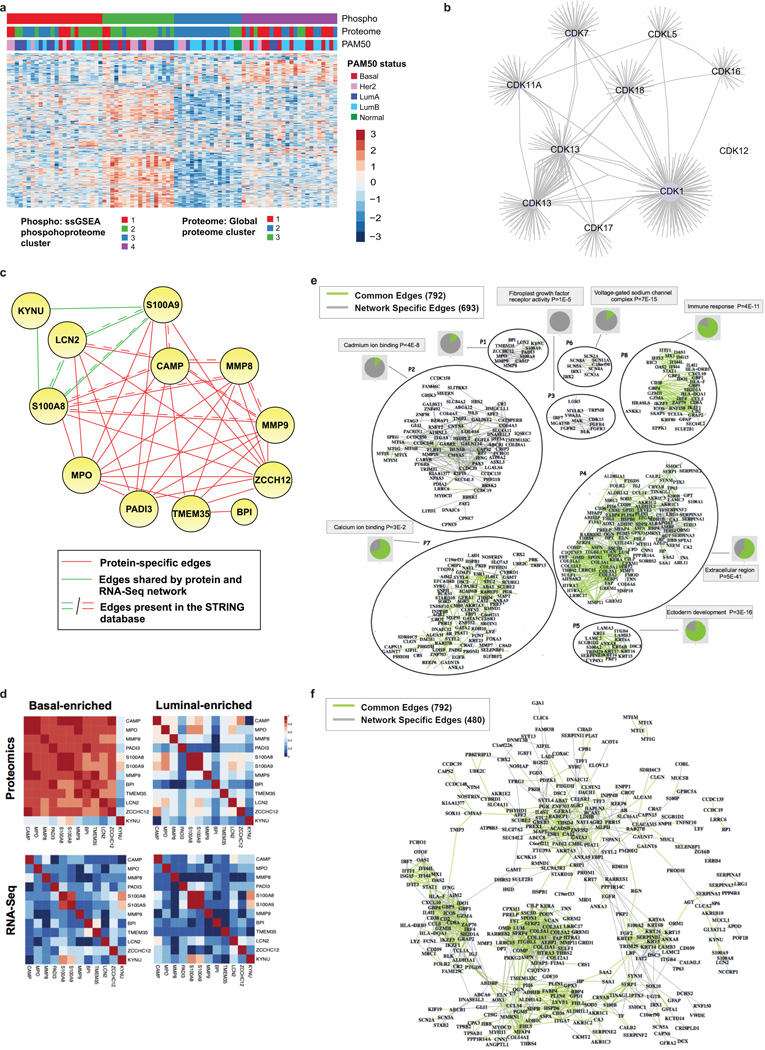
Using phosphorylation status as a proxy for activity, phosphoproteome profiling can theoretically be used to develop a signaling pathway-based cancer classification. K-means consensus clustering was therefore performed on pathways derived from single sample GSEA analysis of phosphopeptide data (Methods, Supplementary Tables 14 and 15). Of four robustly segregated groups, subgroups 2 and 3 substantially recapitulated the stromal- and luminal-enriched proteomic subgroups, respectively (Fig. 3d, Extended Data Fig. 8a). Subgroup 4 included a majority of tumors from the basal-enriched proteomic subgroup, but was admixed particularly with luminal-enriched samples. This subgroup was defined by high levels of cell cycle and checkpoint activity. All basal and a majority of non-basal samples in this subgroup had TP53 mutations. Consistent with high levels of cell cycle activity, a multivariate kinase-to-phosphosite abundance regression analysis highlighted CDK1 as one of the most highly connected kinases in this study (Extended Data Fig. 8b, Supplementary Table 16). Subgroup 1 was a novel subgroup defined exclusively in the phosphopeptide/pathway activity domain, with no enrichment for either proteomic or PAM50 subtypes. It was defined by G-protein, G-protein coupled receptor, and inositol phosphate metabolism signatures, as well as ionotropic glutamate signaling (Fig. 3d). Co-expression patterns among genes/proteins across different subgroups were also analyzed using a Joint Random Forest (JRF) method25 that identified network modules, such as an MMP9 module, with different interaction patterns between basal-enriched and luminal-enriched subgroups. These latter patterns appeared specific to the proteome-level data (Extended Data Fig. 8 c–f, Supplementary Table 17 and Supplementary Methods).
Phosphosite markers in PIK3CA and TP53 mutant breast cancer
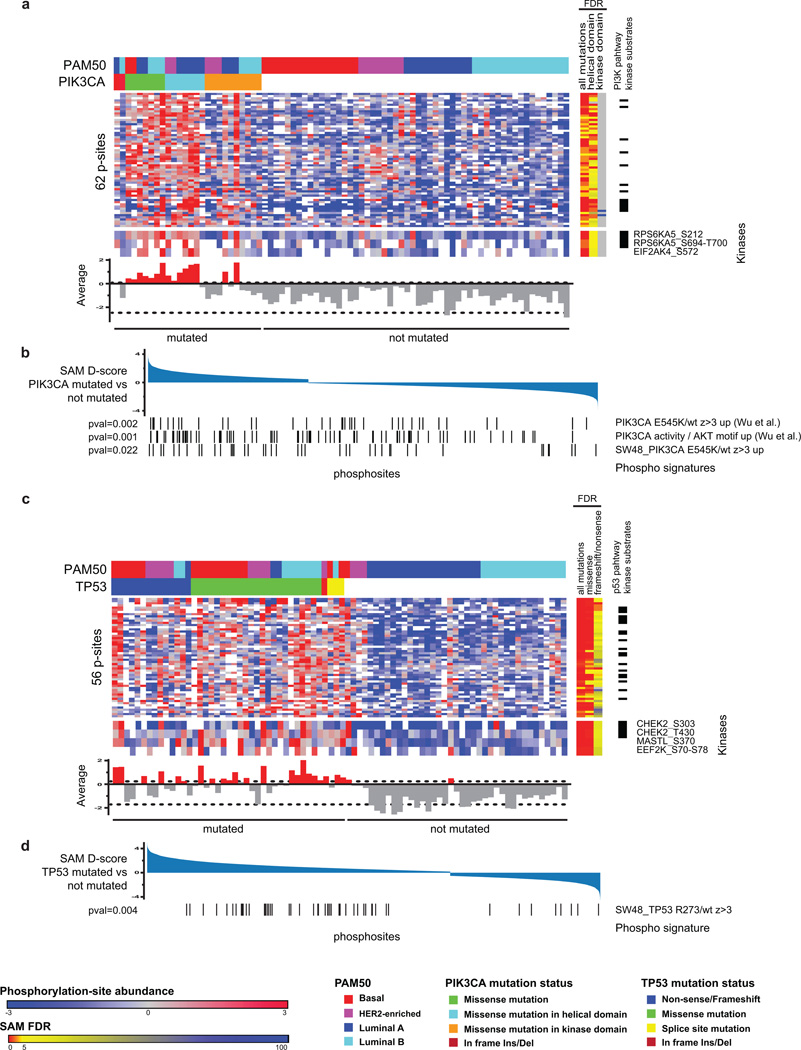
TP53 and PIK3CA are the most recurrently mutated genes in breast cancer, with frequencies for PIK3CA at 43% in luminal tumors and for TP53 at 84% in basal-like tumors1. Most of the PIK3CA missense mutations were gain of function mutations and therefore expected to lead to an activation of the PI3K signaling cascade, but the extent to which this occurs has been controversial and there is uncertainty which pathway components are effectors26,27. Marker selection analysis was therefore performed for upregulated phosphosites in PIK3CA-mutated tumors. In total, 62 phosphosites were identified that were positively associated with PIK3CA mutation (FDR<0.05), including the kinases RPS6KA5 and EIF2AK4 (Extended Data Fig. 9a, Supplementary Table 18). Calculating the average phosphorylation signal of these marker phosphosites provided a read-out for PI3K pathway activity in PIK3CA-mutated tumors, with 15 of the 26 mutated tumors (58%) exhibiting an activated PIK3CA mutation signature. Of note, the identified PIK3CA mutant phosphoproteome signature was activated in all tumors harboring helical domain PIK3CA mutations but only 2 of 10 tumors harboring kinase domain mutations. To test if the identified differences in the phosphoproteome of PI3K mutant versus wild-type tumors could be explained by mutation of PIK3CA, the tumor data were compared to phosphosite signatures derived from isogenic PIK3CA mutant cell lines28 (Extended Data Fig. 9b, Supplementary Table 18). There was an enrichment of signatures derived from helical domain-mutated isogenic cell lines, but not from kinase domain-mutated cells, supporting the observations in primary tumors.
The same strategy was used to identify phosphorylation signaling events connected to TP53 mutation. A total of 56 phosphosites upregulated in TP53 mutant tumors were identified that were independent of basal-like subtype association (Extended Data Fig. 9c, Supplementary Table 18). Using the average phosphorylation signal of these marker phosphosites as a proxy for TP53 mutation-driven cell cycle control, 22 of 41 mutated tumors (54%) showed upregulated signals. This TP53 mutant phosphosignature was somewhat enhanced in tumors in which mutations occurred almost exclusively in the DNA binding region compared to those with non-sense/frameshift mutations. In addition to the well-described checkpoint kinase CHEK2, significantly upregulated phosphosites were identified for the kinases MASTL and EEF2K in TP53-mutated tumors. Single sample GSEA analysis of isogenic p53-mutant phosphosignatures showed an enrichment of a phosphosignature derived from R273H mutated isogenic cells (Extended Data Fig. 9d), confirming the pronounced effect of missense mutations in the DNA-binding region on phosphorylation pathways.
Identification of gene amplification and breast cancer subtype-specific activated kinases in human breast cancer
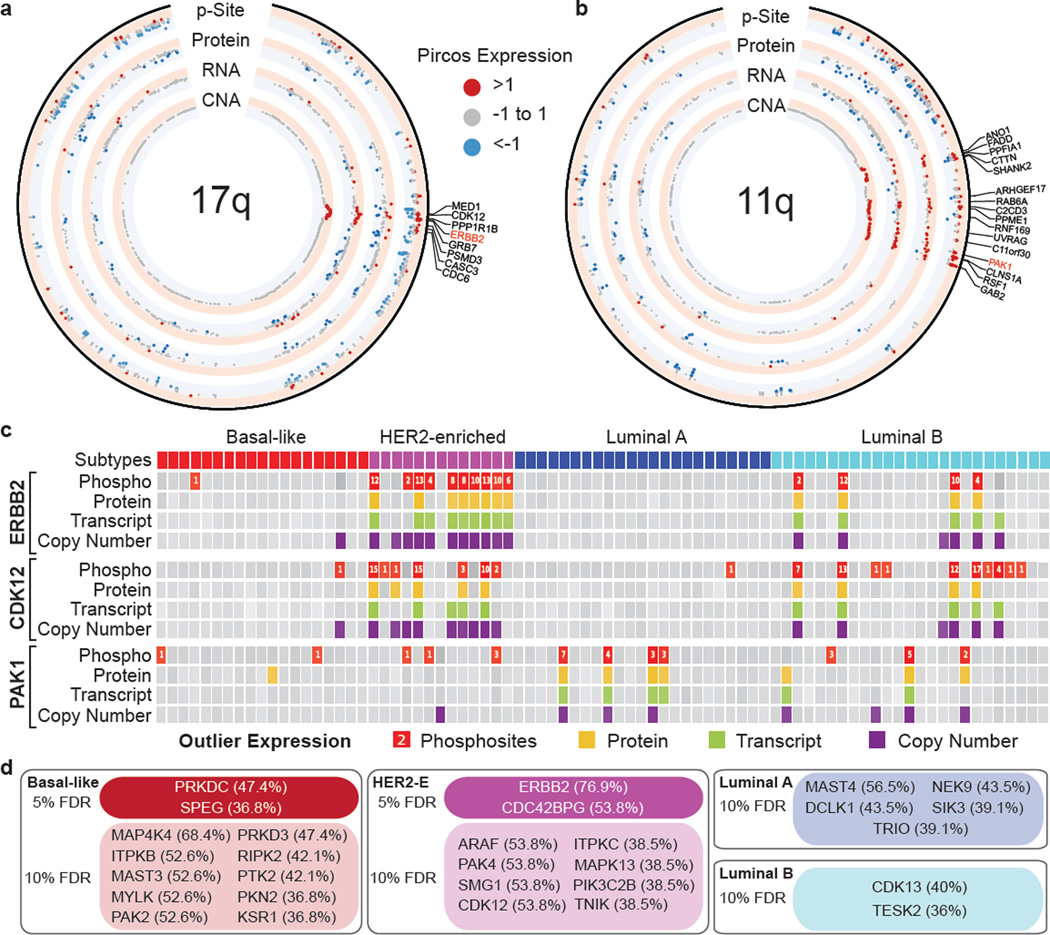
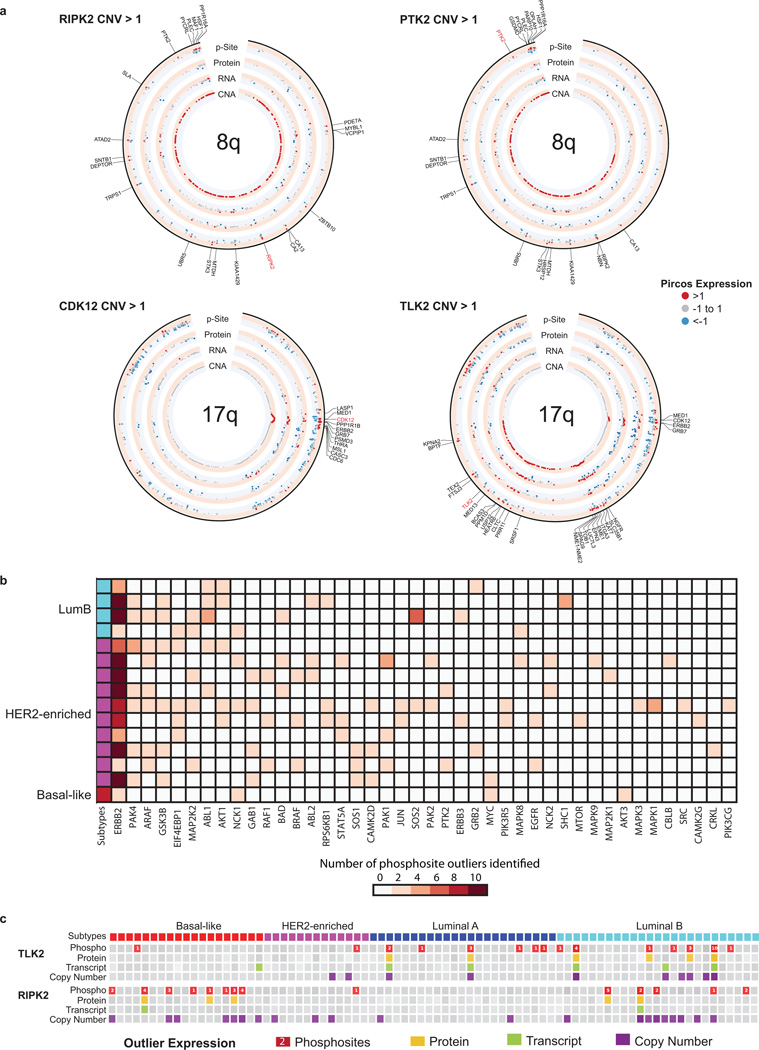
CNA spans many driver gene candidates and RNA expression has been frequently used to narrow candidate nominations. Proteogenomic analysis should further promote this nomination process. In this candidate refinement a focus on protein kinases is warranted, since many are drug targets. An in-depth proteogenomic pipeline was developed that flagged kinases, expression levels of which were at least 1.5 interquartile ranges higher than the median (Supplemental Table 19). A proteogenomic circos-like29 plot (termed a “pircos” plot) was used to map these outlier kinase values onto the genome (Fig. 4a,b, Extended Data Fig. 10a). The ERBB2 locus showed the strongest effect of increased phosphoprotein levels associated with gene amplification-driven RNA and protein over expression (Fig. 4a). CDK12 is a positive transcriptional regulator of homologous recombination repair genes with its partner Cyclin K30, and is often encompassed by the ERBB2 amplicon. This gene was also found to be upregulated at the RNA, protein and phosphosite level indicating that CDK12 is highly active in the majority of ERBB2 positive tumors (Fig. 4a). The analysis of the ERBB2 amplicon also uncovered co-outlier phosphorylation status for MED1, GRB7, MSL1, CASC3 and TOP2A, all previously described in association with ERBB2 amplification. To better understand the downstream effects of ERBB2 amplification, additional phosphosite outliers were identified in 41 known ERBB2 signaling genes for the 15 samples that had ERBB2 phosphosite outlier expression (Extended Data Fig. 10b).
Figure 4. Example analyses of aberrantly regulated kinases in human breast cancer.
a and b, PIRCOS (Proteogenomics CIRCOS) plots showing CNA, RNA, protein and phosphosite expression for 17 tumors with amplification in 17q (ERBB2 CNA>1) and 8 tumors with amplification in 11q (PAK1 CNA>1). Labeled genes have CNA>1 and phosphosite>1. c, Proteogenomic outlier expression analysis for ERBB2, CDK12, and PAK1. Samples with outlier phosphosite (red), protein (yellow), RNA (green) and copy number (purple) expression are shown. Phosphosite squares indicate per-sample outlier phosphosites. d, Outlier kinase events by PAM50 subtype (>35% of subtype samples contain a phosphosite outlier; <10% FDR using Benjamini-Hochberg adjusted p-values).
These canonical findings stimulated a proteogenomic analysis to identify additional outlier kinases in the breast cancer genome. A proteogenomic dissection of chromosome 11q based on PAK1 amplification (Fig. 4b,c), a breast cancer driver kinase31, illustrated that PAK1 is hyperphosphorylated in PAK1 amplified tumors, along with CLNS1A, RFS1 and GAB232. Additional examples of outlier kinases included PTK2 and RIPK2 in association with amplification of chromosome 8q (Fig. 4c; Extended Data Fig. 10a,c). PAK1 and TLK2 (17q23) appear to be luminal breast cancer specific events Fig. 4c; Extended Data Fig. 10c). To further examine whether outlier kinases were breast cancer subtype-specific, independent of amplification status, the BH-corrected probability was calculated of finding that number of phosphosite outliers within a subtype, given the total number of outliers across all subtypes, the subtype sample size and the total sample size. (Fig. 4d). These analyses led to the expected identification of ERBB2 in the HER2-enriched subtype at the 5% FDR level, as well as the new finding of CDC42BPG (MRGKG), an effector kinase for RHO-family GTPases33. In basal-like breast cancer, two kinases, PRKDC and SPEG, were significant at the 5% FDR level. PRKDC is a non-homologous end-joining (NHEJ) factor that can be phosphorylated by ATM kinase, and is therefore a logical finding in this disease subset34. However SPEG, a kinase associated with severe dilated cardiomyopathy when suppressed35, has not been previously reported in association with breast cancer. A larger number of subtype-specific kinases were detected at the 10% FDR level, several of which have recently described relevance in breast cancer, including PRKD3 in basal-like breast cancer36, the LKB-regulated SIK3 in luminal A breast cancer37 and CDK13 in luminal B breast cancer, which, similar to CDK12, can interact with Cyclin K30.
Discussion
The analytic breadth and depth of proteomic and phosphoproteomic analyses displayed in this study demonstrates the strengths of mass spectrometry-based proteomics, but also some of the limitations inherent in proteolytic peptide sequencing (see Supplementary Discussion). An example of how high-dimensional proteomic analysis provides insight into unresolved genomic issues concerns the study of loss of the long arm of chromosome 5 (5q). Analysis of RNA and protein correlations narrowed the list of potential trans-deregulated proteins. Orthogonal candidate screening using functional genomics methods identified loss of CETN3 and SKP1 as potential transregulators, with upregulation of EGFR as a downstream consequence in basal-like breast cancers. While further experimental evidence must be sought for these proposed regulatory relationships, SKP1/Cullin complex has already been linked to EGFR activation in Glioma38. Unfortunately EGFR targeting has not to date proven to be effective therapy in basal-like breast cancer39. This might be due to the fact the SKP1 loss deregulates multiple targets requiring a much broader inhibitory strategy.
It is recognized that PIK3CA mutations do not strongly activate canonical downstream effectors28. Mass spectrometry-based phosphoproteomics provides an opportunity for unbiased examination of downstream signaling events consequent upon PIK3CA mutational activation. These studies revealed that common PIK3CA mutations affect a large number of targets with diverse functionalities including the kinases RPS6KA5 and EIF2AK4. Thus, the data and analyses reported here extend our knowledge of the effectors that promote tumorigenesis in response to constitutive activation of PI3 kinase. Similarly, TP53 mutation-associated phosphopeptides point towards novel functionalities, including regulation of the kinases MASTL and EEF2K.
A central goal in breast cancer research has been the identification of druggable kinases beyond HER2. Candidate genes that exhibited similar gene amplification-driven proteogenomic patterns to HER2 included CDK12, TLK2, PAK1 and RIPK2. The proteogenomic link with gene amplification was particularly strong for CDK12, in keeping with its location in the ERBB2 amplicon, while the strengths of correlation between DNA amplification, RNA, protein and phosphoprotein for the other examples were more variable. The presence of activated CDK12 in the ERBB2 amplicon might explain why tumors arising in BRCA1 carriers are usually ERBB2 negative. As a positive transcriptional regulator of BRCA1 and multiple FANC family members, CDK12 promotes DNA repair by homologous recombination. CDK12 amplification would, therefore, oppose the functional effects of BRCA1 haploinsufficiency during tumor evolution30. Overall, multiple outlier kinases generate testable therapeutic hypotheses for which enabling inhibitors are in development. For example PAK1 has recently been confirmed to be a therapeutic target and poor prognosis factor in luminal breast cancer40.
Although incomplete outcome data and the remarkable heterogeneity of breast cancer are additional relevant constraints, the number of TCGA specimens analyzed here is insufficient to support conclusive clinical correlations. Only 8 deaths occurred among the 77 patients, which are too few samples to provide sufficient statistical power for association analysis. Adequately powered MS-based clinical investigation will require targeted approaches41, especially given the highly limited amount of patient material available from clinical trials and the mostly formalin-fixed nature of the specimens. The current analysis is therefore centered on biological findings and correlations, with orthogonal validation and false discovery concerns addressed through an examination of cell-line databases of the effects of individual gene perturbations. Typical of a multi-tiered analysis of this complexity, there are many hypotheses to test, and many findings that require further investigation.
In conclusion, this study provides a high-quality proteomic resource for human breast cancer investigation and illustrates technologies and analytical approaches that provide an important new opportunity to connect the genome to the proteome. Larger-scale exploration of discovery proteomics in the clinical setting will require improvements in clinical investigation, including acquisition of adequate amounts of optimally collected tumor tissue both before and during therapy as well as advances in MS proteomics to reduce sample input and increase sensitivity for low abundance proteins and modified peptides.
Extended Data
Extended Data Figure 1. Experimental and data analysis workflows and longitudinal data generation quality control.
a, iTRAQ 4-plex global proteome and phosphoproteome analysis workflow. 105 TCGA breast tumors were analyzed in 35 iTRAQ 4-plex experiments (plus 1 replicate and 1 normal sample experiment), with three tumors of different subtypes compared to a fourth common internal reference sample in each experiment. The reference sample comprised 10 individual tumors of each of the 4 major breast cancer intrinsic subtypes and served as an internal standard for all proteins and phosphoproteins quantified in this study. Each iTRAQ MS/MS spectrum measures a peptide from 4 samples (3 individual patients and the reference sample mix of 40 patients). More than 400,000 distinct peptides were identified and quantified in ~14 million MS/MS spectra. Personalized tumor-specific protein databases were generated in the QUILTS software package using whole exome sequencing-derived variant calls and RNAseq-derived transcript information. All mass spectrometry data was analyzed using the Spectrum Mill software package. b, Overview of proteome and phosphoproteome datasets. The table provides a summary of the datasets used in specific analyses, including the filters applied to derive the proteins and phosphosites/phosphoproteins that constitute each dataset; the protein, phosphosite or phosphoprotein count; and the methods that employ the respective datasets. c, Distribution of sequence coverage of the identified proteins with tryptic peptides detected by MS/MS, whiskers show the 5–95 percentiles. d and e, Robust and accurate proteome/phosphoproteome platform. Longitudinal performance was tested by repeated proteome and phosphoproteome analysis of patient-derived xenograft tumors. Scatterplots, histograms and Pearson correlations comparing individual replicate measurements are shown.
Extended Data Figure 2. Tumor sample quality control (I).
a, Remark diagram showing sample processing and partitioning. Initial quality review encompassed histopathological examination of H&E stained tissue slices. *For 3 samples no tumor cells were seen on histopathology (BH-A0E9, BH-A0C1, A2-A0SW). These samples were nevertheless included in the proteome analysis since other quality control standards were met (see below) and samples with 0% tumor cellularity on top or bottom sections were included in TCGA analyses. b, correlation of TCGA (top or bottom sections) and CPTAC histological assessment of neoplastic cellularity for samples (n = 105). The average and range of neoplastic cellularities were identical for CPTAC and TCGA histological assessments. Averages (standard deviations) for neoplastic cellularity were 76% (+/− 17) for CPTAC, 76% (+/− 15) for TCGA_Top, and 75% (+/− 18) for TCGA_Bottom histopathology slides (Supplementary Table 2). Note that in three CPTAC cases where no tumor cells were identified by histopathological assessment, numbers of protein-level somatic variants were similar to all other tumors. The identified mutated proteins were TP53_R273C, NOP58_Q23E, TAGLN2_G154R, TUBA1B_D116H, and MRPL48_I173K (Supplementary Table 5), indicating presence of tumor cells in these samples. c, Proteome iTRAQ tumor/internal reference ratio heatmap for all CPTAC samples (8,028 proteins without missing values) including passed and failed proteomic quality control (QC) samples. d, Global tumor/reference proteome ratio distributions for samples that passed and failed proteomic quality control analysis. e, Degradation-related gene sets were enriched in tumors that failed proteomic quality control analysis. f, Variant allele frequency (VAF) analysis of re-sequenced CPTAC tumors and comparison to original TCGA data. Overall VAFs for failed QC samples were lower compared to passed samples suggesting lower purity.
Extended Data Figure 3. Tumor sample quality control (II).
a, There was high concordance (94.6%) between DNA variants reported by TCGA and CPTAC re-sequenced tumors. Most point mutations reported by TCGA could be identified across the 8 re-sequenced samples used in the study. b, A high overall correlation (mean=0.77) was observed for the CPTAC Variant Allele Fraction (VAF) (X-axis) and TCGA VAF (Y-axis) across the 8 samples used in the study. c, Agglomerative hierarchical clustering (Supplementary Methods Section 3.8) used to co-cluster protein and RNA tumor expression data after filtering to retain 4,291 proteins and genes with moderate to high protein-RNA correlation (Pearson correlation > 0.4) with results displayed as a circular dendrogram (fanplot). The proteome (.P) and RNA (.R) components of each sample are labeled using the same color. The outer ring shows proteome samples in light grey and RNA samples in dark grey. High concordance between RNA and protein expression is evident from the color adjacency in the inner ring and alternating color in the outer ring showing that RNA and protein components co-cluster for a large proportion of samples (62/80). d, Co-clustering of MS and RPPA tumor data. 126 RPPA readouts were mapped to gene names. These genes were intersected with the genes observed in the MS proteome, filtered to 48 proteins with moderate or higher RPPA-MS protein correlation, and analyzed for co-clustering as in c. 47 of 80 RPPA-MS protein pairs co-cluster. While this is a smaller proportion than for RNA-protein analysis, the number of genes used in the clustering is significantly smaller for RPPA (48 vs. 4,291 for RNA). e, ESTIMATE tumor purity comparison between mRNA, RNAseq, and proteome data. ANOVA is used to assess the difference in distribution (−log10(p-value)) of ESTIMATE, stromal, immune, and tumor purity scores across mRNA (microarray), RNA-seq and proteome data. The only significant p-value (=0.02) is for the Cluster 3 stromal score, and higher stromal scores for the proteome drive that difference. f, Ischemia score analysis. Comparison of ischemia scores of 77 CPTAC tumors, 3 normal samples, and patient-derived xenografts. CPTAC tumors had generally lower ischemia scores than PDX samples subjected to 30 minutes of cold ischemia. Median ischemia scores are less than 30 minutes for each subtype and no significant differences were observed across subtypes. Effects due to cold ischemia therefore appear to be negligible in this CPTAC sample collection.
Extended Data Figure 4. Protein-to-Protein, -CNA, and -mRNA correlation analyses.
a, Identification of UBE3A as an E3 ubiquitin ligase that negatively correlates to p53 on the protein level. Pearson correlation and Benjamini-Hochberg corrected p-value are shown. b, Analysis of counter-regulated genes with negative correlation of CNA-to-RNA as well as CNA-to-protein levels. Negative Pearson correlations are shown with Benjamini-Hochberg corrected p-values for CNA-to-protein correlations. Depicted genes have significant negative correlations at FDR<0.05 in the CNA-to-RNA and CNA-to-protein analyses. c, Global mRNA-to-protein correlation and gene set enrichment analysis.
Extended Data Figure 5. Global CNA effects and comparison of CNA TRANS effects to knockdown signatures in the LINCS database.
a, CNA landscape in the CPTAC tumor collection. The segment-based CNAs of 77 samples were downloaded from TCGA Firehose, including 18 Basal, 12 Her2, 23 Luminal A and 24 Luminal B subtypes. Copy number amplifications were marked in red and deletions in blue. The bottom color key represents the log2 transformed copy number value, with CNA=2 centered at 0. Specific CNA events are seen for chromosome 5q and 10p regions in basal-like tumors. b, Correlations of copy number alterations (x-axis) to phosphoprotein levels (y-axis) highlight new CNA cis and trans effects. Significant (FDR<0.05) positive (red) and negative (green) correlations between CNA and phosphoproteins are indicated. Histograms show the fraction [%] of significant CNA trans effects for each CNA gene. c, LINCS CMap analysis facilitates identification of novel functional candidates for CNA trans effects. Knockdown profiles were compared with CNA/protein trans effects for 502 genes. Genes with a connectivity score >|90| were considered connected and significant cis effects were annotated at an FDR<0.05. d, Basal-like tumor-specific CNAs are candidate regulatory events for EGFR and SRC expression levels. Oncogenic kinases with significant CNA/protein trans effects (left panel), that were regulated in LINCS shRNA experiments (right panel; 4 cell lines,) and directly measured as LINCS landmark genes, are shown alongside candidate regulatory genes CETN3 and SKP1. Clinical ER, PR, and HER2 annotation and PAM50 classification are shown in the header rows of each column.
Extended Data Figure 6. Proteome cluster heatmap and stability analysis.
a, K-means consensus clustering of proteome and phosphoproteome data identifies three subgroups: basal-enriched, luminal-enriched, and stromal-enriched. The heatmap represents all 1,521 proteins used for clustering (Dataset G8). b, Identification of optimal proteome clusters for QC-passed CPTAC breast cancer tumors. Proteome clusters were derived using consensus clustering based on 1000 resampled datasets, exploring the range of 2 to 6 k-means clusters. Visualization of consensus matrices from k-means consensus clustering for k=3, 4, 5 and 6 target clusters. Consensus clustering was performed on 1,521 proteins with no missing values and SD>1.5. c, Silhouette plots were generated to evaluate the coherence of the clustering. Silhouette plots for k=3 and k=4 clusters showing a cleaner separation of clusters for k=3. d, Based on both visual inspection of the consensus matrix and the delta plot assessing change in consensus cumulative distribution function (CDF) area, three robustly segregated groups were observed. Consensus cumulative distribution function (CDF) and delta area (change in CDF area) plots for 2–6 clusters.
Extended Data Figure 7. Proteome cluster markers and enriched pathways.
a, Markers (based on SAM analysis; FDR<0.01) discriminate between proteome clusters 1, 2 and 3 (compare to heatmap of proteins used to derive clusters depicted in Extended Data Fig. 6a). b, Applying a Fisher exact test-based enrichment analysis to the proteome, phosphoproteome and mRNA data, gene sets from MSigDB were identified that were unique for each proteome cluster. Heat map showing specific pathways comprising dominant biological themes that are significantly differential by enrichment analysis between basal-enriched and luminal-enriched tumors (Fisher Exact Test Benjamini-Hochberg corrected p-values are shown; enrichment test performed on marker sets identified using SAM analysis; see Methods; compare to Figure 3c). c, Heatmap showing a selection of gene sets significant in basal-enriched or luminal-enriched tumors exclusively by mRNA, protein or phosphoprotein expression. Cytokine signatures, for example, were strongly captured at the mRNA level, but were seen to only a limited degree at the global protein level, likely because of their typically low protein abundance. By contrast, the vast majority of significant gene sets annotated as "signaling" were enriched only at the phosphoprotein level. d, Global heat map representing all gene sets significantly enriched in at least one of the proteomic breast cancer subtypes. The stromal-enriched group was characterized by breast cancer normal-like, adipocyte differentiation, smooth muscle, toll-like receptor signaling and endothelin gene sets, supporting the clustering-based annotation of high stromal and/or adipose content in these tumors (see Supplemental Table 13).
Extended Data Figure 8. Phosphoproteome pathway clustering, kinase-phosphosite multivariate regression, and protein co-expression networks.
a, Phosphoproteome pathway clustering. Using phosphorylation state as a proxy for activity, deep phosphoproteome profiling allows development of a breast cancer molecular taxonomy based on signaling pathways. K-means consensus clustering was performed on pathways derived from single sample GSEA analysis of phosphopeptide data (908 pathways shown). Of four robustly segregated groups, subgroups 2 and 3 substantially recapitulated the stromal- and luminal-enriched proteomic subgroups, respectively. Subgroup 4 included a significant majority of tumors from the basal-enriched proteomic subgroup, but was admixed particularly with luminal-enriched samples. This subgroup was defined by high levels of cell cycle and checkpoint activity. All basal and a majority of non-basal samples in this subgroup had TP53 mutations. Subgroup 1 was a novel subgroup defined exclusively in the phosphopeptide / pathway activity domain, with no enrichment for either proteomic or PAM50 subtypes. It was defined by G-protein, G-protein coupled receptor, and inositol phosphate metabolism signatures, as well as ionotropic glutamate signaling. b, Analysis of the regulatory relationship between outlier kinases (see Supplementary Table 19) and phosphopeptides by regulatory multivariate regression analysis (see Methods) identified CDK1 as the most highly connected of the outlier Cyclin-Dependent Kinases, with highest centrality (based on node-degree; see Methods) among the outlier CDKs and seventh highest centrality among all the outlier kinases considered in the remMap analysis. Each line represents a phosphosite-kinase relationship. c–f, Analysis of differences in the co-expression patterns among genes/proteins across different subgroups. A Joint Random Forest (JRF) method was applied to simultaneously build gene co-expression and protein co-expression networks (Supplementary Table 17, and Methods). Modules in these networks revealed different interaction patterns between basal-enriched and luminal-enriched subgroups. c, Network module P1 of the protein co-expression network, defined chiefly in the proteome space. This module contained 12 genes connected by 39 edges, among which 34 were protein-specific and 5 were shared by both the protein and mRNA co-expression networks. Many edges were supported by published information and were contained in the STRING database. Edges in red are specific to the protein co-expression network; edges in green are shared by both protein and gene co-expression networks; edges indicated by double lines are contained in the STRING database with confidence score greater than 0.15. MMP9, one of the central proteins in this module, contributes to metastatic progression and is a potential target for anti-metastatic therapies for basal-like / triple negative breast cancer. d, Heatmaps of the absolute correlation across each pair of genes in module P1 (shown in Panel c), based on either protein or gene expression data for samples in the basal-enriched and luminal-enriched subgroups, respectively. The MMP9 protein was strongly co-expressed with the other members of the module only in the basal-enriched subgroup. Notably, this observation is dependent on protein data; the correlation at the mRNA level for this module was consistently low in both the basal-enriched and luminal enriched subgroups indicating that these events coherently occur at the proteomic level. e, Co-expression network based on proteomics data. The network contains 693 proteomic network-specific edges (grey) and 792 edges shared with the RNAseq network (green). For each module, the most enriched category and corresponding Benjamini-Hochberg adjusted p-value is reported. Pie charts adjacent to each module show the proportion of proteomics-specific edges (grey area) and edges shared between proteomics and RNAseq data (green area). f, RNAseq network.
Extended Data Figure 9. Phosphoproteome signatures of PIK3CA (a,b) and TP53 (c,d) mutated tumors highlight activated key regulators and indicate frequency of activation.
a and c, Phosphosites upregulated in mutated tumors (SAM FDR<0.05 across all tumors and independently also across luminal tumors; average phosphosite signal for all markers shown as bar graph). To avoid confounding by intrinsic subtype-specific distinctions, only markers that were significantly identified both in analyses covering all tumors and analyses restricted to luminal tumors were selected (FDR <0.05). Color bars in the margins indicate FDRs for grouped analysis of different mutation classes and indicate kinase substrates of known kinases in the respective pathways. Significantly regulated kinase phosphosites are annotated. The average phosphorylation signal of the marker phosphosites provides a read-out for PI3K and TP53 pathway activity in mutated tumors (histogram below heatmap). A 95% prediction confidence interval (indicated by dashed lines) across the average signal in non-mutated tumors was chosen in order to discriminate active from non-active tumors. The most strongly activated PIK3CA kinase domain mutant tumor differed from the other 9 kinase domain mutant tumors, as it contained an amino acid side chain charge neutral H1047L instead of the more common positively charged H1047R mutation. Among the 62 phosphosites identified that were significantly upregulated in PIK3CA mutated tumors, 13 phosphosites were found on phosphoproteins that are known substrates of well-annotated kinases in the PIK3CA pathway (panel a, right column). In the mutant TP53 analysis a total 20 phosphosites were found on phosphoproteins that are known substrates of well annotated kinases in the p53 pathway (panel c, right column). b and d, Upregulated phosphosite sets were derived from isogenic PIK3CA and TP53 mutant versus wild-type cell line pairs and tested for enrichment within mutant versus wild-type CPTAC tumors using single sample GSEA. Significantly enriched phosphosite sets are shown (p<0.05).
Extended Data Figure 10. PIRCOS plots, kinase outliers and outliers in the ERBB2 pathway.
a, Pircos (Proteogenomics CIRCOS) plots for 8q and 17q showing median CNA, RNA, protein, and phosphosite expression for 20 tumors with amplification in 8q based on RIPK2 CNA>1; 23 tumors with amplification in 8q based on PTK2 CNA>1; 15 tumors with amplification in 17q based on CDK12 CNA >1; and 10 tumors with amplification in 17q based on TLK2 CNA>1. Red indicates expression >1, blue < −1, and grey between −1 and 1. Genes with both copy number amplification (CNA>1) and increased phosphosite expression (p-site>1) are labeled. b, Phosphosite outliers in known ERBB2 signaling genes. To better understand the downstream effects of ERBB2 amplification, phosphosite outliers in known ERBB2 signaling genes (MSigDB pathway set, KEGG_ERBB_SIGNALING PATHWAY) were identified for the 15 samples that had ERBB2 phosphosite outlier status. Forty-one genes were identified as having a phosphosite outlier in at least one of the ERBB2 amplified samples. PAK4 and ARAF phosphosite outlier status were found in seven of the 15 ERBB2 kinase outlier samples; GSK3B outliers were found in 6 samples; and EIF4EBP1, MAP2K2, ABL1 and AKT1 outlier status was found in 5 of the 15 samples. c, Proteogenomic outlier expression analysis for TLK2 and RIPK2. Samples with outlier phosphosite (red), protein (yellow), RNA (green) and copy number (purple) expression are shown. Phosphosite squares indicate per-sample outlier phosphosites.
Supplementary Material
Acknowledgments
This work was supported by National Cancer Institute (NCI) CPTAC awards U24CA160034 (Broad Institute; Fred Hutchinson Cancer Research Center), U24CA160036 (Johns Hopkins University), U24CA160019 (Pacific Northwest National Laboratory), U24CA159988 (Vanderbilt University), U24CA160035 (Washington University, St. Louis; University of North Carolina, Chapel Hill). PW and FP were also supported by SUB-R01GM108711 and MJE by CPRIT grant RR140033. MJE is also a McNair Foundation Scholar. DF was supported by Leidos contract 13XS068. Primary genomics data for this study were generated by The Cancer Genome Atlas pilot project established by the NCI and the National Human Genome Research Institute. Resequencing of select samples conducted in this study was supported by National Cancer Institute (NCI) CPTAC award U24CA160035. Information about TCGA and the investigators and institutions who constitute the TCGA research network can be found at http://cancergenome.nih.gov/. We also acknowledge the expert assistance of Jacqueline Snider, Petra Erdmann-Gilmore and Rose Connors for the preparation of the tumor tissues for solubilization. We thank the Alvin J. Siteman Cancer Center at Washington University School of Medicine and Barnes-Jewish Hospital in St. Louis, Mo., for the use of the Tissue Procurement Core, which provided accessioning, histologic processing and review for the TCGA samples included in this study. The Siteman Cancer Center is supported in part by an NCI Cancer Center Support Grant #P30 CA91842. - See more at: http://www.siteman.wustl.edu/ContentPage.aspx?id=243#sthash.mEU0QuXx.dpuf
We also thank the HAMLET Core at The Washington University in St. Louis for providing breast cancer xenograft tumors. The HAMLET Core was supported in part by grants from NIH/NCRR Washington University-ICTS (UL1 RR024992) and Susan G. Komen for the Cure (KG 090422). FM was also supported by The Swedish Research Council (Dnr 2014-323). We also thank Aravind Subramanian, Corey Flynn and Jacob Asiedu at the Broad Institute for their guidance and assistance in accessing LINCS to run a large number of enrichment queries.
Footnotes
Supplementary Information is available in the online version of the paper.
Author Contributions P.M., D.R.M., M.A.G., K.R.C., and S.A.C. designed the proteomic analysis experiments, data analysis workflow, and proteomic-genomic data comparisons. P.M., M.A.G., J.W.Q., and S.A.C. directed and performed proteomic analysis of breast tumor and quality control samples. P.M., D.R.M., K.V.R., K.R.C., P.W., X.W., S.C., E.K., F.P., Z.T., J.L., M.L.G., M.W., V.Y., K.H., C.L., M.D.M., P.Y., J.W., B.Z., and D.F. performed proteomic-genomic data analyses. D.R.M., P.W., and S.J.S. provided statistical support. D.R.M., K.V.R., K.R.C., K.K. and D.F. performed analyses of mass spectrometry data and adapted algorithms and software for data analysis. S.R.D., R.R.T and M.J.E. developed and prepared breast xenografts used as quality control samples. P.M. and F.M prepared and analyzed cell lines for correlative functional annotation of frequently mutated genes. P.M., D.R.M., M.A.G., and S.A.C designed strategy for quality control analyses. M.A.G., S.R.D., C.R.K., M.M., and H.R. coordinated acquisition, distribution and quality control evaluation of TCGA tumor samples. P.M., M.A.G., C.P., L.D., A.G.P., and M.J.E. interpreted data in the context of breast cancer biology. P.M., D.R.M, M.A.G., K.R.C., P.W., A.G.P, M.J.E. and S.A.C. wrote the manuscript.
All primary mass spectrometry data are deposited at the CPTAC Data Portal as raw and mzML files and complete protein assembly data sets for public access (https://cptac-data-portal.georgetown.edu/cptac/s/S029). In addition, a set of ancillary files such as dataset G1/P1, G3/P3, G4/P4, G5/P5, G7/P7, CNA correlation tables for CNA-mRNA, CNA-proteome and CNA-phosphoproteome; CNA data, RNA-seq expression data have also been deposited at the DCC. Two browsers have been created to assist the interested reader in exploring the results. One provides track hubs for viewing the identified peptides in the UCSD genome browser (http://fenyolab.org/cptac_breast_ucsc). The second is an on-line tool for proteogenomic data exploration and can be accessed at http://prot-shiny-vm.broadinstitute.org:3838/BC2016/. See Supplemental Methods for descriptions.
The authors declare no competing financial interests.
References
- 1.Cancer Genome Atlas Network. Comprehensive molecular portraits of human breast tumours. Nature. 2012;490:61–70. doi: 10.1038/nature11412. [DOI] [PMC free article] [PubMed] [Google Scholar]
- 2.Curtis C, et al. The genomic and transcriptomic architecture of 2,000 breast tumours reveals novel subgroups. Nature. 2012;486:346–352. doi: 10.1038/nature10983. [DOI] [PMC free article] [PubMed] [Google Scholar]
- 3.van 't Veer LJ, et al. Gene expression profiling predicts clinical outcome of breast cancer. Nature. 2002;415:530–536. doi: 10.1038/415530a. [DOI] [PubMed] [Google Scholar]
- 4.Chin K, et al. Genomic and transcriptional aberrations linked to breast cancer pathophysiologies. Cancer cell. 2006;10:529–541. doi: 10.1016/j.ccr.2006.10.009. [DOI] [PubMed] [Google Scholar]
- 5.Ellis MJ, et al. Connecting genomic alterations to cancer biology with proteomics: the NCI Clinical Proteomic Tumor Analysis Consortium. Cancer discovery. 2013;3:1108–1112. doi: 10.1158/2159-8290.CD-13-0219. [DOI] [PMC free article] [PubMed] [Google Scholar]
- 6.Zhang B, et al. Proteogenomic characterization of human colon and rectal cancer. Nature. 2014;513:382–387. doi: 10.1038/nature13438. [DOI] [PMC free article] [PubMed] [Google Scholar]
- 7.Perou CM, et al. Molecular portraits of human breast tumours. Nature. 2000;406:747–752. doi: 10.1038/35021093. [DOI] [PubMed] [Google Scholar]
- 8.Sorlie T, et al. Repeated observation of breast tumor subtypes in independent gene expression data sets. Proceedings of the National Academy of Sciences of the United States of America. 2003;100:8418–8423. doi: 10.1073/pnas.0932692100. [DOI] [PMC free article] [PubMed] [Google Scholar]
- 9.Parker JS, et al. Supervised risk predictor of breast cancer based on intrinsic subtypes. Journal of clinical oncology : official journal of the American Society of Clinical Oncology. 2009;27:1160–1167. doi: 10.1200/JCO.2008.18.1370. [DOI] [PMC free article] [PubMed] [Google Scholar]
- 10.Li S, et al. Endocrine-therapy-resistant ESR1 variants revealed by genomic characterization of breast-cancer-derived xenografts. Cell reports. 2013;4:1116–1130. doi: 10.1016/j.celrep.2013.08.022. [DOI] [PMC free article] [PubMed] [Google Scholar]
- 11.Polyak K. Heterogeneity in breast cancer. The Journal of clinical investigation. 2011;121:3786–3788. doi: 10.1172/JCI60534. [DOI] [PMC free article] [PubMed] [Google Scholar]
- 12.Bertos NR, Park M. Breast cancer - one term, many entities? The Journal of clinical investigation. 2011;121:3789–3796. doi: 10.1172/JCI57100. [DOI] [PMC free article] [PubMed] [Google Scholar]
- 13.Symmans WF, Liu J, Knowles DM, Inghirami G. Breast cancer heterogeneity: evaluation of clonality in primary and metastatic lesions. Human pathology. 1995;26:210–216. doi: 10.1016/0046-8177(95)90039-x. [DOI] [PubMed] [Google Scholar]
- 14.Yoshihara K, et al. Inferring tumour purity and stromal and immune cell admixture from expression data. Nature communications. 2013;4:2612. doi: 10.1038/ncomms3612. [DOI] [PMC free article] [PubMed] [Google Scholar]
- 15.Mertins P, et al. Ischemia in tumors induces early and sustained phosphorylation changes in stress kinase pathways but does not affect global protein levels. Molecular & cellular proteomics : MCP. 2014;13:1690–1704. doi: 10.1074/mcp.M113.036392. [DOI] [PMC free article] [PubMed] [Google Scholar]
- 16.Ruggles KV, et al. An analysis of the sensitivity of proteogenomic mapping of somatic mutations and novel splicing events in cancer. Molecular & cellular proteomics : MCP. 2015 doi: 10.1074/mcp.M115.056226. [DOI] [PMC free article] [PubMed] [Google Scholar]
- 17.Scheffner M, Huibregtse JM, Vierstra RD, Howley PM. The HPV-16 E6 and E6-AP complex functions as a ubiquitin-protein ligase in the ubiquitination of p53. Cell. 1993;75:495–505. doi: 10.1016/0092-8674(93)90384-3. [DOI] [PubMed] [Google Scholar]
- 18.Subramanian A, et al. Gene set enrichment analysis: a knowledge-based approach for interpreting genome-wide expression profiles. Proceedings of the National Academy of Sciences of the United States of America. 2005;102:15545–15550. doi: 10.1073/pnas.0506580102. [DOI] [PMC free article] [PubMed] [Google Scholar]
- 19.Silva GO, et al. Cross-species DNA copy number analyses identifies multiple 1q21-q23 subtype-specific driver genes for breast cancer. Breast cancer research and treatment. 2015;152:347–356. doi: 10.1007/s10549-015-3476-2. [DOI] [PMC free article] [PubMed] [Google Scholar]
- 20.Lamb J, et al. The Connectivity Map: using gene-expression signatures to connect small molecules, genes, and disease. Science. 2006;313:1929–1935. doi: 10.1126/science.1132939. [DOI] [PubMed] [Google Scholar]
- 21.Peck D, et al. A method for high-throughput gene expression signature analysis. Genome biology. 2006;7:R61. doi: 10.1186/gb-2006-7-7-r61. [DOI] [PMC free article] [PubMed] [Google Scholar]
- 22.Duan Q, et al. LINCS Canvas Browser: interactive web app to query, browse and interrogate LINCS L1000 gene expression signatures. Nucleic acids research. 2014;42:W449–W460. doi: 10.1093/nar/gku476. [DOI] [PMC free article] [PubMed] [Google Scholar]
- 23.Nakayama KI, Nakayama K. Ubiquitin ligases: cell-cycle control and cancer. Nature reviews. Cancer. 2006;6:369–381. doi: 10.1038/nrc1881. [DOI] [PubMed] [Google Scholar]
- 24.Hein MY, et al. A Human Interactome in Three Quantitative Dimensions Organized by Stoichiometries and Abundances. Cell. 2015;163:712–723. doi: 10.1016/j.cell.2015.09.053. [DOI] [PubMed] [Google Scholar]
- 25.Petralia F, Song WM, Tu Z, Wang P. New Method for Joint Network Analysis Reveals Common and Different Coexpression Patterns among Genes and Proteins in Breast Cancer. Journal of proteome research. 2016 doi: 10.1021/acs.jproteome.5b00925. [DOI] [PMC free article] [PubMed] [Google Scholar]
- 26.Loi S, et al. PIK3CA mutations associated with gene signature of low mTORC1 signaling and better outcomes in estrogen receptor-positive breast cancer. Proceedings of the National Academy of Sciences of the United States of America. 2010;107:10208–10213. doi: 10.1073/pnas.0907011107. [DOI] [PMC free article] [PubMed] [Google Scholar]
- 27.Vasudevan KM, et al. AKT-independent signaling downstream of oncogenic PIK3CA mutations in human cancer. Cancer cell. 2009;16:21–32. doi: 10.1016/j.ccr.2009.04.012. [DOI] [PMC free article] [PubMed] [Google Scholar]
- 28.Wu X, et al. Activation of diverse signalling pathways by oncogenic PIK3CA mutations. Nature communications. 2014;5:4961. doi: 10.1038/ncomms5961. [DOI] [PMC free article] [PubMed] [Google Scholar]
- 29.Krzywinski M, et al. Circos: an information aesthetic for comparative genomics. Genome research. 2009;19:1639–1645. doi: 10.1101/gr.092759.109. [DOI] [PMC free article] [PubMed] [Google Scholar]
- 30.Blazek D, et al. The Cyclin K/Cdk12 complex maintains genomic stability via regulation of expression of DNA damage response genes. Genes & development. 2011;25:2158–2172. doi: 10.1101/gad.16962311. [DOI] [PMC free article] [PubMed] [Google Scholar]
- 31.Shrestha Y, et al. PAK1 is a breast cancer oncogene that coordinately activates MAPK and MET signaling. Oncogene. 2012;31:3397–3408. doi: 10.1038/onc.2011.515. [DOI] [PMC free article] [PubMed] [Google Scholar]
- 32.Chen Y, et al. Identification of druggable cancer driver genes amplified across TCGA datasets. PloS one. 2014;9:e98293. doi: 10.1371/journal.pone.0098293. [DOI] [PMC free article] [PubMed] [Google Scholar]
- 33.Prudnikova TY, Rawat SJ, Chernoff J. Molecular pathways: targeting the kinase effectors of RHO-family GTPases. Clinical cancer research : an official journal of the American Association for Cancer Research. 2015;21:24–29. doi: 10.1158/1078-0432.CCR-14-0827. [DOI] [PMC free article] [PubMed] [Google Scholar]
- 34.Jiang W, et al. Differential phosphorylation of DNA-PKcs regulates the interplay between end-processing and end-ligation during nonhomologous end-joining. Molecular cell. 2015;58:172–185. doi: 10.1016/j.molcel.2015.02.024. [DOI] [PMC free article] [PubMed] [Google Scholar]
- 35.Agrawal PB, et al. SPEG interacts with myotubularin, and its deficiency causes centronuclear myopathy with dilated cardiomyopathy. American journal of human genetics. 2014;95:218–226. doi: 10.1016/j.ajhg.2014.07.004. [DOI] [PMC free article] [PubMed] [Google Scholar]
- 36.Borges S, et al. Effective Targeting of Estrogen Receptor-Negative Breast Cancers with the Protein Kinase D Inhibitor CRT0066101. Molecular cancer therapeutics. 2015;14:1306–1316. doi: 10.1158/1535-7163.MCT-14-0945. [DOI] [PMC free article] [PubMed] [Google Scholar]
- 37.Walkinshaw DR, et al. The tumor suppressor kinase LKB1 activates the downstream kinases SIK2 and SIK3 to stimulate nuclear export of class IIa histone deacetylases. The Journal of biological chemistry. 2013;288:9345–9362. doi: 10.1074/jbc.M113.456996. [DOI] [PMC free article] [PubMed] [Google Scholar]
- 38.Jiang X, et al. Numb regulates glioma stem cell fate and growth by altering epidermal growth factor receptor and Skp1-Cullin-F-box ubiquitin ligase activity. Stem cells. 2012;30:1313–1326. doi: 10.1002/stem.1120. [DOI] [PMC free article] [PubMed] [Google Scholar]
- 39.Carey LA, et al. TBCRC 001: randomized phase II study of cetuximab in combination with carboplatin in stage IV triple-negative breast cancer. Journal of clinical oncology : official journal of the American Society of Clinical Oncology. 2012;30:2615–2623. doi: 10.1200/JCO.2010.34.5579. [DOI] [PMC free article] [PubMed] [Google Scholar]
- 40.Ong CC, et al. Small molecule inhibition of group I p21-activated kinases in breast cancer induces apoptosis and potentiates the activity of microtubule stabilizing agents. Breast cancer research : BCR. 2015;17:59. doi: 10.1186/s13058-015-0564-5. [DOI] [PMC free article] [PubMed] [Google Scholar]
- 41.Carr SA, et al. Targeted peptide measurements in biology and medicine: best practices for mass spectrometry-based assay development using a fit-for-purpose approach. Molecular & cellular proteomics : MCP. 2014;13:907–917. doi: 10.1074/mcp.M113.036095. [DOI] [PMC free article] [PubMed] [Google Scholar]
Associated Data
This section collects any data citations, data availability statements, or supplementary materials included in this article.


