Abstract
Spinal cord injury disrupts the communication between the brain and the spinal circuits that orchestrate movement. To bypass the lesion, brain–computer interfaces1–3 have directly linked cortical activity to electrical stimulation of muscles, which have restored grasping abilities after hand paralysis1,4. Theoretically, this strategy could also restore control over leg muscle activity for walking5. However, replicating the complex sequence of individual muscle activation patterns underlying natural and adaptive locomotor movements poses formidable conceptual and technological challenges6,7. Recently, we showed in rats that epidural electrical stimulation of the lumbar spinal cord can reproduce the natural activation of synergistic muscle groups producing locomotion8–10. Here, we interfaced leg motor cortex activity with epidural electrical stimulation protocols to establish a brain–spinal interface that alleviated gait deficits after a spinal cord injury in nonhuman primates. Rhesus monkeys were implanted with an intracortical microelectrode array into the leg area of motor cortex; and a spinal cord stimulation system composed of a spatially selective epidural implant and a pulse generator with real-time triggering capabilities. We designed and implemented wireless control systems that linked online neural decoding of extension and flexion motor states with stimulation protocols promoting these movements. These systems allowed the monkeys to behave freely without any restrictions or constraining tethered electronics. After validation of the brain–spinal interface in intact monkeys, we performed a unilateral corticospinal tract lesion at the thoracic level. As early as six days post-injury and without prior training of the monkeys, the brain–spinal interface restored weight-bearing locomotion of the paralyzed leg on a treadmill and overground. The implantable components integrated in the brain–spinal interface have all been approved for investigational applications in similar human research, suggesting a practical translational pathway for proof-of-concept studies in people with spinal cord injury.
A century of research in spinal cord physiology has demonstrated that the circuits embedded in lumbar segments of mammals can produce coordinated patterns of leg motor activity without brain input11,12. Various neuromodulation approaches have been developed to activate these circuits after injury to reestablish locomotion8,13–17. For example, epidural electrical stimulation (EES) of lumbar segments restored adaptive locomotion in paralyzed rats8. Recent studies showed that EES is also capable of activating lumbar spinal circuits in people with paraplegia14,16.
These empirical observations prompted us to develop an evidenced-based framework to understand the interactions between EES and spinal circuits8–10. We aimed to exploit this knowledge to optimize stimulation protocols for clinical applications. Computational modelling and functional experiments revealed that EES engages spinal circuits through the modulation of proprioceptive feedback circuits10. This framework guided the design of spatiotemporal neuromodulation therapies that not only activate but also control the activity of spinal circuits engaging synergistic muscle groups8–10, enabling robust modulation of locomotor movements in rats whose spinal cords were void of brain input.
However, volitional locomotion requires the brain to control the activity of spinal circuits. Brain–computer interface technologies1–4,18 provide the tools to link the intended motor states to EES protocols19–21 to reestablish voluntary control of locomotion after injury. For these developments, nonhuman primates are more appropriate models than rodents since they exhibit cortical engagement during locomotion similar to humans22, analogous recovery mechanisms from injury23, and comparable technological requirements24. Here, we decoded motor states from leg motor cortex activity to trigger EES protocols facilitating extension and flexion of the corresponding leg. We show that this brain–spinal interface alleviated gait deficits after spinal cord injury in nonhuman primates.
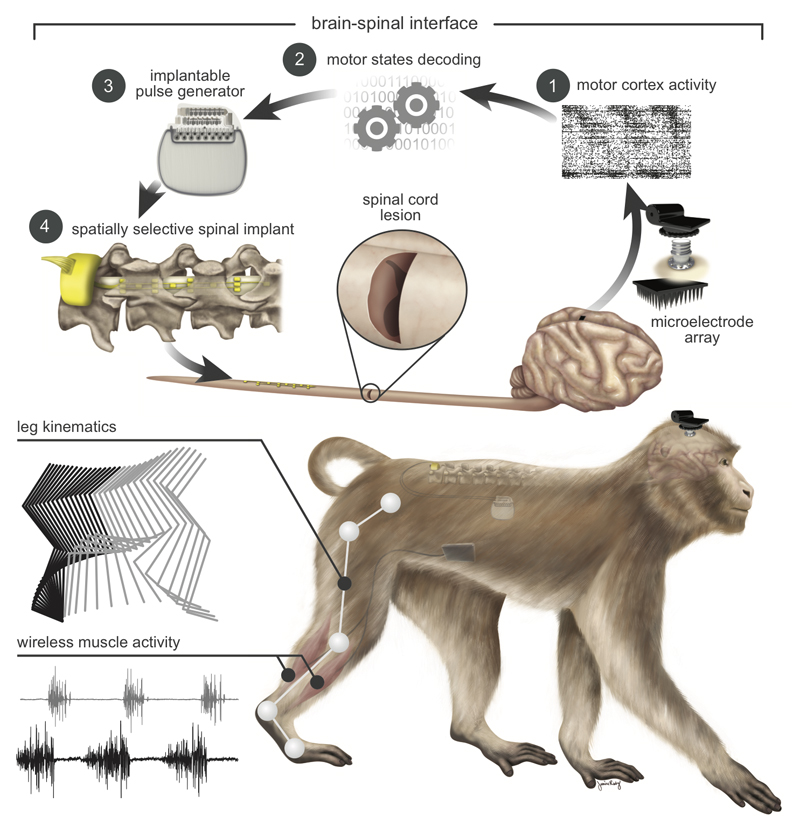
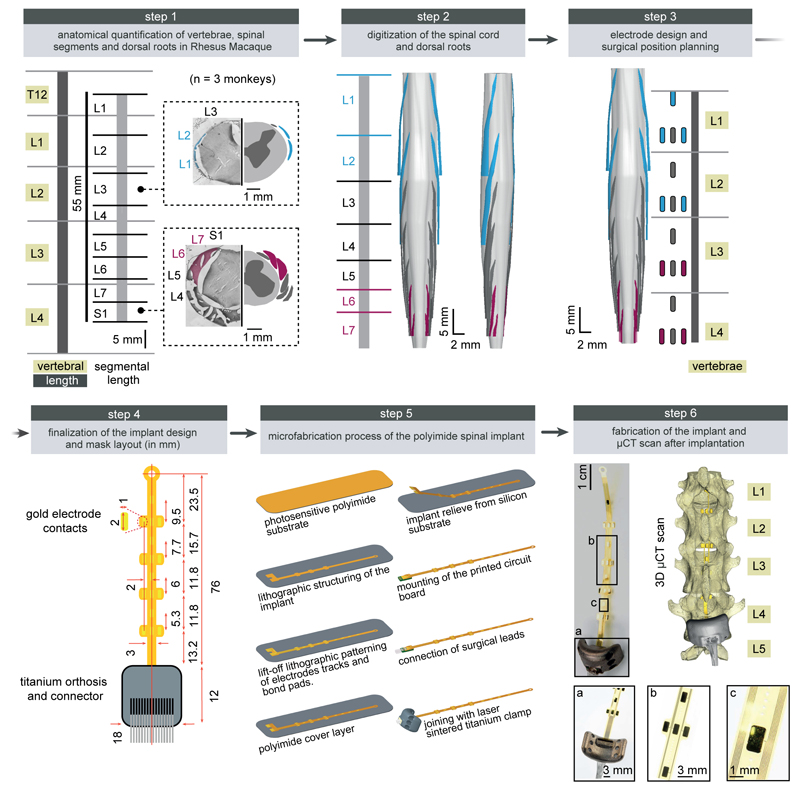
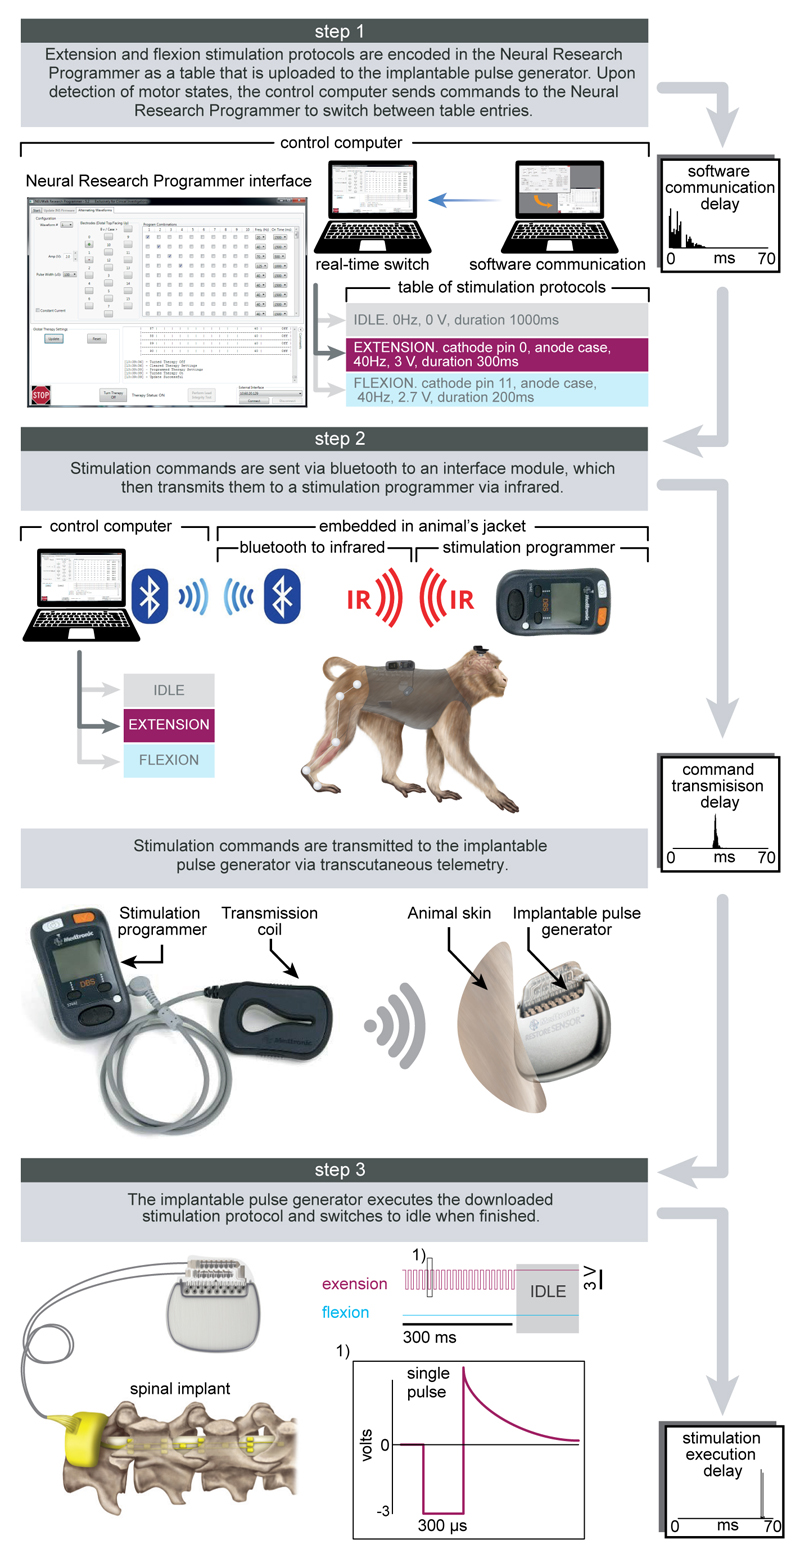
To support the development of the brain–spinal interface, we established a wireless recording and stimulation platform in freely behaving, unconstrained and untethered nonhuman primates (Fig. 1 and Supplementary Video 1). Rhesus monkeys (Supplementary Table 1) were implanted with a microelectrode array into the leg area of the left motor cortex to record spiking activity from neuronal ensembles. Electromyographic signals were monitored using bipolar electrodes implanted into antagonist muscles spanning each joint of the right leg. Wireless modules enabled transmission of neural (20kHz) and electromyographic (2kHz) signals to external receivers25. We simultaneously acquired video recordings (100Hz) to reconstruct whole-body kinematics23. To deliver EES, we used technologies previously developed in rats9, which we adapted to the characteristics of spinal segments and vertebras measured in three monkeys (Extended Data Fig.1). These spinal implants were inserted into the epidural space over lumbar segments, and connected to an implantable pulse generator commonly used for deep brain stimulation therapy. We engineered wireless communication modules that enabled control over the spatial and temporal parameters of EES with a latency of about 100ms (Extended Data Fig.2).
Figure 1. Conceptual and technological design of the brain–spinal interface.
The monkeys were implanted with a microelectrode array into the leg area of the left motor cortex. During recordings, a wireless module transmitted broadband neural signals to a control computer. (1) Raster plot recorded over three successive gait cycles. Each line represents spiking events identified from one electrode, while the horizontal axis indicates time. (2) A decoder running on the control computer identified motor states from these neural signals. (3) These motor states triggered electrical spinal cord stimulation protocols. For this, the monkeys were implanted with a pulse generator featuring real-time triggering capabilities. (4) The stimulator was connected to a spinal implant targeting specific dorsal roots of the lumbar spinal cord. Electromyographic signals of an extensor (grey) and flexor (black) muscles acting at the ankle recorded over three successive gait cycles are shown together with a stick diagram decomposition of leg movements during the stance (grey) and swing (black) phases of gait.
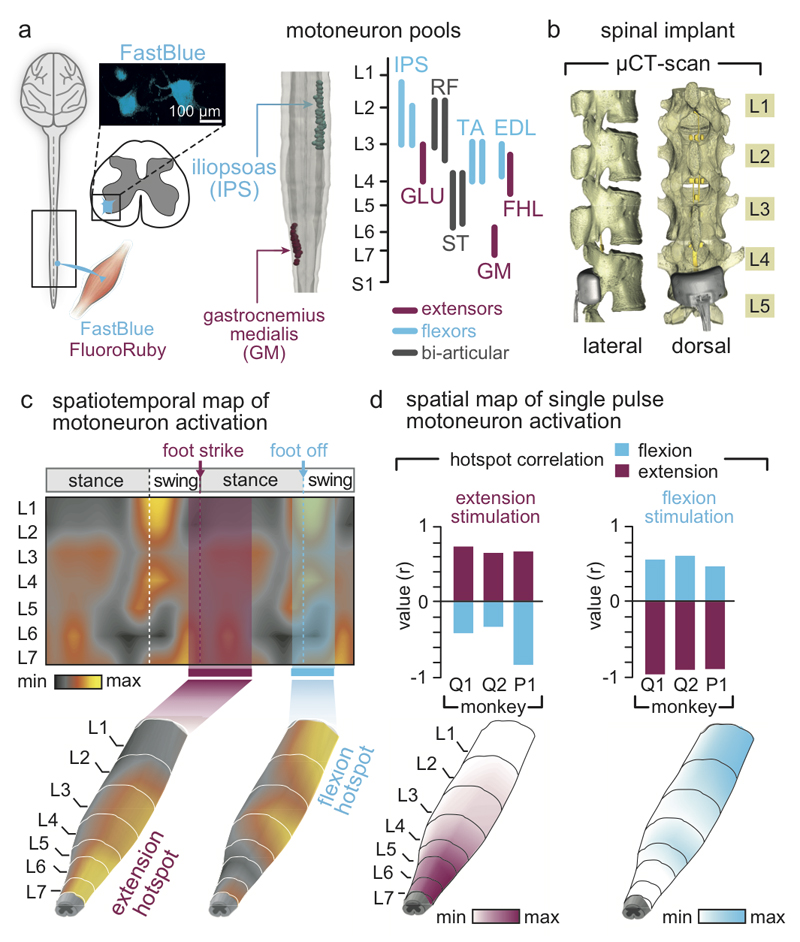
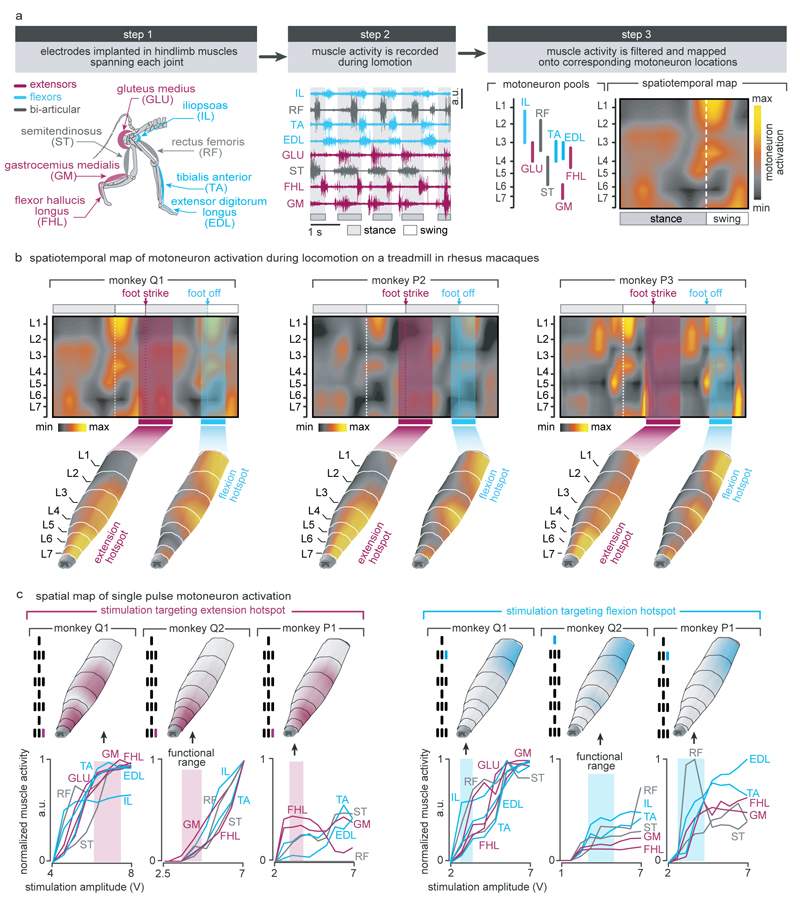
We first used well-established methods9,26 to identify the natural spatiotemporal pattern of motoneuron activation underlying locomotion. Our aim was to reproduce this pattern after injury. We conducted an anatomical tracing to identify the spatial distribution of motoneuron pools innervating antagonist muscles spanning each joint of the leg (Fig. 2a). We then projected the muscle activity recorded during locomotion onto motoneuron locations to visualize the spatiotemporal maps of motoneuron activation (Fig. 2c). These maps showed that locomotion involves the successive activation of well-defined hotspots located in specific regions of the spinal cord that were reproducible across monkeys (Extended Data Fig. 3). The most intense hotspots emerged in the caudal (L6/L7) and rostral (L1/L2) compartments of lumbar segments around the transitions between stance and swing phases. We labelled these hotspots extension and flexion hotspots, respectively.
Figure 2. Development and validation of selective spinal cord stimulation protocols.
(a) Diagram illustrating injections of retrograde anatomical tracers into leg muscles to label motoneurons. The inset shows a confocal photograph of labelled motoneurons. The 3D reconstruction shows each labelled motoneuron innervating iliopsoas (IPS) and gastrocnemius medialis (GM) muscles. The same procedure was applied to the gluteus medius (GLU), rectus femoris (RF), semitendinosus (ST), extensor digitorum longus (EDL), and flexor hallucis longus (FHL) muscles. The diagram reports the averaged (n = 1 to 3 monkeys per muscle) distribution of leg motoneurons within the spinal cord. (b) Representative micro–computed tomography (µCT) scans of the spinal implant (monkey Q1). (c) Electromyography of the recorded leg muscles (monkey Q1) was projected onto the motoneuron locations in the spinal cord to compute the mean (n = 73 gait cycles) spatiotemporal map of motoneuron activation during locomotion. Maps recorded around foot off (-10% to +20% of gait cycle) and foot strike (-10% to +30%) were extracted to highlight extension and flexion hotspots (data from other monkeys in Extended Data Fig. 3). (d) Median (n = 6 pulses) spatial map of motoneuron activation resulting from single pulses of stimulation delivered through the electrodes targeting the extension and flexion hotspots. For each monkey, the bar plots report the correlation between these spatial maps and the maps corresponding to the extension and flexion hotspots.
EES activates motoneurons through the recruitment of large-diameter proprioceptive fibres within the dorsal roots10,27. To access the extension and flexion hotspots, we targeted the dorsal roots projecting to spinal segments containing these hotspots. We reconstructed the spatial trajectory of the dorsal roots innervating each lumbar segment, and integrated this information together with motoneuron distribution into a unified library (Fig. 2a). We utilized the entry points of the dorsal roots as the targeted anatomical landmarks that guided the design and positioning of spinal implants (Fig. 2b and Extended Data Fig. 1). Experiments in three sedated monkeys confirmed that single EES pulses delivered through the electrodes targeting the extension and flexion hotspots led to spinal segment activation that correlated with the activation of these hotspots during locomotion (Fig 2c-d and Extended Data Fig. 3).
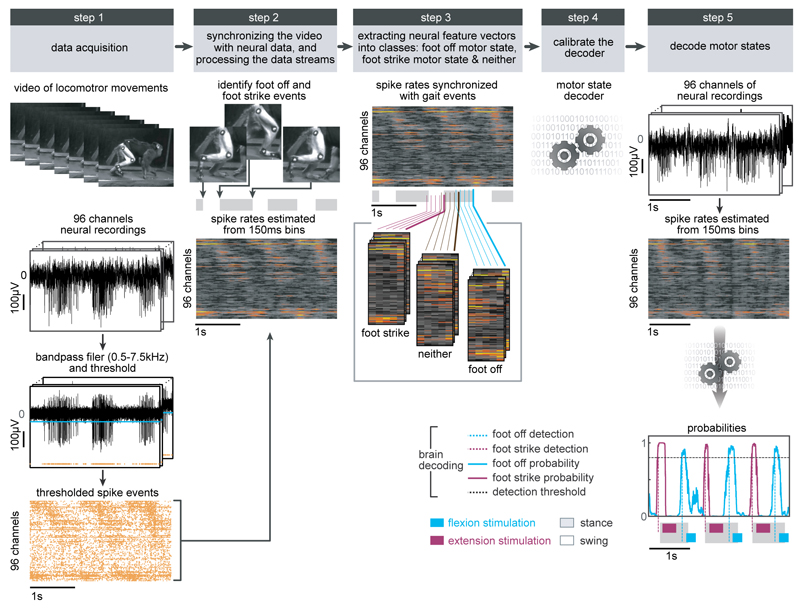
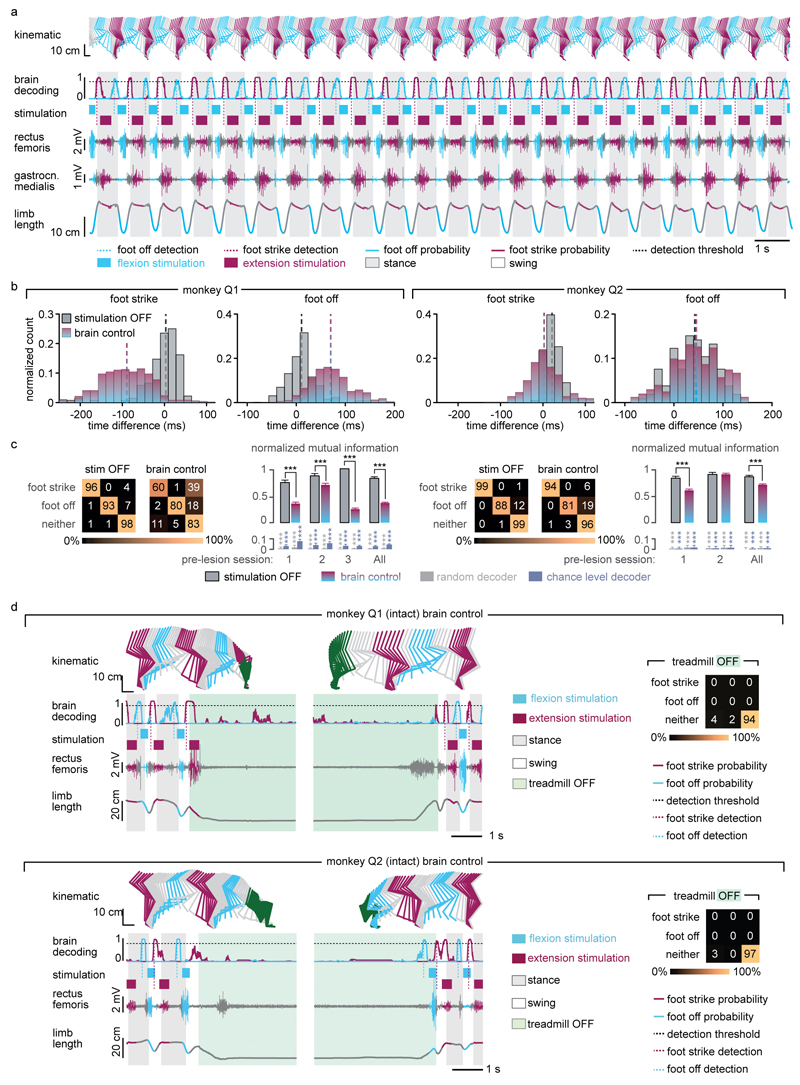
We next exploited cortical signals to decode the temporal structure of extensor and flexor hotspot activation. The spiking activity recorded from the left motor cortex displayed cyclic modulations that were phase-locked with right leg movements (Extended Data Fig. 4a). We developed a decoder that calculated the probability of foot strike and foot off events from this modulation to anticipate the activation of extensor and flexor hotspots associated with right leg movements (Extended Data Fig. 4b). Evaluations in two intact monkeys showed that the decoder accurately predicted these gait events in real-time over extended periods of locomotion, including when initiating and terminating gait, and during rest (Extended Data Fig. 5).
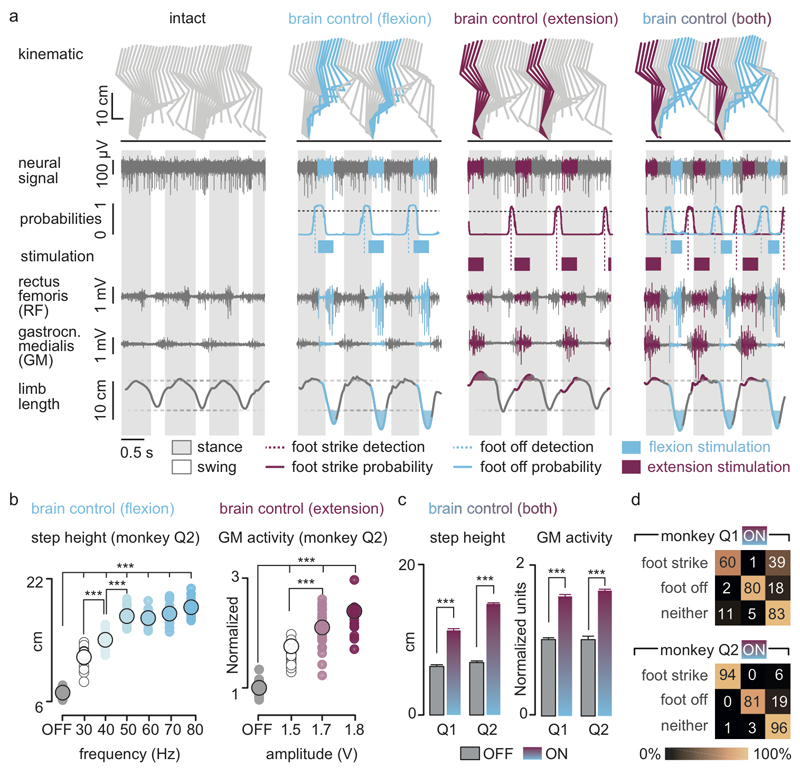
We then exploited our wireless platform to implement a brain–spinal interface — a system wherein the decoded motor states triggered EES protocols targeting the extension and flexion hotspots. We tested the capacity of the brain–spinal interface to modulate the extension and flexion hotspots independently and simultaneously in two intact monkeys during locomotion on a treadmill. We calibrated the decoder with temporal offsets that were tuned to trigger and terminate stimulation protocols concomitantly to the activation of each hotspot (Fig. 3a and Supplementary Methods). We used data without and with stimulation to calibrate the decoders4, which substantially improved decoding accuracy (Extended Data Fig. 5).
Figure 3. Brain-controlled stimulation modulates the extension and flexion of the leg during locomotion in intact monkeys.
(a) Two successive gait cycles recorded during locomotion without stimulation and during brain-controlled stimulation of the flexion hotspot, extension hotspot, or both (monkey Q2). From top to bottom: stick diagram decompositions of right leg movements; example of single channel neural recording; probability of foot off and foot strike motor states; detected motor states (cyan and magenta broken lines), periods of stimulation through the electrodes targeting the flexion and extension hotspots; electromyographic signals; limb length calculated as distance from the hip to the fifth metatarsal joint. The grey and white backgrounds correspond to stance and swing, respectively. (b) Relationship between frequency of brain-controlled flexion stimulation and step height, and between the stimulation amplitude and the activity of the GM muscle during brain-controlled extension stimulation. Values for individual gait cycles (smaller dots) and mean values (larger dots) are shown. (c) Bar plots reporting the mean step height and mean GM activity without stimulation and during brain-controlled stimulation for monkeys Q1 (n = 125 steps) and Q2 (n = 119 steps). (d) Decoder confusion matrices calculated during brain-controlled stimulation for monkeys Q1 (n = 125 steps) and Q2 (n = 119 steps).
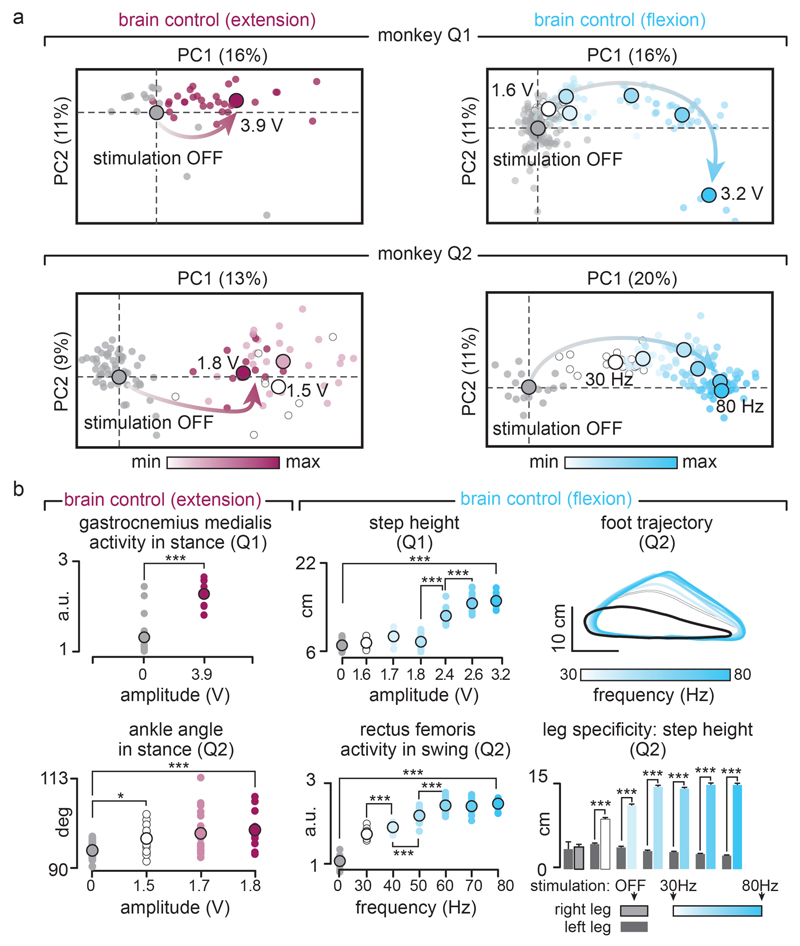
Without prior training of the monkeys, brain-controlled stimulation of the extension and flexion hotspots immediately modulated kinematic and muscle activity parameters related to the extension and flexion of the leg ipsilateral to stimulation (Fig. 3). A gradual increase in the frequency or amplitude of EES pulses led to a monotonic modulation of these parameters (Extended Data Fig. 6). We previously documented similar responses in rodents8–10, suggesting that the mechanisms underlying the modulation of spinal activity with EES are similar across mammals including humans14,16.
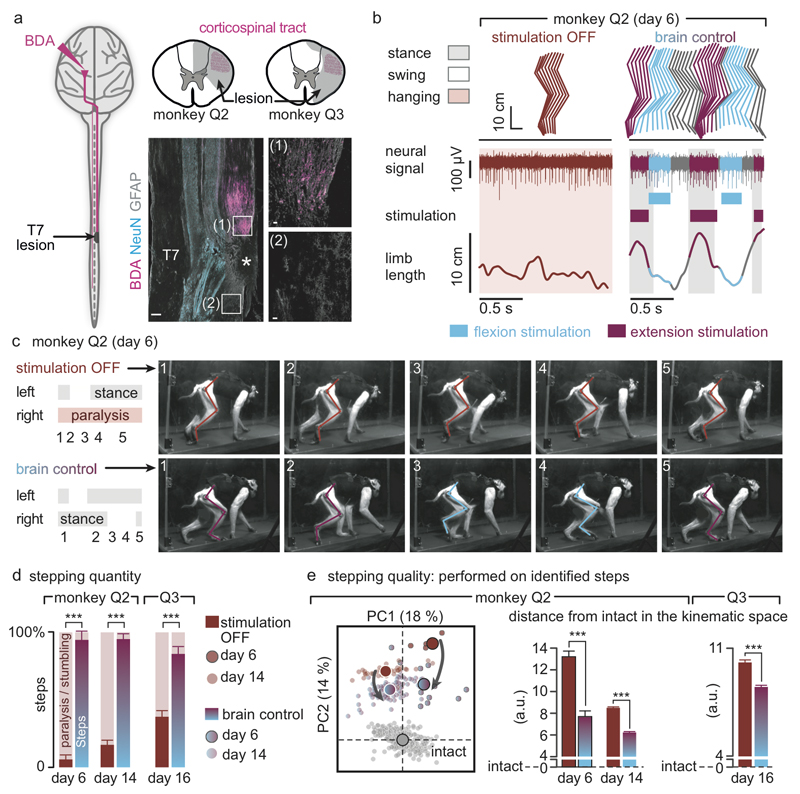
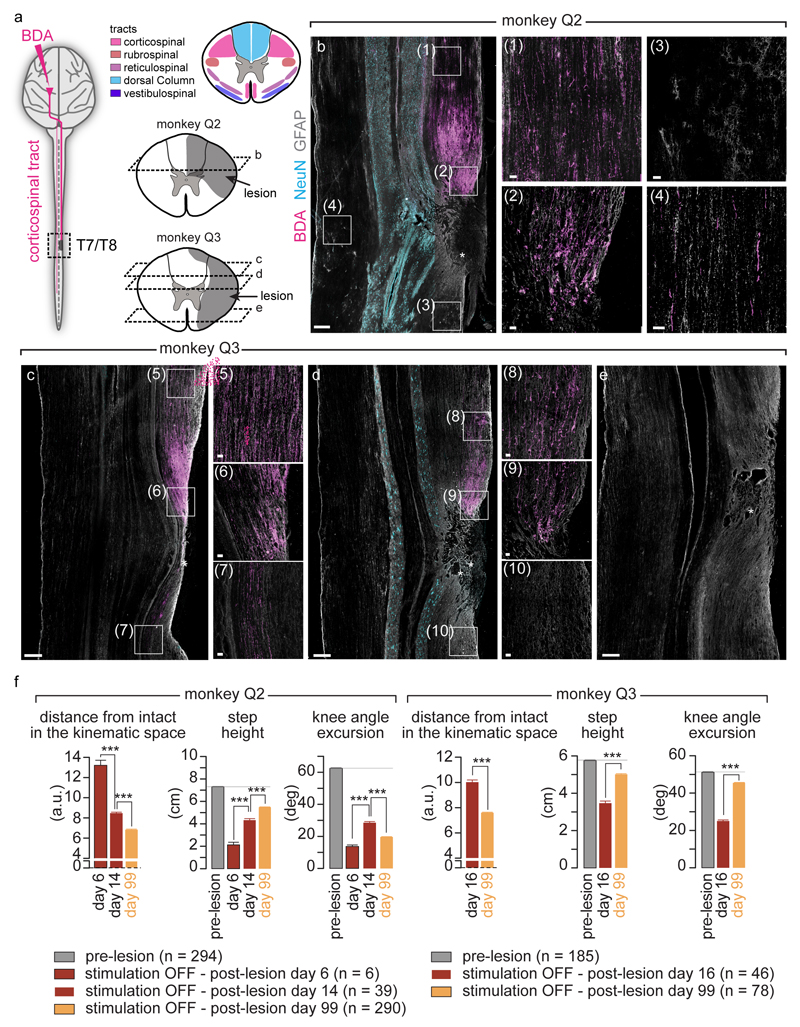
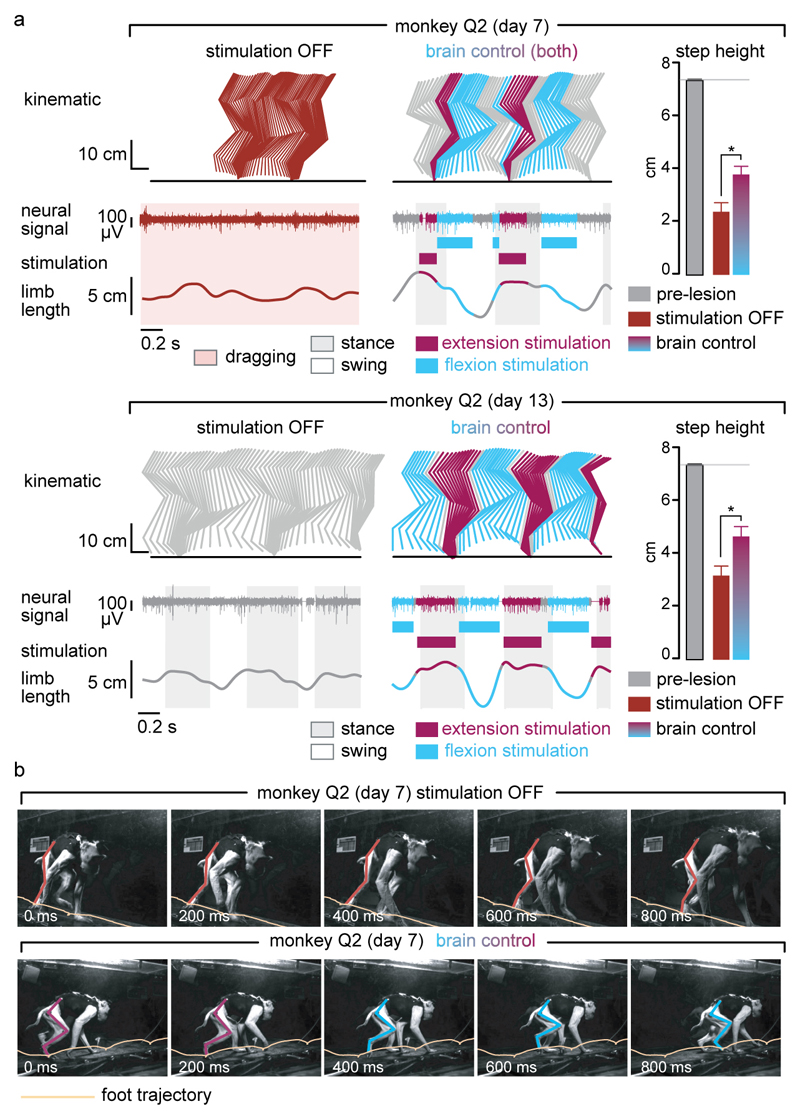
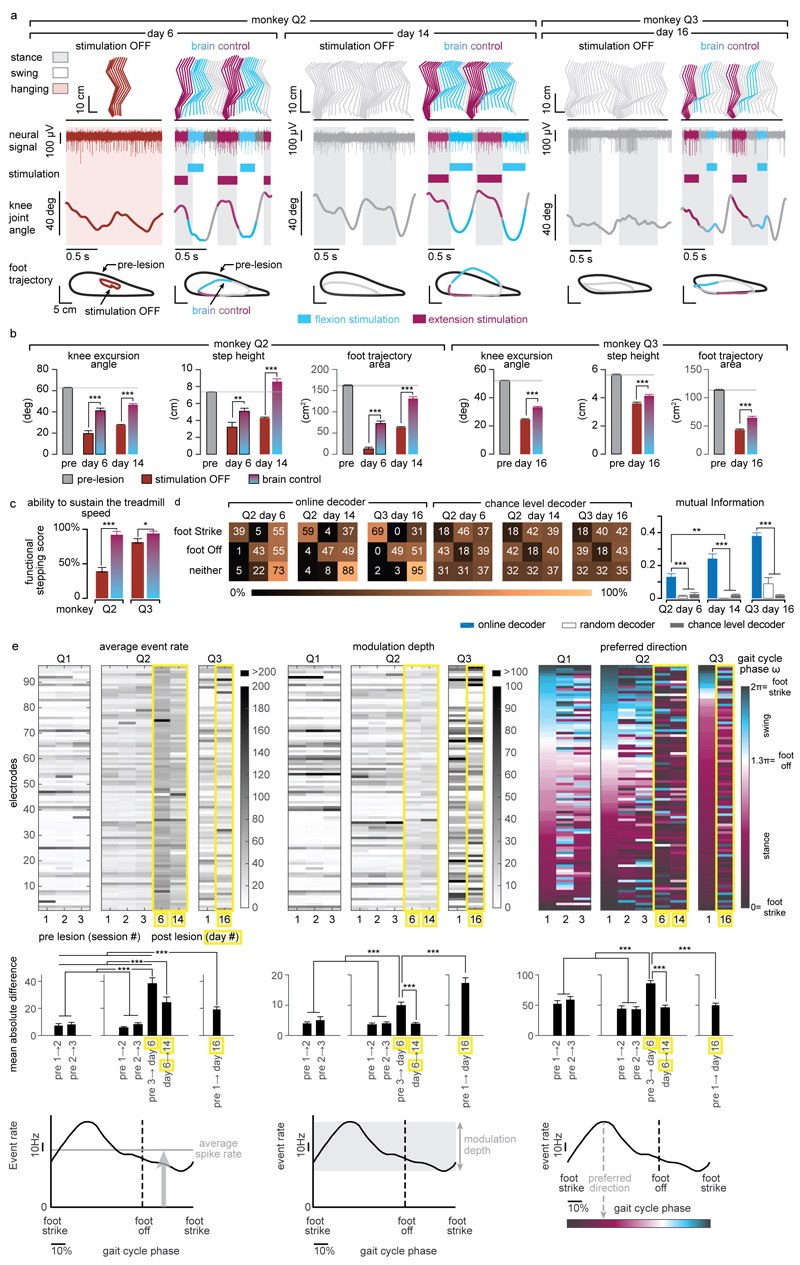
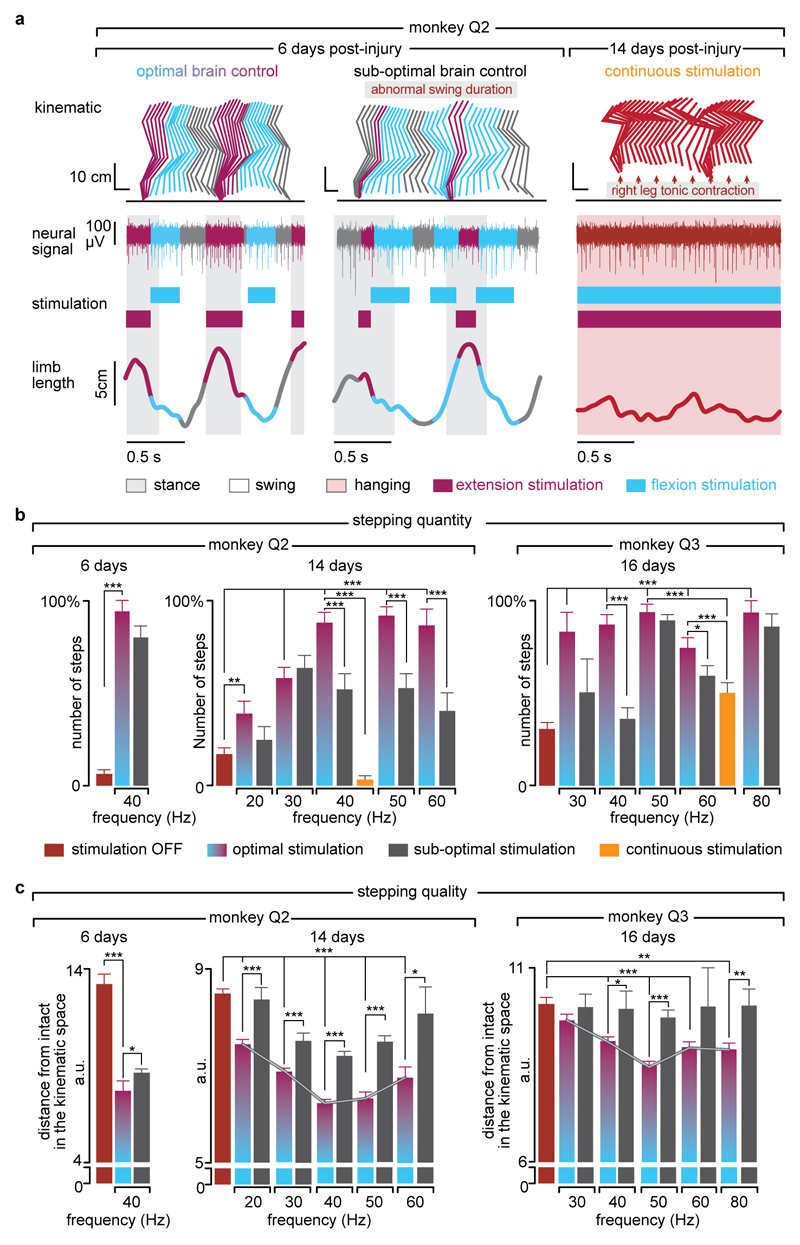
Finally, we tested the ability of the brain–spinal interface to alleviate locomotor deficits after a lesion of the corticospinal tract extending in the right dorsolateral column of mid-thoracic segments in two monkeys (Fig. 4a). Additional pathways were damaged, including the rubrospinal tract, dorsal column and reticulospinal fibres. This lesion initially led to a paralysis of the leg ipsilateral to the lesion, followed by an extensive yet incomplete recovery (Fig. 4b and Extended Data Fig. 7). During the first week after lesion and without training of the monkeys, the brain–spinal interface restored weight-bearing locomotion on a treadmill (Fig. 4b-c) and overground (Extended Data Fig. 8), improving both the quantity and quality of steps performed by the impaired leg (Fig. 4d-e, Extended Data Fig. 9 and Supplementary Video 1). The quantity and quality of steps was directly linked to the temporal structure of the stimulation (Extended Data Fig. 10).
Figure 4. The brain-spinal interface alleviates gait deficits after spinal cord injury.
(a) Diagram illustrating the location of the lesion and corticospinal tract labelling using biotinylated dextran amine (BDA). Right, anatomical reconstructions of spinal segments containing the lesion (grey), for monkeys Q2 and Q3. Photographs including insets, showing a longitudinal view of the lesioned spinal cord wherein astrocytes (GFAP, grey), neurons (NeuN, cyan) and corticospinal tract axons (BDA, pink) are labelled. Asterisk, lesion. Scale bars, overview: 500µm. Insets: 50µm. (b) Gait cycles performed during locomotion without stimulation and during brain-controlled stimulation of both flexion and extension hotspots in monkey Q2 at 6 days post-lesion. Conventions, same as Figure 3. Limb paralysis in red. (c) Snapshots extracted from video recordings showing a sequence of leg movements without stimulation and during brain-controlled stimulation (monkey Q2, 6 days post-injury). Timeline indicates video snapshot timing. Legend refers to panels d and e. (d) Bar plots reporting the ratio between of steps performed by the affected versus unaffected leg by each monkey without stimulation (n = 6 for day 6 and n = 39 for day 14 for Q2, n = 68 for Q3) and during brain-controlled stimulation (n = 12 for day 6 and n = 93 for day 14 for Q2, n = 31 for Q3). (e) Principal component (PC) analysis applied on 26 gait parameters for Q2. All the gait cycles corresponding to limb paralysis or stumbling have been excluded from this analysis. Each gait cycle is shown in the space defined by PC1 and PC2. Bar plots reporting the mean Euclidean distance between pre-lesion and post-lesion gait cycles corresponding to steps, calculated in the entire kinematic space. **,*** significant difference at p < 0.01 and p < 0.001, respectively using bootstrapping (panel d) or Wilcoxon ranksum test (panel e).
Decoding accuracy declined shortly after lesion. Improvement of decoding performance during the following week suggested that this decrease was primarily due to the reorganization of cortical dynamics (Extended Data Fig. 9). This recovery coincided with improvement in the quantity and quality of steps, indicating that the monkeys had spontaneously regained some degree of neural control over the impaired leg (Extended Data Fig. 7). At this stage, the brain–spinal interface alleviated many of the remaining gait deficits (Fig. 4d-e). Tuning EES frequency maximized the quantity and quality of steps, whereas the same stimulation protocols applied continuously failed to facilitate locomotion or were markedly less efficient than brain-controlled stimulation (Extended Data Fig. 10).
The recovery of coordinated, weight-bearing locomotion in a primate model of spinal cord injury emphasizes the therapeutic potential of the brain–spinal interface for clinical applications. We have integrated intracortical arrays2,3, wireless modules25 and pulse generators that have been approved for research applications in humans, opening realistic perspectives for proof-of-concept clinical studies.
Our brain–spinal interface exploits neuronal ensemble modulation that naturally occurs during locomotion, immediately linking cortical dynamics with spatiotemporal neuromodulation therapies without prior training of the monkeys. This ecological approach29 enabled a smooth cooperation between residual supraspinal signals and the brain–spinal interface in generating leg movements. Imaging30 and electrophysiological4 studies showed that leg motor cortex dynamics is preserved in people with paralysis. Moreover, cortical activity modulates with intended movements in people with long-lasting tetraplegia, which allowed them to control robotic arms2,3 and neuromuscular stimulators4. These results suggest that the decoding strategy employed in this study may have useful application in people with paraplegia.
Our model of paralysis avoided many of the complications associated with severe injuries that are difficult to manage and ethically debatable in primates24. The use of a brain–spinal interface to restore bipedal locomotion in humans after severe injuries may require additional interventions, including monoaminergic replacement therapies13,19 compensating for the interrupted source of serotonin from brainstem centres and robotic systems to sustain balance. Nevertheless, individuals with motor complete injuries regained weight-bearing standing and stepping-like movements during continuous EES14,16. Therefore, the conditions now exist to test the efficacy of the brain–spinal interface to enhance neuroplasticity21,28 during rehabilitation in people with spinal cord injury.
Methods
Animal Husbandry, Surgical Intervention and Behavioral Training
Animal husbandry
Experiments were approved by the Institutional Animal Care and Use Committee of Bordeaux (CE50 – France) under the license number 50120102-A and performed in accordance with the European Union directive of September 22, 2010 (2010/63/EU) on the protection of animals used for scientific purposes in an AAALAC-accredited facility (Chinese Academy of Science, Beijing, China). Nine healthy male rhesus monkeys (Macaca mulatta, China; Supplementary Table 1) aged between 4 and 9 years old, and weighing between 4.3 and 8.4kg (6. 5 ± 0.5kg) were housed individually in cages designed according to European guidelines (2x1.6x1.26m). Environmental enrichment included toys and soothing music. All the monkeys are included in the manuscript. Only two monkeys received a spinal cord injury.
Surgical procedures
All the surgical procedures were performed under full anaesthesia induced with atropine (0.04 mg/kg) and ketamine (10 mg/kg, intramuscular injection) and maintained under 1-3% isoflurane after intubation. A certified functional neurosurgeon (J.B.) supervised all the surgical procedures. Surgical implantations were performed during a single operation lasting approximately 8 hours. We implanted a 96-channel microelectrode array (Blackrock Microsystems, pitch, 1.5mm) into the leg area of the left primary motor cortex1 (F4, Extended Table 1). The monkeys also received a wireless system2 (T33F-4, Konigsberg Instruments, USA) to record electromyographic signals from the following leg muscles: gluteus medius (GLU), iliopsoas (IPS), rectus femoris (RF), semitendinosus (ST), gastrocnemius medialis (GM), tibialis anterior (TA), extensor digitorum longus (EDL), and flexor hallucis longus (FHL). A custom-made spinal implant was inserted into the epidural space of the lumbar spinal cord according to previously described methods9. The implant was inserted at L4-L5 vertebrae and pulled until T13-L1 vertebrae. Electrophysiological testing was performed intra-operatively to adjust the position of the electrodes. Specifically, we verified that a single pulse of stimulation delivered through the most rostral and most caudal electrodes induced motor responses in the IPS and GM muscles, respectively. The connector of the implant, enclosed into a titanium orthosis, was secured to the vertebral bone using titanium screws (Vis MatrixMIDFACE, diameter 1.5 mm, length 8 mm, Synthes). The wires were routed subcutaneously to an implantable pulse generator inserted between intercostal muscles (See Supplementary Information).
Monkeys Q2 and Q3 received a spinal cord injury. A partial laminectomy was made at the T7/T8 level. A micro-blade was used to cut approximatively two thirds of the dorsoventral extent of the spinal cord. The lesion was completed using micro-scissors under microscopic observation. Animals retained bowel, bladder, and autonomic function after the injury.
The veterinary team continuously monitored the monkeys during the first hours after surgery, and numerous times daily during the seven subsequent days. A few hours after completion of surgical interventions, the animals were able to move around and feed themselves unaided. Clinical rating and monitoring scales were used to assess post/operative pain. Ketophen (2mg/kg; s.c.) and Metacam (0.2 mg/kg; s.c.) were administered once daily. Lidocaine cream was also applied to surgical wounds twice per day. The antibiotics ceftriaxone sodium (100 mg/kg; i.m.) was given immediately following surgery, and then once daily for 7 days.
Experimental Recordings
Monkeys were trained to walk on a treadmill and overground along a corridor (300x35x70cm). Plexiglas enclosures were used to maintain the monkeys within the field of view of the cameras. Food pellets and fruits rewarded appropriate behaviours. Additional food to complete daily dietary requirement was provided after training.
Single pulse stimulation in sedated monkeys
Monkeys were lightly sedated with ketamine (3.5 mg/kg), and suspended in the air using a jacket that did not impede leg movements. Single pulses of cathodic monopolar, charge-balanced stimulation (0.3ms, 1Hz) were delivered through the electrodes to elicit compound potentials in leg muscles. We selected the active sites whose corresponding spatial maps of motoneuron activation showed the highest correlation with the hotspots.
Brain-controlled stimulation during locomotion on a treadmill in intact monkeys
Brain-controlled stimulation protocols were tested during locomotion on a treadmill at a comfortable speed (Q1, 2.0km/h; Q2, 1.6km/h). Recording sessions were organized as follows: first, we recorded two to five blocks of 1-2 minutes-long during stepping without stimulation. These baseline recordings were used to calibrate the decoders for real-time detection of foot off and foot strike gait events. Second, monkeys were recorded during brain-controlled stimulation protocols involving (i) solely the electrode targeting the extensor hotspot, (ii) solely the electrode targeting the flexor hotspot, and (iii) both electrodes. We tested the effects of stimulation frequency and amplitude over functional ranges (30 to 80Hz; 1.5 to 3.9 V). See Supplementary Table 2.
EES during locomotion in lesioned monkeys
Monkey Q2 and Q3 were recorded after injury as soon as they were able to sustain independent locomotion on the treadmill, which corresponded to 6 days and 16 days post-injury, respectively. Q3 recovered more slowly than Q2, probably due to more extensive ventral and lateral spinal cord damage (Extended Data Fig. 9). Therefore, monkey Q3 could only be recorded when appropriate behavioural and physical conditions were reached, which occurred two weeks post-injury. Due to restrictions on the total duration of the experiments (2 weeks), only one entire session could be conducted with this monkey. Following this experiment, the monkey rapidly recovered, which prevented evaluating the efficacy of the brain-spinal interface. The monkeys were recorded on the treadmill at their most comfortable speed (1.2-1.4km/h for monkey Q2 and 1.0 km/h for monkey Q3). Recording sessions were organized as follows. First, we recorded two to six blocks of 1-2 min without stimulation. These recordings were used to calibrate the decoders. Second, the decoders were used to test brain-controlled stimulation of both the extension and flexion hotspots over a range of stimulation frequencies. The effects of continuous stimulation using the same stimulation features as during brain-controlled stimulation were also tested. Within functional range of stimulation parameters, brain-controlled stimulation did not trigger undesired movements or spasms that impaired locomotor movements. See Supplementary Table 2.
Data Acquisition
Procedures to record kinematics and muscle activity have been detailed previously25,31. Whole-body kinematics was measured using the high-speed motion capture system SIMI (Simi Reality Motion Systems, Germany), combining 4 or 6 video-cameras (100Hz). Reflective white paint was directly applied on the shaved skin of the monkey overlying the following body landmarks of the right side: iliac crest, greater trochanter (hip), lateral condyle (knee), lateral malleolus (ankle), 5th metatarsophalangeal (mtp), and the outside tip of the fifth digit (toe). The Simi motion tracking software was used to obtain the 3D spatial coordinates of the markers. Joint angles were computed accordingly. Electromyographic signals were recorded simultaneously (2 kHz, Kronisberg, USA) and synchronized through the Blackrock Cerebrus system (Blackrock Microsystems, USA), which also recorded neural signals. For this, the Cereplex wireless system25 was mounted on the head of the monkeys. Six antennae and a receiver were used to transmit25 broadband neural signals (0.1 Hz – 7.8 kHz, sampled at 22 kHz). The signals were band-pass filtered (500 Hz - 7.5 kHz) and spiking events were extracted through threshold crossings2,32–35. Specifically, a spiking event was defined on each channel (96 in total) if the signal exceeded 3.0 to 3.5 times its root mean square value calculated over a period of 5s. This procedure resulted in a binary signal from 96 multiunits, each originating from one of the 96 electrode of the array. Signals from all 96 multiunits have been integrated in the decoder.
Decoding of Motor States from Neural Signals
Our aim was to deliver stimulation over the extensor and flexor hotspots around the times at which these hotspots are active during natural locomotion. To this end, we decoded gait-related motor states from neural activity and used those detections to trigger the stimulation protocols at the appropriate times. The control computer was connected to the local network and continuously received UDP packets containing neural recordings. We designed a custom in-house software application running on the control computer (Visual Studio C++ 2010), which analysed the neural signals in real time. Every 20ms, the application made a decision whether to trigger one of the spinal cord stimulation protocols. The decision was made based on probabilities of observing a “foot off” or a “foot strike” motor state given the history of neural data (300ms pre-lesion and 400ms post-lesion), as calculated by our decoders.
Natural activations of the extension and flexion hotspots were time-locked to foot off and foot strike gait events (fo and fs, respectively). In turn, we defined the foot off and foot strike motor states as the neural activity preceding foot off and foot strike gait events by ΔtFO and ΔtFS temporal offsets, respectively. The offsets were derived in order to maximize the overlap between the stimulation over the hotspots and the natural activation of those hotspots. In effect, the offsets integrated the latencies between the gait events and the hotspot activations, as well as latencies related to wireless communication between our devices, into the design of our decoders.
Extraction of motor states used for decoder calibration
We calibrated the decoders on data from two to seven no stimulation blocks recorded at the beginning of each session. Gait events were identified from electromyographic recordings (Q1) or from video recordings (Q2 and Q3). Identification of fo and fs gait events from electromyographic recordings was performed using signals from the iliopsoas muscle, which was active around the time of swing onset and remained active throughout most of the swing phase of gait. The fo and fs events were estimated by thresholding the envelope of the rectified electromyographic signal. Identification of fo and fs gait events from video recordings was performed visually. After injury and while the monkeys only exhibited minimal movements of the limb ipsilateral to lesion, fo and fs gait events were defined according to residual hip/knee oscillations, which correlated with the attempt to execute steps.
Calibration procedure to account for stimulation-induced changes in neural signals
Analysis of the decoding temporal precision in Q1 revealed that decoded foot off and foot strike motor states during brain-controlled stimulation differed from the times of the motor states estimated from the foot off and foot strike gait events (median difference: foot off: 68ms; foot strike: -90ms). We did not observe such difference when detecting motor states in the absence of stimulation (median difference: foot off: 11ms; foot strike: 3ms). A range of factors could have decreased decoding performance including: changes in somatosensory feedback influenced by the stimulation, monkeys’ attempts to adapt its gait, changes in stability, etc. To improve temporal accuracy of our decoder, we introduced a decoder recalibration process. The initial decoder, trained on data without stimulation, was used to trigger stimulation through the extension hotspot or flexion hotspot independently for 2 to 3 blocks each. The data collected during these blocks was then combined to the blocks without stimulation to calibrate a new, second decoder. This decoder successfully compensated for stimulation-induced changes in motor cortex activity (Fig 3. and Extended Data Fig. 5).
Duration of hotspot stimulation protocols
We sought to stimulate flexion and extension hotspots throughout the duration of their natural activation during locomotion. We determined the duration of the flexion and extension hotspot stimulation protocols by setting this duration to 300ms. We then recorded a few steps during brain-controlled stimulation, and adjusted the duration of the stimulation protocols for each monkey when necessary in order to obtain a clear modulation of leg kinematics. This procedure was performed only once for all pre-injury sessions and was repeated for each post-injury session.
Data Processing and Analysis
Code availability
The software routines utilized for data analysis will be made available upon reasonable request to the corresponding author.
Blinding
Data analyses, except identification of the steps and the marking of foot off and foot strike gait events from video recordings, were performed by automatic computer routines. When analyses required involvement of investigators, they were blind to the experimental conditions.
Spatiotemporal map of motoneuron activation
To visualize spatiotemporal maps of motoneuron activation, electromyographic signals were mapped onto the rostrocaudal distribution of the motoneurons reconstructed from histological analyses. This approach provides an interpretation of the motoneuron activation at a segmental level rather than at the individual muscle level.
Identification of extensor and flexor hotspots activation
Flexion and extension hotspots were identified from the mean spatiotemporal map of motoneuron activation for each monkey independently (n = 3 for Q1, P2 and P3). Single maps computed between two consecutive foot strike events were time-interpolated to a 1000 point map and averaged to obtain the mean spatiotemporal map of motoneuron activation. Flexion and extension hotspots were then identified by time-averaging the mean map around the foot off event (-10% + 20% of the gait cycle) for the flexion hotspot and around the foot strike event (-10% + 30% of the gait cycle) for the extension hotspot.
Analysis of muscle recruitment curves
The compound potentials recorded in leg muscles were rectified and integrated for each muscle and stimulation amplitude, and represented in color-coded spatial maps of motoneuron activation. Instead of measuring specific flexor and extensor muscle selectivity we selected the electrodes that elicited spatial maps similar to those extracted during activation of the flexion and extension hotspots, regardless of muscle specificity. The correlation between the resulting map and the maps recorded during locomotion was calculated for each monkey to identify the voltage range over which the correlation was maximal. The derived voltage range was then used during behavioural experiments (Extended Data Fig. 3c).
Decoding performance quantification
We quantified the performance of our asynchronous decoders using confusion matrices and normalized mutual information, as described before36
Steps classification for kinematic analysis
In order to evaluate the efficacy of the brain-spinal interface and assess the importance of the timing of stimulation in correcting gait deficits, we conducted a post-hoc classification of the steps based on the temporal accuracy of the decoder to reproduce the desired hotspot activation timings. We defined optimal and sub-optimal steps according to the initiation of flexion and extension hotspot stimulation. All the gait cycles that contained only one correct extension activation (stimulation occurring at Foot Strike ± 125 ms) and only one correct flexion activation (stimulation occurring between Foot Off -200 ms and Foot Off +50 ms) were defined as optimal steps (Extended Data Fig. 10).
Stepping quantity
After the spinal cord lesion, the monkeys typically walked with the three intact limbs while the leg ipsilateral to the lesion was either dragging along the walking surface or maintained in a flexed posture. Occasionally, monkeys hopped to move both legs forward and avoid bumping against the back of the treadmill enclosure due to their inability to move at the selected treadmill belt speed. We counted the numbers of these “hop” and “bump” steps, as well as the numbers of normal steps. Experimenters were blinded to stimulation conditions during this analysis. To quantify the functional improvement mediated by the brain-spinal interface, we calculated the proportion of normal steps over all recorded blocks on a given day. To quantify the ability of the monkeys to sustain locomotion, we extracted all the events marked as steps, and measured the relative number of steps that were not performed while bumping into the back of the treadmill enclosure.
Stepping quality
A total of 26 parameters quantifying kinematics (Supplementary Table 3) were computed for each step according to methods described in details previously8,9,31. We used principal component analysis (PCA) to visualize the changes in gait over time and for different conditions (Fig. 4, Extended Data Fig. 7, 8). To quantify locomotor performance, we calculated the mean Euclidian distance between steps corresponding to a given experimental condition and the mean of steps recorded before the lesion in the same monkey in the entire 26-dimensional space of kinematic parameters.
Anatomical Procedures
Tissue processing
Monkeys were deeply anesthetized and perfused transcardially with a 4% solution of paraformaldehyde. The spinal cord dura was removed and the spinal cord was cut using a cryostat, and stored at 4°C in 0.1M PBS azide (0.03%).
Anterograde tracing of motor cortex projections
Monkeys Q2 and Q3 underwent anterograde tracing of corticospinal projections from the leg and trunk area of the left motor cortex using anatomical tracers. All animals were anesthetized as described above. Biotinylated dextran amine (BDA; 10% solution in water; 10,000 Da; Molecular Probes, TSA PLUS Biotin KIT PerkinElmer, cat. NEL749A001KT) was injected at 300 nl/site into 40 sites spanning the leg and trunk regions of the left motor cortex.
Quantification of the spinal cord lesion
Camera lucida reconstructions of the lesion (Neurolucida 11.0, MBF biosciences, USA) were performed using evenly spaced horizontal sections (1:4) throughout the whole dorsoventral axis on sections labelled for astrocytic (glial fibrillary acidic protein, GFAP; 1:1000, Dako, USA, cat. Z0334), NeuN (anti-NeuN; 1:300, Millipore, cat. MAB377) and BDA reactivity. Immunoreactions were visualized with secondary antibodies labelled with Alexa fluor® 488 (1:400, Invitrogen, cat. A-11034) and 647 (1:300, Invitrogen, cat. A-21235).
Statistical Procedures
All the computed parameters were quantified and compared within each monkey. All data are reported as mean values +/- standard error of the mean (s.e.m.). Significance was analysed using the non-parametric Wilcoxon rank sum test, bootstrapping or a Monte-Carlo approach.
Extended Data
Extended Data Figure 1. Design and fabrication of the spatially selective spinal implant.
Step 1: Quantification of the length of vertebra T12 to L4, and of spinal segments L1 to S1. The photographs show coronal sections of the the left halves of the L3 and S1 spinal segments, including the dura mater, dorsal roots and spinal tissue. The complementary views show camera Lucida reconstructions of the dorsal roots, white and grey matter. The dorsal roots projecting to L1/L2 and L6/L7 spinal segments are color-coded to visualize their respective location. Step 2: 3D reconstruction of the entire lumbosacral spinal cord and dorsal roots. The dorsal roots innervating spinal segments containing the targeted extension (L6, L7) and flexion (L1, L2) hotspots are color-coded to help visualize their respective spatial trajectory. The 3D reconstructions are displayed from a dorsal view, and from a view that is rotated by 45 deg leftward around the rostrocaudal axis in order to visualize the trajectory of the dorsal roots along spinal segments. Step 3: Design of the spatially selective spinal implants, including the location of the electrodes with respect to the dorsal roots, and positioning of the implants with respect to the vertebra. The cyan and magenta shapes highlight the electrodes targeting the flexor and extensor hotspots, respectively. Step 4: Mask layout of the spatially selective epidural spinal implant. Step 5: Fabrication of the spinal implants. Processing starts with deposition of a 40 µm thick Polyimide film by spin coating on the silicon substrate. The Polyimide-based bottom layer constituting the footprint of the implant is realized through ultra-violet lithography. A 200 nm thick gold layer is deposited using vacuum evaporation and lithographically structured to create a conductive seed pattern. An additional gold layer is electroplated to a height of approximately 6 µm to create the electrodes and interconnects. A 20 µm cover layer of photosensitive Polyimide is then applied by spin coating to uniformly cover the bottom and electrode structure. A final ultra-violet lithography is applied to structure the top layer of the implant, and to create openings over the electrodes and contact pads. The implants are gently released from the carrier wafer. To create a connector, the contact pads located at the extremity of the implant are glued to a small support plate made of medical grade poly-methyl methacrylate (PMMA) sheet material. Precision milled alignment structures allow fine adjustment of the support plate to the spinal implant, and to the extremity of the leads. The support plate contained a seat in which a tiny printed circuit board with conductive stripes is fixed. Stainless steel leads with silicone rubber insulation are directly soldered to the contact pads of the implant via the contact stripes located on the printed circuit board. The resulting implants and connective leads were highly reliable mechanically and electrically. A fixation structure was realized by using 3D laser sintering of medical grade titanium. Step 6: Photographs, including zoomed insets, showing a fabricated spinal implant and a micro-computed tomography scan performed after implantation.
Extended Data Figure 2. Protocols and technology of the spinal cord stimulation system.
Step 1: A Neural Research Programmer interface (screen snapshot) encodes stimulation protocols that are pre-programmed into a table uploaded to the implantable pulse generator. Each row of this table corresponds to a specific electrode configuration (cathodes and anodes) and stimulation features (amplitude, frequency, pulse width and duration of stimulation). During experiments, the control computer selects the rows to be executed. The plot reports the distribution of temporal delays introduced by the communication between the decoder and the Neural Research Programmer (n = 5000). Step 2: stimulation commands are transmitted to the implantable pulse generator. Commands are first broadcasted via Bluetooth to a module that converts them into infrared signals transferred to the stimulation programmer device. The Bluetooth to infrared module and the stimulation programmer were embedded into a jacket worn by the monkeys during the experiments. The stimulation programmer transmitted the stimulation commands into the implantable pulse generator via induction telemetry. The antenna was placed under the jacket, in contact with the skin and aligned to the implantable pulse generator. The plot reports the distribution of delays needed to transmit the stimulation commands from the Neural Research Programmer to the implantable pulse generator. Step 3: The implantable pulse generator executed the selected stimulation protocols. After execution of the stimulation command, the implantable pulse generator switched to idle mode. The shape of a single charge balanced cathodic pulse is shown in the inset (1). The plot reports the distribution of time delays required to execute a single stimulation command by the implantable pulse generator.
Extended Data Figure 3. Anatomical, computational, and functional experiments allowed the identification of stimulation protocols to access flexion and extension hotspots.
(a) Computational procedure to estimate spatiotemporal maps of motoneuron activation during locomotion. Step 1: Four pairs of antagonist muscles spanning each joint of the leg are implanted with bipolar electrodes to record electromyographic signals during locomotion. Step 2: Muscle activity recorded during locomotion on a treadmill is band pass filtered using a Butterworth 3rd order filter (30-800 Hz, monkey P3), Step 3: The signals are rectified, filtered with a low pass at 10 Hz, normalized to the maximum activity recorded across all the gait cycles, and then projected onto the location of the corresponding motoneuron columns in the spinal cord for each of the recorded muscles. The estimated motoneuron activation is represented as a color-coded spatiotemporal map of motoneuron activation. (b) Spatiotemporal maps of motoneuron activation recorded in three intact monkeys (Q1, P2 and P3). The maps were obtained by averaging electromyographic signals recorded during continuous locomotion on a treadmill (n = 73, 25 and 24 steps for monkey Q1, P2 and P3, respectively). The maps underlying the activation of extension and flexion hotspots were extracted by averaging the estimated motoneuron activation around the foot strike and foot off events, respectively. For this, a window was defined from -10% to +30% of the gait cycle duration for the foot strike event, and from -10% to +20% of the gait cycle duration for the foot off event. The maps were reproducible across monkeys: correlation between monkey Q1, P2 and P3 for the flexion hotspot was 0.94, 0.90 and 0.90 for Q1-P2, Q1-P3 and P2-P3, respectively. Correlation between monkey Q1, P2 and P3 for the extension hotspot was 0.88, 0.90 and 0.60 for Q1-P2, Q1-P3 and P2-P3, respectively. The resulting maps were projected onto the reconstructed spinal segments (Extended Data Fig. 1). (c) Recruitment curves showing the relationships between motor evoked potentials elicited by single pulses of epidural electrical stimulation in each of the recorded hindlimb muscles and the stimulation amplitude for three intact monkeys (Q1, Q2 and P1). Stimulation was delivered through the electrodes targeting the extension and flexion hotspots. The compound responses elicited in leg muscles were rectified and integrated to calculate the amplitude of the responses, and then projected on the reconstructed spinal segments. The spatial maps of motoneuron activation corresponding to the optimal range of stimulation amplitudes to access the hotspots stimulation are displayed for each monkey, including the location of the electrodes with respect to spinal segments. To compute the optimal range of stimulation amplitudes to access each hotspot, we extracted the stimulation amplitudes for which the spatial map of motoneuron activation displayed the highest values of correlation with the spatial maps of the targeted hotspots. The cyan and magenta shadings highlight the functional range of stimulation amplitude for each hotspot and monkey.
Extended Data Figure 4. Procedure to calibrate the decoders for real-time detection of motor states.
Step 1: The locomotor movements of the right leg were recorded using the video camera system. In parallel, neural signals were recorded from the microelectrode array implanted into the leg area of the primary motor cortex. The signals were band-pass filtered (0.5-7.5kHz). A threshold was at 3 to 3.5 times the standard deviation in order to obtain spike events. The two data streams were saved onto computers. Step 2: Visual inspection of the video frames allowed the identification of foot off and foot strike gait events. We estimated the spike rates from overlapping 150ms bins that were updated every 20ms. Gait events were then synchronized with the spike rate estimates using a trigger saved with the neural data that marked the onset of video recordings. Step 3: We extracted feature vectors that originated at foot off and foot strike events and assigned them to foot off and foot strike motor state classes, respectively. All other feature vectors were assigned to the neither class. Step 4: Motor state classes of feature vectors were used to calibrate a regularized linear discriminant analysis decoder. Step 5: The decoder was uploaded into our real-time analysis application running on the control computer. Neural data was collected in real-time, processed into spike rate estimates, and passed through the decoder that calculated the probabilities of foot off and foot strike motor states. When one of the motor state probabilities crossed a threshold of 0.8, a command to trigger the flexion or extension hotspot stimulation protocols was sent to the neural research programmer, which relayed this instruction to the implanted pulse generator. Due to the wireless communication, the command was executed 178ms (Q1) or 105ms (Q2-3) after the detection of the motor states.
Extended Data Figure 5. The real-time decoder accurately detected the motor states and triggered stimulation protocols during locomotion and when initiating and terminating it in intact monkeys.
(a) Example of a continuous sequence of locomotion (20 s) during brain-controlled flexion and extension stimulation in an intact monkey (Q2, pre-lesion session 2, Extended Table 2). Conventions are the same as in Figure 3. The real-time decoder correctly detected the succession of 22 foot off and foot strike motor states occurring in this sequence (vertical dotted lines), and appropriately triggered the relevant stimulation protocols throughout the locomotor sequence. (b) Histograms showing the distribution of the temporal differences between the actual occurrence of foot off and foot strike events and the decoded occurrence of these motor states for all the recording sessions of the tested intact monkeys (Q1, Q2). The dotted lines indicate the median for each distribution. For the monkey Q1, the decoders were calibrated using recordings without stimulation only. For the monkey Q2, we improved the accuracy of the decoders by performing the calibration twice. First, the decoders were recalibrated using recordings without stimulation. These decoders were used to collect recordings during brain-controlled flexion or brain-controlled extension independently. New decoders were then calibrated using all the combined recording blocks together. (c) Confusion matrices reporting the accuracy of the real-time decoders without stimulation and during brain-controlled stimulation, given a tolerance window or ±125ms. The bar plots report the normalized mutual information calculated for the real-time decoders compared to random decoders and chance level decoders. Random decoders were the same decoders calibrated using shuffled gait events. The chance level decoders randomly assigned motor states with chance level probabilities, which were estimated from the data used to calibrate the online decoders, and at the same rate as the online decoders. (d) Two examples of recordings collected while monkey Q1 and Q2 initiated or terminated sequences of continuous locomotion on a treadmill. The green shaded area indicates the period during which the treadmill was turned off. The brain-spinal interface was kept on throughout the recordings. Conventions are the same as in Figure 3. Probability of foot strike and foot off motor states remained low during the periods of rest, and recommenced to modulate with the occurrence of motor states when the monkey resumed continuous locomotion. The decoder confusion matrices were calculated during brain-controlled stimulation across all the sessions with intact monkeys during which the treadmill was turned off (n = 345 and n = 127 temporal windows for Q1 and Q2). False positive detections were rare.
Extended Data Figure 6. Modulation of leg locomotor movements during brain-controlled stimulation in intact monkeys.
(a) PC analysis was applied on individual gait cycles extracted from locomotion on a treadmill without stimulation (n = 125 and n = 119 for Q1 and Q2) and during brain-controlled stimulation of the extension (n = 33 and n = 54 gait cycles with stimulation for Q1 and Q2, respectively) or flexion (n = 98 and n = 120 total stimulation steps for Q1 and Q2, respectively) hotspots for the intact monkeys Q1 and Q2. Conventions are the same as in Figure 3 and Extended Data Figure 7. This analysis emphasizes the graded modulation of gait parameters when increasing the frequency or amplitude of stimulation for extension and flexion hotspots independently. (b) Plots showing relationships between the amplitude or frequency of extensor (magenta) or flexor (cyan) hotspot stimulation and relevant kinematic or muscle activity parameter related to the extension or flexion of the right leg. The upper right plot shows the average foot trajectories during each experimental condition, illustrating the graded modulation of flexion during brain-controlled stimulation of the flexion hotspot. The lower right plot highlights the high degree of leg-specific modulation over the entire extent of tested stimulation parameters. Results were comparable in monkey Q1 and Q2. ***,* p<0.001 and p<0.05, respectively. Wilcoxon rank sum test. Error bars, s.e.m.
Extended Data Figure 7. Quantification and reconstruction of the spinal cord lesions and quantification of gait deficits and spontaneous recovery after the spinal cord lesion.
(a) Scheme illustrating the anatomical experiments to quantify the lesion of the corticospinal tract. The anterograde anatomical tracer BDA was injected into the leg and trunk regions of the left primary motor cortex to label corticospinal tract fibres in the spinal cord, shown in pink in the photographs. Top-right scheme shows the approximate pathways of the dorsal ascending tract and all descending tracts identified from37,38. For monkey Q2 and Q3, the area of maximal damage was reconstructed in 2D by identifying the border of the glia scar on evenly spaced sagittal sections spanning the entire dorsoventral extent of the lesioned spinal cord. (b,c,d,e) For each monkey, confocal photographs show longitudinal sections of the lesioned spinal cord at specific dorsoventral levels, as indicated with dotted lines. In each photograph, the following anatomical elements are labelled: astrocytes (GFAP, grey), neural cell bodies (NeuN, cyan) and corticospinal tract axons (BDA, pink). The insets show high-resolution photographs of selected (white square) regions of the same photograph that illustrates intact corticospinal tract axons above the injury, axon retraction bulbs right above the lesion, and the absence of axons below the injury. Monkey Q2 displayed a small subset of spared corticospinal tract axons in the more dorsal aspect of the dorsolateral column. The asterisks indicate the location of the lesion. Scale bars, overviews: 500µm. Insets: 50µm. (f) Gait cycles were extracted from locomotion recorded in monkey Q2 and Q3 pre-lesion, during the first two weeks after the lesion, and at 99 days after the lesion. Analysis was only applied to gait cycles classified as steps, i.e. gait cycles classified as limb paralysis or stumbling were not included. The number of analysed gait cycles is directly reported into the figure. The bar plots report the mean Euclidean distance between all the steps under a given recording day without stimulation and steps recorded before the lesion, computed in the entire space of the 26 kinematic parameters. The other bar plots report mean values of relevant kinematic parameters. This analysis illustrates the progressive yet incomplete recovery of locomotion. ***, p < 0.001, Wilcoxon rank sum test. Error bars, s.e.m.
Extended Data Figure 8. Restoration of leg locomotor movements during overground locomotion after the spinal cord lesion.
(a) Representative sequences of locomotion along a straight corridor without stimulation and during brain-controlled stimulation recorded at 7 days and 13 days after the lesion for monkey Q2. Conventions are the same as in Figure 4. The bar plots report the mean step height of the right (lesioned) leg during swing. *, p<0.05, Wilcoxon rank sum test. Error bar, s.e.m. (b). Snapshots extracted from video recordings showing a representative sequence of leg movements during one gait cycle without stimulation and during brain-controlled stimulation at 7 days post-injury for monkey Q2. The stick diagrams overlying the right (lesioned side) leg and the trajectory of the foot are color-coded using the same color scheme as the stick diagram decomposition in panel a. Without stimulation, the monkey dragged the leg along the ground, whereas brain-controlled stimulation restored weight-bearing locomotion with plantar placement.
Extended Data Figure 9. Quantification of gait improvements and decoding accuracy during brain-controlled stimulation after the spinal cord lesion.
(a) Two successive gait cycles performed during locomotion on a treadmill without stimulation and during brain-controlled stimulation in monkey Q2 at 6 and 14 days post-lesion, and in monkey Q3 at 16 days post-injury. Conventions are the same as in Figure 4. In addition, the average foot trajectories calculated over all the recorded gait cycles are displayed for each experimental condition including during pre-lesion locomotion, illustrating the marked improvement of foot movements during brain-controlled stimulation. (b) Bar plot reporting the mean values of the total excursion of the angle, step height and foot trajectory area for monkey Q2 and Q3 during locomotion pre-lesion and post-lesion without stimulation and with brain-controlled stimulation. Analysis was only applied to gait cycles classified as steps, i.e. gait cycles classified as limb paralysis or stumbling were not included (Q2: pre-lesion n = 294; day 6 post-lesion no stimulation: n = 6; brain control: n = 12; day 14: no stimulation: n = 39; brain control: n = 93. Q3: pre-lesion n = 185; day 16 post-injury no stimulation: n = 98; brain control: n = 31). ***,** p<0.001 and p<0.01, respectively. Wilcoxon rank sum test. Error bars, s.e.m. (c) Bar plots reporting the capacity of the monkeys to sustain walking at the imposed treadmill belt speed. The functional score is computed as the percentage of regular steps in which the animal is able to walk at the treadmill belt speed i.e. animal does not bump into the back of the treadmill. Gait cycles classified as hops or stumbling were not included. ***,* p<0.001 and p<0.05, respectively, Bootstrap. Error bars, s.e.m. (d) Decoding accuracy increases during recovery after the spinal cord lesion. Decoder confusion matrices calculated reporting the accuracy of the real-time decoders and chance level decoder during brain-controlled stimulation for monkey Q2 at day 6 (n = 76 foot strikes, n = 74 foot offs) and day 14 post-injury (n = 264 foot strikes, n = 264 foot offs) and for monkey Q3 at 16 days post-injury (n = 319 foot strikes, n = 321 foot offs). The tolerance window was set at ± 125ms. The bar plots report the normalized mutual information calculated for the real-time decoders compared to random decoders and chance level decoders. (e) Top, from left to right: mean event rate, modulation depth and preferred direction for the neuronal spiking signal recorded obtained by regressing spike rates against the phase of the gait cycle for monkeys Q1-3. Preferred direction was defined as the angle for which the fitted tuning function was at a maximum. Bottom, from left to right: mean absolute single-electrode difference for mean event rates, modulation depths and preferred directions between two consecutive sessions shown in (e) top. Analysis shows substantial changes both before and after the spinal-cord lesion. Nevertheless, the rate of change between the last pre-lesion and the first post-lesion sessions was substantially higher than between any two other session pairs, thus indicating increased level of plasticity following spinal cord lesion. ***,** significant difference at p < 0.001 and p < 0.01, respectively. Monte Carlo, Wilcoxon ranksum test, signed Wilcoxon ranksum test and Bootstrap. Error bars, s.e.m.
Extended Data Figure 10. The temporal structure and features of stimulation determine the quantity and quality of steps.
(a) Two successive gait cycles performed during locomotion on a treadmill during brain-controlled stimulation with optimal and suboptimal temporal structures at 6 days post-injury, and during continuous stimulation at 14 days post-lesion for monkey Q2. The gait cycles were classified as suboptimal temporal structures when stimulation occurred outside an ± 125ms tolerance window. Conventions are the same as in Figure 4. (b) Bar plots reporting the quantity of steps calculated during locomotion with optimal and suboptimal temporal structures over a range of stimulation frequencies and during continuous stimulation for monkey Q2 and Q3 at 6, 14 and 16days post-injury. (c) Bar plots reporting the quality of stepping for the same conditions as in panel b. The quality of stepping was measured as the mean Euclidean distance between pre-lesion and post-lesion gait cycles calculated in the kinematic space defined by the 26 gait parameters, as reported in Figure 4. These results show that the optimal temporal structure leads to an increased number of steps and improved quality of stepping compared to sub-optimal temporal structures. Moreover, brain-controlled stimulation with both optimal and suboptimal temporal structure promoted markedly improved locomotor performance compared to continuous stimulation delivered with the same stimulation features. These results also highlight the ability to optimize locomotor performance when tuning the stimulation frequency. ***,**,* significant difference at p < 0.001, p < 0.01 and p < 0.05, respectively. Bootstrap (panel b). Wilcoxon ranksum test (panel c). Error bars, s.e.m.
Supplementary Material
Supplementary Information is linked to the online version of the paper at www.nature.com/nature.
Acknowledgements
We thank Xing Rulin and Cheng Yunlong for providing support, taking care of the monkeys, performing behavioral training, and collecting data; Elvira Pirondini, Natalia Pavlova and Pavel Musienko for help with experiments; Jacquelin Courtine, Isabelle Pitteloud, Jasmina Rubattel, Laura Dalang and Romy Hasler for help with kinematic reconstruction; Jacquelin Courtine for the voice over in video; Julie Kreider for help with anatomy; and Jean Laurens for discussions and photographs. Illustration created by Jemere Ruby. This work was supported by Medtronic, the European Community's Seventh Framework Program [CP-IP 258654, NeuWALK], the International Paraplegic foundation (IRP), Starting Grant from the European Research Council [ERC 261247, Walk Again], the Wyss centre in Geneva, a Wings for Life Fellowship to G.C., a Marie Curie Fellowship to D.A.B. [331602, e-WALK], Marie Curie COFUND EPFL fellowships to T.M. and F.W, a Morton Cure Paralysis Fund fellowship to T.M., and the Swiss National Science Foundation including the National Centre of Competence in Research (NCCR) in Robotics, Sino-Swiss Science and Technology Cooperation [IZLCZ3_156331], and NanoTera.ch program [SpineRepair].
Footnotes
Author Contributions. M.C., T.M. and D.B. contributed equally to this work. S.M., E.B. and J.B. contributed equally to this work. M.C. developed the spinal cord stimulation protocols and the routines for the identification of flexion and extension hotspots. T.M. developed the brain decoder and the decoder calibration routines. D.B. developed the experimental platform. M.C., T.M., F.W. and E.M.M. performed all the behavioural experiments with help from D.B., J.G., Y.J. and G.C.; M.C., T.M. and F.W. analysed the data, with input from E.M.M., J.B.M. and D.X.; M.C., T.M., F.W., E.M.M. and J.G. developed the real-time software application. N.B. and T.D. developed the Neural Research Programmer, with input from M.C., D.B., T.M., F.W. and J.G. Q.B. and E.R. processed the anatomical data. Y.J. trained all the monkeys. W.K.D.K., Q.L. and E.B. managed experimental protocols and procedures. P.D. developed and produced the spinal implants from design by M.C., D.B., J.B. and G.C.; J.B., D.B., Q.L. and G.C. performed the surgeries. G.C., S.M., E.B., J.B., and P.D. secured funding for the study. G.C. conceived and supervised the study. G.C. wrote the paper with M.C., T.M. and F.W., and all the authors contributed to its editing.
Author Information. Data that supports the findings and software routines developed for the data analysis will be made available upon reasonable request to the corresponding author at gregoire.courtine@epfl.ch. Reprints and permissions information is available at www.nature.com/reprints.
The authors declare competing financial interests: G.C., D.B., M.C., S.M., E.M.M. and J.B. hold various patents in relation with the present work. T.D. and N.B are Medtronic employees. In review of the manuscript they contributed to technical accuracy but did not influence the results or the content of the manuscript. E.B. reports personal fees from Motac Neuroscience Ltd UK and is a shareholder of Motac Holding UK and Plenitudes SARL France. G.C., S.M. and J.B. are founders and shareholders of G–Therapeutics BV.
References
- 1.Ethier C, Oby ER, Bauman MJ, Miller LE. Restoration of grasp following paralysis through brain-controlled stimulation of muscles. Nature. 2012;485:368–371. doi: 10.1038/nature10987. [DOI] [PMC free article] [PubMed] [Google Scholar]
- 2.Collinger JL, et al. High-performance neuroprosthetic control by an individual with tetraplegia. Lancet. 2013;381:557–564. doi: 10.1016/S0140-6736(12)61816-9. [DOI] [PMC free article] [PubMed] [Google Scholar]
- 3.Hochberg LR, et al. Reach and grasp by people with tetraplegia using a neurally controlled robotic arm. Nature. 2012;485:372–375. doi: 10.1038/nature11076. [DOI] [PMC free article] [PubMed] [Google Scholar]
- 4.Bouton CE, et al. Restoring cortical control of functional movement in a human with quadriplegia. Nature. 2016 doi: 10.1038/nature17435. [DOI] [PubMed] [Google Scholar]
- 5.Mushahwar VK, Guevremont L, Saigal R. Could cortical signals control intraspinal stimulators? A theoretical evaluation. IEEE Trans Neural Syst Rehabil Eng. 2006;14:198–201. doi: 10.1109/TNSRE.2006.875532. [DOI] [PubMed] [Google Scholar]
- 6.Ho CH, et al. Functional electrical stimulation and spinal cord injury. Physical medicine and rehabilitation clinics of North America. 2014;25:631–654. doi: 10.1016/j.pmr.2014.05.001. ix. [DOI] [PMC free article] [PubMed] [Google Scholar]
- 7.Kapadia N, et al. A randomized trial of functional electrical stimulation for walking in incomplete spinal cord injury: Effects on walking competency. J Spinal Cord Med. 2014;37:511–524. doi: 10.1179/2045772314Y.0000000263. [DOI] [PMC free article] [PubMed] [Google Scholar]
- 8.Wenger N, et al. Closed-loop neuromodulation of spinal sensorimotor circuits controls refined locomotion after complete spinal cord injury. Science translational medicine. 2014;6:255ra133. doi: 10.1126/scitranslmed.3008325. [DOI] [PubMed] [Google Scholar]
- 9.Wenger N, et al. Spatiotemporal neuromodulation therapies engaging muscle synergies improve motor control after spinal cord injury. Nature medicine. 2016;22:138–145. doi: 10.1038/nm.4025. [DOI] [PMC free article] [PubMed] [Google Scholar]
- 10.Moraud EM, et al. Mechanisms Underlying the Neuromodulation of Spinal Circuits for Correcting Gait and Balance Deficits after Spinal Cord Injury. Neuron. 2016;89:814–828. doi: 10.1016/j.neuron.2016.01.009. [DOI] [PubMed] [Google Scholar]
- 11.Sherrington C. Flexion-reflex of the limb, crossed extension reflex, and reflex stepping and standing. J Physiol (Lond) 1910;40:28–121. doi: 10.1113/jphysiol.1910.sp001362. [DOI] [PMC free article] [PubMed] [Google Scholar]
- 12.Kiehn O. Decoding the organization of spinal circuits that control locomotion. Nat Rev Neurosci. 2016;17:224–238. doi: 10.1038/nrn.2016.9. [DOI] [PMC free article] [PubMed] [Google Scholar]
- 13.Holinski BJ, Everaert DG, Mushahwar VK, Stein RB. Real-time control of walking using recordings from dorsal root ganglia. J Neural Eng. 2013;10:056008. doi: 10.1088/1741-2560/10/5/056008. [DOI] [PMC free article] [PubMed] [Google Scholar]
- 14.Angeli CA, Edgerton VR, Gerasimenko YP, Harkema SJ. Altering spinal cord excitability enables voluntary movements after chronic complete paralysis in humans. Brain : a journal of neurology. 2014;137:1394–1409. doi: 10.1093/brain/awu038. [DOI] [PMC free article] [PubMed] [Google Scholar]
- 15.Gerasimenko Y, et al. Noninvasive Reactivation of Motor Descending Control after Paralysis. J Neurotrauma. 2015 doi: 10.1089/neu.2015.4008. [DOI] [PMC free article] [PubMed] [Google Scholar]
- 16.Danner SM, et al. Human spinal locomotor control is based on flexibly organized burst generators. Brain : a journal of neurology. 2015 doi: 10.1093/brain/awu372. [DOI] [PMC free article] [PubMed] [Google Scholar]
- 17.Barthelemy D, Leblond H, Rossignol S. Characteristics and mechanisms of locomotion induced by intraspinal microstimulation and dorsal root stimulation in spinal cats. J Neurophysiol. 2007;97:1986–2000. doi: 10.1152/jn.00818.2006. 00818.2006 [pii] [DOI] [PubMed] [Google Scholar]
- 18.Shenoy KV, Carmena JM. Combining Decoder Design and Neural Adaptation in Brain-Machine Interfaces. Neuron. 2014;84:665–680. doi: 10.1016/j.neuron.2014.08.038. [DOI] [PubMed] [Google Scholar]
- 19.Shanechi MM, Hu RC, Williams ZM. A cortical-spinal prosthesis for targeted limb movement in paralysed primate avatars. Nature communications. 2014;5:3237. doi: 10.1038/ncomms4237. [DOI] [PMC free article] [PubMed] [Google Scholar]
- 20.Zimmermann JB, Jackson A. Closed-loop control of spinal cord stimulation to restore hand function after paralysis. Frontiers in neuroscience. 2014;8:87. doi: 10.3389/fnins.2014.00087. [DOI] [PMC free article] [PubMed] [Google Scholar]
- 21.Nishimura Y, Perlmutter SI, Eaton RW, Fetz EE. Spike-timing-dependent plasticity in primate corticospinal connections induced during free behavior. Neuron. 2013;80:1301–1309. doi: 10.1016/j.neuron.2013.08.028. [DOI] [PMC free article] [PubMed] [Google Scholar]
- 22.Lemon RN. Descending pathways in motor control. Annu Rev Neurosci. 2008;31:195–218. doi: 10.1146/annurev.neuro.31.060407.125547. [DOI] [PubMed] [Google Scholar]
- 23.Friedli L, et al. Pronounced species divergence in corticospinal tract reorganization and functional recovery after lateralized spinal cord injury favors primates. Science translational medicine. 2015;7:302ra134. doi: 10.1126/scitranslmed.aac5811. [DOI] [PMC free article] [PubMed] [Google Scholar]
- 24.Courtine G, et al. Can experiments in nonhuman primates expedite the translation of treatments for spinal cord injury in humans? Nature medicine. 2007;13:561–566. doi: 10.1038/nm1595. [DOI] [PMC free article] [PubMed] [Google Scholar]
- 25.Yin M, et al. Wireless Neurosensor for Full-Spectrum Electrophysiology Recordings during Free Behavior. Neuron. 2014;84:1170–1182. doi: 10.1016/j.neuron.2014.11.010. [DOI] [PubMed] [Google Scholar]
- 26.Yakovenko S, Mushahwar V, VanderHorst V, Holstege G, Prochazka A. Spatiotemporal activation of lumbosacral motoneurons in the locomotor step cycle. J Neurophysiol. 2002;87:1542–1553. doi: 10.1152/jn.00479.2001. [DOI] [PubMed] [Google Scholar]
- 27.Rattay F, Minassian K, Dimitrijevic MR. Epidural electrical stimulation of posterior structures of the human lumbosacral cord: 2. quantitative analysis by computer modeling. Spinal Cord. 2000;38:473–489. doi: 10.1038/sj.sc.3101039. [DOI] [PubMed] [Google Scholar]
- 28.van den Brand R, et al. Restoring voluntary control of locomotion after paralyzing spinal cord injury. Science. 2012;336:1182–1185. doi: 10.1126/science.1217416. [DOI] [PubMed] [Google Scholar]
- 29.Courtine G, Bloch J. Defining ecological strategies in neuroprosthetics. Neuron. 2015;86:29–33. doi: 10.1016/j.neuron.2015.02.039. [DOI] [PubMed] [Google Scholar]
- 30.Shoham S, Halgren E, Maynard EM, Normann RA. Motor-cortical activity in tetraplegics. Nature. 2001;413:793. doi: 10.1038/35101651. [DOI] [PubMed] [Google Scholar]
- 31.Courtine G, et al. Kinematic and EMG determinants in quadrupedal locomotion of a non-human primate (Rhesus) J Neurophysiol. 2005;93:3127–3145. doi: 10.1152/jn.01073.2004. [DOI] [PubMed] [Google Scholar]
- 32.Fraser GW, Chase SM, Whitford A, Schwartz AB. Control of a brain-computer interface without spike sorting. J Neural Eng. 2009;6:055004. doi: 10.1088/1741-2560/6/5/055004. S1741-2560(09)06199-0 [pii] [DOI] [PubMed] [Google Scholar]
- 33.Hochberg LR, et al. Reach and grasp by people with tetraplegia using a neurally controlled robotic arm. Nature. 2012;485:372–375. doi: 10.1038/nature11076. http://www.nature.com/nature/journal/v485/n7398/abs/nature11076.html -supplementary-information. [DOI] [PMC free article] [PubMed] [Google Scholar]
- 34.Gilja V, et al. Clinical translation of a high-performance neural prosthesis. Nature medicine. 2015 doi: 10.1038/nm.3953. [DOI] [PMC free article] [PubMed] [Google Scholar]
- 35.Aflalo T, et al. Neurophysiology. Decoding motor imagery from the posterior parietal cortex of a tetraplegic human. Science. 2015;348:906–910. doi: 10.1126/science.aaa5417. [DOI] [PMC free article] [PubMed] [Google Scholar]
- 36.Milekovic T, Ball T, Schulze-Bonhage A, Aertsen A, Mehring C. Detection of Error Related Neuronal Responses Recorded by Electrocorticography in Humans during Continuous Movements. PLoS One. 2013;8:e55235. doi: 10.1371/journal.pone.0055235. [DOI] [PMC free article] [PubMed] [Google Scholar]
- 37.Marieb EN. Human Anatomy & Physiology Hardcover. 6th edition edn. Pearson Education; 2003. [Google Scholar]
- 38.Kuypers HGJM. Comprehensive Physiology. John Wiley & Sons, Inc; 2011. [Google Scholar]
Associated Data
This section collects any data citations, data availability statements, or supplementary materials included in this article.


