Abstract
Single-molecule fluorescence resonance energy transfer (smFRET) is a powerful technique for studying the conformation dynamics and interactions of individual biomolecules. In this review, we describe the concept and principle of smFRET, illustrate general instrumentation and microscopy settings for experiments, and discuss the methods and algorithms for data analysis. Subsequently, we review applications of smFRET in protein conformational changes, ion channel open-close properties, receptor-ligand interactions, nucleic acid structure regulation, vesicle fusion, and force induced conformational dynamics. Finally, we discuss the main limitations of smFRET in molecular biology.
Graphical Abstract
Introduction
Rapid advancements in single-molecule techniques have solved many fundamental biological questions in innovative ways.1–25 Single-molecule measurements reveal the functions, kinetics and conformation dynamics of individual biomolecular machineries in vivo and in vitro.1–35 Biomolecular dynamics and kinetics are often inhomogeneous and extremely difficult to directly characterize by ensemble-averaged spectroscopic imaging methods due to the presence of Avogadro’s number of molecules. Breakthrough discoveries with single-molecule sensitivity are still continuing in the areas of protein/nucleic acid folding-unfolding kinetics,36–38 molecular motors,39 gene expression,29–31,40,41 enzymology,32–35,42 protein-DNA interactions,26–28,43 protein-protein interaction,44 and nucleic acid dynamics.45,46 One of the most extensively applied single-molecule techniques in molecular biology is single-molecule fluorescence resonance energy transfer (smFRET). smFRET is an application of FRET wherein single donor and acceptor FRET pairs are excited and detected. smFRET has been broadly used to study conformational states and dynamics, intramolecular distances, and stoichiometry of different biomolecules.
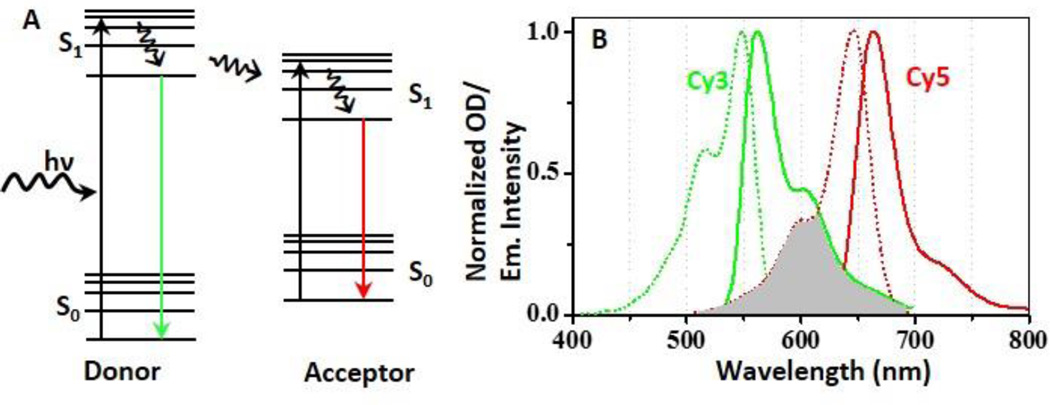
The main advantage of smFRET is the favorable distance for energy transfer, which is comparable to the size of a protein or the thickness of a lipid membrane. Whether or not FRET occurs is dependent on the absorption and emission spectra and the distance between two adjacent fluorophores. The extent of FRET can be predicted from the spectral overlap integral (Fig. 1) of the steady-state emission spectrum of a donor (D) and the absorption spectrum of an acceptor (A). The distance (r) between a donor and an acceptor determines the efficiency of energy transfer. FRET is favorable when the donor-acceptor distance is within a 1–10 nm range, permitting the use of smFRET as a “spectroscopic ruler”.19,20,47 Additionally, smFRET can reveal dynamic equilibrium information through the use of correlation function analysis. Thus, smFRET assays are usually designed based on the sizes and structural features of individual molecules. Conformational changes and dynamics of the molecules are obtained by calculating the energy transfer efficiency and the relative fluorescence intensity fluctuation of single donor and acceptor FRET pairs. To date, smFRET assays have been used to study protein folding-unfolding, protein conformation dynamics, ion channel dynamics, receptor-ligand interactions, nucleic acid structure and conformation, vesicle fusion, and force induced conformational changes.
Fig. 1.
A. Simplified Jablonski diagram for fluorescence resonance energy transfer. Solid lines represent rapid electronic transitions, and curved line represents excitation and energy relaxation or transfer. A FRET donor is excited from its ground state (S0) to an excited state (S1) by a photon of energy hν. The excited donor then returns to the ground state by emitting a photon of lower energy (i.e. green fluorescence signal) and donates its energy to a nearby acceptor by dipole-dipole interaction. The excited acceptor then similarly emits a photon (red). B. Excitation (dotted line) and emission spectra (solid line) of a Cy3 (green) and a Cy5 (red) respectively. To trigger efficient FRET, the emission spectrum of the donor (Cy3) should overlap considerably with the absorption spectrum of the acceptor (Cy5), as indicated by the grey color. Data in Fig. B are obtained from the spectral database at the University of Arizona and plotted by OriginPro software.
There are three main requirements for performing smFRET experiments. First, biomolecules must be site-specifically labeled with donor and acceptor fluorophores located within close proximity, as determined by their Förster distance. Second, the molar concentration must be low enough so that only one molecule presents at a time in the observation volume, which is determined by the confocal volume of the focused laser beam Third, the observation volume should be very small in order to increase signal to noise ratio (S/N).48 Typically, biomolecules of interest are either immobilized on a surface or dissolved in solution depending upon experimental purposes.
In this review paper, we will summarize the theory and concept of smFRET, briefly describe the experimental setup and relevant data analysis for a typical smFRET experiment, review major biological applications, and conclude with discussion on existing limitations and future applications of this technique.
Principle of smFRET
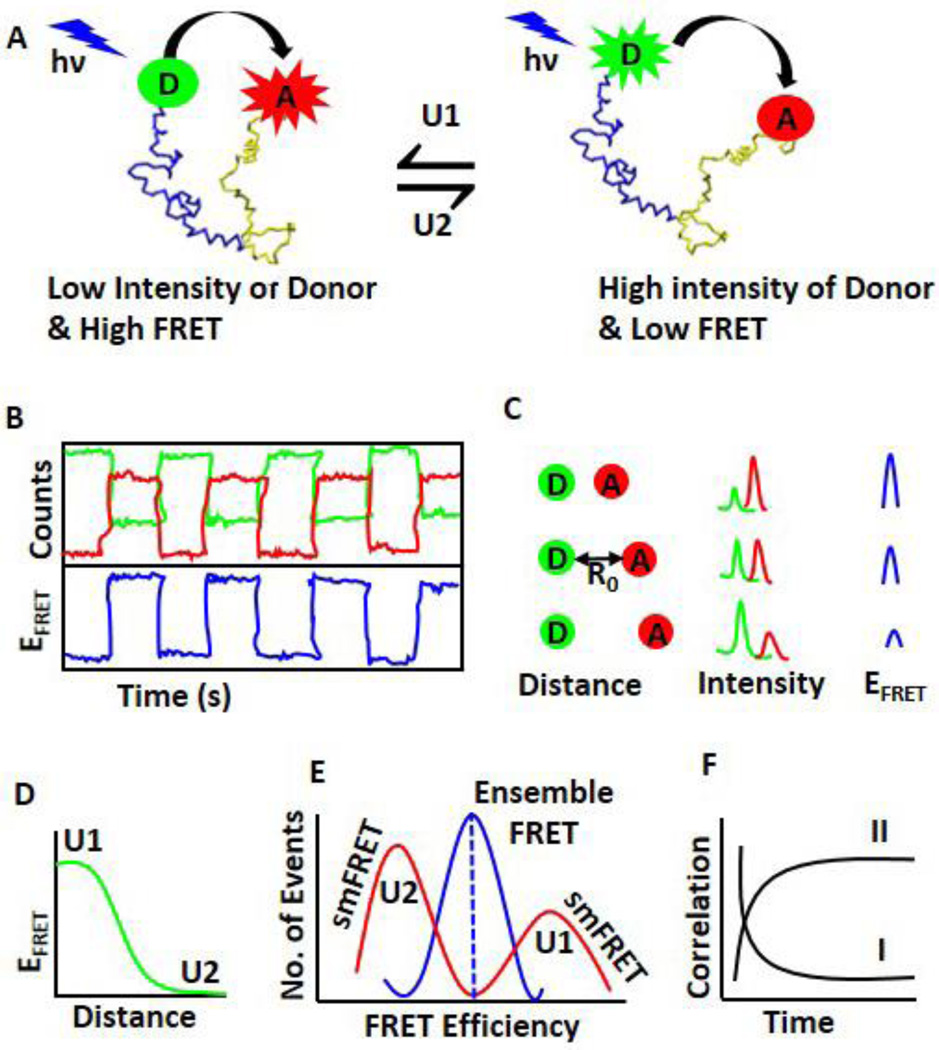
FRET is a non-radiative energy transfer process from a donor to an acceptor, arising from a dipole-dipole interaction between the electronic states of donor and acceptor (Fig. 1). Energy transfer occurs when the oscillations of an optically induced electronic coherence of the donor are resonant with the electronic energy gap of the acceptor.49 Although FRET is not necessarily accurate in measuring absolute distances, it is often specified as a “spectroscopic ruler”.47,49 smFRET is sensitive enough to probe the temporal fluctuation dynamics of distance, such as the conformational changes of biomolecules (Fig. 2). A quantitative relationship between EFRET and inter-distance (r) is represented in the theory developed by Theodor Förster in 1940. According to Förster’s theory, efficiency of FRET (EFRET), for the dipole-dipole coupling between a donor and an acceptor chromophore is,47,50
| (1) |
where r is the distance between a donor and an acceptor. R0 is the distance between the donor and the acceptor at which energy transfer is 50%. R0 is defined as Förster distance and is expressed by the following equation,
| (2) |
where n is the refractive index of the medium (~1.4 for biomolecules in water),50 QD is the quantum yield of the donor in the absence of the acceptor, κ2 is the orientation factor, and J(λ) is the spectral overlap between the steady state donor emission and the steady state acceptor absorption (Fig. 1B). J(λ) is related to the normalized fluorescence intensity (ID) of the donor in the absence of the acceptor and the extinction coefficient of the acceptor (εA) as follows,50
| (3) |
The value of κ2 in Equation 2 may vary from 0 (mutually perpendicular transition dipoles) to 4 (collinear dipoles). For κ2 = 0, FRET is forbidden. Estimation of the upper and lower limit of κ2 is derived from the steady state fluorescence anisotropy and the initial value of anisotropy (r0) obtained in the time-resolved anisotropy measurement as,50
| (4) |
| (5) |
where denotes the ratio of the square root of the steady-state fluorescence anisotropy and the initial value of anisotropy in the anisotropy decay of the ith species (donor or acceptor). The distance calculated using the Förster model is found to vary only about ≤ 20% in the value range of values of κ2. Therefore, κ2 = 2/3 (random orientation) is used for the calculation of R0. In general, the orientation factor κ2 is given by Equation 6, in which θT is the angle between the donor emission transition dipole and the acceptor absorption transition absorption dipole, θD is the angle between the donor-acceptor connection line and the donor emission dipole, and θA is the angle between the donor-acceptor connection line and the acceptor absorption dipole.
| (6) |
According to equation 1, the transfer efficiency EFRET can be used to measure the distance between a donor and an acceptor. EFRET from a donor to an acceptor reflects mutual distance changes, thus enabling to probe single-molecule conformational dynamics in real time by monitoring EFRET fluctuations for biomolecules.47,50 Detection of EFRET, usually by ratiometric methods, is generally classified as intensity-based FRET (Equation 7) or lifetime-based FRET (Equation 8).
| (7) |
| (8) |
where IA is the acceptor fluorescence intensity; ID is the donor fluorescence intensity; ϕA and ϕD are the respective emission quantum yields of acceptor and donor dyes, and ηA and ηD are also the respective the acceptor and donor detection efficiencies. Here, the correction factor (ϕA × ηA)/(ϕD × ηD) is ~1 in most experiment conditions. The histogram of EFRET trajectory gives the average EFRET. τDA and τD are donor lifetime in the presence and absence of the acceptor, respectively.50 FRET detection on the basis of donor lifetime is more effective and less sensitive to local environmental fluctuations.50 However, the intensity fluctuations of donor and acceptor are generally imaged by an electron multiplying charge coupled device (EMCCD) at the same time and FRET efficiency can be calculated using the intensity method (Equation 7).
Fig. 2.
smFRET to study conformational dynamics of individual molecules. A. A representative molecular conformation change and corresponding FRET efficiency. A donor (D, green) and an acceptor (A, red) are covalently attached at two ends of a biomolecule. In one conformation seen on the left (U1), the distance between the donor and the acceptor is very short and thus the FRET efficiency is high (Equation 1). Experimentally, low intensity of the donor and very high intensity of the acceptor are observed. For the conformer on the right (U2), the distance between the donor and the acceptor is large, and consequently the FRET efficiency is very low. The intensity of the donor will be high and the intensity of the acceptor will be low. B. A representative diagram of the intensity fluctuations (top panel) of the donor (green), acceptor (red), and corresponding FRET efficiency (blue, bottom panel). C. The distance between the donor and the acceptor is crucial for efficient FRET (Equation 1). The distance (left column) and its corresponding donor and the acceptor intensities (middle column) as well as FRET efficiency (right column) are shown here. The distance at which the energy transfer efficiency is 50% called as Förster distance (R0). D. The relationship between FRET efficiency and D-A distance. The high FRET efficiency corresponds to the conformer U1, and the low FRET efficiency corresponds to the conformer U2. E. Difference between smFRET and ensemble FRET. smFRET can distinguish two different conformers using FRET efficiency, but ensemble FRET can only give an average value. F. The dynamics is determined by the statistical analysis of autocorrelation (I) and cross-correlation (II) of time-trace of fluctuations of the donor and the acceptor.
Experimental setup and data acquisition
To measure conformational changes or intermolecular interactions using smFRET, the molecules of interest are labeled with specific donor and acceptor fluorophores (Fig. 2A). An ideal fluorophore is stable under high photon flux, has both high molar absorptivity and fluorescence quantum yield, and undergoes minimal “blinking” (as noted by spontaneous excursions into non-fluorescent states). Such fluorophores are generally small (<1 nm) organic molecules, the two most common being cyanine dyes Cy3 and Cy5, although Alexa Fluor and ATTO dye series are comparable. Quantum dots and fluorescent proteins can also be used for smFRET, but their implementation is more difficult because of their large size. To ensure the occurrence of FRET, fluorophore positioning should be carefully chosen such that the distance between a donor and an acceptor is within the Förster radius.47,51–54
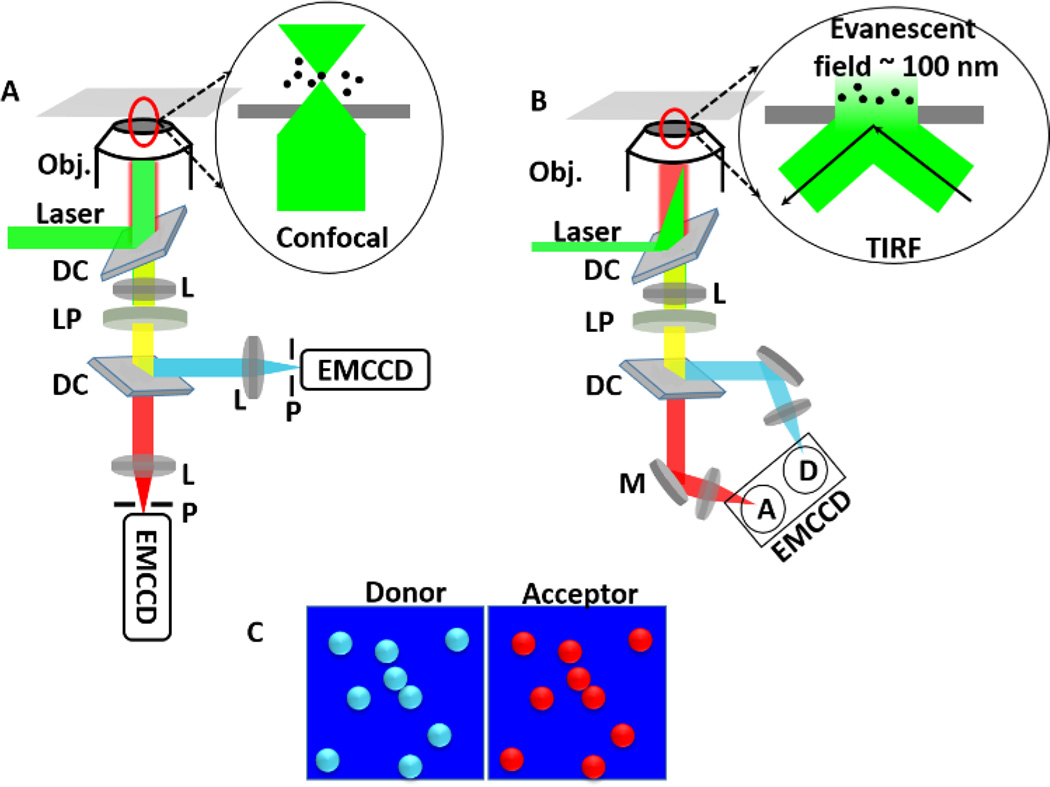
There are two types of experimental smFRET setups. The first setup consists of a confocal microscopy system (Fig. 3A) that uses a continuous wave (CW) or a pulsed laser as the light source for sample excitation. The second type of experimental setup utilizes objective type total-internal reflection (TIRF) microscopy (Fig. 3B). The TIRF microscope setup is unable to image beyond 100 nm from the interface of the sample and coverslip. However, confocal microscopy can image beyond 100 nm. The advantage of a laser scanning confocal microscope is the ability to scan a sample throughout different z-positions and thus serially produce thin (0.5–1.5 µm) optical sections. Additionally, the presence of pinholes in the setup eliminates the fluorescence signal above and below the focal plane, thus increasing the S/N ratio. Two main downsides of confocal microscopy are the effect of high-power laser irradiation into live cell sample, and the slow speed of piezo scanner. For TIRF, the S/N ratio is better than a confocal setup. TIRF is achieved by aligning a thin beam of laser above the critical angle. TIRF microscopy reduces background fluorescence by selectively illuminating a restricted region of the specimen immediately adjacent to the glass-water interface with a depth of ~100 nm (Fig. 3B).47 To facilitate measurements, some TIRF experiments immobilize the molecules of interest at the illuminated interface, which is usually achieved via specific high-affinity binding such as the streptavidin-biotin interaction. To resolve single-molecules, molecules must be diluted (in nM to pM), and then immobilized on glass surface with a density of no more than ~0.2 molecules µm−2.47 Surface immobilization has the added benefit of allowing continuous observation of the targeted molecule from several seconds to minutes, or even hours in the presence of oxygen-scavengers. Nonetheless, TIRF can also image smFRET events in the live cell membrane without immobilization. Lastly, the laser is focused on the sample for confocal experiment and the fluorescence signal from the sample is transmitted back through the same objective and passed through a long-pass filter. There are two common ways to detect FRET signals. In the first method, a dichroic splits the donor and acceptor signals, both of which are then reflected by a mirror and can subsequently be focused onto two separate regions of a single EMCCD (Fig. 3B). Alternatively, the two signals can be separated by dichroic, focused and recorded by two different APDs (Fig. 3A).
Fig. 3.
A. smFRET in confocal microscopy. Laser is reflected by a dichroic mirror and then focused to sample by an objective (Obj.) with a high numerical aperture (NA). The fluorescence signals from donors and acceptors are passed through a long-pass filter (LP) and then split by a dichroic (DC) into two different channels. Both signals are focused to two separate APDs by lens (L). Before APDs, there are two pinholes (P) to reduce fluorescence signal originated from above and below of the focal plane. Inset is showing the configuration of excitation laser on the sample. B. smFRET in objective type total internal reflection fluorescence microscopy (TIRF), which exploits the unique properties of an induced evanescent wave or field in a limited specimen region (~100 nm) immediately adjacent to the interface between two media having different refractive indices. Fluorescence signals from donors and acceptors are focused on same EMCCD. Inset shows the configuration of the laser on the sample. C. Donor and acceptor data are recorded simultaneously and shown in cyan and red respectively.
For a three-color smFRET setup, the acceptor signals are further separated by a dichroic and imaged by detectors.36 Depending on the spectral overlap integral and inter-distance between the donor and two acceptors, the energy transfer mechanism can be either a three-color general scheme or a cascade scheme.47 In the general scheme, energy from the donor is transferred to both acceptors. Depending on distance, the high-energy acceptor relays energy to the low-energy acceptor. In the cascade mechanism, intermediate energy acceptor transfers its energy to the low-energy acceptor.47 A three-color smFRET method was developed to understand the complex conformation dynamics of a four-way Holliday junction molecule by using Cy3 (donor), Cy5 (acceptor 1), and Cy5.5 (acceptor 2) (see Fig. 9C for details).36 Three color smFRET experiments are also reported on both TIRF and confocal microscopy using Cy3 (Donor), Cy5 (acceptor 1), and Cy7 (acceptor 2) to directly observe DNA conformation dynamics for a long time.55
Fig. 9.
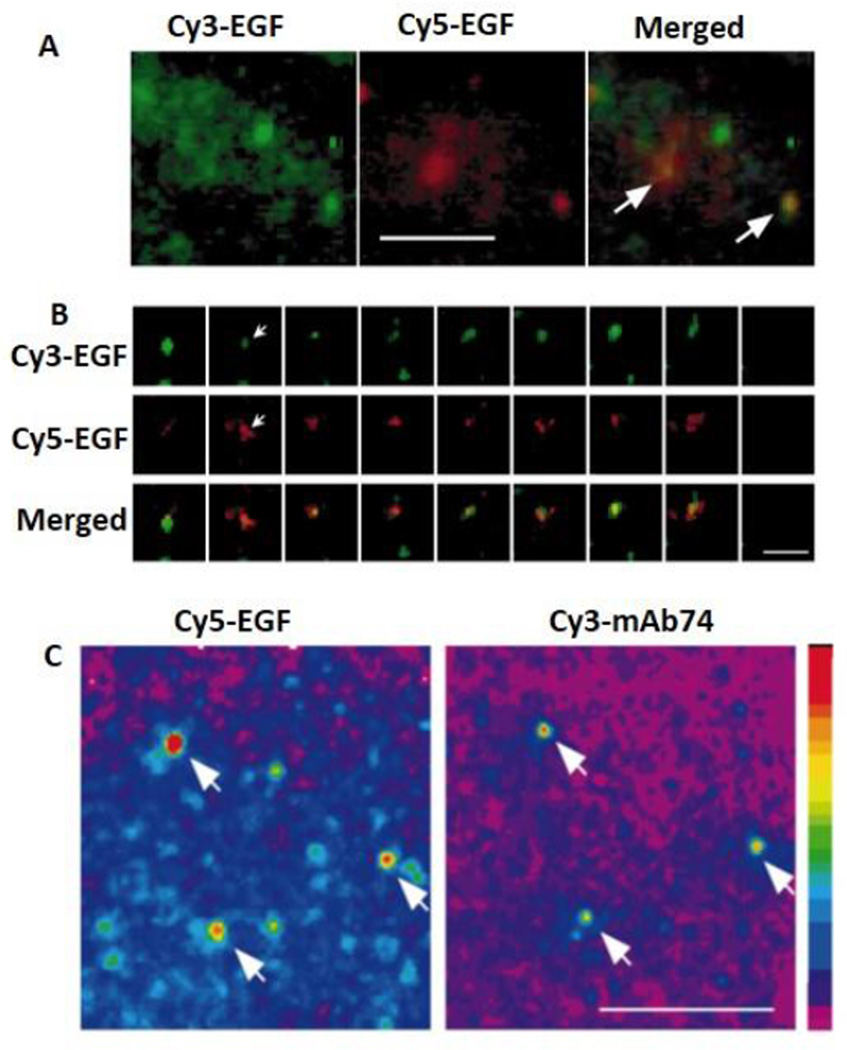
Probing receptor-ligand interactions in live cell by smFRET. A. A mixture of Cy3-EGF and Cy5-EGF was added to the cells expressing EGFRs. Fluorescence images of Cy3 and Cy5 are recorded simultaneously. Fluorescence of Cy5 is resulted from FRET from Cy3 to Cy5 (arrows). B. Top three rows show the changes of fluorescence intensities of single Cy3 and Cy5 over time (arrow). Bottom row shows the normalized fluorescence intensities of Cy3 and Cy5 plotted against time. Anti-correlation between Cy3 and Cy5 fluorescence intensities indicates FRET from Cy3 to Cy5. C. EGFR phosphorylation induced by EGF binding. A431 cells were perforated and stimulated with Cy5-EGF. Phosphorylation of the EGFR was detected by the binding of Cy3-mAb74. Arrows indicate the co-localization and FRET between Cy3-mAb74 and Cy5-EGF. Scale bar represents 10 µm. Figures are reprinted by permission from Macmillan Publishers Ltd: Nature Cell Biology, Sako, Minoghchi, & Yanagida, 2000.95
Data analysis
Extracting and analyzing smFRET events from raw imaging data requires: (I) locating and matching corresponding donor and acceptor signals in the field of view (Fig. 3C); (II) determining the fluorescence time-traces of each donor with its corresponding acceptor (Fig. 2B); (III) determining the FRET efficiency histogram (Fig. 2E) from the time trace (Fig. 2B) for each molecule throughout the entire recording time using Equation 7; and (IV) calculating conformation dynamics from the auto-correlation and cross-correlation analysis (see example in Fig. 2F). Since the donor and acceptor channels of the EMCCD image do not typically have a linear correspondence, they are generally mapped using a high-order polynomial transformation to ensure correct assignment of donor-acceptor pairs. Typically, fluorescent beads are used as a reference to calibrate both channels. A fluorescent bead has a wide range of emission spectrum and thus it can be imaged in both donor and acceptor channels on the same EMCCD.
FRET efficiency (EFRET) is calculated using Equation 7 (see Fig. 4 & 6 as examples). The correction factor depends on the relative quantum yield (ϕ) and photon detection efficiency (η) of the donor and acceptor. If the Förster radius is known, and if anisotropy of both donor and acceptor fluorophores can be ruled out, EFRET can be used to calculate absolute distances according to Equation 1. If not, EFRET still gives an estimation of the relative change in distance between a donor and an acceptor. EFRET vs time (t) trace mostly depends on sample properties. Typically, a low S/N ratio makes it difficult to determine the number of different FRET states for a given molecule. To facilitate the assignment of FRET states (Fig. 2E), Hidden Markov Modeling (HMM) or nonlinear filters are applied for data analysis.37,47,56–60 FRET efficiency are usually generated from the time traces of hundreds of molecules obtained at the same condition and then histogram is fitted with single or multiple peak Gaussian function (Fig. 2E) to estimate the number of states (or intermediate states). From these distributions, information can be gained about the equilibrium properties (Fig. 2A) as well as conformation states of the molecule (Fig. 2E). If data are recorded directly by separated APDs (Fig. 3B), anti-correlation properties of the two signals are readily seen from the time trace intensity fluctuations between a donor and an acceptor. In this case, FRET efficiency is also calculated using Equation 7 from the fluorescence time trajectories of the donor and the acceptor.
Fig. 4.
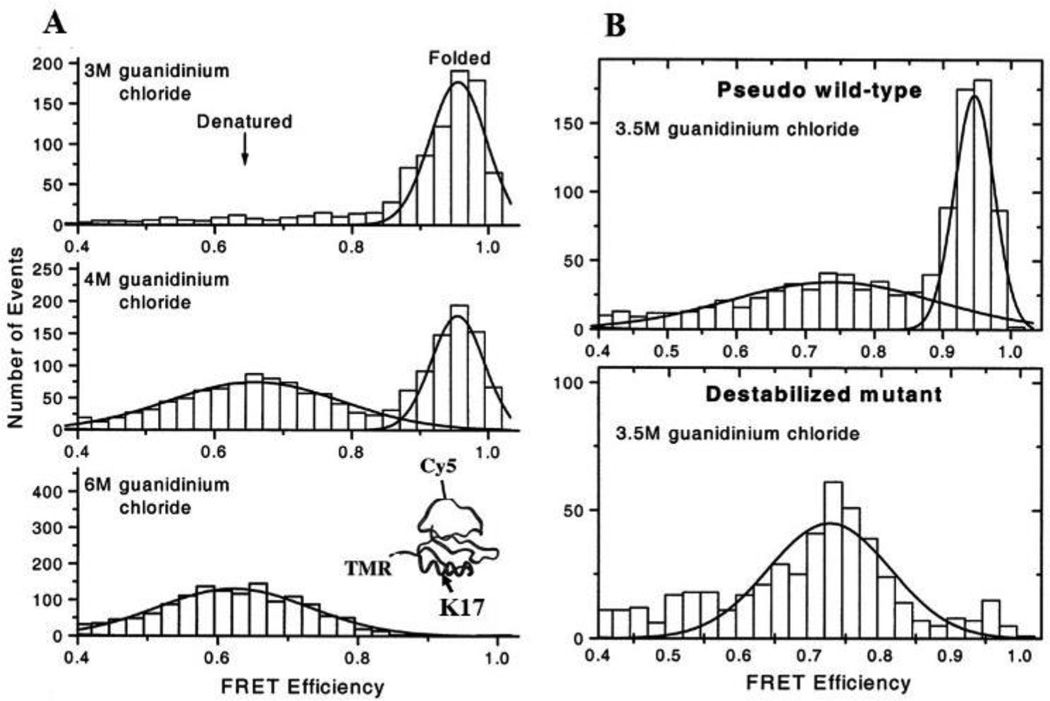
Protein folding-unfolding in solution as measured by smFRET assays. A. smFRET histograms at 3 (top), 4 (middle), and 6 (bottom) M of guanidinium chloride. The structure of chymotrypsin inhibitor 2 and the labeling sites of fluorescent dyes (TMR, Cy5) and a mutation site (K17) are shown in inset (bottom). B. FRET histogram comparison of a pseudo wild-type and a destabilized mutant CI2 (K17G) in the presence of 3.5 M guanidinium chloride. Solid lines show Gaussian fits to the distribution of FRET efficiency. Fig. A and B are adopted and reprinted from Deniz et al., 2000 with permission.51 Copyright (2000) National Academy of Sciences, U.S.A.
Fig. 6.
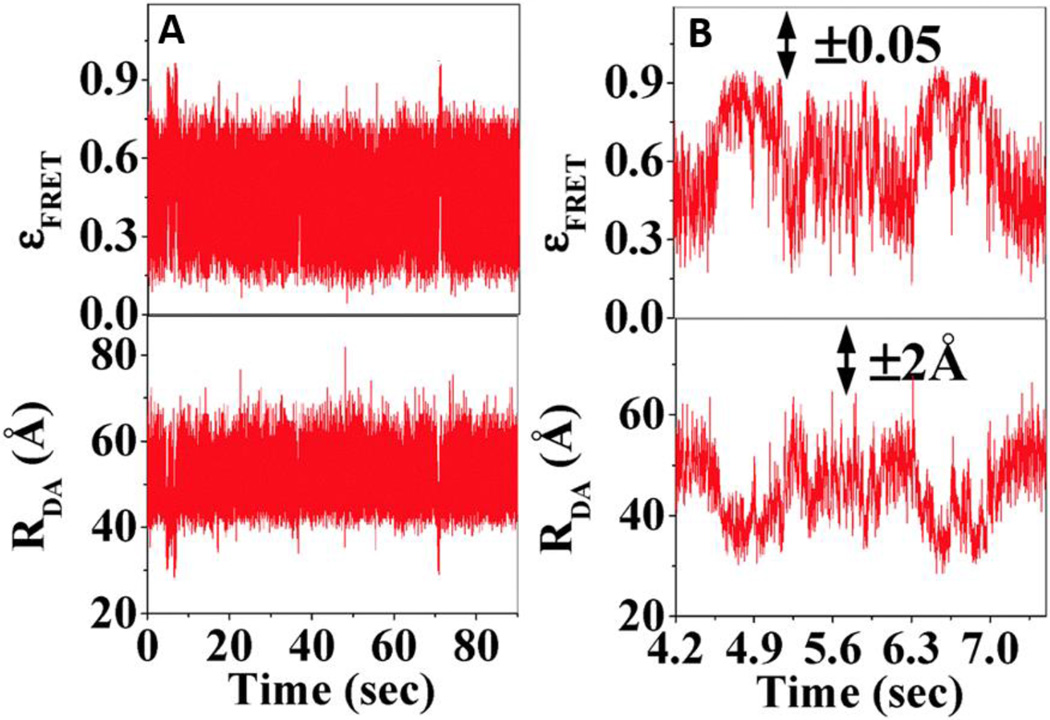
Time-dependent fluctuations of smFRET efficiency (upper panels) and donor-acceptor distance (lower panels) of antigen-antibody complex (EGFP-Mal3 and Alexa-568-Tubulin). Fig. 6B shows zoomed-in scale of Fig. 6A. Figures are reproduced from Mandal et al. with permission.85 Copyright (2015) Royal Society of Chemistry.
Finally, the cross-correlation and auto-correlation functions are used to determine the dynamics of conformational changes (Fig. 2F).42,49 In some experiments, intensities of donors and acceptors are recorded in terms of the polarization. To obtain the total intensities of donors or acceptors, the fluorescence intensities of parallel polarization and perpendicular polarization are added.50 Finally, two channel donor {ID(t)} and acceptor {IA(t)} intensity trajectories are obtained. Typically, single-molecule donor and acceptor fluorescence intensity fluctuation trajectories involve anti-correlated intensity fluctuations resulting from FRET (Fig. 2B). Correlation function analysis, including second-order autocorrelation function and cross-correlation function are calculated from two bands of intensity fluctuation time trajectories {ID(t)} and {IA(t)}.42,49 The correlation time between {ID(t)} and {IA(t)} is calculated by auto-correlation function Cauto(t) and cross-correlation function Ccross(t):
| (9) |
When IA(t) = ID(t), we have the autocorrelation function:
| (10) |
Where IA(t) and ID(t) represent the signal variables measured in time trajectories {IA(t)} and {ID(t)}. 〈IA〉 and 〈ID〉 are the means of the fluctuation trajectories of {IA(t)} and {ID(t)}, respectively. {IA(t)} and {ID(t)} are the time trajectories of fluorescence photon counts or intensities (see Fig. 5 for example of this analysis).
Fig. 5.
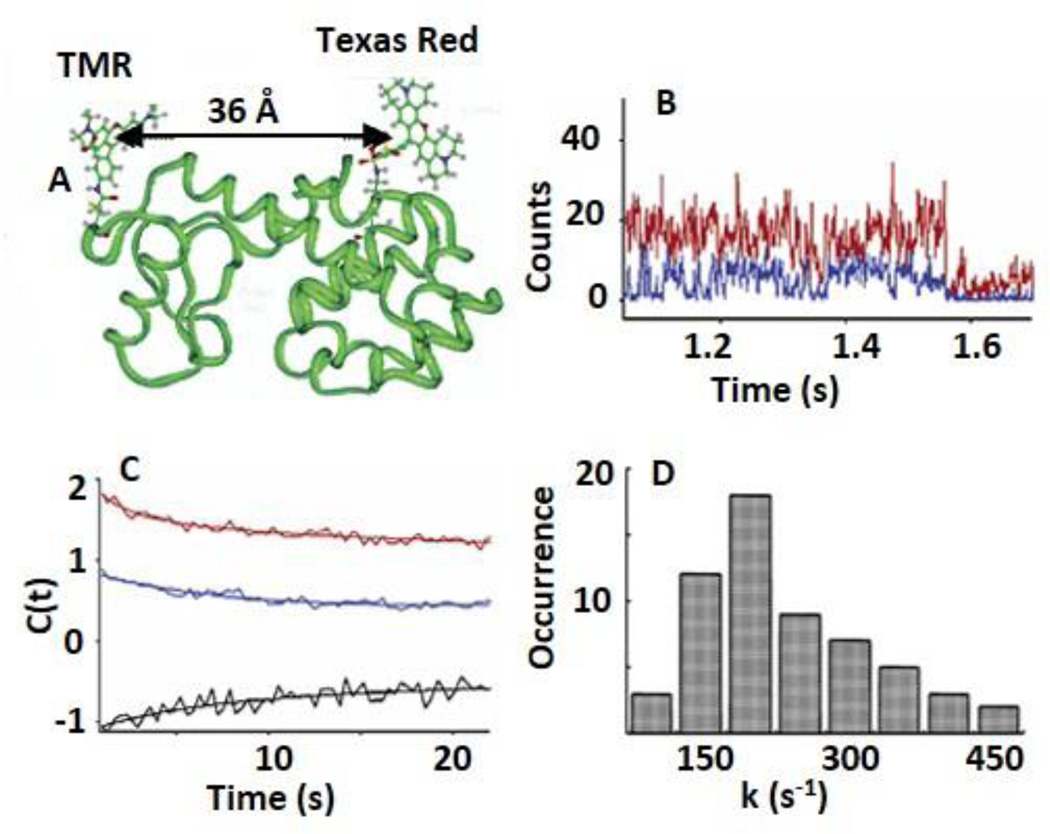
smFRET to probe conformational dynamics of T4 lysozyme in real time. A. Schematic structure of a T4 lysozyme site-specifically labeled with a TMR and a Texas Red fluorophores. B. Single-molecule fluorescence intensity time trajectories of a TMR (FRET donor, blue) and Texas Red (FRET acceptor, red) that reveal conformational dynamics and enzymatic reaction turnovers of hydrolysis of an E. coli cell wall. Anti-correlated fluctuation features are visible. C. Auto-correlation functions (C(t)) of the donor (〈ΔId(0)ΔId(t)〉, blue) and the acceptor (〈ΔIa(0)ΔIa(t)〉, red), and cross-correlation of donor-acceptor (〈ΔId(0)ΔIa(t)〉, black) deduced from the single-molecule trajectories in (B). Both decays are fitted with bi-exponential functions with same decay rate constant of 180 ±40 s−1 and 10 ± 2 s−1. A long decay component is evident in each auto-correlation function, which should attribute to the thermal fluctuation of T4 molecules. D. Distribution of decay rate constants derived from donor intensity auto-correlation functions. Figures are reproduced with permission from Chen et al., 2003.81 Copyright (2003) American Chemical Society.
Applications of smFRET
Protein folding
smFRET has been used to study protein folding including conformational dynamics, equilibrium properties and intermediate structures of proteins.61–69 Schuler et al. used smFRET to investigate a small fast-folding cold-shock protein (CspTm), and demonstrated that CspTm folding shows a continuous, non-cooperative decrease of EFRET at increasing concentrations of denaturant. They described the solvent-dependent chain contraction of CspTm using multiple FRET-pair labels on different parts of the protein, as an isotropic transition, suggesting that the collapse of this protein is a nonspecific process, and is evenly distributed across the polypeptide chain.70
Deniz et al. reported one of the earliest single-molecule protein folding (Fig. 4) experiments that studied folded and denatured subpopulations of a single domain, freely diffusing chymotrypsin inhibitor 2 (CI2).51 Protein folding properties were directly monitored as a function of concentration of the denaturant, guanidinium chloride. The distribution of EFRET was measured as a function of guanidinium chloride concentration and supported a two-state folding mechanism. Two peaks (EFRET = 0.65 and 0.95) were observed using 4M guanidinium chloride (Fig. 4A), and only a peak (EFRET = 0.65) was detected using 6M guanidinium chloride (Fig. 4A). The ratios between the two peaks varied with the concentration of guanidinium chloride in the range of 4–6 M. The 0.95 and the 0.65 peaks represent the folded and denatured states of the CI2 protein, respectively. Calculations of subpopulations of a pseudo wild-type and a destabilized mutant of CI2 supported their assumption of a two-state folding mechanism (Fig. 4B).
There are multiple factors that can affect the conformation dynamics of a protein such as solvent viscosity and dye solvation. It is important to deconvolute the variations of those properties for a protein in both native and unfolded states. This may explain the contribution of orientation factor (κ2) and dynamic fluctuation of distance. In this study, fluorescence signal is collected from freely diffusing protein molecules in solution. The times required for diffusion and conformation change are both in millisecond level. A better experiment for understanding the conformation dynamics would be simultaneous measurements of fluorescence polarization and lifetime of FRET pair (equation 8) of protein at immobilized condition, which will allow continuous observation of a targeted molecule with high throughput data sampling.47
Protein conformational dynamics
smFRET assays have been widely used to determine complex conformational heterogeneity and structural dynamics of biomolecules including protein, DNA, or RNA in vivo and in vitro.71–80 Here, T4 lysozyme is used as an example to illustrate the conformational dynamics of biomolecules. T4 lysozyme is an enzyme composed of two domains connected by an α-helix (Fig. 5A) with an active site positioned in the middle. T4 lysozyme catalyzes the hydrolysis of polysaccharide chains found in E. coli cell wall matrices. During catalysis, the two domains undergo hinge-bending motions that are coupled with substrate binding. Lu and colleagues applied smFRET to study the conformational dynamics of T4 lysozyme performing hydrolysis reactions.81 They attached a FRET donor-acceptor pair, tetramethylrhodamine (TMR) and Texas Red, to site-specifically label the cysteine amino acids Cys54 and Cys97 of the enzyme respectively. With this arrangement, the inter-distance between TMR and Texas Red can directly report the hinge bending motions of the two lysozyme domains (Fig. 5A). With a Förster radius of 50 Å for the TMR and Texas Red FRET pair and a distance of 36 Å between Cys54 and Cys97 (Fig. 5A), the energy transfer from TMR to Texas Red sensitively shows the inter-distance changes resulted from the enzyme conformational dynamics. Following the determination of T4 lysozyme conformational dynamics, Lu and coworkers used confocal fluorescence microscopy to monitor real-time FRET between the two probes on a single T4 lysozyme molecule.81 Fluorescence intensities of the donor and the acceptor on the T4 lysozyme show large anti-correlated fluctuations in the presence of the substrate (i.e. E. coli cell wall) (Fig. 5B). By analyzing the autocorrelations of the fluorescence intensity trajectories, the authors determined the reaction rate constants of the conformational dynamics for the T4 lysozyme at the single-molecule level (Fig. 5C). Overall, the first-order rate constants showed large static heterogeneity in the distribution (Fig. 5D), indicating the widely varying dynamic properties of individual T4 molecules. The large static heterogeneity may be a result of the enzyme searching for reactive sites on the substrate. Besides smFRET assays, single-molecule fluorescence correlation spectroscopy (FCS) and fluorescence cross-correlation spectroscopy (FCCS) can also be used to sensitively evaluate the dynamics and interactions of biomolecules.48,82
The combination of single-molecule energy transfer and statistical analysis have also identified a complex relationship between the protein conformation dynamics and enzymatic reaction.83 The conformation dynamics suggest that the enzymatic catalysis involves multistep conformational motions along the reaction coordinate of enzyme-substrate complex formation and product release.83 The time trajectories of donor and acceptor intensities show similar intermittent temporal coherence frequencies as evidenced by their coherence feature from auto-correlation and cross-correlation. To understand the internal structural oscillations, Bhattachrayya’s group used fluorescence correlation spectroscopy to determine the conformational relaxation time of an antibody and an antibody-antigen complex that are 83 µs and 240 µs respectively.84,85 This indicates that the antibody alone is more flexible than the antigen-antibody complex. Time dependent smFRET efficiency fluctuations of antigen-antibody complex show a broad range from 0.2 to 0.9, corresponding to distance fluctuates from 2 to 7.5 nm.84,85
Ion channel dynamics
Mechanosensitive channels of large conductance (MSCL) are present in bacterial membranes where they detect increased mechanical stress and relieve pressure in the cell by transitioning into an open state. MSCLs are a homo-pentamer made of five proteins, each of which consists of one cytoplasmic α-helix and two transmembrane α-helices (TM1 and TM2). TM1 and TM2 are primarily responsible for opening and closing the MSCL channels.
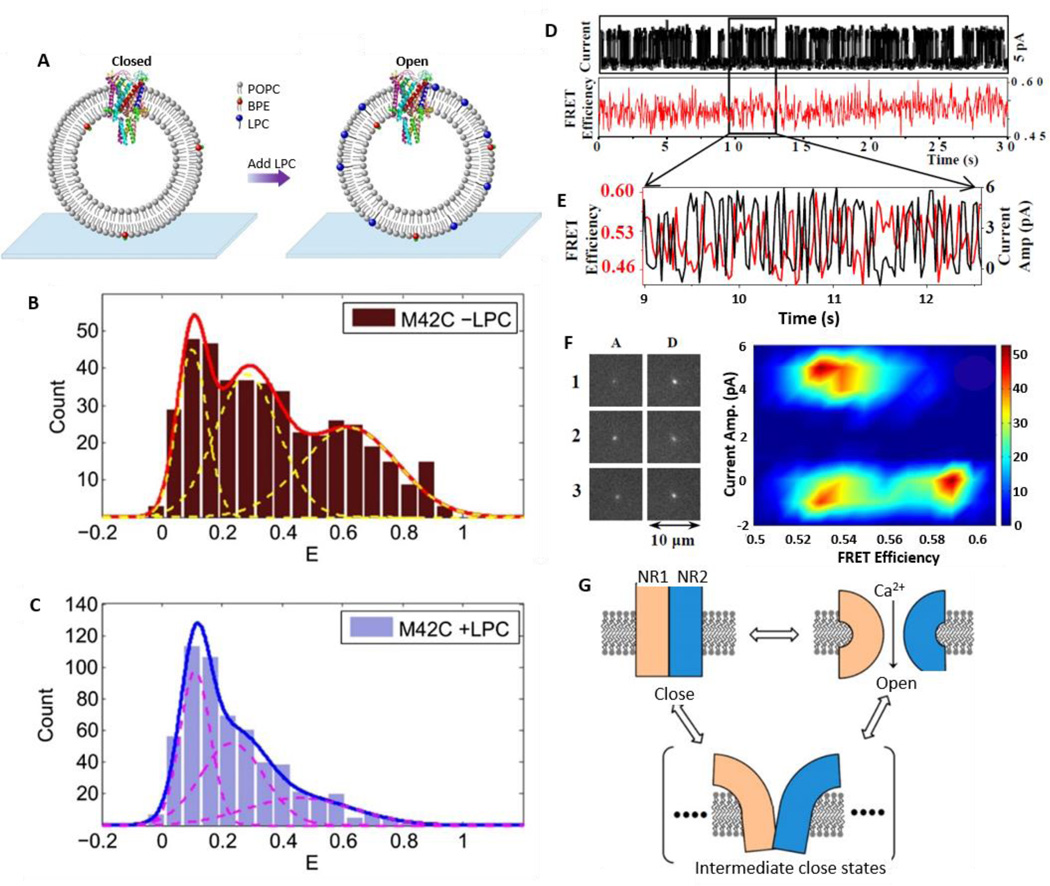
Recently, Selvin and colleagues used smFRET to study the pore size and opening mechanism of the MSCL (Fig. 7A–C).86 Purified MSCL was reconstituted in a lipid vesicle and each channel was site-specifically labeled with a donor (Alexa Fluor 488) and an acceptor (Alexa Fluor 568). Given that the MSCL is a homo-pentamer, photobleaching was used to sort out single donors and acceptors in order to perform smFRET measurements. Lysophosphatidylcholine (LPC) was added to trap the ion channel protein in the open state conformation (Fig. 7A). In the absence of LPC, the FRET efficiencies showed three peaks, rather than two peaks, which can be explained by the effect of tethering on the liposome. As the MSCL is a homo-pentamer, two peaks for the distribution of FRET efficiency would be expected given that there are two distances between the donor and acceptor in two different states, assuming that all the channels are closed in the absence of LPC. However, this assumption is not necessarily true, especially in the situation where liposomes are immobilized and proteins are responsive to membrane tension. Immobilization on a glass surface ruptures giant unilamellar vesicles spontaneously. Consequently, some MSCL would switch to the open conformation upon liposomal immobilization. Therefore, the FRET histogram for channels without LPC includes a mixture of closed and open MSCL channels (Fig. 7B). In the presence of LPC, the third peak (the highest EFRET) is diminished and only two main peaks (EFRET = 0.1 and 0.23) are observed because LPC arrests the ion channel in an open conformation (Fig. 7C). The two EFRET peaks may be due to two different open conformational states of ion channel. Meanwhile, the diameter of the MSCL channel was found to be ~2.8 nm, as derived from the calculated distance between the donor and acceptor. Although this work characterized the size and conformation of ion channels, it did not correlate with the physiological function of ion channel in cell signaling.
Fig. 7.
smFRET to probe structure and conformational dynamics of ion-channels. A. Mechanosensitive ion-channel in lipid vesicle that is immobilized on coverslip. The addition of LPC lipid molecule changes the conformation of MSCL from a closed state to an open state. B–C. smFRET efficiency histogram in absence (B) and presence (C) of LPC lipid. D–G. Correlated measurements of smFRET signal and patch-clamp current to study the structure dynamics of single ion-channels. D. Correlated current fluctuation and smFRET efficiency of a single NMDA receptor ion channel. E. Anti-correlation behavior between FRET efficiencies (red) and current (black). F. Fluorescence images of an acceptor (A) and a donor (D) at fully open (1, 3) and closed states (2) (left panel) and a 2D density plot of the smFRET efficiency versus the current amplitude (right panel). Low FRET efficiency is observed when ion channels are in a fully open state, and high FRET efficiency is observed when ion channels are in a fully closed state. In addition to the fully open and close states, there are multiple intermediate close states that also show low FRET efficiency (around E = 0.52). G. Proposed multistate clamshell model of NMDA receptor ion channel dynamics indicating the presence of a non-conducting ion channel. There are intermediate conformational states that constitute the electrically off states in addition to fully open and fully close states in the conformational dynamics. Panels A–C are reproduced from Wang et al., 2014.86 Panels D–G are reproduced from Sasmal & Lu, 201488 with permission, copyright (2014) American Chemical Society.
smFRET alone may not be enough to elucidate the relation between ion channel dynamics and cell signaling. Therefore, correlated measurements of single channel current by patch clamp and conformation change by smFRET have been used to study single ion channels. Lu and co-workers previously reported the existence of multiple intermediate states of gramicidin ion channels in artificial membranes using smFRET and single-channel patch-clamp current measurements.87 Recently they also developed a new approach called single-molecule patch-clamp FRET microscopy to study the conformational dynamics of individual N-methyl-D-aspartate (NMDA) receptor ion channels in living cells (Fig. 7D–G).88,89 Simultaneous measurements of single-channel current and smFRET provide information on the intermediate conformational states of ion channels. To quantitatively resolve the relationship between ion channel conformations and the electrical states of a single ion channel, EFRET was plotted versus current amplitude trajectories (Fig. 7F, right). It is evident that the FRET efficiency is low (0.45–0.54) when the ion channel is in an open state, and the distance between the two subunits is large (~55 Å). FRET efficiency is relatively high (0.54–0.60) when the ion channel is in a closed state and the distance between the subunits is very short (~48 Å). In addition to fully open and fully closed states, there are multiple other closed states that show low FRET efficiencies (Fig. 7F). This is because of the presence of non-conducting intermediate closed states which is in equilibrium with fully open and closed states (Fig. 7G). Simultaneous measurements of single ion channel conformation change and single-channel electrophysiology lead to direct linkage between structure and function, which represents a significant advance in ion channel studies.89 Future improvement might lie in introducing site-specific labeling to the ion channel studies.
T cell receptor and antigen interactions
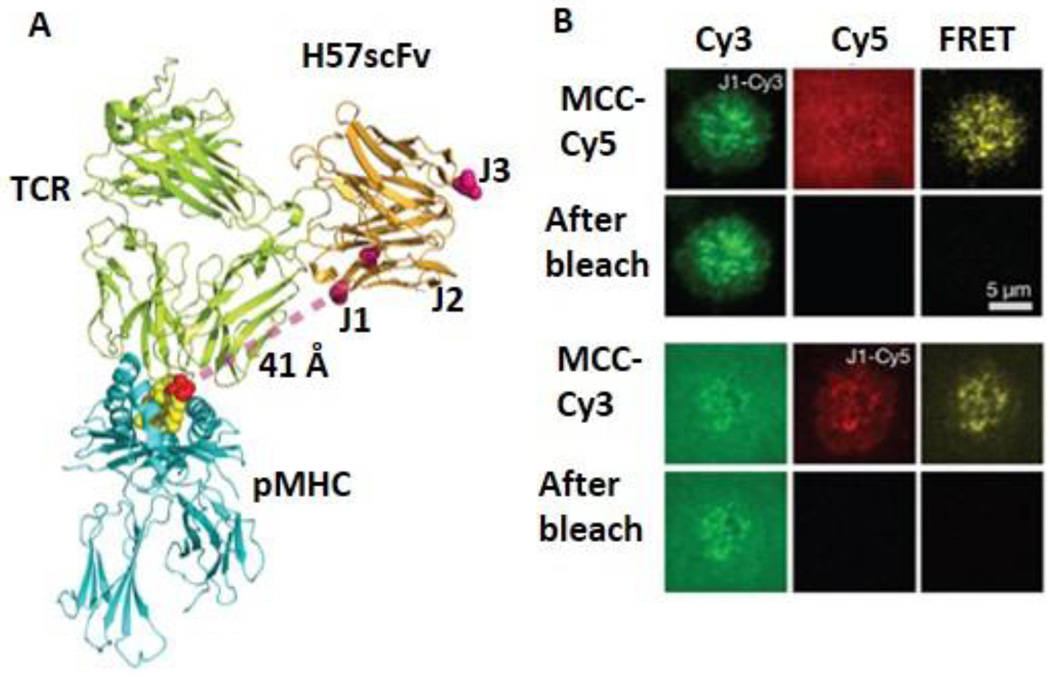
The recognition of foreign antigens by T cell receptors (TCR) is central for adaptive immune responses.90–94 TCRs are responsible for recognizing peptide-major histocompatibility complex (pMHC) ligands displayed on the surface of antigen presenting cells. Huppa et al. developed a Cy3/Cy5 based smFRET assay to measure TCR-pMHC interactions in situ.44 They constructed a single-chain variable fragment (scFv) of an anti-TCR antibody with mutations that can be labeled at three different sites (J1, J2 and J3) (Fig. 8A). The FRET donor Cy3 was used to site-specifically label at J1, J2 and J3 positions, whereas the FRET acceptor Cy5 was used to site-specifically label at the C-terminus of the peptide. TCR-pMHC interaction brings a pMHC (labeled by Cy5) and a TCR (labeled with Cy3) into close proximity to enable FRET. Swapping Cy3 and Cy5 labeling on TCRs and pMHCs did not affect the FRET signals (Fig. 8B). A 4–12 fold dissociation rate increase in situ was reported compared with in vitro solution measurements. In situ TCR binding affinity was also found to be 100-fold higher than in vitro measurement, which is most likely the consequence of complementary molecular orientation and clustering. In addition, the authors reported that the TCR binds to the pMHC independently of CD4, as CD4 blockade had no effect on the synaptic affinity and stability of TCR-pMHC complexes.
Fig. 8.
smFRET to measure TCR-pMHC interactions at the live cell membrane. A. A composite model based on the structures of a TCR-pMHC complex and an anti-TCR H57 Fab. J1, J2 and J3 are the positions for Cy3 labeling. The Cy5 is labeled at the C-terminus of the peptide. The distance between Cy3 (J1) and Cy5 is ~41 Å. B. Donor (green) and acceptor (red) channels and FRET channel before and after photobleaching. Fig. is reprinted by permission from Macmillan Publishers Ltd: Nature, Huppa et al., 2010.44
Although this study elegantly measured the in situ TCR-pMHC interactions using smFRET, it did not fully explain the molecular mechanism of T-cell recognition. A comprehensive study that includes TCR binding, conformation change and signaling will be necessary for unraveling the antigen recognition mechanism by T cells.
Epidermal growth factor receptor (EGFR) and ligand interactions
Yanagida and colleagues performed smFRET to study the interactions between EGF and EGF receptor (EGFR) in living cells using TIRF microscopy (Fig. 3B).95 Since EGF binding to EGFR leads to receptor dimerization, a mixture of Cy3-labled EGF and Cy5-labled EGF were added to EGFR expressing cells. A 532-nm laser was used to excite Cy3-EGF and fluorescence images were acquired at 565–595 nm (for Cy3) and 650–690 nm (for Cy5) simultaneously through dual-view optics (Fig. 9A). Anti-correlation of the Cy3 and Cy5 fluorescence-intensity changes in the same location indicated FRET from Cy3 to Cy5, suggesting EGFR dimerization. Fluctuation of FRET efficiency may be caused by conformational fluctuation of the dimer (Fig. 9B). EGFR dimerization also induces auto-phosphorylation of cytoplasmic tyrosine residues. To directly visualize the auto-phosphorylation process, Yanagida and colleagues added a Cy3-labeled monoclonal antibody that binds to the cytoplasmic tyrosine residues of activated EGFRs (Cy3-mAb74) and a Cy5-labeled EGF (Cy5-EGF) to living cells. The authors found that when Cy3-mAb74 co-localized with Cy5-EGF, the fluorescence intensities of the Cy5-EGF at the co-localized sites were twice those of non-co-localized Cy5-EGF. Their results are consistent with the hypothesis that ligand binding triggered EGFR dimerization induces the auto-phosphorylation of EGFRs, indicating auto-phosphorylation of EGFR after dimerization (Fig. 9C). Their results further indicated that EGF-(EGFR)2 complexes are formed before forming (EGF-EGFR)2. It has been previously reported that the binding of EGF to EGFR dimers is more than ten times stronger than to EGFR monomers. This concept is consistent with the observation that EGF molecules bound more effectively to EGF-(EGFR)2, even though there were many unoccupied EGFR monomers on the cell membrane.
One drawback of the study is that the authors used a method called apical total internal reflection (TIR) microscopy to visualize single-molecule events on the cell surface, the signal-to-noise ratios of their images were generally not good, considering the 2–3 µm thickness of the cells and <200 nm depth of evanescent wave in classic TIRF microscopy. This microscopy method also limited the observation volume, which is necessary for detecting the pre-existing EGFR dimers in a living cell. Lattice light-sheet microscopy will be an ideal solution to this problem, which can measure both cell surface and intracellular single-molecule events simultaneously with excellent temporal and spatial resolution.96 Also, X-ray crystallography studies showed that the dimerization of EGFRs involves rearrangements of a major domain that expose a critical dimerization arm.97 However, exposing this arm may not be not sufficient for receptor dimerization, and additional ligand induced dimer contacts may be needed. Further studies are required to elucidate the molecular mechanism of EGFR signaling induced by dimerization.
Structure and conformation of DNA and RNA
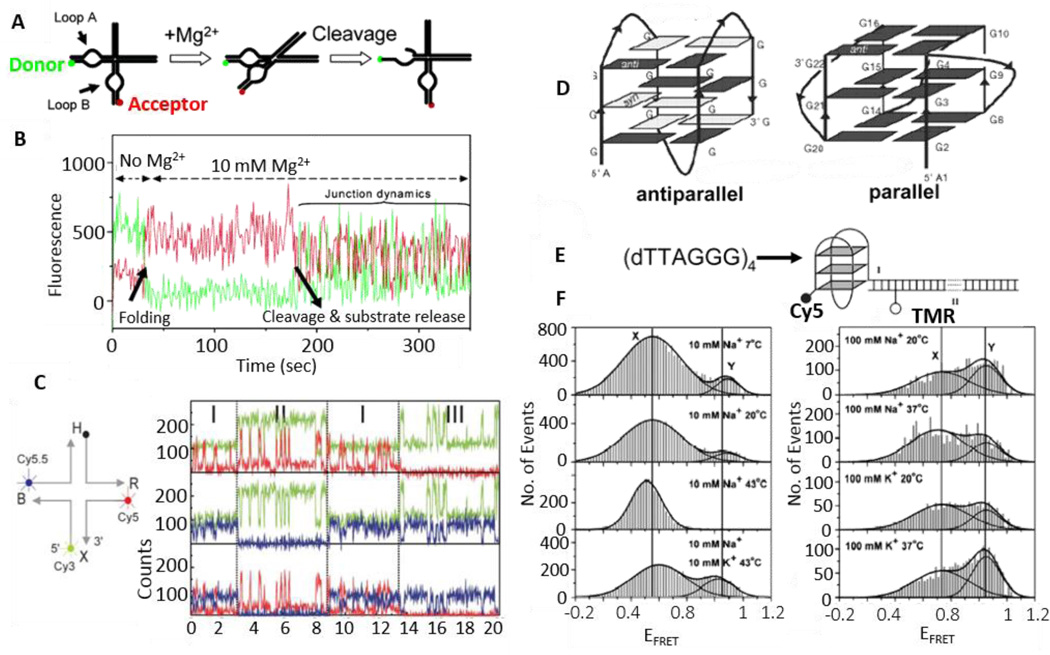
Dynamics of nucleic acids such as the hairpin ribozyme, Holliday junction and G-quadruplex have been studied by smFRET assays.36,45,98–105 Nucleic acids play a critical role in cell cycle, and their structures are recognized by different nucleic acid binding proteins and enzymes.45 It is usually difficult to distinguish functional activities from structural dynamics for a same molecule. Fig. 9A shows an example of a hairpin ribozyme folding and the resulted cleavage reaction. The apparent cleavage rate of this ribozyme is a function of its molecular folding dynamics, chemical reaction rate and product release. The natural form of a hairpin ribozyme comprises a four-way RNA junction and two internal loops carried by adjacent A and B arms of the junction (Fig. 10A). Interactions between the loops are essential for ribozyme activity, generating a 105-fold acceleration of site-specific cleavage or ligation reaction. Mg2+ ions promote the folding of the hairpin ribozyme via the docking of two loops, while cleavage and ligation reactions of a specific bond occur within the active site. A FRET donor and an acceptor labeled at the two ends of A and B arms allow for the monitoring of the ribozyme folding that brings the two fluorophores in close proximity to trigger FRET. Fig. 9B shows the fluorescence intensity time trajectories of the donor and acceptor pair on a single ribozyme immobilized on a glass surface. In the absence of Mg2+, the hairpin ribozyme shows an unfolded state and low FRET signals. The enzyme molecule immediately starts to fold after adding Mg2+ (t = 35 s), as shown by an abrupt increase in FRET (decrease of donor signal and increase of acceptor signal). The molecule remains stably folded until the release of cleaved products (t = 180 s), which is indicated by the rapid fluctuations caused by the intrinsic dynamics of the junction.45,99
Fig. 10.
Structure and dynamics of nucleic acids revealed by smFRET. A. A simplified scheme for detecting folding and catalysis of the hairpin ribozyme via smFRET between a donor and an acceptor attached to loops A and B respectively. B. The fluorescence trajectories of the donor (green) and the acceptor (red) that measure the folding process of a hairpin ribozyme. Adding Mg2+ (t = 35 s) induces the ribozyme folding, as revealed by the occurrence of smFRET (the decrease of donor signal and increase of acceptor signal). Cleavage and product release occur at 180 s and then the four-way junction dynamics show anti-correlated fluctuations. C. Three-color smFRET to study the structure and dynamics of the Holliday junction. Three-color FRET time traces of Cy3 (green), Cy5 (red) and Cy5.5 (blue) are used to calculate inter-distances among the three dyes. In the region I, all three dyes are active. In the region II, C5.5 is inactive and data from this region is used to calculate distance between Cy3 and Cy5. Similarly, data from region III is used to calculate the distance between Cy3 and Cy5.5. D. Parallel and antiparallel conformations of a human telomeric DNA G-quadruplex. E. The human telomeric sequence is labeled with a FRET pair of Cy5 and TMR. EFRET will be high if a relatively compact G-quadruplex structure is formed. F. FRET efficiency histograms obtained in various solutions containing Na+ or K+ as a function of temperature. Each histogram was fit using two Gaussian peaks. Fig. A and B are reprinted from Ha, 200445 and Fig. C from Hohng et al. 200436 by permission. Fig. D–F are reprinted from Ying et al. by permission.98 Copyright (2003) National Academy of Sciences, U.S.A.
Hohng et al. further designed a three-color smFRET to study the conformational dynamics of a DNA Holliday junction (Fig. 9C).36 By labeling three arms of the junction with Cy3 (donor, green), Cy5 (acceptor 1, red), and Cy5.5 (acceptor 2, blue), distance changes between the donor and the acceptor 1, and between the donor and the acceptor 2, could be measured simultaneously (Fig. 10C). In region I (Fig. 10C, time-trace), all three dyes are active. In order to calculate the distance between the dyes, one of the three dyes need to be photo-bleached. In the region II, Cy5.5 is inactive and data from this region is used to calculate distance between Cy3 and Cy5. Similarly, data from region III is used to calculate the distance between Cy3 and Cy5.5. The authors have reported that the distance between Cy3 and Cy5 is 5.3 nm, distance between Cy3 and Cy5.5 is 8.5 nm, and distance between Cy5 and Cy5.5 is 8.7 nm. They also observed that the acceptor 1 arm moves away from the donor arm when the acceptor 2 arm approaches the donor arm, and vice versa, demonstrating the first example of correlated movements of two different segments of a single-molecule.
Telomeres protect chromosomes from recombination, degradation, deterioration or fusion with neighboring chromosomes. Disruption of telomere maintenance can cause cell death. Human telomere DNA consists of TTAGGG nucleotide sequence repeats, ending in a single-stranded segment that overhangs at the end of the double-stranded DNA helix. High-resolution structural studies of human telomeres have revealed G-quadruplex formation where four guanines are hydrogen bonded with each other in a horizontal planar arrangement and three such layers are stacked on top of each other (Fig. 10D).100,101 There are two significantly different structures with respect to the positioning of the four strands. In an earlier nuclear magnetic resonance (NMR) study using a Na+ solution, an antiparallel structure (Fig. 9D, left) was observed where two of the strands orient in the opposite direction of the other two strands.100,101 Conversely, recent X-ray structures obtained in a K+ solution showed a parallel structure (Fig. 10D, right) with all four strands arranged in the same direction.100,101 Such structural changes may be due to the charge density of Na+ and K+ ions. Another possibility for the structural changes may arise from both structures coexisting and interconverting with each other largely depending on the different solution conditions. To answer the structural enigma, a partial duplex DNA with a single-stranded DNA overhang containing four repeats of the human telomere sequence was labeled with a FRET pair (Fig. 9E).98 Resultant smFRET data showed two FRET efficiency peaks whose relative populations depended on ion and temperature changes (Fig. 10F), further suggesting the presence of both antiparallel (intermediate FRET) and parallel (high FRET) conformations, each of which have been confirmed through molecular dynamic simulations.98 Nonetheless, further smFRET measurements are needed to directly determine the interconversion rates that should be on a time scale between 1 millisecond and several minutes.45
Although, smFRET gives detailed conformational and structural information of DNA or RNA, simultaneous force and spectroscopic recordings would be an ideal approach for a better understanding of the structure-function relationship. This will be discussed in detail in the following section. However, large molecules (e.g. DNA double helixes) with more complex structure remain untouched.45 The development of photostable dyes and robust immobilization techniques are needed to address these critical challenges.
Vesicle Fusion
Membrane fusion is a fundamental process in a cell in which two distinct lipid vesicles (diameter ~ 50 nm) merge together.106–116 Neurotransmitter and hormone secretion, organelle formation, nutrient uptake, and egg fertilization by sperm are a few examples among many that are mediated by the vesicle fusion process. Soluble N-ethylmaleimide-sensitive factor attachment protein receptors (SNARE) play a central role in all vesicle fusion processes. To detect specific stages of SNARE-mediated membrane fusion, the Ha lab developed a lipid mixing method combined with FRET analysis that accurately resolved docking, hemi and full fusion at the single-vesicle level.117–119 In the vesicle-vesicle lipid-mixing assay, v-and t-SNARE proteins (or vice versa) are reconstituted into two separate vesicle membranes that were specifically labeled with acceptor and donor fluorophores, respectively. The acceptor-labeled vesicles were immobilized on a surface and then donor-labeled vesicles were added in order to observe the formation of a single vesicle-vesicle complex through specific SNARE interactions. TIRF microscopy was applied to observe real-time vesicle fusion through specific intermediates.
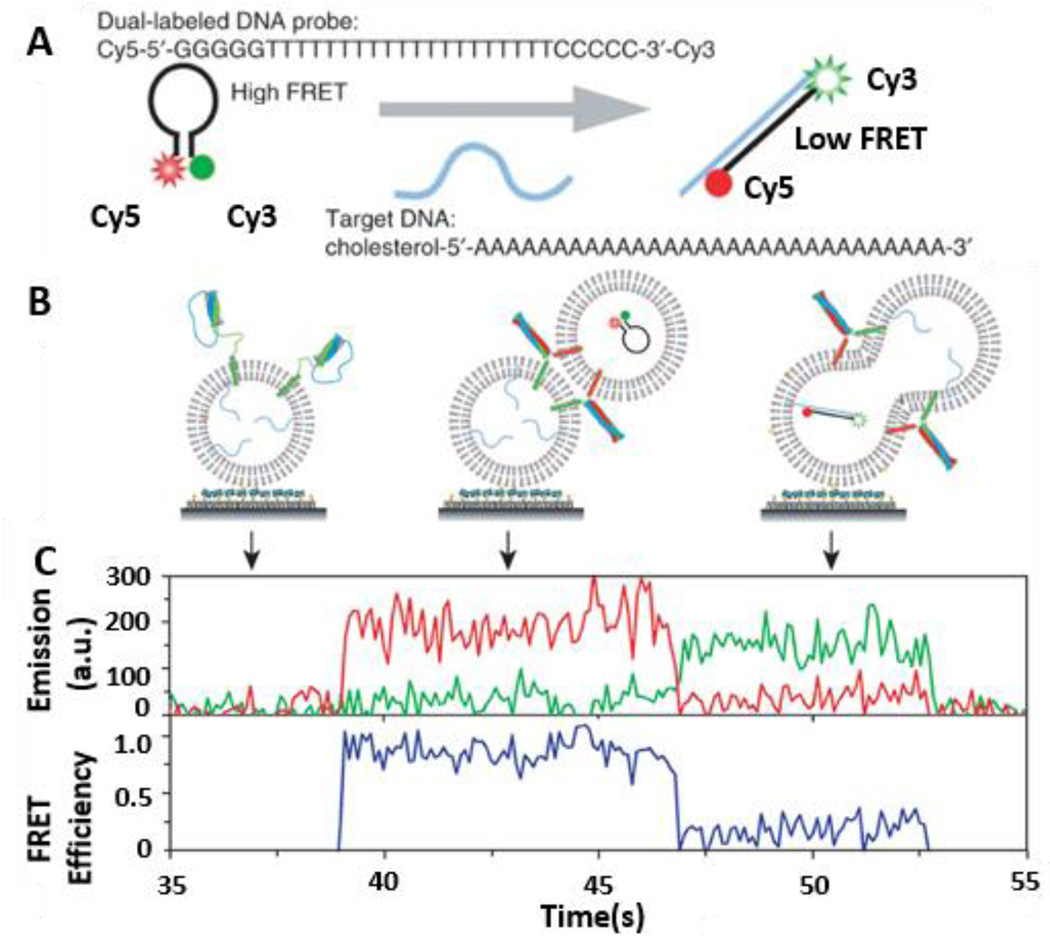
While the single vesicle-vesicle lipid mixing method provides information at the ensemble level, it cannot detect the fusion pore opening between two vesicular cavities and the interactions between v-SNARE and t-SNARE proteins. To overcome these limitations, Ha and colleagues further developed a single-vesicle content mixing method to reveal the key factors of pore expansion using smFRET assays.119 In this method, a DNA hairpin is labeled with a donor (Cy3) and an acceptor (Cy5) (Fig. 11A). When the loop region of the Cy3/Cy5-labeled DNA probe hybridizes with a second complementary DNA strand, the donor is separated from the acceptor and FRET decreases. Lipid vesicles encapsulating a poly-T DNA hairpin reconstituted with v-SNARE proteins in the membrane are immobilized on a polymer-coated quartz surface. Subsequently t-SNARE vesicles containing multiple cholesterol-anchored poly-A DNA targets are added to the v-SNARE immobilized quartz surface. Cholesterol has the added benefit of increasing the efficiency of poly-A DNA incorporation into the t-SNARE vesicle membrane and the probability of a fusion event resulting in the opening of a DNA hairpin. When two vesicles are docked and a fusion pore is formed between two lipid vesicles (Fig. 11 B), DNA hybridization triggered FRET signals are observed (Fig. 11C).
Fig. 11.
Mechanism of vesicle fusion mediated by SNARE protein revealed by smFRET. A. Construct of a FRET beacon. The Cy3 and Cy5 labeled DNA probe is a single-stranded oligonucleotide with a stem-and-loop hairpin structure. The loop contains a probe poly-T sequence that is complementary to a target poly-A DNA and the stem is formed by annealing complementary arm sequences located on either side of the probe sequence (GGGGG and CCCCC). When the hairpin probe is in the closed state, Cy3 and Cy5 fluorophores linked to the ends are in close proximity and show a high EFRET. When the hairpin probe hybridizes to a target DNA, it switches to the open state, increasing the distance between two fluorophores and showing a low FRET value. B. Monitoring vesicle fusion by content mixing method. For this real-time experiment, surface immobilization is configured in such a way that vesicle docking can be clearly marked as an abrupt increase in fluorescence signal. t-SNARE vesicles with target DNA (poly-A) are surface-immobilized and v-SNARE vesicles containing FRET beacons are added into the imaging chamber. C. A real-time content-mixing time trajectory of fluorescence intensities of donor and acceptor (green curve for Cy3, red curve for Cy5) and the corresponding FRET efficiency. Figures are reprinted by permission from Macmillan Publishers Ltd: Diao et al., Nat. Protocol 2012.117
Although research on the membrane fusion has achieved some successes, direct measurements of vesicle fusion at physiological conditions are still missing in this field. It is technologically challenging to design and perform such experiments considering the diameter of a vesicle is only ~50 nm,116 much smaller than the diffraction limit (~250 nm) of optical microscopes. Also, simultaneous detections of lipid-mixing and content-mixing might be a possible future direction and this may help to identify the roles of accessory proteins in promoting or inhibiting the vesicle fusion.
Force coupled smFRET microscopy
Force plays a critical role in many biological processes. Single-molecule manipulation techniques, such as atomic force microscopy (AFM), optical tweezers and magnetic tweezers have enabled the measurements of mechanical force in real time with unprecedented accuracy.120–127 These techniques have been applied to study bimolecular functions, mechanical properties and biochemical reaction kinetics under mechanical forces. These studies have led to the elucidation of the mechanisms of many key biological processes. However, various crucial details, such as the stoichiometry of active molecular interactions, the internal conformation of molecular machines, as well as activities performed in a deformed state are not directly accessible via force measurements.49,128 To overcome these limitations, coupling smFRET with mechanical manipulating techniques enables detection of molecular motions orthogonal to the direction of pulling. Here we use a protein kinase and a Holliday junction as examples to discuss the power of force coupled smFRET microscopy.
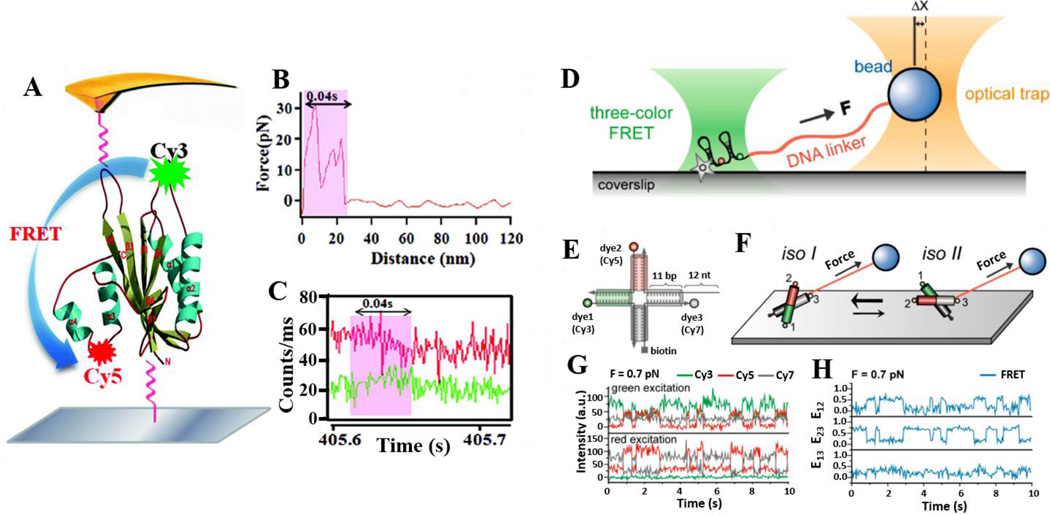
Manipulation of an enzyme’s conformation can enhance or change its function. Accordingly, it has been theoretically predicted that application of an oscillating force to an enzyme, at a comparable frequency of enzymatic reaction turnover rate, will alter enzymatic reaction activities due to change in potential surface, and enzymatic reaction intermediate state energy.129 Concurrent, experimental study has demonstrated that external mechanical forces can change protein activity.49 smFRET was implemented by Lu’s group to study the conformational change of 6-hydroxymethyl-7,8-dihydropterin protein kinase (HPPK) with specific coordination under mechanical force pulling using AFM.128 FRET donor Cy3 and acceptor Cy5 have been correspondingly used to label amino acid residue 88 on loop 3 and residue 142 on the protein core close to the HPPK active site (Fig. 12A). A labeled HPPK molecule was mounted between a glass coverslip and an AFM tip. Mechanical force was applied via the AFM tip to regulate the conformation of HPPK (Fig. 12A). Force (Fig. 12B) and FRET signals (Fig. 12C) were simultaneously reordered at the single-molecule level.128 From these measurements, three different extension lengths, 9 nm, 22 nm, and 46 nm were reported by AFM pulling. The primary extension length was within 20–40 nm, whereas the mean extension length was about 24–28 nm.128
Fig. 12.
Single-molecule force and FRET coupled microscopy. A. A schematic diagram of a smFRET donor-acceptor pair (Cy3 and Cy5) labeled on an HPPK molecule that is tethered between the surface of a glass coverslip and an AFM tip. B. Force-distance curve. The curve shows a 24 nm extension of a HPPK molecule within 0.04 s pulled by AFM. C. A typical smFRET event under force. Fluorescence intensity time trajectory of the donor (green) and the acceptor (red) associated with one single-molecule mechanical pulling event. Single-molecule fluorescence time trajectories of the donor (Cy3, green) and the accepter (Cy5, red) are shown. D. Experimental scheme of smFRET combined with optical tweezers. A surface immobilized Holliday junction molecule site-specifically labeled with three dyes is attached to a trapped bead via a long DNA linker. E. Labeling scheme of the Holliday junction. F. Illustration of conformations of Holliday junction. The isoI form is more prevalent than the isoII form under force. G. Representative fluorescence intensity time traces of Cy3 (green), Cy5 (red), and Cy7 (gray) after Cy3 (top panel) and Cy5 excitation (bottom panel) at 0.7 pN force. H. Three FRET efficiency time traces calculated from the data in (G). Fig. A–C are adopted form Lu, 2014 with permission of The Royal Society of Chemistry.49 Figures D–G is reproduced from Lee & Hohng, 2013 with permission.58 Copyright (2013) American Chemical Society.
Three-color smFRET and optical tweezers (Fig. 12D) have also been applied to study the unfolding/folding dynamics of Holliday junctions.58 The three arms of a Holliday junction are site-specifically labeled with Cy3, Cy5 and Cy7 (Fig. 12E). Additionally, the Cy7-labeled arm is attached to a trapped bead. Holliday junctions normally adopt two distinct stacking conformers (isoI and isoII) each with similar probabilities. However, in the presence of a mechanical pulling force, the Holliday junction is expected to shift its equilibrium towards conformer isoI (Fig. 12F). Fig. 12G shows single-molecule fluorescence intensity time traces at 0.7 pN force for Cy3 excitation (top panel) and Cy5 excitation (bottom panel). Three inter dye FRET efficiency trajectories are represented in Fig. 11H (E12: FRET efficiency for the Cy3–Cy5 pair, E23: FRET efficiency for the Cy5–Cy7 pair, E13: FRET efficiency for the Cy3–Cy7 pair) and were calculated from the data in Fig. 12G.
Although force-coupled smFRET using optical tweezers has been used to study kinesin stepping, DNA hairpin unfolding, and DNA-protein interaction,58,130 there is a major problem caused by the high photon flux of a trapping laser, which can bleach fluorophores as well as kill live cells. For force coupled smFRET using AFM, one major challenge is the high inherent cantilever stiffness and incoherent reflection from cantilever. It is also challenging to perform such measurements using living cells. One possible alternative is to develop force-coupled smFRET using biomembrane force probe (BFP), which will allow simultaneous and sensitive measurements of force and smFRET using purified proteins or molecules expressed on cell surface.131
Limitations of smFRET
Low signal/noise ratio
smFRET efficiency is largely influenced by fluctuation of donor and acceptor emission signals. The number of photons emitted by a single fluorophore, which vary among different molecules, is ~105 per second.132 However, a microscope system is only capable of capturing a maximum of 10–15% of those photons. Precise distance measurements made by smFRET are dependent on the number of photons collected. Averaging smFRET events reduces the standard deviation of measurements, but at least 100 photons are required to reach a good S/N ratio and minimize the standard deviations of FRET efficiency measurements.49 Lattice light-sheet microscopy was recently developed to minimize photobleaching, maximize S/N, and acquire high spatiotemporal resolution images, and we expect to witness smFRET measurement using this technique in the near future.133
Difficulties in site-specific labeling
It is extremely important to label the molecule(s) of interest with a FRET donor and acceptor pair at specific sites. Site-specific labeling is generally challenging and especially difficult for proteins, due to possible multiple potential labeling sites. In addition, the distance between a donor and an acceptor must be within FRET range (1–10 nm). Cysteine-based chemistry is one of the most common labeling methods, but other labeling methods are also used to site-specially label the molecules of interest. Amine (-NH2) group binding, biotinylation, and antibody labelling are also widely used in biochemical applications for protein labelling.47 For DNA or RNA labelling, phosphoramidite or acetoxyethoxy methyl solid support synthesis are used.47
Challenges in intracellular applications
The application of smFRET in living cells requires sophisticated design and reproducible delivery of labeled molecules to the desired locations. Two main challenges for performing intracellular smFRET include: first, reduction of cellular auto-fluorescence to a level that does not significantly interfere with single-molecule signals, and second, successful targeted delivery of labeled molecules into living cells. Auto-fluorescence in the visible wavelength range tends to decrease with an increase in excitation wavelength; above excitation wavelength of 550 nm, the auto-fluorescence of living cells is very low. To avoid auto-fluorescence, samples can also be excited by a two-photon excitation method, which requires a 750–850 nm excitation that is beyond the absorption range of auto-fluorescent protein.48,82 Lattice light-sheet microscopy is another solution to get higher S/N and lower photo bleaching for intracellular application.133
Limitation of distance
The efficiency of energy transfer is very sensitive to changes in donor-acceptor distance near R0 -the Förster distance. FRET efficiency is proportional to inverse of sixth power of donor-acceptor distance (r). As a requisite the distance between a donor and an acceptor must be within 10 nm, as FRET will not be triggered when the distance is beyond 10 nm.134,135
Limitation of current FRET pairs
It is critical to choose the appropriate FRET pair. Steady-state emission spectra of a donor and absorption spectra of an acceptor must have significant overlap (Fig. 1B). Random choice of fluorescent probes will not work because dipole-dipole interactions will be very weak in non-FRET pairs. Fluorescent proteins may also be used as FRET pairs; however, their characteristic photostablity is relatively low. Another quality of note is that fluorescent proteins are much larger in size than fluorescent dyes, consequently deeming them less useful for single-molecule imaging experiments. Quantum dots (QD) can also be used as a donor or acceptor in smFRET experiments.136 Although QDs are intrinsically very stable and bright, they are also very large compared to a single fluorescent dye.136
Limited temporal and spatial resolution
The temporal and spatial resolution of a single-molecule experiment is limited by the frame rate and pixel size of a detector. To date the best temporal resolution reported for smFRET imaging experiment is 1 ms with a spatial resolution limited to a diffraction limited spot (~250 nm) which can be fitted by point-spread function to get higher resolution (~10 nm).47 The spatiotemporal resolution is also determined by the photon emission rate and the photon-recording rate of the detectors (such as EMCCD or APD). Better resolution can be achieved by the development of ultrafast microscopy and novel fluorescent labels. Recently, sCMOS (scalable complementary metal oxide semiconductor) camera based single-molecule detection has been reported in millisecond time scale with high resolution.137 Super-resolution based smFRET is also reported recently to get high spatiotemporal resolution.138
Highly dependent on fluorophore environment
Fluorescence properties of the donor and acceptor fluorophores depend on the local viscosity, polarity and temperature of its surrounding medium. However, the complex biological environment could also produce uncontrollable and unknown changes within the microenvironment that lead to intensity drift, on-off blinking, long lifetime or quenching of fluorophores. At times, dynamics between a biomolecule and a fluorophore are hard to distinguish.
Limitation for immobilization
Immobilization of single-molecules on a glass surface has the great advantage of permitting the monitoring of equilibrium conformational fluctuation for extended lengths of time. However, extended monitoring also increases the chance of photobleaching. Extreme care should be taken to standardize optimal laser power. Moreover, immobilization of a molecule by streptavidin-biotin interaction or agarose gel may perturb the natural equilibrium to some extent. To overcome this limitation and increase longer experimental observation time, non-immobilized based nanodevice techniques have been developed recently e.g. anti-Brownian electrokinetic (ABEL) trap,139 convex lens-induced confinement (CLIC)140 and single-molecule without immobilization for TIRF (SWIFT).134,141
Three-dimensional smFRET
Conformational dynamics of proteins are highly heterogeneous, intrinsically complex, and multidimensional. To understand the temporal and spatial complexity of conformational motions and their corresponding roles in protein function, it is necessary to probe multidimensional conformational dynamics of proteins beyond the typical one-dimensional FRET coordinate. Multiple conformational nuclear coordinates interact simultaneously and have critical roles in regulating biological function. Under such conditions, one-dimensional smFRET may not be sufficient to characterize the intrinsic complexity of molecular dynamics. Multicolor smFRET has been developed to probe multiple site changes simultaneously.36 However, multicolor FRET requires high photo stability and good spectral separation. EFRET greatly depends on the orientation factor (κ2). We assume κ2 = 2/3 because fluorophores undergo free rotation in a time much faster than its average fluorescence lifetime. There can be many different 3D orientations at the same donor-acceptor distance. Therefore, a full understanding of 3D orientation effect will lead to a more accurate FRET distance approximation and molecular angular information for position determination.
Conclusions
Herein, we have discussed practical applications of smFRET in molecular biology and its current limitations. smFRET is a very powerful imaging technique that has aided in the determination of protein/DNA/RNA folding kinetics, conformational dynamics as well as interactions. Although smFRET has been used to study many important biological events, future development and application of smFRET should lie in its integration with other single-molecule techniques. Through the combination of one or more techniques, it will be possible to monitor several parameters of different properties simultaneously. Presently, smFRET coupled with optical tweezers, magnetic tweezers, or AFM has shown very promising results.58,128,142 Potential future directions could involve the combination of smFRET with biomembrane force probe (BFP)131 and lattice light-sheet microscopy.133 Also, resolution of smFRET efficiency in 3D orientation will also be a major future advancement.
Supplementary Material
Acknowledgments
We thank Jingyi Fei at The University of Chicago for critical comments. D.K.S. is a recipient of Chicago Biomedical Consortium postdoctoral grant (PDR-092). This work was supported by NIH grants R00AI106941 and R21AI120010 (to J. H.).
References
- 1.Craig DB, Arriaga Ea, Wong JCY, Lu H, Dovichi NJ. J. Am. Chem. Soc. 1996;118:5245–5253. [Google Scholar]
- 2.Walt DR. Anal. Chem. 2013;85:1258–1263. doi: 10.1021/ac3027178. [DOI] [PMC free article] [PubMed] [Google Scholar]
- 3.Zhang X, Li L, Li L, Chen J, Zou G, Si Z, Jin W. Anal. Chem. 2009;81:1826–1832. doi: 10.1021/ac802183u. [DOI] [PubMed] [Google Scholar]
- 4.Craig DB, Morris TT, Ong-Justiniano CMQ. Anal. Chem. 2012;84:4598–4602. doi: 10.1021/ac300777u. [DOI] [PubMed] [Google Scholar]
- 5.Gorris HH, Walt DR. J. Am. Chem. Soc. 2009;131:6277–6282. doi: 10.1021/ja9008858. [DOI] [PubMed] [Google Scholar]
- 6.Sonesson AW, Elofsson UM, Callisen TH, Brismar H. Langmuir. 2007;23:8352–8356. doi: 10.1021/la700918r. [DOI] [PubMed] [Google Scholar]
- 7.Michalet X, Weiss S, Jäger M. Chem. Rev. 2006;106:1785–1813. doi: 10.1021/cr0404343. [DOI] [PMC free article] [PubMed] [Google Scholar]
- 8.Lyon WA, Nie S. Anal. Chem. 1997;69:3400–3405. [Google Scholar]
- 9.Lu HP, Xie XS. J. Phys. Chem. B. 1997;101:2753–2757. [Google Scholar]
- 10.Lee S, Kang SH. Talanta. 2013;107:297–303. doi: 10.1016/j.talanta.2013.01.046. [DOI] [PubMed] [Google Scholar]
- 11.Choi Y, Moody IS, Sims PC, Hunt SR, Corso BL, Perez I, Weiss GA, Collins PG. Science. 2012;335:319–324. doi: 10.1126/science.1214824. [DOI] [PMC free article] [PubMed] [Google Scholar]
- 12.Venkataraman L, Klare JE, Nuckolls C, Hybertsen MS, Steigerwald ML. Nature. 2006;442:904–907. doi: 10.1038/nature05037. [DOI] [PubMed] [Google Scholar]
- 13.Weiss S. Nat. Struct. Biol. 2000;7:724–729. doi: 10.1038/78941. [DOI] [PubMed] [Google Scholar]
- 14.Xie XS, Lu HP. J. Biol. Chem. 1999;274:15967–15970. doi: 10.1074/jbc.274.23.15967. [DOI] [PubMed] [Google Scholar]
- 15.Ha T, Ting aY, Liang J, Caldwell WB, Deniz aa, Chemla DS, Schultz PG, Weiss S. Proc. Nat. Acad. Sci. USA. 1999;96:893–898. doi: 10.1073/pnas.96.3.893. [DOI] [PMC free article] [PubMed] [Google Scholar]
- 16.Chen Y-L, Graham MD, de Pablo JJ, Randall GC, Gupta M, Doyle PS. Phys. Rev. E. 2004;70:60901. doi: 10.1103/PhysRevE.70.060901. [DOI] [PubMed] [Google Scholar]
- 17.Kim E, Lee S, Jeon A, Choi JM, Lee H-S, Hohng S, Kim H-S. Nat. Chem. Biol. 2013;9:313–318. doi: 10.1038/nchembio.1213. [DOI] [PubMed] [Google Scholar]
- 18.Yang H, Luo G, Karnchanaphanurach P, Louie T-M, Rech I, Cova S, Xun L, Xie XS. Science. 2003;302:262–266. doi: 10.1126/science.1086911. [DOI] [PubMed] [Google Scholar]
- 19.Ha T. Methods. 2001;25:78–86. doi: 10.1006/meth.2001.1217. [DOI] [PubMed] [Google Scholar]
- 20.Lu HP. Acc. Chem. Res. 2005;38:557–565. doi: 10.1021/ar0401451. [DOI] [PubMed] [Google Scholar]
- 21.Xie XS, Dunn RC. Science (80-.) 1994;265:361–364. doi: 10.1126/science.265.5170.361. [DOI] [PubMed] [Google Scholar]
- 22.Weiss S. Nat Struct Biol. 2000;7:724–729. doi: 10.1038/78941. [DOI] [PubMed] [Google Scholar]
- 23.Gopich IV, Szabo A. J. Phys. Chem. B. 2007;111:12925–12932. doi: 10.1021/jp075255e. [DOI] [PubMed] [Google Scholar]
- 24.Xie XS. J. Chem. Phys. 2002;117:11024–11032. [Google Scholar]
- 25.Zhao R, Rueda D. Methods. 2009;49:112–117. doi: 10.1016/j.ymeth.2009.04.017. [DOI] [PubMed] [Google Scholar]
- 26.Harris TD, Buzby PR, Babcock H, Beer E, Bowers J, Braslavsky I, Causey M, Colonell J, Dimeo J, Efcavitch JW, Giladi E, Gill J, Healy J, Jarosz M, Lapen D, Moulton K, Quake SR, Steinmann K, Thayer E, Tyurina A, Ward R, Weiss H, Xie Z. Science. 2008;320:106–109. doi: 10.1126/science.1150427. [DOI] [PubMed] [Google Scholar]
- 27.Jain A, Liu R, Ramani B, Arauz E, Ishitsuka Y, Ragunathan K, Park J, Chen J, Xiang YK, Ha T. Nature. 2011;473:484–488. doi: 10.1038/nature10016. [DOI] [PMC free article] [PubMed] [Google Scholar]
- 28.Gu L, Li C, Aach J, Hill DE, Vidal M, Church GM. Nature. 2014;515:554–557. doi: 10.1038/nature13761. [DOI] [PMC free article] [PubMed] [Google Scholar]
- 29.Raj A, van Oudenaarden A. Annu. Rev. Biophys. 2011;38:255–270. doi: 10.1146/annurev.biophys.37.032807.125928. [DOI] [PMC free article] [PubMed] [Google Scholar]
- 30.Larson DR, Singer RH, Zenklusen D. Trends Cell Biol. 2009;19:630–637. doi: 10.1016/j.tcb.2009.08.008. [DOI] [PMC free article] [PubMed] [Google Scholar]
- 31.Raj A, van Oudenaarden A. Annu. Rev. Biophys. 2009;38:255–270. doi: 10.1146/annurev.biophys.37.032807.125928. [DOI] [PMC free article] [PubMed] [Google Scholar]
- 32.Chang L, Rissin DM, Fournier DR, Piech T, Patel PP, Wilson DH, Duffy DC. J. Immunol. Methods. 2012;378:102–115. doi: 10.1016/j.jim.2012.02.011. [DOI] [PMC free article] [PubMed] [Google Scholar]
- 33.Rissin DM, Kan CW, Campbell TG, Howes SC, Fournier DR, Song L, Piech T, Patel PP, Chang L, Rivnak AJ, Ferrell EP, Randall JD, Provuncher GK, Walt DR, Duffy DC. Nat. Biotechnol. 2010;28:595–599. doi: 10.1038/nbt.1641. [DOI] [PMC free article] [PubMed] [Google Scholar]
- 34.Besteman K, Lee JO, Wiertz FGM, Heering HA, Dekker C. Nano Lett. 2003;3:727–730. [Google Scholar]
- 35.Edman L, Földes-Papp Z, Wennmalm S, Rigler R. Chem. Phys. 1999;247:11–22. [Google Scholar]
- 36.Hohng S, Joo C, Ha T. Biophys. J. 2004;87:1328–1337. doi: 10.1529/biophysj.104.043935. [DOI] [PMC free article] [PubMed] [Google Scholar]
- 37.McKinney SA, Joo C, Ha T. Biophys. J. 2006;91:1941–1951. doi: 10.1529/biophysj.106.082487. [DOI] [PMC free article] [PubMed] [Google Scholar]
- 38.Ha T. Curr. Opin. Struct. Biol. 2001;11:287–292. doi: 10.1016/s0959-440x(00)00204-9. [DOI] [PubMed] [Google Scholar]
- 39.Myong S, Rasnik I, Joo C, Lohman TM, Ha T. Nature. 2005;437:1321–1325. doi: 10.1038/nature04049. [DOI] [PubMed] [Google Scholar]
- 40.Yu J, Xiao J, Ren X, Lao K, Xie XS. Science. 2006;311:1600–1603. doi: 10.1126/science.1119623. [DOI] [PubMed] [Google Scholar]
- 41.Hocine S, Raymond P, Zenklusen D, Chao JA, Singer RH. Nat. Methods. 2013;10:119–121. doi: 10.1038/nmeth.2305. [DOI] [PMC free article] [PubMed] [Google Scholar]
- 42.Lu HP. Science (80-) 1998;282:1877–1882. doi: 10.1126/science.282.5395.1877. [DOI] [PubMed] [Google Scholar]
- 43.Robison AD, Finkelstein IJ. FEBS Lett. 2014;588:3539–3546. doi: 10.1016/j.febslet.2014.05.021. [DOI] [PMC free article] [PubMed] [Google Scholar]
- 44.Huppa JB, Axmann M, Mörtelmaier Ma, Lillemeier BF, Newell EW, Brameshuber M, Klein LO, Schütz GJ, Davis MM. Nature. 2010;463:963–967. doi: 10.1038/nature08746. [DOI] [PMC free article] [PubMed] [Google Scholar]
- 45.Ha T. Biochemistry. 2004;43:4055–4063. doi: 10.1021/bi049973s. [DOI] [PubMed] [Google Scholar]
- 46.Debnath M, Ghosh S, Panda D, Bessi I, Schwalbe H, Bhattacharyya K, Dash J. Chem. Sci. 2016;7:3279–3285. doi: 10.1039/c6sc00057f. [DOI] [PMC free article] [PubMed] [Google Scholar]
- 47.Roy R, Hohng S, Ha T. Nat. Methods. 2008;5:507–516. doi: 10.1038/nmeth.1208. [DOI] [PMC free article] [PubMed] [Google Scholar]
- 48.Kim SA, Heinze KG, Schwille P. Nat. Methods. 2007;4:963–973. doi: 10.1038/nmeth1104. [DOI] [PubMed] [Google Scholar]
- 49.Lu HP. Chem. Soc. Rev. 2014;43:1118–1143. doi: 10.1039/c3cs60191a. [DOI] [PubMed] [Google Scholar]
- 50.Lackwiz JR. Springer NY. 2006 [Google Scholar]
- 51.Deniz AA, Laurence TA, Beligere GS, Dahan M, Martin AB, Chemla DS, Dawson PE, Schultz PG, Weiss S. Proc. Natl. Acad. Sci. U. S. A. 2000;97:5179–5184. doi: 10.1073/pnas.090104997. [DOI] [PMC free article] [PubMed] [Google Scholar]
- 52.Ha T. Methods. 2001;25:78–86. doi: 10.1006/meth.2001.1217. [DOI] [PubMed] [Google Scholar]
- 53.König I, Zarrine-Afsar A, Aznauryan M, Soranno A, Wunderlich B, Dingfelder F, Stüber JC, Plückthun A, Nettels D, Schuler B. Nat. Methods. 2015;12 doi: 10.1038/nmeth.3475. [DOI] [PubMed] [Google Scholar]
- 54.Schuler B, Eaton Wa. Curr. Opin. Struct. Biol. 2008;18:16–26. doi: 10.1016/j.sbi.2007.12.003. [DOI] [PMC free article] [PubMed] [Google Scholar]
- 55.Lee S, Lee J, Hohng S. PLoS One. 2010;5:e12270. doi: 10.1371/journal.pone.0012270. [DOI] [PMC free article] [PubMed] [Google Scholar]
- 56.Ma L, Yang F, Zheng J. J. Mol. Struct. 2014;1077:87–100. doi: 10.1016/j.molstruc.2013.12.071. [DOI] [PMC free article] [PubMed] [Google Scholar]
- 57.Landes CF, Rambhadran A, Taylor JN, Salatan F, Jayaraman V. Nat. Chem. Biol. 2011;7:168–173. doi: 10.1038/nchembio.523. [DOI] [PMC free article] [PubMed] [Google Scholar]
- 58.Lee S, Hohng S. J. Am. Chem. Soc. 2013;135:18260–18263. doi: 10.1021/ja408767p. [DOI] [PubMed] [Google Scholar]
- 59.Schuler B. J. Nanobiotechnology. 2013;11(Suppl 1):S2. doi: 10.1186/1477-3155-11-S1-S2. [DOI] [PMC free article] [PubMed] [Google Scholar]
- 60.Fish S, Fish SRNa, Walter NG, Theodor F. 2008:2329–2335. [Google Scholar]
- 61.Haran G. J. Phys. Condens. Matter. 2003;15:R1291–R1317. [Google Scholar]
- 62.Lipman EA, Schuler B, Bakajin O, Eaton WA. Science (80-.) 2003;301:1233–1236. doi: 10.1126/science.1085399. [DOI] [PubMed] [Google Scholar]
- 63.Fernandez JM, Li H. Science. 2004;303:1674–1678. doi: 10.1126/science.1092497. [DOI] [PubMed] [Google Scholar]
- 64.Cecconi C, Shank Ea, Bustamante C, Marqusee S. Science. 2005;309:2057–2060. doi: 10.1126/science.1116702. [DOI] [PubMed] [Google Scholar]
- 65.Zhuang X, Rief M. Curr. Opin. Struct. Biol. 2003;13:88–97. doi: 10.1016/s0959-440x(03)00011-3. [DOI] [PubMed] [Google Scholar]
- 66.Ferreon ACM, Deniz AA. Biochim. Biophys. Acta - Proteins Proteomics. 2011;1814:1021–1029. doi: 10.1016/j.bbapap.2011.01.011. [DOI] [PMC free article] [PubMed] [Google Scholar]
- 67.Schuler B. ChemPhysChem. 2005;6:1206–1220. doi: 10.1002/cphc.200400609. [DOI] [PubMed] [Google Scholar]
- 68.Chung HS, McHale K, Louis JM, Eaton Wa. Science (80-.) 2012;335:981–984. doi: 10.1126/science.1215768. [DOI] [PMC free article] [PubMed] [Google Scholar]
- 69.Borgia A, Williams PM, Clarke J. Annu. Rev. Biochem. 2008;77:101–125. doi: 10.1146/annurev.biochem.77.060706.093102. [DOI] [PubMed] [Google Scholar]
- 70.Schuler B, Lipman EA, Eaton WA. Nature. 2002;419:743–747. doi: 10.1038/nature01060. [DOI] [PubMed] [Google Scholar]
- 71.Zhao Y, Terry D, Shi L, Weinstein H, Blanchard SC, Javitch JA. Nature. 2010;465:188–193. doi: 10.1038/nature09057. [DOI] [PMC free article] [PubMed] [Google Scholar]
- 72.Steinmeyer R, Harms GS. Microsc. Res. Tech. 2009;72:12–21. doi: 10.1002/jemt.20632. [DOI] [PubMed] [Google Scholar]
- 73.Wang Z, Lu HP. J. Phys. Chem. B. 2015 150414064755002. [Google Scholar]
- 74.Ghosh S, Bhattacharyya K. Chem. Rec. 2016 doi: 10.1002/tcr.201500214. [DOI] [PubMed] [Google Scholar]
- 75.Nettels D, Hoffmann A, Schuler B. J. Phys. Chem. B. 2008;112:6137–6146. doi: 10.1021/jp076971j. [DOI] [PubMed] [Google Scholar]
- 76.Schuler B, Hofmann H. Curr. Opin. Struct. Biol. 2013;23:36–47. doi: 10.1016/j.sbi.2012.10.008. [DOI] [PubMed] [Google Scholar]
- 77.Kahra D, Kovermann M, Löw C, Hirschfeld V, Haupt C, Balbach J, Hübner CG. J. Mol. Biol. 2011;411:781–790. doi: 10.1016/j.jmb.2011.05.002. [DOI] [PubMed] [Google Scholar]
- 78.Li C-B, Yang H, Komatsuzaki T. Proc. Natl. Acad. Sci. U. S. A. 2008;105:536–541. doi: 10.1073/pnas.0707378105. [DOI] [PMC free article] [PubMed] [Google Scholar]
- 79.Schuler B, Lipman Ea, Eaton Wa. October. 2002:743–748. doi: 10.1038/nature01060. [DOI] [PubMed] [Google Scholar]
- 80.Uphoff S, Holden SJ, Le Reste L, Periz J, van de Linde S, Heilemann M, Kapanidis AN. Nat. Methods. 2010;7:831–836. doi: 10.1038/nmeth.1502. [DOI] [PubMed] [Google Scholar]
- 81.Chen Y, Hu D, Vorpagel ER, Lu HP. J. Phys. Chem. B. 2003;107:7947–7956. [Google Scholar]
- 82.Bacia K, Schwille P. Methods. 2003;29:74–85. doi: 10.1016/s1046-2023(02)00291-8. [DOI] [PubMed] [Google Scholar]
- 83.He Y, Li Y, Mukherjee S, Wu Y, Yan H, Lu HP. J. Am. Chem. Soc. 2011;133:14389–14395. doi: 10.1021/ja204644y. [DOI] [PMC free article] [PubMed] [Google Scholar]
- 84.Chattoraj S, Bhattacharyya K. Chem. Phys. Lett. 2016;660:1–10. [Google Scholar]
- 85.Mondal P, Chattoraj S, Chowdhury R, Bhunia D, Ghosh S, Bhattacharyya K. Phys. Chem. Chem. Phys. 2015;17:6687–6690. doi: 10.1039/c4cp06031h. [DOI] [PubMed] [Google Scholar]
- 86.Wang Y, Liu Y, Deberg HA, Nomura T, Hoffman MT, Rohde PR, Schulten K, Martinac B, Selvin PR. Elife. 2014;3:e01834. doi: 10.7554/eLife.01834. [DOI] [PMC free article] [PubMed] [Google Scholar]
- 87.Harms GS, Orr G, Montal M, Thrall BD, Colson SD, Lu HP. Biophys. J. 2003;85:1826–1838. doi: 10.1016/S0006-3495(03)74611-6. [DOI] [PMC free article] [PubMed] [Google Scholar]
- 88.Sasmal DK, Lu HP. J. Am. Chem. Soc. 2014;136:12998–13005. doi: 10.1021/ja506231j. [DOI] [PMC free article] [PubMed] [Google Scholar]
- 89.Sasmal DK, Yadav R, Lu HP. J. Am. Chem. Soc. 2016;138:8789–8801. doi: 10.1021/jacs.6b03496. [DOI] [PubMed] [Google Scholar]
- 90.Dustin ML, Depoil D. Nat. Rev. Immunol. 2011;11:672–684. doi: 10.1038/nri3066. [DOI] [PMC free article] [PubMed] [Google Scholar]
- 91.James JR, White SS, Clarke RW, Johansen AM, Dunne PD, Sleep DL, Fitzgerald WJ, Davis SJ, Klenerman D. Proc. Natl. Acad. Sci. U. S. A. 2007;104:17662–17667. doi: 10.1073/pnas.0700411104. [DOI] [PMC free article] [PubMed] [Google Scholar]
- 92.Axmann M, Huppa JB, Davis MM, Schütz GJ. Biophys. J. 2012;103 doi: 10.1016/j.bpj.2012.06.019. [DOI] [PMC free article] [PubMed] [Google Scholar]
- 93.Douglass AD, Vale RD. Cell. 2005;121:937–950. doi: 10.1016/j.cell.2005.04.009. [DOI] [PMC free article] [PubMed] [Google Scholar]
- 94.van der Merwe PA, Dushek O. Nat. Rev. Immunol. 2011;11:47–55. doi: 10.1038/nri2887. [DOI] [PubMed] [Google Scholar]
- 95.Sako Y, Minoghchi S, Yanagida T. Nat. Cell Biol. 2000;2:168–172. doi: 10.1038/35004044. [DOI] [PubMed] [Google Scholar]
- 96.Chen B-C, Legant WR, Wang K, Shao L, Milkie DE, Davidson MW, Janetopoulos C, Wu XS, Hammer JA, Liu Z, English BP, Mimori-Kiyosue Y, Romero DP, Ritter AT, Lippincott-Schwartz J, Fritz-Laylin L, Mullins RD, Mitchell DM, Bembenek JN, Reymann A-C, Bohme R, Grill SW, Wang JT, Seydoux G, Tulu US, Kiehart DP, Betzig E. Science (80-.) 2014;346:1257998–1257998. doi: 10.1126/science.1257998. [DOI] [PMC free article] [PubMed] [Google Scholar]
- 97.Burgess AW, Cho H-S, Eigenbrot C, Ferguson KM, Garrett TP, Leahy DJ, Lemmon MA, Sliwkowski MX, Ward CW, Yokoyama S. Mol. Cell. 2003;12:541–552. doi: 10.1016/s1097-2765(03)00350-2. [DOI] [PubMed] [Google Scholar]
- 98.Ying LM, Green JJ, Li HT, Klenerman D, Balasubramanian S. Proc. Natl. Acad. Sci. U. S. A. 2003;100:14629–14634. doi: 10.1073/pnas.2433350100. [DOI] [PMC free article] [PubMed] [Google Scholar]
- 99.Tan E, Wilson TJ, Nahas MK, Clegg RM, Lilley DMJ, Ha T. Proc. Natl. Acad. Sci. U. S. A. 2003;100:9308–9313. doi: 10.1073/pnas.1233536100. [DOI] [PMC free article] [PubMed] [Google Scholar]
- 100.Parkinson GN, Lee MPH, Neidle S. Nature. 2002;417:876–880. doi: 10.1038/nature755. [DOI] [PubMed] [Google Scholar]
- 101.Wang Y, Patel DJ. Structure. 1993;1:263–282. doi: 10.1016/0969-2126(93)90015-9. [DOI] [PubMed] [Google Scholar]
- 102.Bai L, Santangelo TJ, Wang MD. Annu. Rev. Biophys. Biomol. Struct. 2006;35:343–360. doi: 10.1146/annurev.biophys.35.010406.150153. [DOI] [PubMed] [Google Scholar]
- 103.Bokinsky G, Zhuang X. Acc. Chem. Res. 2005;38:566–573. doi: 10.1021/ar040142o. [DOI] [PubMed] [Google Scholar]
- 104.Greulich KO. Chemphyschem. 2005;6:2458–2471. doi: 10.1002/cphc.200500038. [DOI] [PubMed] [Google Scholar]
- 105.Li G-W, Xie XS. Nature. 2011;475:308–315. doi: 10.1038/nature10315. [DOI] [PMC free article] [PubMed] [Google Scholar]
- 106.Wickner W, Schekman R. Nat. Struct. Mol. Biol. 2008;15:658–664. doi: 10.1038/nsmb.1451. [DOI] [PMC free article] [PubMed] [Google Scholar]
- 107.Jahn R, Lang T, Südhof TC. Cell. 2003;112:519–533. doi: 10.1016/s0092-8674(03)00112-0. [DOI] [PubMed] [Google Scholar]
- 108.Christensen SM, Mortensen MW, Stamou DG. Biophys. J. 2011;100:957–967. doi: 10.1016/j.bpj.2010.12.3730. [DOI] [PMC free article] [PubMed] [Google Scholar]
- 109.Wang T, Smith EA, Chapman ER, Weisshaar JC. Biophys. J. 2009;96:4122–4131. doi: 10.1016/j.bpj.2009.02.050. [DOI] [PMC free article] [PubMed] [Google Scholar]
- 110.Kiessling V, Domanska MK, Tamm LK. Biophys. J. 2010;99:4047–4055. doi: 10.1016/j.bpj.2010.10.022. [DOI] [PMC free article] [PubMed] [Google Scholar]
- 111.Gandhi SP, Stevens CF. Nature. 2003;423:607–613. doi: 10.1038/nature01677. [DOI] [PubMed] [Google Scholar]
- 112.Kyoung M, Zhang Y, Diao J, Chu S, Brunger AT. Nat. Protoc. 2013;8:1–16. doi: 10.1038/nprot.2012.134. [DOI] [PMC free article] [PubMed] [Google Scholar]
- 113.Lee H-K, Yang Y, Su Z, Hyeon C, Lee T-S, Lee H-W, Kweon D-H, Shin Y-K, Yoon T-Y. Science. 2010;328:760–763. doi: 10.1126/science.1187722. [DOI] [PMC free article] [PubMed] [Google Scholar]
- 114.Johnson JM, Ha T, Chu S, Boxer SG. Biophys. J. 2002;83:3371–3379. doi: 10.1016/S0006-3495(02)75337-X. [DOI] [PMC free article] [PubMed] [Google Scholar]
- 115.Brunger AT, Weninger K, Bowen M, Chu S. Annu. Rev. Biochem. 2009;78:903–928. doi: 10.1146/annurev.biochem.77.070306.103621. [DOI] [PMC free article] [PubMed] [Google Scholar]
- 116.Karatekin E, Di Giovanni J, Iborra C, Coleman J, O’Shaughnessy B, Seagar M, Rothman JE. Proc. Natl. Acad. Sci. 2010;107:3517–3521. doi: 10.1073/pnas.0914723107. [DOI] [PMC free article] [PubMed] [Google Scholar]
- 117.Diao J, Ishitsuka Y, Lee H, Joo C, Su Z, Syed S, Shin Y-K, Yoon T-Y, Ha T. Nat. Protoc. 2012;7:921–934. doi: 10.1038/nprot.2012.020. [DOI] [PMC free article] [PubMed] [Google Scholar]
- 118.Yoon T-Y, Okumus B, Zhang F, Shin Y-K, Ha T. Proc. Natl. Acad. Sci. U. S. A. 2006;103:19731–19736. doi: 10.1073/pnas.0606032103. [DOI] [PMC free article] [PubMed] [Google Scholar]
- 119.Diao J, Su Z, Ishitsuka Y, Lu B, Lee KS, Lai Y, Shin Y-K, Ha T. Nat. Commun. 2010;1:54. doi: 10.1038/ncomms1054. [DOI] [PMC free article] [PubMed] [Google Scholar]
- 120.Fazal FM, Block SM. Nat. Photonics. 2011;5:318–321. doi: 10.1038/nphoton.2011.100. [DOI] [PMC free article] [PubMed] [Google Scholar]
- 121.Dufresne ER, Grier DG. Rev. Sci. Instrum. 1998;69:1974. [Google Scholar]
- 122.Kim K, Saleh OA. Nucleic Acids Res. 2009;37 doi: 10.1093/nar/gkp725. [DOI] [PMC free article] [PubMed] [Google Scholar]
- 123.Kaufman AM, Lester BJ, Regal CA. Phys. Rev. X. 2012;2 [Google Scholar]
- 124.Neuman KC, Nagy A. Nat. Methods. 2008;5:491–505. doi: 10.1038/nmeth.1218. [DOI] [PMC free article] [PubMed] [Google Scholar]
- 125.Kapanidis AN, Strick T. Trends Biochem. Sci. 2009;34:234–243. doi: 10.1016/j.tibs.2009.01.008. [DOI] [PubMed] [Google Scholar]
- 126.Ashkin A, Dziedzic JM, Bjorkholm JE, Chu S. Opt. Lett. 1986;11:288. doi: 10.1364/ol.11.000288. [DOI] [PubMed] [Google Scholar]
- 127.Reed J, Mishra B, Pittenger B, Magonov S, Troke J, Teitell Ma, Gimzewski JK. Nanotechnology. 2007;18:44032. doi: 10.1088/0957-4484/18/4/044032. [DOI] [PMC free article] [PubMed] [Google Scholar]
- 128.He Y, Lu M, Cao J, Lu HP. ACS Nano. 2012;6:1221–1229. doi: 10.1021/nn2038669. [DOI] [PMC free article] [PubMed] [Google Scholar]
- 129.Lomholt MA, Urbakh M, Metzler R, Klafter J. Phys. Rev. Lett. 2007;98:168302. doi: 10.1103/PhysRevLett.98.168302. [DOI] [PubMed] [Google Scholar]
- 130.Svoboda K, Schmidt CF, Schnapp BJ, Block SM. Nature. 1993;365:721–727. doi: 10.1038/365721a0. [DOI] [PubMed] [Google Scholar]
- 131.Liu B, Chen W, Evavold BD, Zhu C. Cell. 2014;157:357–368. doi: 10.1016/j.cell.2014.02.053. [DOI] [PMC free article] [PubMed] [Google Scholar]
- 132.Weatherill EE, Wallace MI. J. Mol. Biol. 2015;427:146–157. doi: 10.1016/j.jmb.2014.07.007. [DOI] [PubMed] [Google Scholar]
- 133.Chen B-C, Legant WR, Wang K, Shao L, Milkie DE, Davidson MW, Janetopoulos C, Wu XS, Hammer JA, Liu Z, English BP, Mimori-Kiyosue Y, Romero DP, Ritter AT, Lippincott-Schwartz J, Fritz-Laylin L, Mullins RD, Mitchell DM, Bembenek JN, Reymann A-C, Bohme R, Grill SW, Wang JT, Seydoux G, Tulu US, Kiehart DP, Betzig E. Science (80-.) 2014;346:1257998–1257998. doi: 10.1126/science.1257998. [DOI] [PMC free article] [PubMed] [Google Scholar]
- 134.Banterle N, Lemke EA. Curr. Opin. Biotechnol. 2016;39:105–112. doi: 10.1016/j.copbio.2016.02.013. [DOI] [PMC free article] [PubMed] [Google Scholar]
- 135.Thompson RE, Larson DR, Webb WW. Biophys. J. 2002;82:2775–2783. doi: 10.1016/S0006-3495(02)75618-X. [DOI] [PMC free article] [PubMed] [Google Scholar]
- 136.Medintz IL, Mattoussi H. Phys. Chem. Chem. Phys. 2009;11:17–45. doi: 10.1039/b813919a. [DOI] [PubMed] [Google Scholar]
- 137.Juette MF, Terry DS, Wasserman MR, Altman RB, Zhou Z, Zhao H, Blanchard SC. Nat. Methods. 2016;13:341–347. doi: 10.1038/nmeth.3769. [DOI] [PMC free article] [PubMed] [Google Scholar]
- 138.Cho S, Jang J, Song C, Lee H, Ganesan P, Yoon T-Y, Kim MW, Choi MC, Ihee H, Do Heo W, Park Y. Sci. Rep. 2013;3:1208. doi: 10.1038/srep01208. [DOI] [PMC free article] [PubMed] [Google Scholar]
- 139.Wang Q, Moerner WE. Nat. Methods. 2014;11:555–558. doi: 10.1038/nmeth.2882. [DOI] [PubMed] [Google Scholar]
- 140.Leslie SR, Fields AP, Cohen AE. Anal. Chem. 2010;82:6224–6229. doi: 10.1021/ac101041s. [DOI] [PMC free article] [PubMed] [Google Scholar]
- 141.Tyagi S, VanDelinder V, Banterle N, Fuertes G, Milles S, Agez M, Lemke EA. Nat. Methods. 2014;11:297–300. doi: 10.1038/nmeth.2809. [DOI] [PubMed] [Google Scholar]
- 142.Guo Q, He Y, Lu HP. Proc. Natl. Acad. Sci. U. S. A. 2015;112:13904–13909. doi: 10.1073/pnas.1506405112. [DOI] [PMC free article] [PubMed] [Google Scholar]
Associated Data
This section collects any data citations, data availability statements, or supplementary materials included in this article.


