

Abstract
Biofilm formation on implanted medical devices is a major source of lethal invasive infection by Candida albicans. Filamentous growth of this fungus is tied to biofilm formation because many filamentation-associated genes are required for surface adherence. Cell cycle or cell growth defects can induce filamentation, but we have limited information about the coupling between filamentation and filamentation-associated gene expression after cell cycle/cell growth inhibition. Here we identified the CDK activating protein kinase Cak1 as a determinant of filamentation and filamentation-associated gene expression through a screen of mutations that diminish expression of protein kinase-related genes implicated in cell cycle/cell growth control. A cak1 diminished expression (DX) strain displays filamentous growth and expresses filamentation-associated genes in the absence of typical inducing signals. In a wild-type background, expression of filamentation-associated genes depends upon the transcription factors Bcr1, Brg1, Efg1, Tec1, and Ume6. In the cak1 DX background, the dependence of filamentation-associated gene expression on each transcription factor is substantially relieved. The unexpected bypass of filamentation-associated gene expression activators has the functional consequence of enabling biofilm formation in the absence of Bcr1, Brg1, Tec1, Ume6, or in the absence of both Brg1 and Ume6. It also enables filamentous cell morphogenesis, though not biofilm formation, in the absence of Efg1. Because these transcription factors are known to have shared target genes, we suggest that cell cycle/cell growth limitation leads to activation of several transcription factors, thus relieving dependence on any one.
Author Summary
The ability of the pathogen Candida albicans to grow on surfaces as biofilms is a determinant of infection ability, because biofilms on implanted medical devices seed infections. Biofilm formation by this organism requires growth in the form of filamentous cells and the expression of filamentation-associated genes. Inhibition of cell proliferation can induce filamentous cell formation, as we find here for strains that express greatly reduced levels of the cell cycle regulator Cak1. Surprisingly, biofilm formation occurs independently of many central biofilm regulatory genes when Cak1 levels are reduced. This response to proliferation inhibition may reflect the activation of numerous biofilm regulators, thus relieving the dependence on any one regulator. The stimulation of biofilm formation by proliferation inhibition, a property of many bacterial pathogens as well, may contribute to the limited effectiveness of antimicrobials against biofilms.
Introduction
Candida albicans is an invasive fungal pathogen that causes lethal infections in approximately 400,000 people per year worldwide [1]. Susceptibility to infection can be caused by a weakened immune system or presence of an implanted medical device, which provides a niche for biofilm formation. Limitations of the antifungal armamentarium lead to a 40% mortality rate among infected patients despite therapy [2–4]; hence the development of new therapeutics is of the utmost importance [5].
The goal of our study is to tie essential genes, which are candidate drug targets [6–9], to biological processes. Such connections may be useful to develop screens for growth inhibitors. Several approaches have been used with C. albicans to reduce expression of an essential gene in order to assess its biological function [10–17]. Most approaches have used promoters with activity that can be regulated by presence of a nutrient or small molecule (Tet-off [12–14], MET3 [15], PCK1 [16], and MAL2 [17]). In fact, a collection of GRACE strains is now available in which 2,356 different genes have been placed under control of a doxycycline-repressible promoter [12, 18]. This approach allows growth under a permissive condition in which the gene of interest is expressed at high levels, and then allows functional assays after expression of the gene is reduced.
Several previous studies of C. albicans have shown that cell cycle or cell growth inhibition induces polarized growth, yielding elongated cells that resemble naturally occurring filamentous cells such as hyphae or pseudohyphae (reviewed in [19, 20]; see [18] for a recent study). Filamentous growth is of particular significance for C. albicans because it is required for invasive infection and for biofilm formation.
Many filamentous cell functions are tied to their expression of a distinctive set of filamentation-associated genes whose products have direct roles in adherence and pathogenicity [21, 22]. It is not clear to what extent cell cycle/cell growth inhibition induces filamentation-associated gene expression, as illustrated by the foundational study of Bachewich et al. [23]. They used genome-wide profiling to establish that depletion of the essential protein kinase Cdc5, an M-phase regulator, induced both filamentous growth and several filamentation-associated genes that included ECE1 and RBT1. However, they found that filamentous growth and filamentation-associated gene expression could be uncoupled. Specifically, treatment with the DNA synthesis inhibitor hydroxyurea induced filamentous growth but had little effect on filamentation-associated gene expression. A more extreme case of uncoupling comes from work of Bastidas et al. [24] who studied cell growth control by the Tor1 kinase. They observed that the Tor1 inhibitor rapamycin blocked filamentous growth yet induced filamentation-associated genes that included ECE1 and RBT1. Therefore, the extent of coupling between filamentation and filamentation-associated gene expression after cell cycle/cell growth inhibition is uncertain. In addition, the identities of transcriptional regulators that mediate the effects of cell cycle/cell growth inhibition on filamentation-associated genes remain largely undefined.
We focus here on a set of protein kinase genes that have been implicated in cell cycle or cell growth control. We chose to examine protein kinases because they are among the most druggable eukaryotic protein targets [25, 26]. In fact, our prior study of C. albicans protein kinase-related gene insertion mutants revealed that many non-essential protein kinases may be useful antimicrobial targets [27]: 35 of 80 viable mutants were defective in virulence-associated traits that included stress tolerance, biofilm formation, or filamentation. However, because DNA insertions were used to create the mutations in that study, we were unable to recover mutations in essential protein kinase genes. Here we have engineered constitutive diminished expression of 15 protein kinase and protein kinase-related genes. Our findings extend the connection between cell cycle/cell growth inhibition and filamentation to include filamentation-associated gene expression. We find that the impact of a partial defect in cell cycle regulator Cak1 is sufficient to promote biofilm formation and filamentation-associated gene expression in the absence of major transcriptional activators of these processes.
Results
Construction of DX strains
We chose 18 protein kinase genes that we had been unable to disrupt previously [27] for functional analysis (Table 1). Half of the genes had been included in a screen of doxycycline-repressible GRACE strains for altered hyphal morphogenesis [12]; the other half were not represented among the GRACE strains (Table 1). In addition, we included as an internal control an essential protein kinase-related gene, CLN3, that had been analyzed previously through conditional expression approaches [28, 29].
Table 1. DX mutants in protein kinase-related genes.
| ORF | Gene name or alias | UAU1 insertion isolated[27] | Null or repressible allele | DX mutant isolated | GRACE strain reported[18] | DX strain morphologya | Depletion strain morphology | DX gene expression (P-value)b |
|---|---|---|---|---|---|---|---|---|
| ORF19.793 | CAK1 | no | repressible[18] | yes | yes | filamentous | yeast[18] | 120 (0.03) |
| ORF19.1960 | CLN3 | repressible[18, 28, 29] | yes | yes | filamentous | filamentous[28, 29] | 171 (0.03) | |
| ORF19.1619 | CTK1 | no | yes | no | filamentous | 15 (0.03) | ||
| ORF19.1223 | DBF2 | no | repressible[30] | yes | no | filamentous | yeast[30] | 13 (0.19) |
| ORF19.663 | GIN4 | no | null[31] | yes | no | filamentous | filamentous[31] | 12 (0.03) |
| ORF19.3474 | IPL1 | no | repressible[18] | yes | yes | filamentous | filamentous[18] | 4 (0.19) |
| ORF19.6239 | KIN28 | no | repressible[18] | yes | yes | filamentous | filamentous[18] | 46 (0.03) |
| ORF19.1936 | SNF1 | no | repressible[18] | yes | yes | filamentous | filamentous[18] | 4 (0.5) |
| ORF19.3459 | MCK1 | no | yes | no | filamentous | 1 (0.5) | ||
| ORF19.3561 | CDC7 | no | repressible[18] | yes | yes | yeast | filamentous[18] | 2 (0.19) |
| ORF19.3856 | CDC28 | no | repressible[18, 32] | yes | yes | yeast | filamentous[18] | 1 (0.19) |
| ORF19.1754 | CMK2 | no | null[33, 34] | yes | no | yeast | yeast[33, 34] | 1 (0.8) |
| ORF19.5068 | IRE1 | no | insertion[27] | yes | no | yeast | 1 (0.8) | |
| ORF19.3840 | SAK1 | no | yes | no | yeast | 1 (0.19) | ||
| ORF19.3669 | SHA3 | no | repressible[18] | yes | yes | yeast | yeast[18] | 2 (0.03) |
| ORF19.6010 | CDC5 | no | repressible[35] | no | yes | filamentous[35] | ||
| ORF19.7293 | MPS1 | no | repressible[18, 36] | no | yes | filamentous[18] | ||
| ORF19.6846 | PHO85 | no | repressible[37] | no | no | yeast[37] | ||
| ORF19.2320 | RIO1 | no | no | no |
To create a set of strains with decreased expression of each gene, we deleted one allele and replaced the 5' region of the second allele with a weakly expressed promoter. We were able to introduce the PGA5 promoter in front of most genes to create DX1 alleles (S1 Table). However, for three genes, only fusions to the promoters of PGA42 (DX2 alleles) or ORF19.7606 (DX3 alleles) were recovered (S1 Table). We refer to a strain of genotype yfg1-DX1/yfg1Δ, yfg1-DX2/yfg1Δ, or yfg1-DX3/yfg1Δ as a yfg1 DX strain. Of the 19 genes chosen (18 protein kinase genes and CLN3), we recovered DX strains for 15 genes (Table 1).
We used nanostring RNA measurements to determine whether the DX strains had reduced expression of the targeted genes (S1 Table). Under yeast growth conditions (30° in YPD medium), the strains displayed 7.3 ± 8.1% of the wild-type expression levels for the 12 genes with DX1 alleles. Under hyphal growth conditions (37° in YPD + serum medium), the strains displayed 8.5 ± 10.8% of the wild-type expression levels for the 12 genes with DX1 alleles. Too few genes were represented by DX2 or DX3 alleles to draw general conclusions. These results indicate that DX strains engineered by promoter replacement with the PGA5 promoter have reduced expression of several different targeted genes under both yeast and hyphal growth conditions.
DX strain filamentation
Several DX strains grew as filamentous forms under conditions that supported nonfilamentous growth of the wild-type strain (Fig 1, Table 1). The cln3, cak1, kin28, gin4, dbf2, and ctk1 mutants had the most extreme phenotypes; the snf1 and mck1 mutants had prominent though less severe phenotypes. Many of the remaining mutants had mild or heterogeneous phenotypes (summarized in Table 1). Filamentous cells of the cln3 and cak1 DX strains resembled true hyphae in having parallel cell walls along the filament (Fig 1). For many of the other mutants, filament diameters varied and lengths were stunted (see especially kin28, gin4, dbf2, ctk1, and snf1). Our observations with the cln3 DX strain agreed with previous studies of hyperpolarized growth after repression of CLN3 RNA [28, 29].
Fig 1. DX mutant phenotypes.

Strains were stained with Calcofluor White after 4 hr growth at 30°C in YPD medium. Expression levels of core filamentation genes in mutants grown for 4 hr at 30° in YPD are expressed as fold-change to the wild type; complete data are in S2 Table. Strains: WT (DAY286), cln3 DX (CW994), cak1 DX (CW1003), kin28 DX (CW1041), gin4 DX (CW900), dbf2 DX (CW914), ctk1 DX (CW1005), ipl1 DX (CW1038), snf1 DX (CW927), sak1 DX (CW995), ire1 DX (CW906), mck1 DX (CW1006), cdc28 DX (CW991), cmk2 DX (CW999), cdc7 DX (CW993), sha3 DX (CW1010).
Filamentous growth of wild-type C. albicans is accompanied by high-level expression of filamentation-associated genes [19, 38]. Therefore, we sought to determine whether filamentous growth of DX strains observed under noninducing conditions was accompanied by filamentation-associated gene expression. We measured expression of 181 genes in each DX mutant, including five of the eight core filamentation genes [38]: HWP1, ECE1, ALS3, IHD1, and RBT5. Many of the mutants display elevated expression of these core filamentation genes (Fig 1, Table 1). In general, the extent of core filamentation gene up-regulation correlated with the degree of hyperpolarized growth: cln3, cak1 and kin28 DX strains expressed the highest levels of HWP1, ECE1 and ALS3, followed by gin4 and ctk1 DX strains. These results argue that growth limitation imposed by reduced expression of four protein kinase genes, or the essential protein kinase-related gene CLN3, activates both morphogenesis and gene expression arms of the filamentous growth program.
Several DX strains provided exceptions to correlation between filamentous morphology and filamentation gene expression. This group included dbf2, ipl1, snf1, and ire1 DX mutants. These strains displayed filamentous morphology and seemed to have slightly elevated core filamentation gene expression, but the difference from the wild type was not statistically significant (Table 1). We believe that the poor correlation between morphology and gene expression in this group reflects the small number of core filamentation genes. In fact, a large number of other genes that were up-regulated in this set of DX mutants (as well as the cln3, cak1, kin28, gin4, and ctk1 DX mutants) under noninducing conditions (YPD, 30°) were also up-regulated in the wild-type strain under filamentation-inducing conditions (YPD + 10% serum, 37°) (S1 Fig; S2 Table). An additional complication was that several of these DX mutants had heterogeneous morphology (Fig 1), so the gene expression profile of the population may not reflect the gene expression profile of the rare filamentous cells. In summary, there is a good correlation between filamentation and core filamentation gene expression for DX mutants with the most severe phenotypes, and an uncertain correlation for DX mutants with weak or heterogeneous phenotypes.
DX mutant validation
We sought to verify that each defined mutation was the cause of each mutant strain's phenotype. We took two approaches to establish a genotype-phenotype correlation: independent isolate characterization and complementation. For the first approach, we chose seven genes and characterized 3–5 five mutant isolates of each: cln3, cak1, ctk1, kin28, snf1, sak1 and mck1. For the 5 genes that caused hyperfilamentous morphology, we observed that all independent isolates were hyperfilamentous, as indicated by wrinkled colony morphology [39]. In addition, independent DX isolates for most genes showed highly reproducible expression alterations for 181 genes assayed (Fig 2, S3 Table). The one exception was that independent snf1 DX strains had a more variable gene expression phenotype than the other DX strains. It is possible that the snf1 DX strains acquire second-site suppressor mutations that have impact on their gene expression phenotype. These results indicate that independent DX isolates for six of the seven genes tested yield reproducible phenotypes, and support the argument that the defined DX mutations cause the mutant phenotypes in those cases.
Fig 2. DX mutant isolate comparison.

Multiple isolates of each DX strain indicated were obtained from a single transformation of a heterozygous deletion mutant. RNA was extracted from cells grown for 4 hr at 30°C in YPD and used for nanoString expression analysis (S3 Table). Hierarchal clustering of gene expression data was performed using MeV software. Fold change values were obtained by dividing normalized expression values for each mutant strain by the wild-type strain (DAY185) for each of the probes. The color scale represents Log2 fold change compared to wild type. (Blue limit: 10-fold down; yellow limit: 10-fold up.) Strains are listed in S3 Table.
The second approach to test the genotype-phenotype relationship was complementation. We introduced a wild-type copy of the respective affected gene into each of six DX mutants: cak1, cln3, kin28, ctk1, snf1, and sak1. Complementation was assessed through cell morphology, Cek1 phosphorylation, and gene expression profiling. Five of the DX mutants in this group were hyperfilamentous, and we observed that the complemented cln3, kin28, cak1, ctk1, and snf1 DX strains had nonfilamentous morphology when grown at 30° (Fig 3A), similar to the wild-type strain (Fig 1). The sak1 DX strain had nonfilamentous morphology under these conditions, so complementation could not be assessed by morphology. These results indicate that reduced expression of CLN3, KIN28, CAK1, CTK1, or SNF1 causes hyperfilamentation.
Fig 3. DX mutant complementation.

A. Cell morphology. Strains were stained with Calcofluor White after 4 hr growth at 30°C in YPD medium. Strains: cak1 DX (CW1428), cak1 DX comp (CW1431), cln3 DX (CW1437), cln3 DX comp (CW1440), kin28 DX (CW1082), kin28 DX comp (CW1085), ctk1 DX (CW1076), ctk1 DX comp (CW1078), snf1 DX (CW1138), snf1 DX comp (CW1141). B. Cek1 phosphorylation. Immunoblots were performed on yeast extracts from mid-log phase cells grown for 5 hr at 30°C. Strains for lanes 1, 3, 6, 8, 11, 12, 15, and 18 are His-; strains for lanes 2, 4, 5, 7, 9, 10, 13, 14, 16, 17, and 19 are His+. The lanes show experiments with the strain in parentheses: 1 (DAY286), 2 (CW1078), 3 (CW1005), 4 (CW1075), 5 (CW1076), 6 (TA72), 7 (TA86), 8 (CW1041), 9 (CW1082), 10 (CW1085), 11 (DAY286), 12 (CW927), 13 (CW1138), 14 (CW1141), 15 (CW995), 16 (CW1111), 17 (CW1114), 18 (TA72), 19 (TA86). C. Gene expression profiles. RNA was extracted from cells grown for 4 hr at 30°C in YPD and used for nanoString expression analysis (S3 Table). Hierarchal clustering of gene expression data was performed using MeV software. Fold change values were obtained by dividing normalized expression values for each mutant or complemented strain by the wild type strain (DAY185) for each of the probes. The color scale represents Log2 fold change compared to wild type. (Blue limit: 10-fold down; yellow limit: 10-fold up.) Strains are listed in S3 Table.
Complementation was assessed through levels of phosphorylated MAP Kinase Cek1 as well. Activity of Cek1 has been implicated in both filamentation and growth ([40–42]; reviewed in [43]). Immunoblot analysis revealed that the ctk1, kin28, snf1, and sak1 DX mutants had increased levels of phosphorylated Cek1 compared to the wild type (Fig 3B). Complementation of these DX mutants reduced levels of phosphorylated Cek1 (Fig 3B). These results indicate that reduced expression of CTK1, KIN28, SNF1, or SAK1 causes increased accumulation of phosphorylated Cek1.
Complementation was also assessed through assays of RNA levels for 181 genes (Fig 3C, S3 Table). We observed that the most prominent gene expression changes were almost completely reversed by complementation for most of the DX mutants tested. Specifically, the mean fold-change in expression for the 20 most greatly affected genes, compared to the wild-type strain, was reduced in the complemented strains from 9.4 to 1.2 (cak1), 10.1 to 1.5 (kin28), 8.4 to 2.0 (ctk1), 6.3 to 1.5 (snf1), and 2.9 to 1.1 (sak1). We observed partial complementation of the cln3 DX mutant: introduction of wild-type CLN3 reduced the mean fold-change in expression for the 20 most greatly affected genes from 12.6 to 3.1. The level of CLN3 RNA in the complemented strain was ~20% of the wild-type level (S3 Table), which may be the reason for partial complementation. Our analysis supports the idea that reduced expression of CAK1, CLN3, KIN28, CTK1, SNF1, and SAK1 causes the major gene expression changes observed in the respective DX strains.
Cak1 function in biofilm formation
Biofilms of C. albicans include both filamentous cells and yeast cells [44, 45]. We sought to determine whether hyperfilamentous DX strains showed altered biofilm formation. For this analysis we focused on the cak1 DX strain because it had a prominent phenotype. The wild-type, cak1 DX, and complemented strains all formed biofilms of similar depth, as shown in side-view projections of confocal microscopy images (Fig 4A). However, apical views revealed defects in the cak1 DX biofilm (Fig 4B). Specifically, cells in the upper regions (above 180 μm from the substrate) displayed aberrant morphology. In addition, cell staining in these regions was uneven, which may reflect cell wall defects. Biofilm growth is accompanied by accumulation of extracellular matrix, a complex mixture of protein, carbohydrate, and other components [46]. We observed that cak1 DX biofilm matrix had significantly reduced levels of protein (Fig 4C). Levels of one of the best characterized matrix carbohydrate components, soluble β-1,3 glucan, also accumulated at significantly lower levels in the cak1 DX biofilm than in the wild-type or complemented strain biofilms. These results indicate that diminished Cak1 expression does not prevent biofilm formation, but Cak1 is required for normal biofilm cell morphology and matrix production.
Fig 4. Apical projections of biofilm and measurements of biofilm matrix components.

A. Strains were grown under in vitro biofilm conditions for 48 hr, then visualized by confocal microscopy. Side projections of a biofilm of each strain is shown. B. Apical view projections of the same biofilms shown in panel A were obtained using maximum intensity Z-projection of 100 planes at 0.9 μm step-size at the distance indicated from the basal layer. C. Biofilms were grown for matrix isolation. Ten ml of matrix was collected for each strain, biomass collected and dried, and quantitation of matrix total protein, carbohydrate, and normalized values of β-1,3 glucan were determined. Strains: WT (DAY185), cak1 DX (CW1428), cak1 DX comp (CW1431). Triplicate samples for all but cak1 DX carbohydrate (duplicate) determinations. ** = p<0.01 for comparison of either cak1 DX or cak1 DX comp to WT.
Relationships between Cak1 and regulators of filamentation and biofilm formation
Results above indicate that several growth-regulatory protein kinases function as negative regulators of filamentation and filamentation-associated gene expression. We sought to determine whether this role of the protein kinases may be mediated by known transcriptional activators of filamentation genes. We again focused on CAK1 for the analysis.
We chose five major activators of filamentation genes: Bcr1, Brg1, Efg1, Tec1, and Ume6. All are required for filamentation-associated gene expression [47–51]. We verified that a panel of newly made mutants affecting these genes had reduced expression of core filamentation genes (Fig 5A, S4 Table). Under these growth conditions (YPD medium at 37°, which is sufficient for induction of the filamentation pathway [52, 53]), filamentous cell morphogenesis was severely defective in the efg1Δ/Δ mutant, partially defective in the brg1Δ/Δ and tec1Δ/Δ mutants, and largely similar to the wild-type strain in the bcr1Δ/Δ and ume6Δ/Δ mutants (Fig 5B). All of the mutants were also defective in biofilm formation (Fig 5C).
Fig 5. Core filamentation gene expression and phenotypes of filamentation/biofilm activator mutants in CAK1 and cak1 DX backgrounds.

A. RNA levels for environmental response genes was determined by nanoString for strains grown for 4 hr at 37°C in YPD (S4 Table). Normalized expression levels are shown for core filamentation genes in the strains indicated. Transcription activator mutant strains in a CAK1 background as well as the cak1 DX mutant background are shown. Symbols: * = p < 0.05; ** = p < 0.01 for comparison of CAK1 and cak1 DX strains carrying the same activator mutation. Strains are listed in S4 Table. B. Cell morphology. Cell cultures were grown for 4 hr at 37°C in YPD, then fixed and stained with Calcofluor White prior to visualization. Strains: WT (DAY185), bcr1Δ/Δ (CW1627), brg1Δ/Δ (CW1639), efg1Δ/Δ (CW1651), tec1Δ/Δ (CW1646), ume6Δ/Δ (CW1633), cak1 DX (CW1428), cak1 DX bcr1Δ/Δ (CW1547), cak1 DX brg1Δ/Δ (CW1460), cak1 DX efg1Δ/Δ (CW1603), cak1 DX tec1Δ/Δ (CW1579), cak1 DX ume6Δ/Δ (CW1534). C. In vitro biofilms. Strains were grown under in vitro biofilm conditions for 48 hr, then visualized by confocal microscopy. Cross-sectional views are shown. D. Gene expression profiles. RNA was extracted from cells grown for 4 hr at 37°C in YPD and used for nanoString expression analysis (S4 and S5 Tables). Hierarchal clustering of gene expression data was performed from the average of either three isolates (single and double mutants) or four isolates (triple mutants) using MeV software. Fold change values were obtained by dividing normalized expression values for each strain genotype by the wild type strain (DAY185) for each of the probes. The color scale represents Log2 fold change compared to wild type. (Blue limit: 10-fold down; yellow limit: 10-fold up) See S4 and S5 Tables for strains.
Quantitative measurement of gene expression in single and double mutant strains revealed that each filamentation activator was required for the full gene expression response to reduced CAK1 levels (Fig 5A). We used filamentation-inducing growth conditions, in which core filamentation gene expression is similar in the cak1 DX and wild-type strains. In the cak1 DX strain background, expression of most core filamentation genes assayed was substantially reduced by any filamentation activator deletion mutation. For example, levels of ECE1 RNA were reduced between 5- and 50-fold by deletion of any single filamentation activator gene in the cak1 DX background. However, mutation of any particular filamentation activator had less gene expression impact in the cak1 DX background than in the wild-type CAK1 background. For example, levels of ECE1 RNA were increased between 10- and 50-fold by a cak1 DX alteration in any filamentation activator gene deletion background. Therefore, although the expression of filamentation-associated genes remains largely dependent upon these filamentation activators regardless of the state of CAK1, reduced CAK1 expression causes increased residual filamentation-associated gene expression in the absence of major filamentation activators.
A broader view of gene expression levels supports the idea that the cak1 DX background is epistatic to filamentation activator defects. This point is illustrated by the fact that the cak1 DX strain groups together with the cak1 DX-filamentation activator double mutants by unsupervised hierarchical clustering (Fig 5D). Inspection of the data indicates that the cak1 DX strain has highly pleiotropic gene expression effects, and many of those effects are insensitive to deletion of filamentation activators. Therefore, our gene expression data indicate that reduced CAK1 expression can overcome much of the impact of defects in filamentation activators.
Biological impact of the filamentation activator mutations was muted when examined in a cak1 DX background. For example, biofilm formation ability was restored for all activator mutants except the efg1Δ/Δ mutant (Fig 5C). Even though the efg1Δ/Δ mutant remained biofilm-defective, its filamentation ability was greatly improved in the cak1 DX background (Fig 5B). These phenotypic assays indicate that reduced CAK1 expression can bypass the need for Bcr1, Brg1, Tec1, and Ume6 in biofilm formation, and can overcome the dependence of filamentation on Efg1. These biological results argue that the residual expression of filamentation-associated genes that is observed in filamentation activator mutants in the cak1 DX background has substantial phenotypic impact.
The epistasis tests above show that diminished CAK1 expression can override filamentation/biofilm activator defects, based upon several phenotypic assays. One simple interpretation of these outcomes is that Cak1 acts downstream of the filamentation/biofilm activators [54, 55]. However, each filamentation/biofilm activator's target genes overlap considerably with those of the other filamentation/biofilm activators [48]. This point led us to consider an alternative explanation. Specifically, we considered a model in which diminished CAK1 expression may stimulate the functions of several filamentation/biofilm activators. A deletion mutation that removes only one activator might be bypassed through the effects on the other activators. We tested this model through analysis of mutant strains with deletions of two filamentation/biofilm activator genes, BRG1 and UME6. Recent studies indicate that Brg1 promotes initiation of filamentation, whereas Ume6 promotes maintenance of filamentation [51, 56]. In addition, our results show that BRG1 and UME6 RNA levels are increased in the cak1 DX background at 30° (S2 and S3 Tables). We observed that the brg1Δ/Δ ume6Δ/Δ cak1 DX strain had some biofilm formation ability (Fig 6A), and could produce filamentous cells at both 37° and 30° (Fig 6B and 6C). When a wild type copy of CAK1 was introduced into the strain, biofilm formation was eliminated (Fig 6A) and cell morphology (Fig 6B and 6C) more closely resembled that of the brg1Δ/Δ mutant strain (Fig 5B). Quantitative measurement of gene expression in the brg1Δ/Δ ume6Δ/Δ cak1 DX strain revealed a significant increase in expression of core filamentation genes HWP1, ECE1, and ALS3 over that observed in the CAK1-complemented strain (Fig 6D), though the magnitude of expression was greatly reduced compared to the brg1Δ/Δ cak1 DX strain and the ume6Δ/Δ cak1 DX strain (Fig 5A). The fact that the cak1 DX phenotypes are less pronounced in a brg1Δ/Δ ume6Δ/Δ double mutant background than in either the brg1Δ/Δ or ume6Δ/Δ single mutant backgrounds is consistent with the hypothesis that both Brg1 and Ume6 contribute to the cak1 DX phenotypes.
Fig 6. Phenotype and core filamentation gene expression of cak1 DX brg1Δ/Δ ume6Δ/Δ mutant strain.
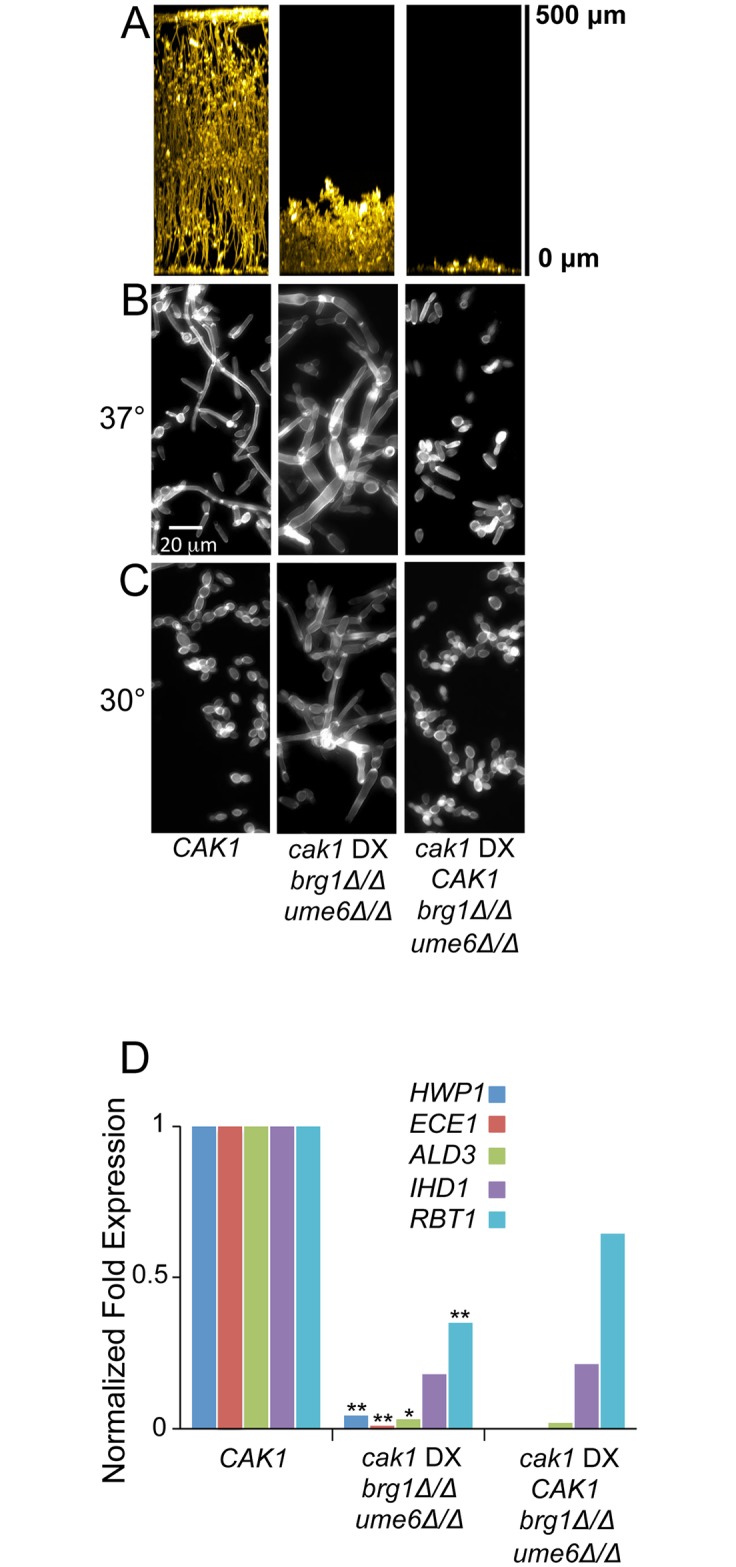
A. In vitro biofilms. Strains were grown under in vitro biofilm conditions for 48 hr, then visualized by confocal microscopy. Cross-sectional views are shown. Strains: CAK1 (DAY185), cak1 DX brg1Δ/Δ ume6Δ/Δ (CW1715), cak1 DX CAK1 brg1Δ/Δ ume6Δ/Δ (CW1720). B. Cell morphology. Cell cultures were grown for 4 hr at 37°C in YPD, then fixed and stained with Calcofluor White prior to visualization. C. Cell morphology. Cell cultures were grown for 4 hr at 30°C in YPD, then fixed and stained with Calcofluor White prior to visualization. D. RNA levels for environmental response genes were determined by nanoString for strains grown for 4 hr at 37°C in YPD (S5 Table). Normalized expression levels are shown for core filamentation genes in the strains indicated. Symbols: * = p < 0.05; ** = p < 0.01 for comparison of cak1 DX brg1Δ/Δ ume6Δ/Δ to cak1 DX CAK1 brg1Δ/Δ ume6Δ/Δ strains.
Discussion
Our results support two main conclusions. First, filamentous morphogenesis is activated together with filamentation-associated gene expression in response to impairment of diverse growth control pathways. These results indicate that growth inhibition can promote C. albicans biofilm formation and virulence, an idea that has also emerged for bacterial pathogens [57, 58]. Second, activation of the filamentation response by cell cycle/cell growth limitation can have distinct regulatory features from the filamentation response of the wild-type strain. We explore these points in greater detail after a brief discussion of the approach that we have implemented to analyze essential C. albicans genes.
Analysis of essential C. albicans genes
Most studies of C. albicans essential genes have employed fusions to regulated promoters [12–17]. The GRACE strain collection is an exceptionally useful resource built upon such a platform [12]. The function of a gene is assessed after it is transcriptionally repressed. This approach is extremely useful, but has some limitations. For example, repression is occasionally incomplete [12]. In addition, it can take many generations to dilute out pre-existing gene product after the regulated promoter has been shut off (see references [59] and [60] for examples). Finally, growth under permissive conditions, when the regulated promoter is active, can result in overexpression of the targeted gene [61, 62] and novel phenotypic consequences. Our approach here was to reduce gene expression constitutively, a concept that has proven extremely useful for uniform analysis of S. cerevisiae essential genes [63]. This approach has the advantage of enabling phenotypic assays under diverse conditions where controlled manipulation of drug concentrations or carbon sources may not be feasible. Also, constitutive down-regulation relieves concern about a protracted time for dilution of pre-existing gene product. Our approach has the disadvantage of potentially selecting for secondary suppressor mutations, and such suppressors may have been the cause of heterogeneity of our snf1 DX strains. A second disadvantage is some genes seemed to be affected very little by our promoter replacement. These and other considerations lead us to suggest that no single approach is ideal for analysis of all genes under all circumstances.
In fact, it seems advantageous to have several approaches available for gene function analysis. A comparison of DX strain cell morphology with results of prior studies illustrates this point (Table 1). In most cases (7 genes), the DX and prior depletion or deletion strains have the same cell morphology, thus providing validation of results. In two cases–CDC7 and CDC28 –the prior conditional depletion strains were filamentous and the DX strains grew as yeast. It seems reasonable that the prior conditional depletion strains had lower gene expression levels than the DX strains. In fact, these two particular DX strains expressed the targeted genes at higher levels than most other DX strains (S1 Table). In the case of CAK1, the DX strain was filamentous and the prior conditional depletion strain grew as yeast. We validated the cak1 DX strain phenotype by both complementation and consistency of independent isolates. Thus it seems reasonable that the DX strain had lower gene expression levels than the prior conditional depletion strain. These examples of gene-specific considerations illustrate that it is useful to have several approaches for functional analysis.
Relationship between filamentation and cell cycle/cell growth control
Several previous reports show that mutation of cell cycle or cell growth regulatory genes can induce filamentous growth under conditions that are noninducing for wild type strains (reviewed in [19, 20]). A recent genome-scale survey of GRACE strains extended the list of such mutants considerably [18], and our study brings the number of protein kinase-related genes that control cell cycle/cell growth and filamentation from nine to thirteen. Our results together with prior studies indicate that many protein kinases with cell cycle or cell growth regulatory functions are negative regulators of filamentous growth in that their inactivation induces filamentation.
Although the connection between cell cycle/cell growth impairment and filamentous growth is well established, the mechanisms that mediate this relationship are uncertain. Our findings shed light on this connection. Specifically, we found that several major transcriptional activators of filamentation-associated genes are required for the full gene expression response to diminished CAK1 expression. This result argues that the filamentation response to cell cycle/cell growth impairment probably does not reflect rogue activity of one particular activator, but instead results from activity of signaling pathways that normally govern filamentous growth.
One unexpected outcome of our analysis is that there is substantial expression of filamentation-associated genes in response to diminished CAK1 levels even in the absence of any key transcriptional activator. The net impact is functional, as revealed through biological assays for filamentation and biofilm formation in vitro. If we interpret the results in the framework of a linear pathway model [54, 55], they suggest that Cak1 may act downstream of the filamentation/biofilm activators to repress target gene expression. However, the overlap among targets of these activators has been well documented [48, 51, 56]. We thus considered the model that diminished CAK1 expression may stimulate several filamentation/biofilm activators, and that each can compensate partially for the absence of any other. The mechanism of activation would have to be post-transcriptional, because at 37° the cak1 DX background has little impact on activator RNA levels (S4 Table); several post-transcriptional control mechanisms for filamentation/biofilm activators are known [64–67]. The model that Cak1 has impact on several filamentation/biofilm activators is consistent with our experimental test, which showed that the cak1 DX phenotype is more strongly affected by absence of Brg1 and Ume6 together than it is by absence of either Brg1 or Ume6 alone. Our results thus argue that the cell cycle impairment by reduced CAK1 expression results from stimulation of multiple filamentation/biofilm activators.
The relationship between filamentation-associated gene expression levels and biofilm formation ability seems puzzling. For example, expression of filamentation-associated genes is not dramatically higher in the brg1Δ/Δ ume6Δ/Δ cak1 DX strain, which is biofilm-competent, as compared to the CAK1 complemented brg1Δ/Δ ume6Δ/Δ cak1 DX strain, which is biofilm-defective (Fig 6D; S5 Table). Perhaps there is a precise threshold for adhesin gene expression levels that can support biofilm formation. This threshold may be reduced in the brg1Δ/Δ ume6Δ/Δ cak1 DX strain because it expresses lower levels of YWP1 than the CAK1 complemented brg1Δ/Δ ume6Δ/Δ cak1 DX strain (S5 Table); YWP1 specifies an anti-adhesin [68]. A second possibility is that reduced CAK1 activity may cause increased expression of alternative biofilm adhesins. We note that several cell wall protein genes are up-regulated in cak1 DX strains (Fig 5D); these genes may specify such alternative adhesins.
Our results together with prior studies indicate that it is common for essential protein kinases to function as negative regulators of filamentation and filamentation-associated genes ([18, 31, 32, 35], reviewed in [20]). Other essential genes are also negative regulators of filamentation [18] and one well studied example, HSP90, exerts its effects through activities of essential protein kinases [37, 69]. There are a few growth inhibitors that activate filamentation or filamentation-associated genes at sub-lethal concentrations [24, 70–72]. It seems possible that such drugs target some of the essential genes whose inactivation causes increased filamentation, as has been shown for inhibitors of Tor1 and Hsp90 [24, 72].
How may the inverse relationship between cell cycle/cell growth and filamentation benefit C. albicans? A rationale originally proposed for S. cerevisiae pseudohyphal growth—that filamentous growth allows escape from an unfavorable environment [73]—seems applicable to C. albicans as well. A second rationale views this relationship in the context of biofilm formation. The cells at the base of a biofilm are critical for adherence of the entire structure to the substrate. Those cells are likely to be nutrient-limited as well, because they are surrounded by other cells with better access to the outside environment. Filamentous growth forms express key biofilm adhesin genes ALS3 and HWP1 [38]. Therefore, induction of filamentation by growth limitation would have the effect of reinforcing biofilm-substrate attachment.
Methods
Media
C. albicans strains were grown at 30°C in YPD or 37°C in YPD, YPD + 10%FBS or in RPMI-1640. Transformants were selected on synthetic medium (2% dextrose, 1.7% Difco yeast nitrogen base with ammonium sulfate and auxotrophic supplements).
Selection of weakly expressed promoters
Based on data from previous experiments, we searched for genes whose expression was unmodulated between planktonic 30° growth in YPD, 37° growth in hyphal inducing spider media, and in kidney infection models. We then looked among those genes for the ones whose expression was low from nanostring data analysis (normalized expression values below 500 counts) and we selected three of varying expression levels: PGA5 (ORF19.3693), PGA42 (ORF19.2907), and ORF19.7606 (S6 Table).
Construction of DX mutants
Heterozygotes were constructed in the BWP17 background by replacing one allele of the gene of interest with the URA3 marker by homologous recombination. PCR was performed using plasmid pGEMURA as template; PCR primers had homology to 100 bp upstream of the ATG or to 100 bp downstream of the stop codon followed by 18–19 bp homology to adaptor sequences on the plasmid surrounding the selective marker. This PCR product was transformed into the C. albicans strain.
The promoter sequences were inserted downstream of ARG4 in pRSARG4ΔSpe, oriented in the same direction as ARG4, by digesting the plasmid with NotI to direct integration of the PCR product carrying promoter sequences by homologous recombination in S. cerevisiae.
The promoter sequences to PGA5, PGA42, and ORF19.7606 were inserted into the plasmid. The promoter for PGA5 included only 400 bp upstream of the start codon (due to the end of an upstream gene located 411 bp upstream of the PGA5 ORF) and the promoters for PGA42 and ORF19.7606 each included 950 bp upstream of their respective start codons. In order to be able to use the same primers to amplify each of the promoters from their respective plasmids, the primers used to amplify sequences for the PGA42 and the ORF19.7606 promoters for insertion into the plasmid included homology to the 30 nucleotides directly upstream of the start codon of PGA5 as a sequence adaptor substituting for those equivalently located nucleotides of PGA42 and ORF19.7606. Thus the forward and reverse primers for amplifying promoter sequences from pRSARG-DX1 (PGA5 promoter), pRSARG-DX2 (PGA42 promoter), or pRSARG-DX3 (ORF19.7606 promoter) were the same for each of the promoters for any specific gene.
The primers for amplifying promoter sequences to be transplaced in front of specific genes were designed to delete somewhere between 50 and 500 bp of the native promoter region of the gene. The general design of the primers used for amplifying the promoter sequences to be transplaced in front of genes is as follows:
Forward primer:
5’ [100 bp upstream sequence of GENE X within 500 bp of ATG] [GTGTGGAATTGTGAGCGGATA (the reverse complement of bp 3960–3980 pRSARG4ΔSpe -this sequence is upstream of ARG4)]3’
Reverse primer:
5’[reverse complement of 1st 100 nts of GENE X ORF] [GATGGATTAAGATGATTGATTGTGATGATT (the reverse complement of the 30 bp adaptor sequence for promoters from 30 bp upstream of PGA5 orf to 1 bp upstream of PGA5 orf)] 3’
Primer pairs were designed to check the specific alleles present in any given transformant: an upstream F check and an ORF rev check to check for the presence of a wild type allele of a gene; the upstream F check and a URA3 rev check to check for the URA3 marked allele; and an adaptor seq F check and the ORF rev check to check for the promotor transplacement.
Strains used are listed in S7 Table.
Complemented strains
When complementing DX mutants, the WT allele was amplified from genomic DNA (SC5314), including 1000 bp upstream and 250 bp downstream of the ORF (shorter distances were used when there were additional genes located within this region). Complementation primers were approximately 80 bp in length and were comprised of a sequence to direct in vivo recombination into plasmid pDDB78 (CAATTTCACACAGGAAACAGCTATGACCATGATTACGCCAAGCT for the forward primer and GTCGACCATATGGGAGAGCTCCCAACGCGTTGGATGCATAG for the reverse primer) followed by a 45mer gene specific sequence. The complementing PCR product was co-transformed along with EcoRI/NotI digested pDDB78 into the S. cerevisiae BJ2698 strain (his1). The resulting complementing plasmid was amplified in E. coli and digested with NruI to direct insertion to the his1 locus of the DX mutant strains. NruI digested pDDB78 was inserted into mutant strains to obtain a marker-matched prototrophic mutant.
Double mutants
When DX mutations were in conjunction with a homozygous deletion of another gene, an unmarked deletion was first constructed of the other gene using the URA3 mini-blaster protocol [74] which utilizes a recyclable cassette, and then this strain was used as the parent for the construction of the DX mutant. His+ prototrophs were made by inserting NruI digested pDDB78 into the mutant strains.
Triple mutants
An unmarked deletion of BRG1 was first constructed using the URA3 mini-blaster protocol [74]. Then UME6 was deleted using a transient CRISPR-Cas9 system [75, 76] utilizing a NAT1 marker. This strain was used as the parent for the construction of the cak1 DX mutant. His+ prototrophs or CAK1 complemented strains were constructed as described above.
RNA extraction
Overnight cultures of cells were diluted into 50 mls fresh medium at specified OD. Cultures were allowed to grow with shaking and cells were then harvested by vacuum filtration and quickly frozen at -80°C until RNA extraction.
RNA extractions were performed using Qiagen RNeasy Mini Kit (cat#74104) with the following modifications. Cells were resuspended from the membranes with 2 x 900 μl ice cold water washes with vortexing for 30 sec after each addition. 1.5 mls of cell suspension was added to prechilled microfuge tubes and centrifuged at top speed for 30 sec. 600 μl RLT + 1%BMSH was added to resuspend the cells and this was added to a fresh 2 ml screw cap tube containing 300 μl Zirconia beads (Ambion, Fisher Scientific) and 600 μl phenol:chloroform:isoamyl alcohol 25:24:1, vortexed on a mini-beadbeater (Biospec Products) for 3 min, and centrifuged at 14000 rpm for 5 min at 4°C. 550 μl of the aqueous phase was transferred to a new microfuge tube, an equal volume of 70% ethanol added, and RNA isolation proceeded as the manufacturer’s instructions.
NanoString analysis
NanoString analysis is a sensitive method for analyzing gene expression of 100–800 targets at a time. For our analysis, 166 targets associated with environmental response pathways, including cell wall stress, osmotic and oxidative stress conditions, hypha development and biofilm formation, along with 15 targets corresponding to the mutants constructed for this work, were selected for analysis. For each nanoString assay, 125–300 ng of Candida RNA extracted from an in vitro liquid culture was added to a nanoString codeset mix and incubated at 65°C overnight (16–18 hours). The reaction mixes were loaded on the nanoString nCounter Prep Station for binding and washing, and the resultant cartridge was transferred to the nanoString nCounter digital analyzer for scanning and data collection. A total of 600 fields were captured per sample. To calculate gene expression ratios among different samples, we normalized adjusted raw counts by total counts of 181 genes after background subtraction [77]. The heat maps were generated using Multiexperimental Viewer 4.9.0 [78]. Preliminary determination of expression levels of the DX alleles was carried out on single his- isolates. Statistical significance was assayed by t-test.
Cell microscopy
Strains were grown overnight and diluted into fresh 30° or 37° YPD at an OD600 of 0.1. Cultures were grown for 4 hr and cells pelleted. 0.5 mls of media was retained in the tube, and cells transferred to microfuge tubes. Cells were pelleted and the supernatant removed. One ml 4% formaldehyde/PBS was added and the tubes were vigorously vortexed for 15 min. Cells were washed one time with PBS, resuspended in 100 μl PBS, and then vortexed. Calcofluor White (5.5mg/ml in 50% DMSO) was added to 0.2 mg/ml, cells were vortexed and then incubated for 15 min with an occasional flicking. Cells were stored at 4° in the dark until visualization. Cells were diluted 1:2 with PBS and pipetted onto slides coated with concanavalin A. Cells were visualized with a Zeiss Axio Observer Z.1 fluorescence microscope and a 20x objective.
Biofilm microscopy
The strains being analyzed were grown overnight in YPD at 30°C. The overnight cultures were used to inoculate wells with 2 mls of fresh YPD media at an OD600 of 0.5 on silicone squares (Bentec Medical Inc.) that were pretreated with fetal bovine serum (FBS). The cells were allowed to adhere to the silicone for 90 min in an incubator-shaker at 37°C and 60 rpm. Following the adherence, the squares were washed in PBS to remove any nonadherent cells and placed in wells containing 2 mls of new YPD media. Biofilm imaging is adapted from [79] with modifications. After 48 hours, the biofilms were fixed using 4% formaldehyde and 1.5% glutaraldehyde in 1xPBS on an orbital mixer for 1 hour. After fixation the specimens were washed in 1xPBS. The fixed biofilms were stained with concanavalin A, Alexa Fluor 594 Conjugate (Life Technologies) at a concentration of 25 μg/ml in PBS for two days on an orbital mixer. The fixed and stained biofilms on the silicone squares were then transferred to glass scintillation vials. To dehydrate the samples, 2 mls of methanol were added to the samples and allowed to infiltrate on an orbital mixer for 20 min. The methanol was aspirated out and 2 mls of methanol were briefly added. After the 100% methanol addition, a 50:50 mixture of methanol and methyl salicylate was added. The 50:50 mixture was aspirated out and replaced with 100% methyl salicylate. The vials were gently agitated until the samples were completely cleared through the matching of refractive index. In order to image these samples using an inverted confocal microscope and avoiding the use of plastic, a cover glass was cemented to the bottom of a black-anodized aluminum stage insert. A silicone ring (thickness 300μm) and a small amount of methyl salicylate were added to this constructed well and the biofilm was placed on the ring with the apical side facing down, using the surface tension between the methyl salicylate and the silicone square to hold the silicon in place. The biofilms were imaged using a slit-scan confocal optical unit on a Zeiss Axiovert 200 microscope. A 40x 0.85-numerical aperture oil immersion objective was used in order to provide enough working distance to focus through the full thickness of the biofilms. Optical sections were collected in several series of 130 planes with a total sum of 500 planes (Fig 4) or 557 planes (Fig 6A) at 0.9 μm step-size. The stacks were concatenated and processed using FIJI software [80]. The images were processed using the Background Subtract plugin and the final images were obtained using a resliced, maximum intensity Z-projection. The apical view projections were obtained using the Temporal Color-code plugin and the Ice lookup table.
Cek1 phosphorylation analysis
Protein extraction and immunoblots were performed as described [81]. Proteins were extracted from cells grown to mid-log phase (~5 hr) at 30°C in YPD media. Protein samples were separated on 10% SDS polyacrylamide gels (SDS-PAGE) and transferred to nitrocellulose membranes (Protran BA85, VWR International Inc., Bridgeport NJ). Membranes were blocked in immunoblot buffer (5% nonfat dry milk, 10mM Tris-HCl [pH 8], 150mM NaCl and 0.05% Tween 20) for 16h at 4°C. Cdc2 p34 antibody that recognizes the PSTAIRE motif was used as a loading control (Santa Cruz Biotechnology, Santa Cruz, CA; #sc-53). P~Cek1 was detected by p42/p44 antibodies (Cell Signaling Technology, Danvers, MA; #4370). Secondary antibodies included goat α-mouse IgG–HRP (Bio-Rad Laboratories, Hercules, CA; #170–6516), goat α-rabbit IgG-HRP (Jackson ImmunoResearch Laboratories, Inc., West Grove, PA; #111-035-144), donkey α-goat IgG-HRP (Santa Cruz Biotechnology, Santa Cruz, CA; #sc-2020). Ponceau S (Sigma, St. Louis, MO; #P7170) was used to confirm protein levels. WesternBright MCF fluorescent Western blotting kit from Advansta Inc. (Menlo Park, CA; LPS #K-12045-D20) was used for detection. Densitometry was performed on immunoblots to calculate the levels of P~Cek1 in selected DX mutants. After background subtraction, band intensity of P~Cek1 and PSTAIRE were measured for each sample by ImageJ (https://imagej.nih.gov/ij/). The ratio of P~Cek1/PSTAIRE was set to 1.0 for wild type and calculated for other samples to measure the relative difference in P~Cek1 levels.
Biofilm production
Extracellular matrix was collected from two roller bottles, as published previously [82]. Briefly, cells from an overnight culture were used to create an inoculum of 106 cells/ml in RPMI-MOPS. One ml inoculum was added to each bottle, and biofilms were incubated at 37°C for 48 hr at 50 rpm, with a media exchange at 24 hr. The biofilms were removed from the bottles using a spatula and suspended in water, then sonicated for 20 min. These were centrifuged at 4,000 rpm for 20 min at 4°C, separating the soluble matrix from the cell pellet (biomass). For normalization of subsequent ELISA data, the biomass of each biofilm from the group was collected, lyophilized, and weighed.
BCA protein assay and total carbohydrate
Biofilm matrix protein was measured using a BCA protein assay (Thermo-scientific), slightly modified from the manufacturer’s instructions. Briefly, 100μl of isolated matrix samples in triplicate were incubated with the BCA reagents 30min at 37°C. ODs were read at 562nm and protein concentrations calculated from a BSA standard curve. Raw data generated by the BCA assay was normalized by relative biofilm biomass then presented as μg/mg. The total carbohydrate contents of each sample was measured as hexoses by the phenol-sulfuric acid method and normalized by biomass. T-tests were used to determine statistical significance for both BCA and phenol-sulfuric acid assays.
ELISA
Matrix samples were analyzed by ELISA using a monoclonal antibody against β-1,3 Glucan (Australia Biosupplies) as previously described [46, 83]. This assay used laminarin (Sigma) as standard curve, at least two biological replicates were performed, and the mean of three technical replicates from one representative assay was calculated. Once normalized by biomass, these values were presented as μg/mg. T-tests were used to determine statistical significance.
Supporting Information
RNA was extracted from cells grown for 4 hr at 30°C in YPD or in addition for the WT strain, grown for 5 hr at 37°C in RPMI and used for nanoString expression analysis (S2 Table). Hierarchal clustering of gene expression data was performed from single isolates using MeV software. Fold change values were obtained by dividing normalized expression values for each mutant strain by the wild type strain (DAY286) for each of the probes. The color scale represents Log2 fold change compared to wild type. (Blue limit: 10-fold down; yellow limit: 10-fold up) See S2 Table for strains.
(PPTX)
NanoString measurements of DX allele expression are provided as normalized numbers following RNA extraction from cells grown for 4hr at 30°C in YPD or 5 hr at 37°C in RPMI.
(DOCX)
NanoString measurements of target gene expression are provided as normalized numbers following RNA extraction from cells grown for 4hr at 30°C in YPD. WT, in addition, was also analyzed following growth for 5 hr 37°C in RPMI.
(XLSX)
NanoString measurements of target gene expression are provided as normalized numbers following RNA extraction from cells grown for 4hr at 30°C in YPD.
(XLSX)
NanoString measurements of target gene expression are provided as normalized numbers following RNA extraction from cells grown for 4hr at 37°C in YPD.
(XLSX)
NanoString measurements of target gene expression are provided as normalized numbers following RNA extraction from cells grown for 4hr at 37°C in YPD.
(XLS)
NanoString measurements of target gene expression are provided as normalized numbers following RNA extraction from Candida albicans harvested from the listed growth conditions.
(XLSX)
(XLSX)
Acknowledgments
We thank Saranna Fanning for many helpful discussions while this work was in progress, Maxwell W. Mitchell for advice about statistical analysis, and Lori Burrows for references on antibiotic stimulation of biofilm growth.
Data Availability
All relevant data are within the paper and its Supporting Information files.
Funding Statement
This work was supported by NIH grants R01 DE022720 (PJC), R01 AI073289 (DRA), R01 AI067703 (APM), and R21 AI100270 (APM). The funders had no role in study design, data collection and analysis, decision to publish, or preparation of the manuscript.
References
- 1.Brown GD, Denning DW, Gow NA, Levitz SM, Netea MG, White TC. Hidden killers: human fungal infections. Sci Transl Med. 2012;4(165):165rv13 10.1126/scitranslmed.3004404 [DOI] [PubMed] [Google Scholar]
- 2.Kibbler CC, Seaton S, Barnes RA, Gransden WR, Holliman RE, Johnson EM, et al. Management and outcome of bloodstream infections due to Candida species in England and Wales. J Hosp Infect. 2003;54(1):18–24. [DOI] [PubMed] [Google Scholar]
- 3.Macphail GL, Taylor GD, Buchanan-Chell M, Ross C, Wilson S, Kureishi A. Epidemiology, treatment and outcome of candidemia: a five-year review at three Canadian hospitals. Mycoses. 2002;45(5–6):141–5. [DOI] [PubMed] [Google Scholar]
- 4.Pfaller MA, Diekema DJ. Epidemiology of invasive candidiasis: a persistent public health problem. Clin Microbiol Rev. 2007;20(1):133–63. 10.1128/CMR.00029-06 [DOI] [PMC free article] [PubMed] [Google Scholar]
- 5.Roemer T, Krysan DJ. Antifungal drug development: challenges, unmet clinical needs, and new approaches. Cold Spring Harb Perspect Med. 2014;4(5). [DOI] [PMC free article] [PubMed] [Google Scholar]
- 6.Stroehlein AJ, Young ND, Jex AR, Sternberg PW, Tan P, Boag PR, et al. Defining the Schistosoma haematobium kinome enables the prediction of essential kinases as anti-schistosome drug targets. Sci Rep. 2015;5:17759 10.1038/srep17759 [DOI] [PMC free article] [PubMed] [Google Scholar]
- 7.Melak T, Gakkhar S. Comparative Genome and Network Centrality Analysis to Identify Drug Targets of Mycobacterium tuberculosis H37Rv. Biomed Res Int. 2015;2015:212061 10.1155/2015/212061 [DOI] [PMC free article] [PubMed] [Google Scholar]
- 8.Ianiri G, Idnurm A. Essential gene discovery in the basidiomycete Cryptococcus neoformans for antifungal drug target prioritization. MBio. 2015;6(2). [DOI] [PMC free article] [PubMed] [Google Scholar]
- 9.Mobegi FM, van Hijum SA, Burghout P, Bootsma HJ, de Vries SP, van der Gaast-de Jongh CE, et al. From microbial gene essentiality to novel antimicrobial drug targets. BMC Genomics. 2014;15:958 10.1186/1471-2164-15-958 [DOI] [PMC free article] [PubMed] [Google Scholar]
- 10.Finkel JS, Yudanin N, Nett JE, Andes DR, Mitchell AP. Application of the systematic "DAmP" approach to create a partially defective C. albicans mutant. Fungal Genet Biol. 2011;48(11):1056–61. 10.1016/j.fgb.2011.07.005 [DOI] [PMC free article] [PubMed] [Google Scholar]
- 11.Devasahayam G, Chaturvedi V, Hanes SD. The Ess1 prolyl isomerase is required for growth and morphogenetic switching in Candida albicans. Genetics. 2002;160(1):37–48. [DOI] [PMC free article] [PubMed] [Google Scholar]
- 12.Roemer T, Jiang B, Davison J, Ketela T, Veillette K, Breton A, et al. Large-scale essential gene identification in Candida albicans and applications to antifungal drug discovery. Mol Microbiol. 2003;50(1):167–81. [DOI] [PubMed] [Google Scholar]
- 13.Nakayama H, Mio T, Nagahashi S, Kokado M, Arisawa M, Aoki Y. Tetracycline-regulatable system to tightly control gene expression in the pathogenic fungus Candida albicans. Infect Immun. 2000;68(12):6712–9. [DOI] [PMC free article] [PubMed] [Google Scholar]
- 14.Park YN, Morschhauser J. Tetracycline-inducible gene expression and gene deletion in Candida albicans. Eukaryot Cell. 2005;4(8):1328–42. 10.1128/EC.4.8.1328-1342.2005 [DOI] [PMC free article] [PubMed] [Google Scholar]
- 15.Care RS, Trevethick J, Binley KM, Sudbery PE. The MET3 promoter: a new tool for Candida albicans molecular genetics. Mol Microbiol. 1999;34(4):792–8. [DOI] [PubMed] [Google Scholar]
- 16.Leuker CE, Sonneborn A, Delbruck S, Ernst JF. Sequence and promoter regulation of the PCK1 gene encoding phosphoenolpyruvate carboxykinase of the fungal pathogen Candida albicans. Gene. 1997;192(2):235–40. [DOI] [PubMed] [Google Scholar]
- 17.Backen AC, Broadbent ID, Fetherston RW, Rosamond JD, Schnell NF, Stark MJ. Evaluation of the CaMAL2 promoter for regulated expression of genes in Candida albicans. Yeast. 2000;16(12):1121–9. 10.1002/1097-0061(20000915)16:12<1121::AID-YEA614>3.0.CO;2-U [DOI] [PubMed] [Google Scholar]
- 18.O'Meara TR, Veri AO, Ketela T, Jiang B, Roemer T, Cowen LE. Global analysis of fungal morphology exposes mechanisms of host cell escape. Nat Commun. 2015;6:6741 10.1038/ncomms7741 [DOI] [PMC free article] [PubMed] [Google Scholar]
- 19.Sudbery PE. Growth of Candida albicans hyphae. Nat Rev Microbiol. 2011;9(10):737–48. 10.1038/nrmicro2636 [DOI] [PubMed] [Google Scholar]
- 20.Berman J. Morphogenesis and cell cycle progression in Candida albicans. Curr Opin Microbiol. 2006;9(6):595–601. 10.1016/j.mib.2006.10.007 [DOI] [PMC free article] [PubMed] [Google Scholar]
- 21.Mayer FL, Wilson D, Hube B. Candida albicans pathogenicity mechanisms. Virulence. 2013;4(2):119–28. 10.4161/viru.22913 [DOI] [PMC free article] [PubMed] [Google Scholar]
- 22.Thompson DS, Carlisle PL, Kadosh D. Coevolution of morphology and virulence in Candida species. Eukaryot Cell. 2011;10(9):1173–82. 10.1128/EC.05085-11 [DOI] [PMC free article] [PubMed] [Google Scholar]
- 23.Bachewich C, Nantel A, Whiteway M. Cell cycle arrest during S or M phase generates polarized growth via distinct signals in Candida albicans. Mol Microbiol. 2005;57(4):942–59. 10.1111/j.1365-2958.2005.04727.x [DOI] [PubMed] [Google Scholar]
- 24.Bastidas RJ, Heitman J, Cardenas ME. The protein kinase Tor1 regulates adhesin gene expression in Candida albicans. PLoS Pathog. 2009;5(2):e1000294 10.1371/journal.ppat.1000294 [DOI] [PMC free article] [PubMed] [Google Scholar]
- 25.Rask-Andersen M, Masuram S, Schioth HB. The druggable genome: Evaluation of drug targets in clinical trials suggests major shifts in molecular class and indication. Annu Rev Pharmacol Toxicol. 2014;54:9–26. 10.1146/annurev-pharmtox-011613-135943 [DOI] [PubMed] [Google Scholar]
- 26.Merritt C, Silva LE, Tanner AL, Stuart K, Pollastri MP. Kinases as druggable targets in trypanosomatid protozoan parasites. Chem Rev. 2014;114(22):11280–304. 10.1021/cr500197d [DOI] [PMC free article] [PubMed] [Google Scholar]
- 27.Blankenship JR, Fanning S, Hamaker JJ, Mitchell AP. An extensive circuitry for cell wall regulation in Candida albicans. PLoS Pathog. 2010;6(2):e1000752 10.1371/journal.ppat.1000752 [DOI] [PMC free article] [PubMed] [Google Scholar]
- 28.Bachewich C, Whiteway M. Cyclin Cln3p links G1 progression to hyphal and pseudohyphal development in Candida albicans. Eukaryot Cell. 2005;4(1):95–102. 10.1128/EC.4.1.95-102.2005 [DOI] [PMC free article] [PubMed] [Google Scholar]
- 29.Chapa y Lazo B, Bates S, Sudbery P. The G1 cyclin Cln3 regulates morphogenesis in Candida albicans. Eukaryot Cell. 2005;4(1):90–4. 10.1128/EC.4.1.90-94.2005 [DOI] [PMC free article] [PubMed] [Google Scholar]
- 30.Gonzalez-Novo A, Labrador L, Pablo-Hernando ME, Correa-Bordes J, Sanchez M, Jimenez J, et al. Dbf2 is essential for cytokinesis and correct mitotic spindle formation in Candida albicans. Mol Microbiol. 2009;72(6):1364–78. 10.1111/j.1365-2958.2009.06729.x [DOI] [PubMed] [Google Scholar]
- 31.Wightman R, Bates S, Amornrrattanapan P, Sudbery P. In Candida albicans, the Nim1 kinases Gin4 and Hsl1 negatively regulate pseudohypha formation and Gin4 also controls septin organization. J Cell Biol. 2004;164(4):581–91. 10.1083/jcb.200307176 [DOI] [PMC free article] [PubMed] [Google Scholar]
- 32.Umeyama T, Kaneko A, Niimi M, Uehara Y. Repression of CDC28 reduces the expression of the morphology-related transcription factors, Efg1p, Nrg1p, Rbf1p, Rim101p, Fkh2p and Tec1p and induces cell elongation in Candida albicans. Yeast. 2006;23(7):537–52. 10.1002/yea.1373 [DOI] [PubMed] [Google Scholar]
- 33.Ding X, Yu Q, Zhang B, Xu N, Jia C, Dong Y, et al. The type II Ca2+/calmodulin-dependent protein kinases are involved in the regulation of cell wall integrity and oxidative stress response in Candida albicans. Biochem Biophys Res Commun. 2014;446(4):1073–8. 10.1016/j.bbrc.2014.03.059 [DOI] [PubMed] [Google Scholar]
- 34.Alby K, Schaefer D, Sherwood RK, Jones SK Jr., Bennett RJ. Identification of a cell death pathway in Candida albicans during the response to pheromone. Eukaryot Cell. 2010;9(11):1690–701. 10.1128/EC.00155-10 [DOI] [PMC free article] [PubMed] [Google Scholar]
- 35.Bachewich C, Thomas DY, Whiteway M. Depletion of a polo-like kinase in Candida albicans activates cyclase-dependent hyphal-like growth. Mol Biol Cell. 2003;14(5):2163–80. 10.1091/mbc.02-05-0076 [DOI] [PMC free article] [PubMed] [Google Scholar]
- 36.Kamthan M, Nalla VK, Ruhela D, Kamthan A, Maiti P, Datta A. Characterization of a putative spindle assembly checkpoint kinase Mps1, suggests its involvement in cell division, morphogenesis and oxidative stress tolerance in Candida albicans. PLoS One. 2014;9(7):e101517 10.1371/journal.pone.0101517 [DOI] [PMC free article] [PubMed] [Google Scholar]
- 37.Shapiro RS, Sellam A, Tebbji F, Whiteway M, Nantel A, Cowen LE. Pho85, Pcl1, and Hms1 signaling governs Candida albicans morphogenesis induced by high temperature or Hsp90 compromise. Curr Biol. 2012;22(6):461–70. 10.1016/j.cub.2012.01.062 [DOI] [PubMed] [Google Scholar]
- 38.Martin R, Albrecht-Eckardt D, Brunke S, Hube B, Hunniger K, Kurzai O. A core filamentation response network in Candida albicans is restricted to eight genes. PLoS One. 2013;8(3):e58613 10.1371/journal.pone.0058613 [DOI] [PMC free article] [PubMed] [Google Scholar]
- 39.Morales DK, Grahl N, Okegbe C, Dietrich LE, Jacobs NJ, Hogan DA. Control of Candida albicans metabolism and biofilm formation by Pseudomonas aeruginosa phenazines. MBio. 2013;4(1):e00526–12. 10.1128/mBio.00526-12 [DOI] [PMC free article] [PubMed] [Google Scholar]
- 40.Kohler JR, Fink GR. Candida albicans strains heterozygous and homozygous for mutations in mitogen-activated protein kinase signaling components have defects in hyphal development. Proc Natl Acad Sci U S A. 1996;93(23):13223–8. [DOI] [PMC free article] [PubMed] [Google Scholar]
- 41.Leberer E, Harcus D, Broadbent ID, Clark KL, Dignard D, Ziegelbauer K, et al. Signal transduction through homologs of the Ste20p and Ste7p protein kinases can trigger hyphal formation in the pathogenic fungus Candida albicans. Proc Natl Acad Sci U S A. 1996;93(23):13217–22. [DOI] [PMC free article] [PubMed] [Google Scholar]
- 42.Liu H, Kohler J, Fink GR. Suppression of hyphal formation in Candida albicans by mutation of a STE12 homolog. Science. 1994;266(5191):1723–6. [DOI] [PubMed] [Google Scholar]
- 43.Biswas S, Van Dijck P, Datta A. Environmental sensing and signal transduction pathways regulating morphopathogenic determinants of Candida albicans. Microbiol Mol Biol Rev. 2007;71(2):348–76. 10.1128/MMBR.00009-06 [DOI] [PMC free article] [PubMed] [Google Scholar]
- 44.Desai JV, Mitchell AP. Candida albicans Biofilm Development and Its Genetic Control. Microbiol Spectr. 2015;3(3). [DOI] [PMC free article] [PubMed] [Google Scholar]
- 45.Finkel JS, Mitchell AP. Genetic control of Candida albicans biofilm development. Nat Rev Microbiol. 2011;9(2):109–18. 10.1038/nrmicro2475 [DOI] [PMC free article] [PubMed] [Google Scholar]
- 46.Zarnowski R, Westler WM, Lacmbouh GA, Marita JM, Bothe JR, Bernhardt J, et al. Novel entries in a fungal biofilm matrix encyclopedia. MBio. 2014;5(4):e01333–14. 10.1128/mBio.01333-14 [DOI] [PMC free article] [PubMed] [Google Scholar]
- 47.Nobile CJ, Mitchell AP. Regulation of cell-surface genes and biofilm formation by the C. albicans transcription factor Bcr1p. Curr Biol. 2005;15(12):1150–5. 10.1016/j.cub.2005.05.047 [DOI] [PubMed] [Google Scholar]
- 48.Nobile CJ, Fox EP, Nett JE, Sorrells TR, Mitrovich QM, Hernday AD, et al. A recently evolved transcriptional network controls biofilm development in Candida albicans. Cell. 2012;148(1–2):126–38. 10.1016/j.cell.2011.10.048 [DOI] [PMC free article] [PubMed] [Google Scholar]
- 49.Du H, Guan G, Xie J, Sun Y, Tong Y, Zhang L, et al. Roles of Candida albicans Gat2, a GATA-type zinc finger transcription factor, in biofilm formation, filamentous growth and virulence. PLoS One. 2012;7(1):e29707 10.1371/journal.pone.0029707 [DOI] [PMC free article] [PubMed] [Google Scholar]
- 50.Ramage G, VandeWalle K, Lopez-Ribot JL, Wickes BL. The filamentation pathway controlled by the Efg1 regulator protein is required for normal biofilm formation and development in Candida albicans. FEMS Microbiol Lett. 2002;214(1):95–100. [DOI] [PubMed] [Google Scholar]
- 51.Banerjee M, Thompson DS, Lazzell A, Carlisle PL, Pierce C, Monteagudo C, et al. UME6, a novel filament-specific regulator of Candida albicans hyphal extension and virulence. Mol Biol Cell. 2008;19(4):1354–65. 10.1091/mbc.E07-11-1110 [DOI] [PMC free article] [PubMed] [Google Scholar]
- 52.Kadosh D, Johnson AD. Induction of the Candida albicans filamentous growth program by relief of transcriptional repression: a genome-wide analysis. Mol Biol Cell. 2005;16(6):2903–12. 10.1091/mbc.E05-01-0073 [DOI] [PMC free article] [PubMed] [Google Scholar]
- 53.Si H, Hernday AD, Hirakawa MP, Johnson AD, Bennett RJ. Candida albicans white and opaque cells undergo distinct programs of filamentous growth. PLoS Pathog. 2013;9(3):e1003210 10.1371/journal.ppat.1003210 [DOI] [PMC free article] [PubMed] [Google Scholar]
- 54.Roth FP, Lipshitz HD, Andrews BJ. Q&A: Epistasis. Journal of Biology. 2009;8. [DOI] [PMC free article] [PubMed] [Google Scholar]
- 55.Huang LS, Sternberg PW. Genetic dissection of developmental pathways WormBook. 2006:1–19. [DOI] [PMC free article] [PubMed] [Google Scholar]
- 56.Lu Y, Su C, Liu H. Candida albicans hyphal initiation and elongation. Trends Microbiol. 2014;22(12):707–14. 10.1016/j.tim.2014.09.001 [DOI] [PMC free article] [PubMed] [Google Scholar]
- 57.Hoffman LR, D'Argenio DA, MacCoss MJ, Zhang Z, Jones RA, Miller SI. Aminoglycoside antibiotics induce bacterial biofilm formation. Nature. 2005;436(7054):1171–5. 10.1038/nature03912 [DOI] [PubMed] [Google Scholar]
- 58.Kaplan JB, Izano EA, Gopal P, Karwacki MT, Kim S, Bose JL, et al. Low levels of beta-lactam antibiotics induce extracellular DNA release and biofilm formation in Staphylococcus aureus. MBio. 2012;3(4):e00198–12. 10.1128/mBio.00198-12 [DOI] [PMC free article] [PubMed] [Google Scholar]
- 59.Fan X, Geisberg JV, Wong KH, Jin Y. Conditional depletion of nuclear proteins by the Anchor Away system. Curr Protoc Mol Biol. 2011;Chapter 13:Unit13 0B. [DOI] [PMC free article] [PubMed] [Google Scholar]
- 60.Moqtaderi Z, Bai Y, Poon D, Weil PA, Struhl K. TBP-associated factors are not generally required for transcriptional activation in yeast. Nature. 1996;383(6596):188–91. 10.1038/383188a0 [DOI] [PubMed] [Google Scholar]
- 61.Carlisle PL, Banerjee M, Lazzell A, Monteagudo C, Lopez-Ribot JL, Kadosh D. Expression levels of a filament-specific transcriptional regulator are sufficient to determine Candida albicans morphology and virulence. Proc Natl Acad Sci U S A. 2009;106(2):599–604. 10.1073/pnas.0804061106 [DOI] [PMC free article] [PubMed] [Google Scholar]
- 62.Saville SP, Lazzell AL, Monteagudo C, Lopez-Ribot JL. Engineered control of cell morphology in vivo reveals distinct roles for yeast and filamentous forms of Candida albicans during infection. Eukaryot Cell. 2003;2(5):1053–60. 10.1128/EC.2.5.1053-1060.2003 [DOI] [PMC free article] [PubMed] [Google Scholar]
- 63.Yan Z, Costanzo M, Heisler LE, Paw J, Kaper F, Andrews BJ, et al. Yeast Barcoders: a chemogenomic application of a universal donor-strain collection carrying bar-code identifiers. Nat Methods. 2008;5(8):719–25. 10.1038/nmeth.1231 [DOI] [PubMed] [Google Scholar]
- 64.Childers DS, Mundodi V, Banerjee M, Kadosh D. A 5' UTR-mediated translational efficiency mechanism inhibits the Candida albicans morphological transition. Mol Microbiol. 2014;92(3):570–85. 10.1111/mmi.12576 [DOI] [PMC free article] [PubMed] [Google Scholar]
- 65.Desai PR, van Wijlick L, Kurtz D, Juchimiuk M, Ernst JF. Hypoxia and Temperature Regulated Morphogenesis in Candida albicans. PLoS Genet. 2015;11(8):e1005447 10.1371/journal.pgen.1005447 [DOI] [PMC free article] [PubMed] [Google Scholar]
- 66.Wang A, Raniga PP, Lane S, Lu Y, Liu H. Hyphal chain formation in Candida albicans: Cdc28-Hgc1 phosphorylation of Efg1 represses cell separation genes. Mol Cell Biol. 2009;29(16):4406–16. 10.1128/MCB.01502-08 [DOI] [PMC free article] [PubMed] [Google Scholar]
- 67.Lu Y, Su C, Solis NV, Filler SG, Liu H. Synergistic regulation of hyphal elongation by hypoxia, CO(2), and nutrient conditions controls the virulence of Candida albicans. Cell Host Microbe. 2013;14(5):499–509. 10.1016/j.chom.2013.10.008 [DOI] [PMC free article] [PubMed] [Google Scholar]
- 68.Granger BL, Flenniken ML, Davis DA, Mitchell AP, Cutler JE. Yeast wall protein 1 of Candida albicans. Microbology. 2005;151:1631–44. [DOI] [PubMed] [Google Scholar]
- 69.Senn H, Shapiro RS, Cowen LE. Cdc28 provides a molecular link between Hsp90, morphogenesis, and cell cycle progression in Candida albicans. Mol Biol Cell. 2012;23(2):268–83. 10.1091/mbc.E11-08-0729 [DOI] [PMC free article] [PubMed] [Google Scholar]
- 70.Egbe NE, Paget CM, Wang H, Ashe MP. Alcohols inhibit translation to regulate morphogenesis in C. albicans. Fungal Genet Biol. 2015;77:50–60. 10.1016/j.fgb.2015.03.008 [DOI] [PMC free article] [PubMed] [Google Scholar]
- 71.Ma C, Du F, Yan L, He G, He J, Wang C, et al. Potent Activities of Roemerine against Candida albicans and the Underlying Mechanisms. Molecules. 2015;20(10):17913–28. 10.3390/molecules201017913 [DOI] [PMC free article] [PubMed] [Google Scholar]
- 72.Shapiro RS, Uppuluri P, Zaas AK, Collins C, Senn H, Perfect JR, et al. Hsp90 orchestrates temperature-dependent Candida albicans morphogenesis via Ras1-PKA signaling. Curr Biol. 2009;19(8):621–9. 10.1016/j.cub.2009.03.017 [DOI] [PMC free article] [PubMed] [Google Scholar]
- 73.Gimeno CJ, Ljungdahl PO, Styles CA, Fink GR. Unipolar cell divisions in the yeast S. cerevisiae lead to filamentous growth: regulation by starvation and RAS. Cell. 1992;68(6):1077–90. [DOI] [PubMed] [Google Scholar]
- 74.Ganguly S, Mitchell AP. Mini-blaster-mediated targeted gene disruption and marker complementation in Candida albicans. Methods Mol Biol. 2012;845:19–39. 10.1007/978-1-61779-539-8_2 [DOI] [PMC free article] [PubMed] [Google Scholar]
- 75.Min K, Ichikawa Y, Woolford CA, Mitchell AP. Candida albicans Gene Deletion with a Transient CRISPR-Cas9 System. mSphere. 2016;1(3). [DOI] [PMC free article] [PubMed] [Google Scholar]
- 76.Vyas VK, Barrasa MI, Fink GR. A Candida albicans CRISPR system permits genetic engineering of essential genes and gene families. Sci Adv. 2015;1(3):e1500248 10.1126/sciadv.1500248 [DOI] [PMC free article] [PubMed] [Google Scholar]
- 77.Finkel JS, Xu W, Huang D, Hill EM, Desai JV, Woolford CA, et al. Portrait of Candida albicans adherence regulators. PLoS Pathog. 2012;8(2):e1002525 10.1371/journal.ppat.1002525 [DOI] [PMC free article] [PubMed] [Google Scholar]
- 78.Saeed AI, Sharov V, White J, Li J, Liang W, Bhagabati N, et al. TM4: a free, open-source system for microarray data management and analysis. Biotechniques. 2003;34(2):374–8. [DOI] [PubMed] [Google Scholar]
- 79.Desai JV, Bruno VM, Ganguly S, Stamper RJ, Mitchell KF, Solis N, et al. Regulatory role of glycerol in Candida albicans biofilm formation. MBio. 2013;4(2):e00637–12. 10.1128/mBio.00637-12 [DOI] [PMC free article] [PubMed] [Google Scholar]
- 80.Schindelin J, Arganda-Carreras I, Frise E, Kaynig V, Longair M, Pietzsch T, et al. Fiji: an open-source platform for biological-image analysis. Nat Methods. 2012;9(7):676–82. 10.1038/nmeth.2019 [DOI] [PMC free article] [PubMed] [Google Scholar]
- 81.Adhikari H, Cullen PJ. Metabolic respiration induces AMPK- and Ire1p-dependent activation of the p38-Type HOG MAPK pathway. PLoS Genet. 2014;10(10):e1004734 10.1371/journal.pgen.1004734 [DOI] [PMC free article] [PubMed] [Google Scholar]
- 82.Taff HT, Nett JE, Zarnowski R, Ross KM, Sanchez H, Cain MT, et al. A Candida biofilm-induced pathway for matrix glucan delivery: implications for drug resistance. PLoS Pathog. 2012;8(8):e1002848 10.1371/journal.ppat.1002848 [DOI] [PMC free article] [PubMed] [Google Scholar]
- 83.Yokoyama WM. Production of monoclonal antibodies. Curr Protoc Cell Biol. 2001;Chapter 16:Unit 16 1 10.1002/0471143030.cb1601s03 [DOI] [PubMed] [Google Scholar]
Associated Data
This section collects any data citations, data availability statements, or supplementary materials included in this article.
Supplementary Materials
RNA was extracted from cells grown for 4 hr at 30°C in YPD or in addition for the WT strain, grown for 5 hr at 37°C in RPMI and used for nanoString expression analysis (S2 Table). Hierarchal clustering of gene expression data was performed from single isolates using MeV software. Fold change values were obtained by dividing normalized expression values for each mutant strain by the wild type strain (DAY286) for each of the probes. The color scale represents Log2 fold change compared to wild type. (Blue limit: 10-fold down; yellow limit: 10-fold up) See S2 Table for strains.
(PPTX)
NanoString measurements of DX allele expression are provided as normalized numbers following RNA extraction from cells grown for 4hr at 30°C in YPD or 5 hr at 37°C in RPMI.
(DOCX)
NanoString measurements of target gene expression are provided as normalized numbers following RNA extraction from cells grown for 4hr at 30°C in YPD. WT, in addition, was also analyzed following growth for 5 hr 37°C in RPMI.
(XLSX)
NanoString measurements of target gene expression are provided as normalized numbers following RNA extraction from cells grown for 4hr at 30°C in YPD.
(XLSX)
NanoString measurements of target gene expression are provided as normalized numbers following RNA extraction from cells grown for 4hr at 37°C in YPD.
(XLSX)
NanoString measurements of target gene expression are provided as normalized numbers following RNA extraction from cells grown for 4hr at 37°C in YPD.
(XLS)
NanoString measurements of target gene expression are provided as normalized numbers following RNA extraction from Candida albicans harvested from the listed growth conditions.
(XLSX)
(XLSX)
Data Availability Statement
All relevant data are within the paper and its Supporting Information files.