Abstract
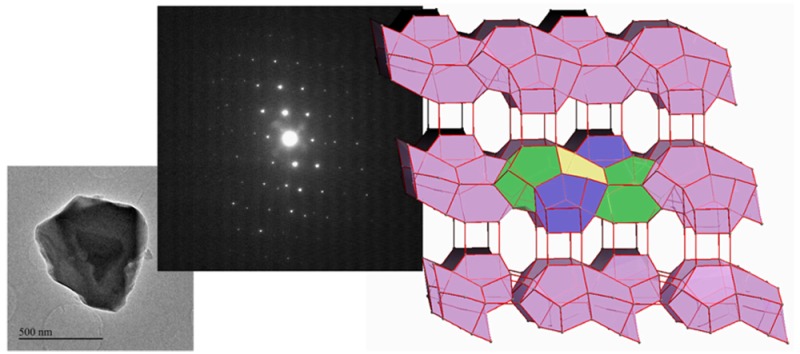
In this work a new ultrafast data collection strategy for electron diffraction tomography is presented that allows reducing data acquisition time by one order of magnitude. This methodology minimizes the radiation damage of beam-sensitive materials, such as microporous materials. This method, combined with the precession of the electron beam, provides high quality data enabling the determination of very complex structures. Most importantly, the implementation of this new electron diffraction methodology is easily affordable in any modern electron microscope. As a proof of concept, we have solved a new highly complex zeolitic structure named ITQ-58, with a very low symmetry (triclinic) and a large unit cell volume (1874.6 Å3), containing 16 silicon and 32 oxygen atoms in its asymmetric unit, which would be very difficult to solve with the state of the art techniques.
Electron diffraction tomography (EDT) techniques have recently experienced a renewed interest due to the possibility of expanding “single crystal” approach to materials that occur as very small crystallites or as mixtures of different phases. When comparing EDT with the widely employed single crystal X-ray diffraction (SCXRD) technique, the latest is the preferred technique for structural determination. Indeed, complete reflection data sets can be obtained with the latter in a few hours using “in-house” instruments. Moreover, easy available software packages can lead to the complete structure determination by employing a plethora of methods (such as direct methods, simulated annealing, or dual-space methods among others). However, it often occurs that important compounds cannot be synthesized with crystal sizes large enough for using SCXRD technique, or are obtained as complex mixtures of different phases and/or polymorphs. In those cases, structural elucidation of these new materials becomes very challenging.
High-resolution powder X-ray diffraction (HR-PXRD) techniques typically have been employed for solving the structure of powder crystalline materials. However, the severe reflection overlapping makes nearly impossible to achieve a final solution for materials having low symmetry and/or very large unit cell parameters. While better resolution can be achieved with the use of synchrotron radiation, sometimes those new data are not enough for eliminating the overlapping, and this technique is not always of easy and immediate access.
Zeolites are a paradigmatic family of this type of materials since they normally occur as fine nanopowders with large unit cell volumes and low symmetries, which result in highly complex structures that cannot be straightforwardly solved by HR-PXRD. However, the structural elucidation of zeolitic materials is not only a thought-provoking academic case but it also has relevant practical implications. Indeed, many of the most important applications of zeolites rely on their structure, the channel aperture, and dimensionality being key parameters that determine their industrial applications as molecular sieves and catalysts.
Therefore, it is not surprising that the most advanced EDT methods have been used for structural elucidation of zeolites in recent years. Comprehensive reviews on structural determination of porous solids using electron crystallography have been recently published, showing the impressive advances that have been made in the past decade.1−4
First, automated electron diffraction tomography (ADT) was proposed for collecting reliable data sets complete enough to determine the structure of micro- and nanocrystals.5,6 By combining ADT with precession electron diffraction (PED)7 dynamical effects were significantly reduced,8 providing nearly kinematical diffraction intensities that can be used as those obtained in a conventional SCXRD experiment.9
Soon afterward, the rotational electron diffraction (RED) was developed, improving the sampling of the collected data through the combination of the crystal tilt angle with the electron beam tilt angle.10,11
Both methods have permitted the determination of very complex zeolite structures in the form of nanopowder samples.12−16 However, one of the main drawbacks for applying EDT techniques to zeolitic materials is the very high radiation damage they suffer under the electron beam. Typically, a complete EDT data set requires 30–60 min for a complete data acquisition, and, most of the time, the zeolite crystals suffer a severe amorphization. A proposed option to reduce the dosing on the sample consists in combining scanning transmission electron microscopy (STEM) imaging and nanobeam electron diffraction (NED).17 Moreover, the stability of the sample under the electron beam can be further increased by cooling the sample with liquid N2 using a cryo-holder.18 Another option to minimize the radiation damage is the use of highly sensitive direct electron detection cameras that allow reducing the electron dose on the sample.19 Very recently, a novel fast data collection methodology has been proposed in which the crystal is continuously rotated during sequential pattern acquisition avoiding intermediate stops for relocation of the crystal.20 By applying this method, the total collection time is considerably reduced from 30–60 min down to 3–6 min for a data set that makes it possible to determine the structure of the sample under study.
Here, we present a new method for ultrafast EDT experiments in order to minimize the radiation damage on the studied sample by reducing the time required for the data collection. It is based on the careful alignment of the goniometer for achieving an extreme stability of the sample position over a tilting angle of 50°. Following our data acquisition routine, ultrafast EDT experiments are carried out in time ranges as short as 30 s (see Supporting Video S1). Integrated with PED technique, the proposed experimental configuration has been proved to be a reliable strategy for obtaining good quality data, allowing the structural determination through standard SCXRD methods. We have applied this improved EDT method to solve the complex structure of a new zeolite, named ITQ-58.
The zeolite ITQ-58 was first detected as an impurity during the synthesis of the zeolite ITQ-52 (IFW) using the butane-1,4-diylbis[tris(dimethylamino)phosphonium] cation as organic structure directing agent (OSDA).21 Attempts to obtain zeolite ITQ-58 were successful using the former OSDA, but also in the presence of a series of closely related dicationic organic moieties as shown in Supporting Information. The use of different OSDAs provides zeolites ITQ-58 with different chemical compositions and crystal sizes, although the largest crystals do not grow as a single phase, being always accompanied by impurities of STF (Supporting Tables S1–S3). Due to the severe peak overlapping, attempts to solve or even index the structure using PXRD data were not successful, even using HR-PXRD synchrotron data collected at the ALBA Light Source.
At that point, we investigated the structure of the zeolite ITQ-58 through EDT in a JEOL 2100F microscope operating at 200 kV, in parallel microdiffraction mode, and equipped with a NanoMEGAS-Digistar P1000 for beam precession and a GATAN Orius SC600A CCD camera. We selected the sample with the largest crystals (Supporting Figure S7) since it seems to be the less sensitive to beam damage under the electron beam. However, this sample was still very sensitive to radiation damage, and therefore, we paid very special attention to reduce the time for data collection. With this purpose, the experimental setup was optimized by adjusting carefully the crystal position to ensure that it stayed at the diffracting area throughout the whole rotation of the goniometer. Also, different combinations of the goniometer angular speed and the CCD configuration were explored. After achieving the most convenient arrangement (the complete description is included as Supporting Information), we were able to collect a data set covering an angular range of 50° in just 30 s, implying a data collection speed more than 4 times faster than the fastest one reported up to now in the open literature.19,20 Following this approach, five different data sets of 50° have been collected for five different crystals with a similar size of a few hundred nanometers each one (the raw measured data sets and one video reproducing an example of data acquisition in real time are available as Supporting Information). The collected data were processed, and the unit cell corresponding to each crystal was obtained using the program ADT3D.22 Projections of the reconstructed reciprocal space for one of the data sets are shown in Figure S9. One of the crystals corresponded to an impurity, the zeolite STF, which had been already detected from PXRD data during the synthesis process. The four remaining data sets could be indexed with the same triclinic unit cell, with lattice parameters a = 11.2 Å, b = 12.9 Å, c = 13.7 Å, α = 77.0°, β = 76.0°, and γ = 74.4°. (Detailed information on each data set is given in Table S8 of the Supporting Information).
Structure solution was performed using direct methods as implemented in the program Sir2014.23 First, the structure solution was attempted without success using each one of the obtained data sets, probably because of the low coverage exhibited by each data set (Table S8). To overcome this difficulty, the four collected data sets were transformed to a common scale and concatenated to obtain a global data set with a higher coverage (Table S8). This new data set led to a suitable solution with the space group P1̅ (No. 2). All of the 16 Si atoms of the structure were directly located together with 18 O atoms by employing SIR2014. This partial solution was easily completed with the remaining 14 O atoms from successive difference Fourier maps obtained from the EDT data using the programs SHELX24 and OLEX2.25
To validate the model achieved through the EDT analysis, the structure of the zeolite ITQ-58 was refined by the Rietveld method with the program FullProf26 using the XRPD pattern of the calcined sample of pure ITQ-58 with medium crystal size (0.3 × 0.5 × 0.5 μm3) (Figure S7). The refined XRPD patterns are shown in Figure 1, and the projections along the main crystallographic axes are shown in Figure 2. After the refinement, the residual values were Rwp = 0.086, Rexp = 0.027, RB = 0.037, and RF = 0.030. The refined structures from EDT and XRPD data are in good agreement as shown in Supporting Information.
Figure 1.
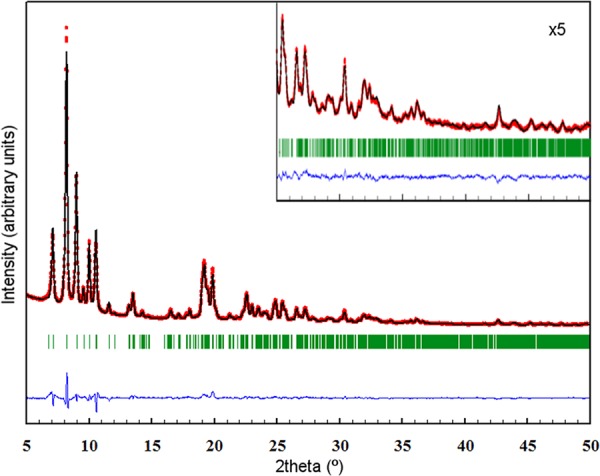
Rietveld refinement of the X-ray diffraction pattern of calcined ITQ-58. Red data points show the observed XRPD pattern; the black line along these points is the calculated XRPD pattern, with the difference profile at the bottom in blue. The green vertical tick marks below the pattern give the positions of the Bragg reflections. The inset shows the detail corresponding to the 2θ range from 25° to 50°, with the scale of intensities multiplied by 5. Residual values: Rwp = 0.086, Rexp = 0.027, RB = 0.037, and RF = 0.030. Wavelength corresponding to Cu Kα1,2.
Figure 2.
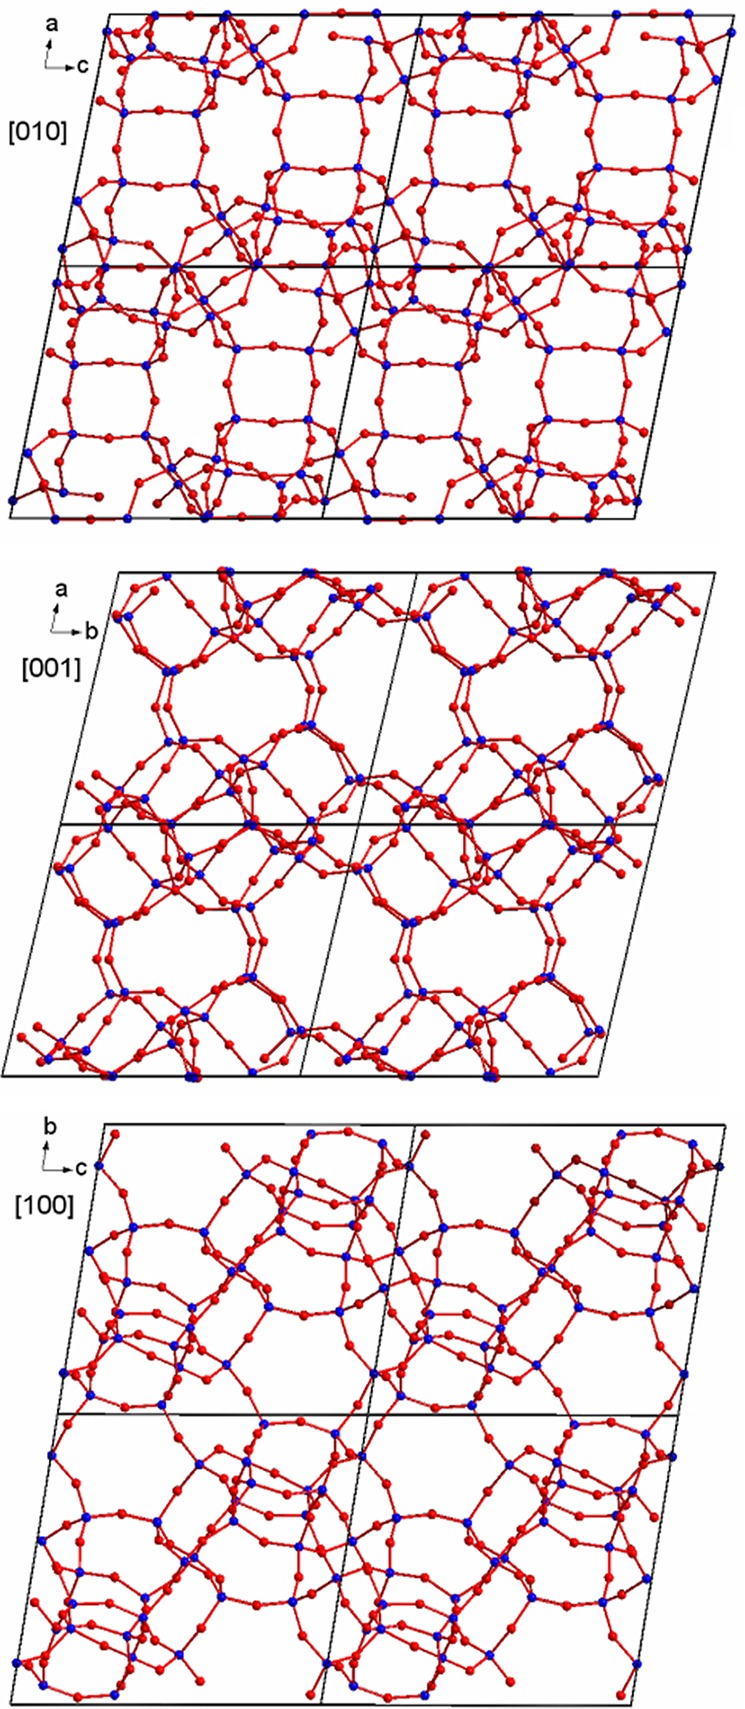
Projection of the structure of ITQ-58 along the main crystallographic axes (blue, Si; red, O).
Then, the structure of ITQ-58 can be described using four basic cages: [4354], [435461], [5462] ,and the large [41251261284] cavity, formed by two [46566682101] cages connected through the 10R (Figure 3).
Figure 3.
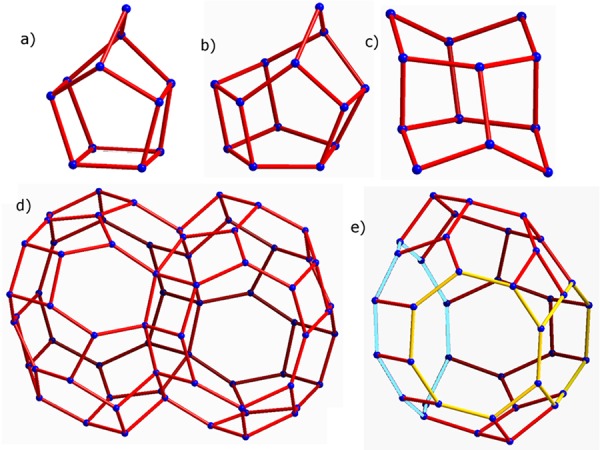
Basic cages of ITQ-58. (a) [4354], (b) [435461], (c) [5462], and (d) [41251261284]. The openings of the half cavity [46566682101] are highlighted (e) (the large inner 10R in light blue and the two 8R opening windows in yellow). O atoms have been removed for clarity.
Two [4354], two [435461], and one [5462] cages connect conforming a basic block (Figure 4a). These blocks are connected to their neighbors by sharing 4R rings faces, forming chains along the c direction (Figure 4b). Then, the different chains are connected to their neighbors forming layers in the bc plane, with formation of series of three 6R and one 4R (Figure 4c). Finally, the layers are interconnected forming 4R, giving rise to the formation of the tridimensional structure with large cavities (Figure 4d).
Figure 4.
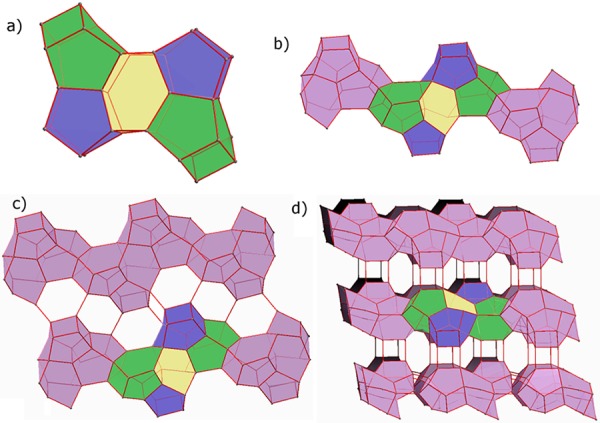
Construction of the structure of ITQ-58. (a) Two [4354] (blue), two [435461] (green), and one [5462] (yellow) cages connect forming a basic block. (b) The previous blocks connect to each other sharing a 4R forming chains along c. (c) Each chain connects to the adjacent ones in the bc plane forming layers. 4R and 6R are formed in the process. (d) Layers stack along the a direction forming the complete 3D structure.
The access to the large cavities passes through 8R apertures. Each cavity is accessible through two 8R with a pore aperture of 4.0 × 3.3 Å and two distorted 8R with a pore aperture of 5.9 × 2.5 Å.
The crystallographic pore apertures and cavity volume are in good agreement with those estimated from the N2 and Ar adsorption isotherms (see Figure S6 and subsequent discussion in Supporting Information).
Also, in order to determine the distribution of B in the different sites, the T-sites were refined as mixed Si/B positions. The refinement shows a preferential occupation of B in certain T sites. T1, T2, T3, T4, T6, T7, T8, T11, T13, and T14 are purely siliceous, while B can be found in T5 (0.97 Si, 0.03 B), T9 (0.92 Si, 0.08 B), T12 (0.90 Si, 0.10 B), T16 (0.87 Si, 0.13 B), T15 (0.70 Si, 0.30 B), and especially in T10 (0.60 Si, 0.40 B).
Finally, it is worth mentioning that it was also possible to determine the framework structure of the zeolite STF by applying the previously described analysis to the EDT data set corresponding to the impurity. A partial model with all the five independent Si atoms and seven O atoms was initially obtained, and it could be completed localizing the three missing O atoms through the corresponding difference Fourier map. This indicates that the data collection strategy proposed in this work is not restricted to a single example, but it could be of general application, and that the data obtained following this approach are accurate enough to solve unknown structures employing currently well-established methods and using easy accessible laboratory instruments.
As summary, in this work we have demonstrated that a modification of precession-assisted electron diffraction tomography data collection allows acquiring ED data in an extremely fast mode to minimize the radiation damage of the sample. The quality of these ED data is good enough for solving very complex and unknown structures using well-established methods. The implementation of this new ultrafast data collection approach is affordable in any electron microscope, and it could pave the way for solving structures beyond inorganic solids. In combination with ultrahigh sensitive direct electron detection cameras that allow low electron dosing and cryogenic temperatures for further stabilization of the sample, this ultrafast electron diffraction tomography could facilitate the structural determination of pharmaceutical compounds or even proteins.
Acknowledgments
The authors gratefully acknowledge financial support of European Research Council (ERC-2014-AdG ref 671093 “MATching zeolite SYNthesis with CATalytic activity”), Spanish Government (MAT2015-71842-P (MINECO/FEDER), MAT2012-38567-C02-01 and Severo Ochoa SEV-2012-0267), and Generalitat Valenciana (Project Prometeo). E.M. was also supported by the Italian project FIR2013 Exploring the Nanoworld. Authors thank beamline MSPD at Spanish Synchrotron ALBA for beam time allocation. We acknowledge JEOL Japan, JEOL Europe, and specially Junichi Morimoto from JEOL Europe for the assistance during the specific alignments of the microscope. Finally, authors specially thank the Electron Microscopy Service of the Universitat Politècnica de València and, in particular, Manuel J. Planes and Jose L. Moya for their invaluable support for setting up the EDT data acquisition. Original data (collected EDT frames and integrated intensities) can be requested directly from corresponding authors.
Supporting Information Available
The Supporting Information is available free of charge on the ACS Publications website at DOI: 10.1021/jacs.6b06394.
Author Contributions
All authors contributed equally to this work.
The authors declare no competing financial interest.
Supplementary Material
References
- Willhammar T.; Yun Y.; Zou X. Adv. Funct. Mater. 2014, 24, 182. 10.1002/adfm.201301949. [DOI] [Google Scholar]
- Mugnaioli E.; Kolb U. Z. Kristallogr. - Cryst. Mater. 2015, 230, 271. 10.1515/zkri-2014-1805. [DOI] [Google Scholar]
- Li Y.; Yu J. Chem. Rev. 2014, 114, 7268. 10.1021/cr500010r. [DOI] [PubMed] [Google Scholar]
- Yun Y.; Zou X.; Hovmöller S.; Wan W. IUCrJ 2015, 2, 267. 10.1107/S2052252514028188. [DOI] [PMC free article] [PubMed] [Google Scholar]
- Kolb U.; Gorelik T.; Kübel C.; Otten M. T.; Hubert D. Ultramicroscopy 2007, 107, 507. 10.1016/j.ultramic.2006.10.007. [DOI] [PubMed] [Google Scholar]
- Kolb U.; Gorelik T.; Otten M. T. Ultramicroscopy 2008, 108, 763. 10.1016/j.ultramic.2007.12.002. [DOI] [PubMed] [Google Scholar]
- Dorset D. L.; Gilmore Ch. J.; Jorda J. L.; Nicolopoulos S. Ultramicroscopy 2007, 107, 462. 10.1016/j.ultramic.2006.05.013. [DOI] [PubMed] [Google Scholar]
- Vincent R.; Midgley P. A. Ultramicroscopy 1994, 53, 271. 10.1016/0304-3991(94)90039-6. [DOI] [Google Scholar]
- Mugnaioli E.; Gorelik T.; Kolb U. Ultramicroscopy 2009, 109, 758. 10.1016/j.ultramic.2009.01.011. [DOI] [PubMed] [Google Scholar]
- Zhang D.; Oleynikov P.; Hovmöller S.; Zou X. Z. Kristallogr. 2010, 225, 94. 10.1524/zkri.2010.1202. [DOI] [Google Scholar]
- Wan W.; Sun J.; Su J.; Hovmöller S.; Zou X. J. Appl. Crystallogr. 2013, 46, 1863. 10.1107/S0021889813027714. [DOI] [PMC free article] [PubMed] [Google Scholar]
- Mugnaioli E.; Kolb U. Microporous Mesoporous Mater. 2013, 166, 93. 10.1016/j.micromeso.2012.02.024. [DOI] [Google Scholar]
- Hua W.; Chen H.; Yu Z.-B.; Zou X.; Lin J.; Sun J. Angew. Chem., Int. Ed. 2014, 53, 5868. 10.1002/anie.201309766. [DOI] [PubMed] [Google Scholar]
- Guo P.; Shin J.; Greenaway A. G.; Min J. G.; Su J.; Choi H. J.; Liu L.; Cox P. A.; Hong S. B.; Wright P. A.; Zou X. Nature 2015, 524, 74. 10.1038/nature14575. [DOI] [PubMed] [Google Scholar]
- Martínez-Franco R.; Moliner M.; Yun Y.; Sun J.; Wan W.; Zou X.; Corma A. Proc. Natl. Acad. Sci. U. S. A. 2013, 110, 3749. 10.1073/pnas.1220733110. [DOI] [PMC free article] [PubMed] [Google Scholar]
- Smeets S.; McCusker L. B.; Baerlocher Ch.; Mugnaioli E.; Kolb U. J. Appl. Crystallogr. 2013, 46, 1017. 10.1107/S0021889813014817. [DOI] [Google Scholar]
- Kolb U.; Gorelik T. E.; Mugnaioli E.; Stewart A. Polym. Rev. 2010, 50, 385. 10.1080/15583724.2010.494238. [DOI] [Google Scholar]
- Jiang J.; Jorda J. L.; Yu J.; Baumes L. A.; Mugnaioli E.; Diaz-Cabanas M. J.; Kolb U.; Corma A. Science 2011, 333, 1131. 10.1126/science.1208652. [DOI] [PubMed] [Google Scholar]
- van Genderen E.; Clabbers M. T. B.; Das P. P.; Stewart A.; Nederlof I.; Barentsen K. C.; Portillo Q.; Pannu N. S.; Nicolopoulus S.; Gruene T.; Abrahams J. P. Acta Crystallogr., Sect. A: Found. Adv. 2016, 72, 236. 10.1107/S2053273315022500. [DOI] [PMC free article] [PubMed] [Google Scholar]
- Gemmi M.; La Placa M. G. I.; Galanis A. S.; Rauch E. F.; Nicolopoulos S. J. Appl. Crystallogr. 2015, 48, 718. 10.1107/S1600576715004604. [DOI] [Google Scholar]
- Simancas R.; Jordá J. L.; Rey F.; Corma A.; Cantín A.; Peral I.; Popescu C. J. Am. Chem. Soc. 2014, 136, 3342. 10.1021/ja411915c. [DOI] [PubMed] [Google Scholar]
- Kolb U.; Mugnaioli E.; Gorelik T. E. Cryst. Res. Technol. 2011, 46, 542. 10.1002/crat.201100036. [DOI] [Google Scholar]
- Burla M. C.; Caliandro R.; Carrozzini B.; Cascarano G. L.; Cuocci C.; Giacovazzo C.; Mallamo M.; Mazzone A.; Polidori G. J. Appl. Crystallogr. 2015, 48, 306. 10.1107/S1600576715001132. [DOI] [Google Scholar]
- Sheldrick G. M. Acta Crystallogr., Sect. A: Found. Crystallogr. 2008, 64, 112. 10.1107/S0108767307043930. [DOI] [PubMed] [Google Scholar]
- Dolomanov O. V.; Bourhis L. J.; Gildea R. J.; Howard J. A. K.; Puschmann H. J. Appl. Crystallogr. 2009, 42, 339. 10.1107/S0021889808042726. [DOI] [PMC free article] [PubMed] [Google Scholar]
- Rodríguez-Carvajal J. Commission on Powder Diffraction (IUCr) Newsletter 2001, 26, 12. [Google Scholar]
Associated Data
This section collects any data citations, data availability statements, or supplementary materials included in this article.


