

Abstract
In bacteria, chromosome dynamics and gene expression are modulated by nucleoid‐associated proteins (NAPs), but little is known about how NAP activity is coupled to cell cycle progression. Using genomic techniques, quantitative cell imaging, and mathematical modeling, our study in Caulobacter crescentus identifies a novel NAP (GapR) whose activity over the cell cycle is shaped by DNA replication. GapR activity is critical for cellular function, as loss of GapR causes severe, pleiotropic defects in growth, cell division, DNA replication, and chromosome segregation. GapR also affects global gene expression with a chromosomal bias from origin to terminus, which is associated with a similar general bias in GapR binding activity along the chromosome. Strikingly, this asymmetric localization cannot be explained by the distribution of GapR binding sites on the chromosome. Instead, we present a mechanistic model in which the spatiotemporal dynamics of GapR are primarily driven by the progression of the replication forks. This model represents a simple mechanism of cell cycle regulation, in which DNA‐binding activity is intimately linked to the action of DNA replication.
Keywords: Caulobacter, cell cycle, chromosome organization, DNA replication, nucleoid‐associated protein
Subject Categories: Chromatin, Epigenetics, Genomics & Functional Genomics; DNA Replication, Repair & Recombination; Microbiology, Virology & Host Pathogen Interaction
Introduction
All cells must control chromosome dynamics and coordinate DNA processes to achieve robust cellular replication. In bacteria, which lack histones, DNA‐binding proteins known as nucleoid‐associated proteins (NAPs) play important roles in chromosome organization, DNA segregation, and gene expression at a global scale (Browning et al, 2010; Dorman, 2014). There is a variety of NAPs, and their cellular abundance can vary with the growth phase of the culture (Ali Azam et al, 1999). They tend to have a promiscuous DNA‐binding activity, which results in broad association with the chromosome (nucleoid).
In eukaryotic cells, histone activity is highly cell cycle‐regulated, including during the process of DNA replication when fork progression disrupts histone arrangement (Groth et al, 2007). NAP activity is also suspected to be cell cycle‐regulated in bacteria (Browning et al, 2010), but how is usually not clear. Perhaps the best known examples of coupling between NAP activity and the cell cycle come from SeqA and the condensin protein Smc (MukB in Escherichia coli). For example, in Bacillus subtilis, Smc is recruited close to the origin of replication from which it is thought to help “zip up” the chromosomal arms following DNA replication (Sullivan et al, 2009; Su'etsugu & Errington, 2011; Marbouty et al, 2015; Wang et al, 2015). SeqA, a protein that controls the initiation of DNA replication in enteric bacteria (Lu et al, 1994; Waldminghaus & Skarstad, 2009), binds behind the moving replication machinery by preferentially recognizing hemimethylated GATC sites that are transiently formed following replication (Sanchez‐Romero et al, 2010; Waldminghaus et al, 2012; Helgesen et al, 2015). However, unlike other NAPs, Smc has an ATPase activity and a specialized DNA clamping function. SeqA is also unusual in having a well‐defined DNA‐binding sequence that is modulated by DNA methylation. Since these proteins differ substantially in their mechanisms of action from most NAPs, there are likely to be other mechanisms that couple NAP activity to chromosome dynamics and cell cycle progression.
We sought to examine this possibility in Caulobacter crescentus. In this bacterium, the cell cycle starts at the so‐called swarmer cell stage, which corresponds to G1 phase. At this stage, the single chromosome is oriented along the cell length such that the origin of replication (ori) is located near the “old” cell pole and the terminus (ter) is near the “new” pole (Jensen & Shapiro, 1999a; Viollier et al, 2004). During the swarmer‐to‐stalked cell transition (entry of S phase), DNA replication is initiated at ori following the assembly of the replication machinery (replisome). One ori remains at the old pole while the other segregates to the new pole (Jensen & Shapiro, 1999a). DNA replication is accompanied by the migration of the replisomes toward midcell (Jensen et al, 2001). Chromosome segregation occurs concomitantly, with the ter region moving from the new pole toward the middle of the cell (Jensen & Shapiro, 1999a). When replication completes at ter near midcell, the replisomes disassemble until a new round of replication initiates at the next division cycle. How NAPs fit into this sequence of events is not well understood (Hong & McAdams, 2011; Schwartz & Shapiro, 2011; Le et al, 2013).
The fitness cost associated with deletion of NAP‐encoding genes can vary between bacteria. For example, in Escherichia coli, loss of HU through double deletion of its subunit genes results in severe defects in cell growth, cell division, and chromosome segregation (Huisman et al, 1989). In Bacillus subtilis, deletion of smc is conditional, resulting in cell death under fast‐growth conditions due to defects in chromosome partitioning and organization (Britton et al, 1998; Moriya et al, 1998). In contrast, the corresponding Δhup1Δhup2 and Δsmc mutations in C. crescentus display little to no apparent defect in cell growth, cell size distribution, fitness, or global chromosome organization (Christen et al, 2011; Le et al, 2013; Appendix Fig S1A–C). In fact, none of the other known (IHF) or putative (Lrp) NAPs in C. crescentus appear critical for cellular growth or general fitness, at least under standard laboratory conditions (Siam et al, 2003; Christen et al, 2011). While redundancy among known NAPs may contribute to the lack of dramatic phenotypes associated with the loss of individual proteins, we initiated a study with the premise that C. crescentus might have another NAP that plays a crucial role in the cell. Here, we describe the identification and characterization of a NAP whose activity is critical for faithful cellular replication and whose asymmetric dynamics during the cell cycle is shaped by the passage of the replication fork.
Results
Identification of a NAP critical for cell function
We initiated our search for a new NAP by screening C. crescentus protein sequences for features characteristic of NAPs, including high protein abundance, small protein size, and the presence of a putative DNA‐binding domain. We focused our attention on proteins that are associated with a severe fitness cost when their gene is inactivated based on a genome‐wide Tn‐seq study (Christen et al, 2011). This bioinformatics search led to CCNA_03428, an 89‐amino acid protein that largely consists of a conserved domain of unknown function (DUF2312) carrying a putative DNA‐binding domain and a predicted coiled‐coil domain (Rigden, 2011; Fig 1A). The Tn‐seq study identified this gene as essential for viability in PYE medium (Christen et al, 2011). Based on the genome sequences available in 2015, we found that the DUF2312 domain is not only highly conserved in α‐proteobacteria, as reported before (Kainth & Gupta, 2005; Gupta & Mok, 2007), but also has representatives in cyanobacteria, firmicutes, planctomycetes, actinobacteria, and even archaea and eukaryotes (Fig EV1A), possibly through horizontal gene transfer. Interestingly, CCNA_03428 homologs are also found in phages. In these cases, the DUF2312‐containing genes are generally located within the phage genomic regions allocated to genes involved in DNA‐related processes (Ely et al, 2015; Fig EV1B), further hinting at the possibility that CCNA_03428 may have a nucleoid‐associated function. This protein was recently named GapR (Ricci et al, 2016).
Figure 1. GapR binds to DNA in vivo and in vitro .
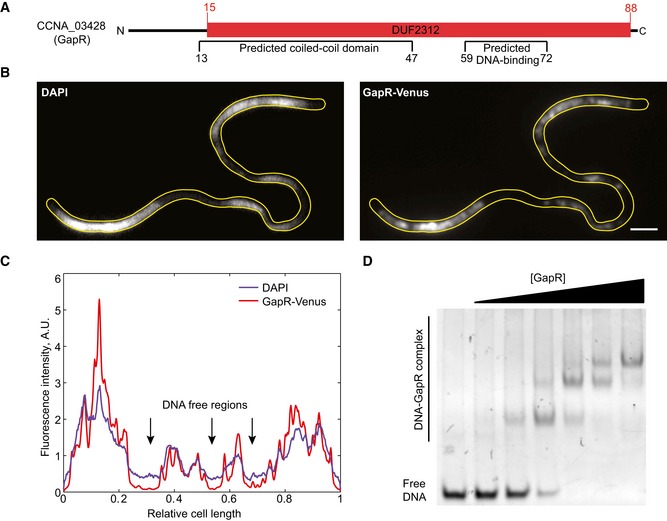
- Fluorescence images showing GapR‐Venus colocalizing with DAPI‐stained DNA in a Caulobacter crescentus temperature‐sensitive parE and ftsA mutant (CJW5795) that produces DNA‐free regions. Cells were cultured at the restrictive temperature (37°C) for 6 h in M2G medium prior to DAPI staining and imaging. Scale bar = 2 μm.
- Fluorescence intensity profiles of GapR‐Venus and DAPI signals along the long axis of the cell shown in panel (B).
- EMSA showing recombinant GapR purified from Escherichia coli binding to a 50‐bp DNA sequence. See Appendix Supplementary Methods for experimental details.
Figure EV1. GapR homologs.
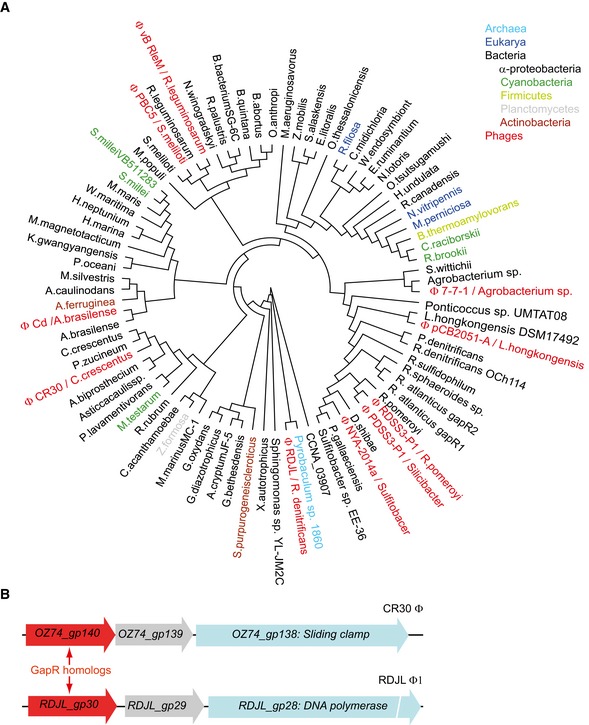
- Shown is a protein phylogenetic tree composed of representative members of DUF2312 (pfam10073) found in archaea, eukarya, bacteria, and phages. See Appendix Supplementary Methods for tree construction.
- Examples of gapR homologs in the genome of phages CR30ϕ and RDJLϕ1 in which gapR homologs are located close to genes encoding the sliding clamp and the DNA polymerase, respectively.
GapR binds to DNA
In C. crescentus, unlike in E. coli, DNA fluorophores that label the nucleoid light up the entire cytoplasm when imaged by epifluorescence microscopy because the chromosome spreads from pole to pole in this bacterium. As a result, cytoplasmic and nucleoid‐associated proteins cannot be easily distinguished in colocalization experiments with DNA signal. Therefore, to test experimentally whether GapR associates with the nucleoid, we examined the localization of a GapR‐Venus fusion (expressed from the gapR promoter from an ectopic chromosomal locus) in a temperature‐sensitive ftsA parE C. crescentus mutant, which at the restrictive temperature forms long, filamentous cells with large DNA‐free regions (Ward & Newton, 1997). In this mutant, GapR‐Venus (which is a functional fusion; see Appendix Fig S1C and D) colocalized with the DAPI DNA signal and was absent in DNA‐free regions (Fig 1B and C), consistent with GapR's predicted DNA‐binding property. Furthermore, expression of C. crescentus GapR‐Venus in E. coli, which lacks a GapR homolog, also resulted in colocalization with the nucleoid (Appendix Fig S2A and B).
Since the E. coli experiments did not exclude the unlikely possibility of an E. coli factor mediating the interaction between GapR and the DNA, we purified recombinant GapR from E. coli for in vitro DNA‐binding studies (Appendix Fig S2C). During purification, we observed large amounts of DNA that co‐eluted with GapR (see Appendix Supplementary Methods). Unfortunately, GapR tended to precipitate when the DNA was removed, even in the presence of high concentrations of stabilizing salts and glycerol, indicating that the protein concentration in our purified preparations does not reflect the concentration of active protein. Regardless, an electrophoretic mobility shift assay (EMSA) showed, at least qualitatively, that incubation of GapR with a 50‐bp DNA fragment results in the formation of shifted DNA–GapR complexes (Fig 1D). Altogether, these data demonstrate a physical interaction between GapR and DNA.
Loss of GapR causes severe pleiotropic defects in growth, cell division, DNA replication, chromosome segregation, and gene expression
GapR binds DNA, but does it affect DNA processes important for cellular replication? We expected that we would not be able to create a gapR deletion mutant under standard laboratory growth conditions (30°C, PYE medium) given gapR's essential‐gene annotation in the Tn‐seq study (Christen et al, 2011). Indeed, we were unable to obtain ΔgapR colonies at 30°C on PYE plates using the traditional two‐step knockout approach, unless a copy of a functional gapR‐venus fusion driven by the gapR promoter was integrated at an ectopic chromosomal locus (strain CJW5777; Appendix Fig S1C and D). However, an in‐frame deletion of gapR (linked to oxytetracycline resistance) could be transduced into wild‐type cells if the plates were incubated at low temperatures (22–25°C). Genome sequencing confirmed the presence of the ΔgapR deletion and the absence of suppressive mutations. While the ΔgapR mutant could replicate under slow‐growth conditions, it was severely incapacitated. It took about twice as long for ΔgapR mutants to form colonies compared to ΔgapR mutants expressing a copy of gapR from a plasmid (Fig 2A). Furthermore, even under the slowest growth conditions tested (minimal medium M2G, 22–25°C), ΔgapR cells displayed an aberrant size distribution (Fig 2B and C), indicative of a cell division defect. When we inoculated ΔgapR cells in liquid PYE medium at 30°C, we were able to obtain some weak growth, but it was accompanied by a high frequency of cell filamentation and cell lysis (Fig 2B and C). None of these phenotypes were due to a polar effect on the downstream gene (Appendix Fig S3).
Figure 2. Loss of GapR function leads to severe pleiotropic defects.
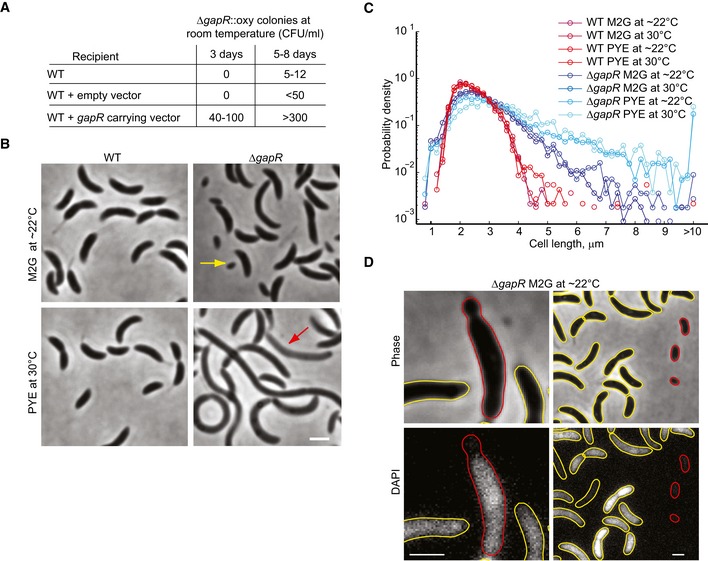
- Colony count of oxytetracycline‐resistant (oxy) ΔgapR mutants generated by phage transduction of the ΔgapR::oxy mutation into the Caulobacter crescentus wild‐type strain (WT), a strain harboring an empty vector (CJW5789), or a strain harboring a vector carrying gapR (CJW5791). CFU = colony‐forming units.
- Phase‐contrast images of WT and ΔgapR (CJW5747) strains grown at room temperature in M2G or at 30°C in PYE. Yellow and red arrows indicate a minicell and cell lysis, respectively. Scale bar = 2 μm.
- Cell‐length distributions of exponentially growing populations of the ΔgapR (CJW5747) and WT strains in the indicated medium and temperature (n > 1,300 cells for each condition).
- Representative images of minicells (right panels) and minicell formation (left panels) in the ΔgapR mutant. The red outlines identify the minicells or the minicelling process from the yellow outlines. DNA was visualized by DAPI staining. Scale bars = 1 μm.
We reasoned that if GapR affects chromosome organization or the local structure of the DNA through its DNA‐binding activity, we may expect that its absence impacts various DNA‐related processes, even under our best growth conditions tested (minimal medium M2G, 22–25°C). This was confirmed in a series of experiments.
First, DNA staining and microscopy revealed that the ΔgapR mutation affects chromosome dynamics (Fig 2D). As mentioned above, the DNA spreads throughout most of the cytoplasm in wild‐type C. crescentus cells such that DAPI staining is fairly uniform (Jensen & Shapiro, 1999a). In contrast, some ΔgapR cells lacked DAPI signal at a polar region, leading to the formation of DNA‐free minicells (Fig 2D). These phenotypes are consistent with a broad defect in chromosome segregation or compaction (Huisman et al, 1989; Hiraga et al, 1991; Kaidow et al, 1995; Yamanaka et al, 1996).
Second, high coverage genome sequencing on ΔgapR and wild‐type cells cultured in M2G at 25°C showed an increase in DNA coverage around the origin of replication in the ΔgapR mutant (n = 3) relative to wild type (n = 3; Fig 3A), indicating over‐initiation and/or considerable lengthening of the S phase relative to the cell cycle (slowdown of DNA replication; Bremer & Churchward, 1977). Thus, the ΔgapR mutant also displays a DNA replication defect.
Figure 3. Deletion of gapR affects chromosome replication and global gene expression.
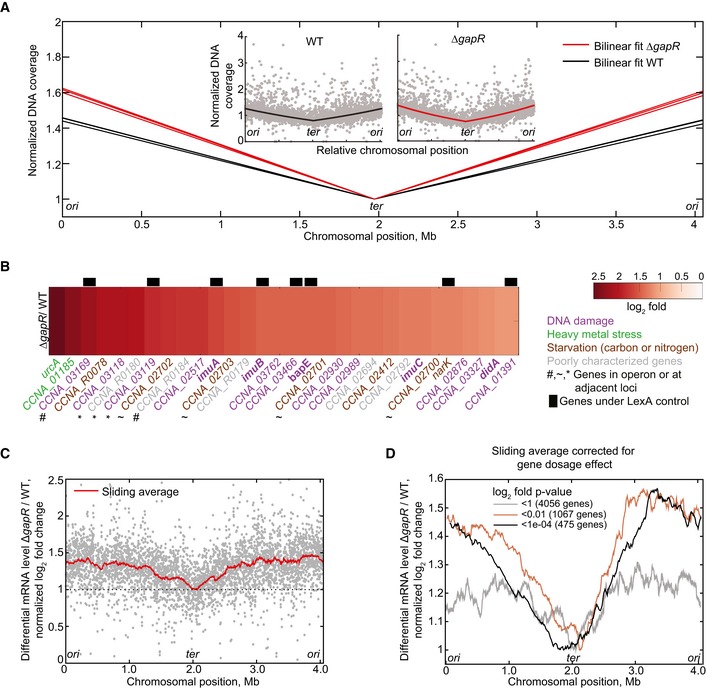
- Bilinear fit of normalized coverage for three independent genome‐wide DNA sequencing experiments of exponentially growing cells of the wild‐type (black lines) and ΔgapR (CJW5747, red lines) strains. Inset: Individual normalized DNA coverage (gray dots) of a single experiment for wild‐type strain and ΔgapR, showing coverage in read count per nucleotide for each gene.
- Differential transcription log2 ratio for the 30 most upregulated genes in the ΔgapR strain relative to the WT strain. Gene function is represented by the indicated color code. Genes known to be under the transcriptional control of LexA (da Rocha et al, 2008; Modell et al, 2014) are represented with black bars. Gene function is represented with the following color code: purple, DNA damage and repair (Galhardo et al, 2005; Modell et al, 2011, 2014; Bos et al, 2012); green, genes involved in the heavy metal stress response (Hu et al, 2005); brown, genes involved in carbon starvation‐stress response (McGrath et al, 2007; Britos et al, 2011; Le & Laub, 2016) or nitrogen limitation (England et al, 2010); gray, poorly characterized genes.
- Genome‐wide differential mRNA levels between ΔgapR and WT in log2 fold change for single genes (gray dots) and for a 200‐gene sliding window average (red line). The RNA‐seq profile was shifted to set the average log2 fold change of the terminus region at 1 to show the relative difference in differential gene expression between ori and ter regions.
- Gene‐dosage‐corrected differential mRNA levels between ΔgapR and WT in log2 fold change for a 200‐gene sliding window average considering genes with different P‐value thresholds. To correct for the gene dosage difference between ΔgapR and WT, we multiplied the transcript ratio of ΔgapR/WT by the gene‐copy‐number ratio WT/ΔgapR on a gene‐by‐gene basis (RNA‐seq and DNA‐seq were performed on the same samples). The values were then log2‐transformed and normalized as in (C).
Third, RNA‐seq revealed that even under slow‐growth conditions, the ΔgapR deletion is associated with a modest but widespread effect on gene expression (Dataset EV1). Among the top 30 most upregulated genes in the ΔgapR mutant relative to wild type, 25 of them were related to some form of stress (Fig 3B). Thus, when cells experience a loss of GapR, they transcriptionally behave as stressed cells even in the absence of external stress, which is consistent with a critical NAP function (Oberto et al, 2009; Mangan et al, 2011). Interestingly, 16 of the top 30 upregulated genes in the ΔgapR mutant were specifically related to a DNA damage stress response (Fig 3B). Eight of them were genes whose expression is under the control of LexA, the major SOS response regulator (da Rocha et al, 2008; Modell et al, 2014). These genes notably encode error prone DNA repair proteins ImuA, ImuB, and ImuC, the cell division inhibitor DidA, and the endonuclease BapE (Galhardo et al, 2005; Bos et al, 2012; Modell et al, 2014), which are all activated upon DNA damage by genotoxic agents (Galhardo et al, 2005; Modell et al, 2011, 2014). It is possible that activation of the DNA damage response in ΔgapR cells is linked to the DNA replication defect (Fig 3A), as an apparent slowdown in DNA replication can result from replication forks stalling, which often cause DNA lesions (Cox et al, 2000). The activation of DidA and BapE expression in ΔgapR cells may account for the cell filamentation and lysis phenotypes, respectively.
GapR affects global gene expression, with a chromosomal bias from ori to ter
In addition to a transcriptional stress response, loss of GapR function under slow‐growth conditions was associated with a modest, but interestingly biased, effect on global gene expression along the chromosome (Fig 3C). Genes located close to the origin displayed, on average, a higher relative level of differential gene expression than those at the terminus region (Fig 3C, red line). This could not be simply explained by the difference in gene dosage between wild‐type and ΔgapR cells (Fig 3A), because a chromosomal asymmetry in gene expression remained observable even after correcting for this gene dosage difference (Fig 3D). Moreover, the apparent bias in differential gene expression between ori and ter regions was not due to read counts in the data, because the trend was even more notable when we considered only the log2 fold change of genes that are significantly differentially expressed (P‐values < 0.01, n = 1,067 genes). For these genes, the (gene‐dosage‐corrected) log2 fold change of genes close to ori was about 50% higher than that of genes close to ter (Fig 3D). We concluded that GapR has a statistically significant global effect on gene expression, in a manner that depends on gene location along the chromosome.
GapR displays an asymmetric distribution along the chromosome, with preferential binding away from the terminus region
To examine whether the chromosomal asymmetry in differential gene expression is associated with a bias in GapR binding activity along the chromosome, we performed ChIP‐seq experiments on both asynchronous and swarmer (G1‐phase) cell populations using a natively expressed GapR‐Venus fusion (substituting the wild‐type copy at the gapR chromosomal locus). One of the largest ChIP peaks corresponded to a DNA region encompassing the gapR locus (Fig EV2A). Others matched with regions of highly expressed genes. We suspected that these very wide peaks might result from technical biases associated with the ChIP‐seq method. This suspicion was based on two reasons: First, highly expressed genes are known to be artificially enriched in ChIP‐seq experiments (Teytelman et al, 2013); second, ChIP‐seq experiments using a mock protein (Venus) pulled down some of the highly transcribed regions (Fig EV2B). In addition, the mock protein Venus showed a high apparent “binding” to the xylX locus from where it is expressed, even though this mock protein does not bind DNA. We assumed that the coupling between transcription and translation in bacteria increases the probability of artificial cross‐linking of Venus to the DNA region from which it is expressed simply due to proximity. The same method bias may explain the large apparent “binding” affinity of GapR to its chromosomal region.
Figure EV2. ChIP‐seq data analysis for GapR‐Venus and controls.
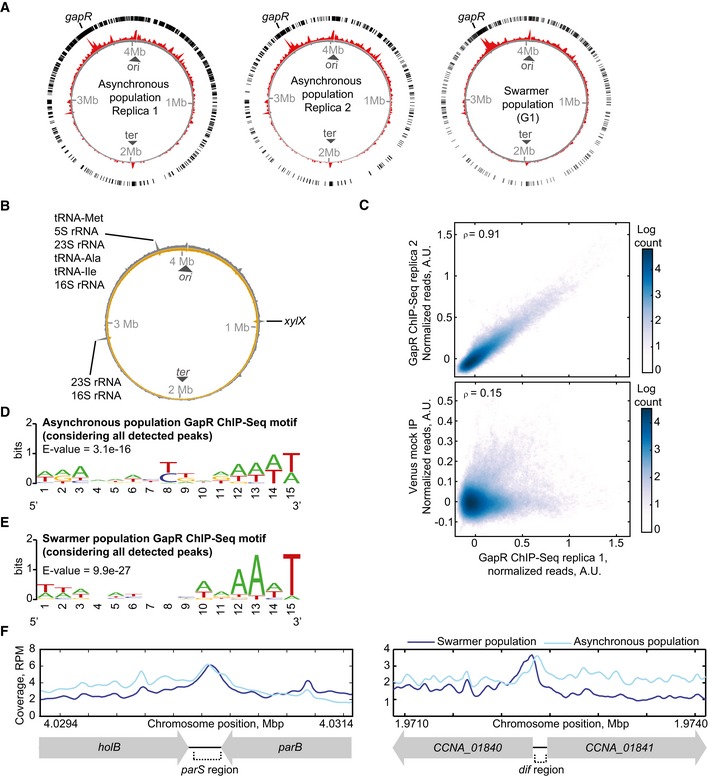
- Whole‐genome profile of GapR‐Venus normalized ChIP‐seq read counts for two replicates of asynchronous populations (left and middle panels) and for a swarmer population (right panel) of strain CJW5534. The circle with exterior black bars shows the distribution of ChIP‐seq peaks detected with MACS2 software. The inner red circle shows the normalized ChIP‐seq read counts. The gray inner circle shows the level of total DNA before immunoprecipitation by GapR‐Venus. The location of the gapR locus in the Caulobacter crescentus chromosome is indicated.
- Whole‐genome profile of normalized ChIP‐seq read counts for mock immunoprecipitation performed with the freely diffusing Venus protein expressed at the xylX locus (strain CJW5796). Exterior gray circle shows normalized ChIP‐seq read counts following immunoprecipitation with Venus. Light brown inner circle shows the level of total DNA before immunoprecipitation by Venus. The location of ribosome‐ and tRNA‐encoding loci and of the xylX locus is indicated.
- Pearson correlation at the single‐nucleotide level in normalized read counts between two independent replicates of the GapR‐Venus ChIP‐seq experiment and between GapR‐Venus ChIP‐seq and the mock immunoprecipitation with freely diffusing Venus.
- Best MEME consensus‐sequence motif for GapR binding using ChIP‐seq data from an asynchronous cell population. For this analysis, all peaks were considered, including peaks detected at ribosomal, tRNA, and gapR loci.
- Same as (D) but from a swarmer cell population.
- GapR‐Venus ChIP‐seq coverage at the parS and dif regions.
To avoid interference from these potential technical biases and an artificial increase in pairwise correlations, we excluded from subsequent analyses the wide peaks associated with the gapR region as well as those associated with highly transcribed regions found in both the GapR and mock ChIP‐seq experiments. The remaining peaks showed low enrichment fold values, which is common among NAPs (Prieto et al, 2012). The high reproducibility between independent biological replicates gave us high confidence in our results, as ~97% of chromosomal DNA detected in peaks from one GapR ChIP‐seq experiment were also present in peaks detected from a second replicate harvested on a different day (Fig EV2A). Furthermore, even when considering the normalized read coverage at the nucleotide level across the chromosome, the two biological GapR ChIP‐seq replicates were highly correlated (ρ = 0.91), in contrast to their low correlation (ρ = 0.15) with the mock ChIP‐seq experiment (Fig EV2C). Note that we obtained a similarly high (ρ = 0.93) correlation between experimental replicates if no peaks were excluded from the analysis.
When mapping the ChIP peaks on the chromosome, we found that, in asynchronous cell populations, the GapR fusion binds broadly along the chromosome, but with a lower preference near the ter region (Figs 4A and EV2A). This was also true in synchronized swarmer cells, which have a single, unreplicated chromosome (1N DNA content), indicating that the biased distribution was not due to gene dosage during DNA replication (Figs 4B and EV2A). We reasoned that if the binding preference of GapR away from the ter region is correct, it should also be observable by imaging the localization of GapR in swarmer cells since in these G1‐phase cells, the chromosome is linearly organized along the cell length, with ori at the old pole and ter at the new pole (Jensen & Shapiro, 1999a; Viollier et al, 2004). To test this prediction, we generated a strain (CJW5534) in which a gapR‐venus fusion replaces gapR at the native chromosomal locus. The resulting GapR‐Venus fusion was functional as the strain displayed no apparent morphological defects. We then compared the signal distribution of GapR‐Venus with that of the DNA (DAPI signal) across the length of synchronized swarmer cells (Fig 4C), using FtsZ‐CFP as a new‐pole marker to orient the cells (Thanbichler & Shapiro, 2006). The GapR‐Venus signal was found to decrease near the new pole relative to the DNA signal (Fig 4C), consistent with the ChIP results showing a lower binding activity at the ter region (Fig 4B).
Figure 4. GapR binding displays a bias against the terminus region of the chromosome.
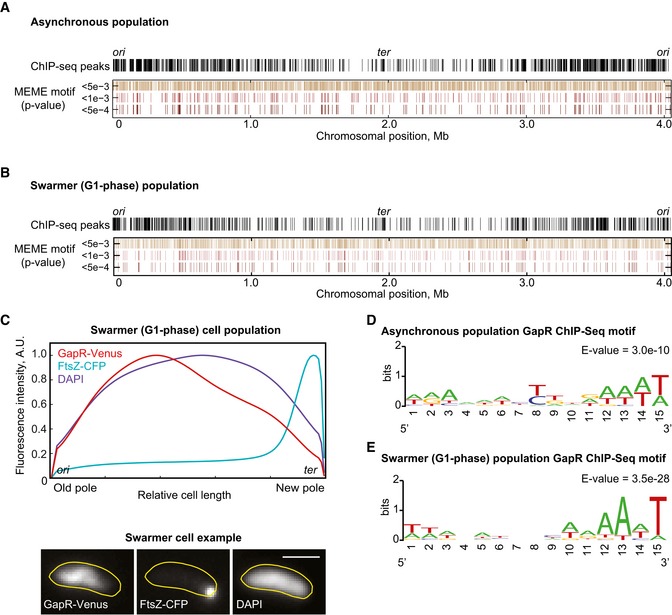
- Whole‐genome profile of GapR‐Venus ChIP‐seq peaks in an asynchronous population of strain CJW5534 and the genome distribution of hits for the MEME motif according to different P‐value thresholds.
- Same as in (A) but for a swarmer cell population.
- Average cellular fluorescent signal of DAPI, GapR‐Venus, and FtsZ‐CFP from 502 synchronized swarmer cells (CJW5535). An example of fluorescence images is shown below. Scale bar = 1 μm.
- Best MEME consensus‐sequence motif for an asynchronous cell population.
- Same as (D) but for a swarmer cell population.
Next, we sought to identify a DNA‐binding motif for GapR from the GapR ChIP‐seq data. We submitted 100‐nucleotide‐long sequences centered on the summit of identified peaks to the expectation maximization‐based algorithm MEME (Machanick & Bailey, 2011). After background correction to account for the C. crescentus genome composition, MEME returned an AT‐rich motif for the asynchronous and swarmer cell population (Fig 4D and E). Note that we obtained a similar MEME result if the peaks corresponding to the gapR locus and highly expressed regions were included in the analysis (Fig EV2D and E). A preference for AT‐rich sequences has been reported for E. coli NAPs HU and H‐NS (Lang et al, 2007; Prieto et al, 2012). Importantly, the distribution of GapR's binding motif was relatively uniform along the C. crescentus chromosome, regardless of the stringency threshold we applied to match the consensus to the chromosome for asynchronous or swarmer populations (Fig 4A and B). Thus, GapR displays an asymmetric binding along the chromosome, in a manner that cannot be explained by the uniform distribution of its binding motif.
GapR localization changes during the cell cycle
In search of clues to explain GapR's binding asymmetry, we turned to microscopy. In an asynchronous population, the subcellular localization of GapR‐Venus appeared heterogeneous (Fig 5A); however, demograph analysis—in which fluorescence profiles of individual cells in a population are sorted by cell length (Hocking et al, 2012)—revealed that the localization of GapR‐Venus is vastly different from that of a protein that uniformly binds to the whole nucleoid throughout the cell cycle, as illustrated with HU2‐mCherry (Fig 5A and B). Time‐lapse microscopy starting with synchronized swarmer cells revealed that the GapR‐Venus signal across the cell changes during the cell cycle, condensing toward midcell during cell cycle progression followed by a signal re‐distribution near the end of the cell cycle (Fig 5C). This is unlike HU2‐mCherry (Fig 5C) whose localization mirrors that of the DNA. The localization dynamics of GapR was independent of the Venus fusion, as we observed a similar localization profile with a GapR‐mCherry fusion expressed from the gapR promoter at an ectopic chromosomal locus (Fig EV3A). The temporal pattern of GapR reflected a re‐distribution of protein inside the cells during the cell cycle since the GapR level remains relatively constant throughout the cell cycle, as shown by quantitative fluorescence microscopy (Fig EV3B), Western blot (Fig EV3C), and ribosome profiling (Schrader et al, 2014).
Figure 5. GapR localization changes during the cell cycle.
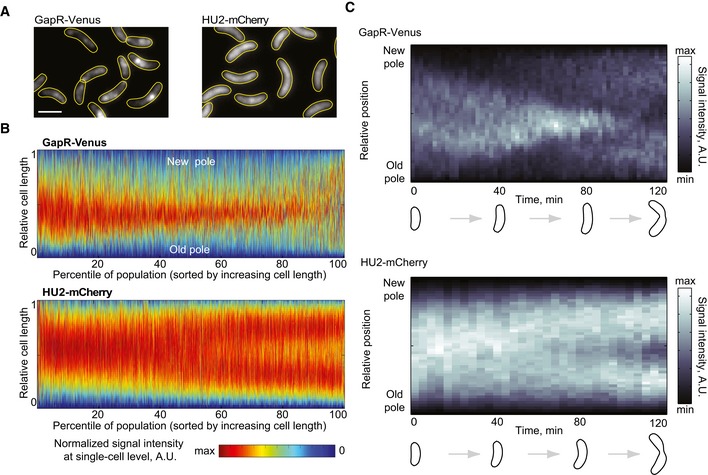
- Fluorescence images of an asynchronous population expressing GapR‐Venus (CJW5800) or HU2‐mCherry (CJW5806). Scale bar = 2 μm.
- Demographs of asynchronous populations (n = 2,700 cells) showing the cell cycle localization of GapR‐Venus (strain CJW5800) or HU2‐mCherry (strain CJW5806). Each fluorescent profile across the cell was normalized by cell length. Cells were sorted by increasing cell length. Cell coordinates in the GapR‐Venus demograph were oriented using new‐pole marker TipN‐CFP.
- Kymographs of a time‐lapse experiment showing a cell producing either GapR‐Venus (strain CJW5535) or HU2‐mCherry (strain CJW5960). The identity of the cell poles was determined by using new‐pole markers FtsZ‐CFP (for the gapR‐venus‐expressing strain) or TipN‐CFP (for the hu2‐mcherry‐expressing strain). The schematics show cell outlines from the Oufti software.
Figure EV3. Cell cycle dynamics of GapR localization are not caused by changes in GapR protein levels.
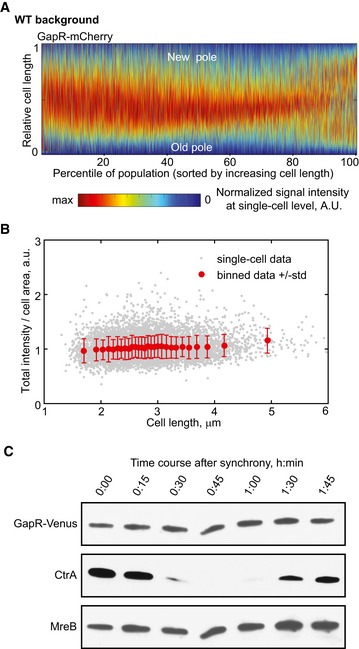
- Demograph of an asynchronous population (n = 4,266 cells) showing the cell cycle localization of GapR‐mCherry (strain CJW5810), shown in absolute cell‐length scale. Cells were sorted by increasing cell length, and cell coordinates were oriented using new‐pole marker TipN‐GFP.
- Fluorescence intensity of GapR‐Venus (total intensity divided by cell area) for cells represented in the demograph shown in (A; strain CJW5810, top panel). Cells were sorted by length as in (A). Gray dot = single‐cell value. Red dot and bar = mean ± standard deviation value for 300 cells.
- Western blot of cell lysates collected every 15 min from a synchronized cell culture of CJW5534, in which GapR‐Venus is expressed from its native chromosomal locus and promoter. CtrA and MreB were used as cell‐cycle‐synchronization and loading controls, respectively. See Appendix Supplementary Methods for Western blot experimental conditions.
GapR and replication dynamics are correlated
The most striking aspect of GapR's cell cycle localization pattern was how similar it was to the known cell cycle localization pattern of unreplicated DNA in C. crescentus (Jensen et al, 2002). To examine a potential connection between the localization of GapR and DNA replication, we imaged synchronized populations producing GapR‐Venus, together with an mCherry fusion to the β sliding clamp DnaN to mark the position of the replisomes (Fig 6A). Remarkably, the apparent “condensation” of the GapR‐Venus signal toward the midcell region correlated with replisome motion (Fig 6A). We note that in current C. crescentus models, the two replisomes (one for each chromosomal arm) are typically depicted as traveling next to each other during replication (Fig 6B, “joined replisomes”; Jensen & Shapiro, 1999b; Hong & McAdams, 2011; Wang et al, 2013). However, we observed a significant proportion of cells with two DnaN‐mCherry spots (Appendix Fig S4), indicating that the two replisomes frequently separate. When separated, the two replisomes migrated bidirectionally toward midcell (Fig 6B and C, “bidirectional replisome” mode). Replisome localization has been examined previously using fluorescent fusions to replisome components including DnaN (Jensen et al, 2001; Wang & Shapiro, 2004; Collier & Shapiro, 2009; Hong & McAdams, 2011; Fernandez‐Fernandez et al, 2013). The presence of cells with two fluorescent foci has been reported (Jensen et al, 2001; Collier & Shapiro, 2009; Hong & McAdams, 2011), but this observation has been left out of models because the occurrence of cells with two foci was very small. We think that the discrepancy may simply come from signal detection, as the replisome signal moving from the old pole was always much brighter than the one migrating away from the new pole and a second spot was not apparent in all cells (Appendix Fig S4). Therefore, the second, dimmer spot could easily be missed depending on the imaging conditions, especially when imaged with replisome proteins that are in lower abundance than DnaN (Jensen et al, 2001). Furthermore, dim fluorescent spots are easier to distinguish from noise in time‐lapse kymographs compared to still images because real spots persist over time, showing a relatively linear pattern over multiple frames (Fig 6D, Appendix Fig S5). The dim replisome signal was also intermittent (Fig 6D, Appendix Fig S5). While the intermittent signal may be a detection issue (e.g., a dim signal going in and out of the focal plane) or the product of multiple rounds of DnaN dissociation and re‐association with the replication machinery, it may also reflect occasional re‐joining of the two replisomes such that the “joined” and “bidirectional” modes of replisome migration (Fig 6B) may co‐exist in the cell population. Both modes are compatible with the known chromosome configuration (Jensen & Shapiro, 1999b; Hong & McAdams, 2011; Wang et al, 2013) and the localization profile of unreplicated and newly replicated DNA (Jensen et al, 2001); that is, in both joined and bidirectional modes of replisome migration, the region of unreplicated DNA shrinks bidirectionally from the ends (Fig 6B).
Figure 6. GapR localization during the cell cycle is correlated with replisome dynamics.
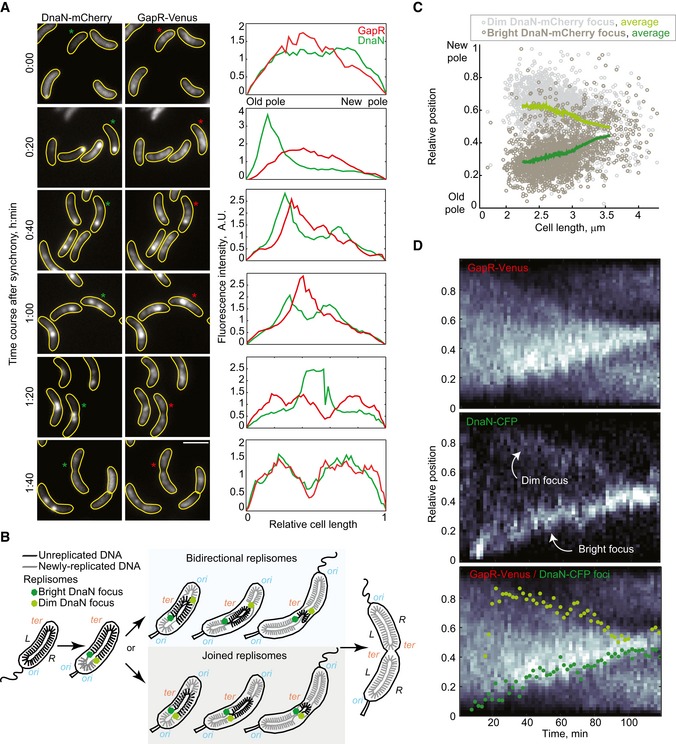
- Images showing GapR‐Venus and DnaN‐mCherry localization in a time‐course experiment (CJW5744) following cell cycle synchronization. After synchronization, cells were resuspended in M2G liquid medium and incubated at 30°C, and samples were taken for imaging every 20 min and imaged. Fluorescence intensity profiles along the cell length are shown for cells marked with an asterisk. Scale bar = 2 μm.
- Schematic showing the organization of the unreplicated and replicated chromosomal DNA coordinated with replisome dynamics during the Caulobacter crescentus cell cycle. The two replisomes move toward midcell, either in a joined fashion from the old pole or bidirectionally from opposite poles. The origin (ori) and terminus (ter) of replication as well as the left (L) and right (R) arms of the chromosome are indicated.
- Relative locations of dim and bright DnaN‐mCherry foci in cells exhibiting two foci. See Code EV1 information for details of focus detection algorithm.
- Kymographs of single‐cell time‐lapse microscopy experiment. After synchronization, swarmer cells (CJW5836) were spotted into a 1% agarose M2G pad at ~25° and imaged every 2 min. The bottom panel shows the kymograph of GapR‐Venus overlaid with the position of the dim (light green) and bright (dark green) DnaN‐CFP foci.
Importantly, the correlated dynamics between the replication forks and GapR (and not HU2) were confirmed in time‐lapse experiments on single cells (Fig 6D and Appendix Figs S5 and S6). Our data showed that replication fork progression flanked the gradual condensation of the GapR‐Venus area toward midcell, leaving zones of GapR depletion behind, as if the replication forks were displacing GapR from the DNA. We also noted that during condensation, the GapR‐Venus signal tended to display a higher concentration directly in front of the moving bright DnaN‐CFP focus (Fig 6D, Appendix Fig S5).
Analysis of the condensation of the GapR signal at the population level was challenged by the variability in replisome dynamics (such as timing of replisome assembly and speed of replisome motion) among cells (Fig 6D and Appendix Fig S5). To minimize this cell‐to‐cell variability, we developed an algorithm that computationally synchronizes the time‐lapse sequences of individual cells relative to their replisome dynamics (see Appendix Supplementary Methods) such that the time of replisome assembly becomes t = 0. From the aligned sequences of each cell, we determined how non‐random (organized) a signal is by measuring how far the signal is from its theoretical maximum entropy (corresponding to an organization factor = 0). Consistent with a replisome‐dependent condensation of the GapR signal followed with re‐dispersion, the spatial organization of GapR in populations (n = 752 cells) started increasing dramatically after replisome assembly, peaked, and then returned back to its original level by the end of replication (Fig EV4). This is in striking contrast to HU2 whose organization factor remained low throughout the cell cycle (Fig EV4, n = 579 cells).
Figure EV4. Population analysis of GapR and HU2 spatial organization during the cell cycle.
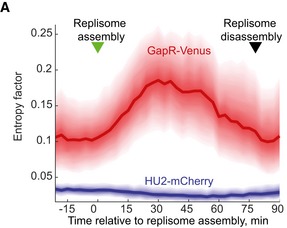
Plot showing how the spatial distribution of GapR‐Venus and HU2‐mCherry deviates from their theoretical maximum entropy values, with the greater the values are, the more organized (the least dispersed) the signal is. In this plot, maximum entropy (uniform distribution) corresponds to an organization factor value of zero. The data were obtained from time‐lapse experiments of CJW5932 (n = 752) or CJW5969 (n = 579) cells and were computationally synchronized by maximizing the correlation in DnaN‐CFP signal dynamics. See Code EV3 information for details about the calculation of the organization factor.
Regulation of GapR localization is not mediated by DNA methylation
Our results so far suggested that the condensation of the GapR signal (Figs 6D and EV4, and Appendix Fig S5), which largely mirrors the expected localization of unreplicated DNA during the cell cycle (Fig 6B), is dictated by replication. A beautiful example of replication‐dependent regulation of NAP activity is illustrated by SeqA in enteric bacteria. However, there are important differences between what is known for SeqA and what we observed for GapR. SeqA binds to freshly replicated DNA right behind the replisomes (Helgesen et al, 2015) whereas GapR displays a reverse pattern, with a relative accumulation on unreplicated DNA in front of the replisomes. In the case of SeqA, the regulation by DNA replication is achieved through SeqA's affinity for hemimethylated GATC sequences that are only present in freshly replicated DNA before the Dam methylase fully methylates these sites (Helgesen et al, 2015). DNA methylation has been assessed at the genome level in C. crescentus, and the only example of cell cycle‐regulated DNA methylation is the methylation of GAnTC sites by the DNA methyltransferase CcrM (Kozdon et al, 2013). These GAnTC sites become hemimethylated after replication and remain in that state until ccrM is expressed prior to cell division (Zweiger et al, 1994). Thus, a logical hypothesis for the relative accumulation of GapR on unreplicated DNA could be that GapR has a high affinity for fully methylated GAnTC sites. This possibility is unlikely for two reasons. First, the ChIP experiments showed no preferential binding to GAnTC sites (Fig 4D and E). Second, the cell cycle localization of the GapR‐Venus signal was unaltered by constitutive expression of ccrM (Appendix Fig S7), which causes GAnTC sites to remain fully methylated throughout the cell cycle (Gonzalez et al, 2014).
GapR displays a very slow spontaneous dissociation from the DNA
What could explain GapR dynamics if DNA methylation is not involved? Perhaps other types of DNA modification or differences in DNA structure (e.g., supercoiling state) between replicated and unreplicated DNA underlie the differential binding of GapR. Such a scenario would rely on the general assumption that the binding profile of a DNA‐binding protein reflects the distribution of binding sites and that when the distribution of binding sites changes, the protein quickly re‐distributes. This scenario would make the implicit assumption that the protein has a relatively fast spontaneous dissociation from the DNA to achieve rapid protein re‐distribution.
To examine the rate of spontaneous dissociation of GapR‐Venus from the DNA, we performed fluorescence recovery after photobleaching (FRAP) microscopy. Here, we used filamentous (FtsZ‐depleted) cells to circumvent the small size of bacterial cells, as is commonly done for bacterial FRAP experiments (Elowitz et al, 1999). Following photobleaching of a region of the cell, we observed, to our surprise, little fluorescence recovery of GapR‐Venus signal over the entire length (20 min) of the experiment (Fig 7A–C). Quantitative analysis of our FRAP data (Fig 7C) suggests that the characteristic time of fluorescence recovery is τ = 110 ± 28 min (mean ± SD, n = 10). This value is likely an underestimation of the dissociation time (τoff) of GapR from the DNA since both the spontaneous dissociation and the de novo synthesis of GapR‐Venus account for the observed fluorescence recovery. The data indicate that the spontaneous dissociation is too slow to account for the dynamic re‐distribution of GapR on the timescale of minutes that we observed during replication (Fig 6D and Appendix Fig S5).
Figure 7. GapR forms long‐lived complexes with DNA that are disrupted by replisome progression.
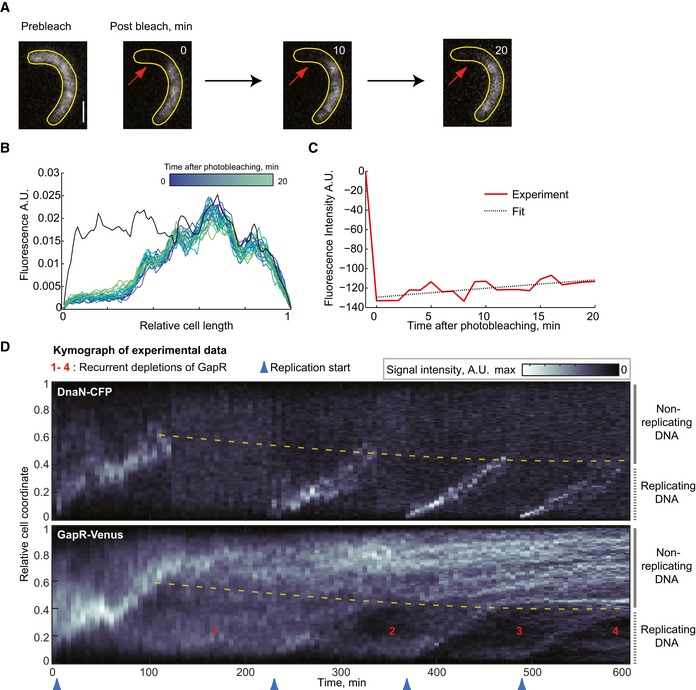
- Selected images of a FRAP experiment of GapR‐Venus in a cell (CJW5808) following synchrony and FtsZ depletion (through removal of the xylose inducer of ftsZ expression). The red arrows indicate photobleached area (left). Scale bar = 1 μm. See Appendix Supplementary Methods for FRAP experimental conditions and analysis.
- Evolution of GapR‐Venus fluorescence profile for the cell represented in (A). For each time point, the signal was normalized to the total fluorescence per cell, except for the signal before photobleaching (black line), which was rescaled according to the total fluorescence during bleaching.
- Plot showing the change in fluorescence signal in the photobleached region (red line) before and following photobleaching for the cell represented in (A). The black dotted line is the best fit of exponential recovery, which gives τ = 135 min.
- Kymographs of an FtsZ‐depleted cell expressing GapR‐Venus and DnaN‐CFP (CJW5808). FtsZ depletion was initiated after synchronization by allowing cells to resume cell cycle progression without xylose (ftsZ expression inducer).
GapR dynamics is driven by replication fork passage
Given the striking correlated localization dynamics between replisomes and GapR (Fig 6 and Appendix Fig S5), we considered the possibility that the GapR dynamics may be primarily driven by the replication fork displacing GapR from the DNA during DNA replication. To test this idea, we again turned to FtsZ‐depleted cells. These cells do not divide, but still replicate and segregate DNA, leading to multiple segregated chromosomes. However, we and others have shown that only one chromosome fires DNA replication at each replication cycle, and it is often the chromosome located next to the old pole, leaving the other segregated chromosomes silent (Chen et al, 2011; Sliusarenko et al, 2011). This leads to a situation in which replicating and non‐replicating chromosomes co‐exist. We reasoned that if the dependence of GapR dynamics on replication fork passage is correct, we should expect that GapR will only be removed from the replicating DNA, followed with re‐distribution of the displaced GapR on both the replicating and unreplicating DNA. Therefore, each round of replication in FtsZ‐depleted cells should lead to progressive replisome‐dependent depletion of GapR on the replicating DNA. Consistent with this expectation, kymographs of GapR‐Venus and DnaN‐CFP in FtsZ‐depleted cells showed a step‐wise depletion of the GapR‐Venus signal from the DNA‐replicating region with each passage of the DnaN‐CFP‐labeled replisome (Fig 7D and Appendix Fig S8).
This striking localization pattern implies that the dissociation of GapR from DNA primarily occurs when GapR encounters the replication fork. Note that the very slow spontaneous dissociation of GapR from the DNA was confirmed by the presence of long (> 100 min) horizontal “streaks” of GapR signal on the non‐replicating DNA in kymographs (Fig 7D and Appendix Fig S8), which is consistent with long‐lived GapR/DNA complexes (Fig 7A). If spontaneous dissociation of a NAP was significant (e.g., in the minute timescale), stochastic accumulation of signals along the chromosome would not persist at the same location over time (see didactic simulations, Appendix Fig S9).
The directionality in replisome activity from ori to ter is sufficient to produce an asymmetric binding pattern of GapR
Collectively, our results suggest that GapR binds to the DNA tightly and that its dissociation from the DNA primarily occurs through the passage of the replication fork. Can this replication‐dependent eviction alone (i.e., without an asymmetry in binding sites) generate an asymmetry in GapR binding activity along the chromosome? To examine this question, we turned to mathematical modeling and stochastic simulations. Our “replication‐eviction” model made the following assumptions grounded on experimental evidence: (i) GapR binds uniformly along the chromosome (to reflect the uniform distribution of GapR binding sites). (ii) GapR dissociates from the DNA only when it encounters the replisome (to account for the negligible spontaneous dissociation and the correlated dynamics between GapR and replication forks). (iii) The replisome moves from ori to ter to produce two copies of DNA (well‐known fact). In the model, the cell cycle phases were t = 0–0.3 (in cell cycle unit) for G1 phase, t = 0.3–0.9 for S phase, and t = 0.9–1.0 for G2 phase. For simplicity, only one arm of the chromosome (i.e., one replisome) was simulated, as the second arm would show the same dynamics.
Stochastic simulations of the model (Fig 8A, Movie EV1) started with uniform distribution of GapR due to random binding. In S phase, the replisome displaced GapR during its progression, resulting in depletion of GapR on the replicated DNA (i.e., behind the moving replisome). Displaced GapR re‐bound anywhere on the DNA (with uniform probability whether the DNA was replicated or not). As a consequence, some GapR re‐associated with the naked DNA behind the replisome and some GapR was added to the already existing pool of DNA‐bound GapR in front of the replisome. This resulted in a gradual increase in concentration of GapR on the unreplicated DNA (Fig 8A). This process ultimately led to a linearly decreasing gradient of GapR from ori to ter by the end of replication (Fig 8, t = 1.0), simply because GapR had more time to accumulate at the ori‐proximal regions.
Figure 8. A replication‐eviction model is sufficient to generate the binding asymmetry of GapR observed in vivo .
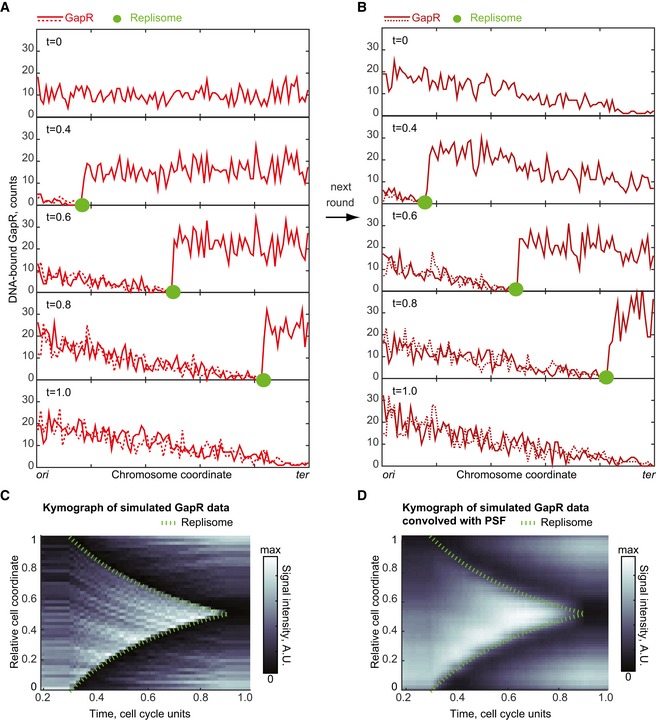
- One‐dimensional simulation of the replication‐eviction model showing the evolution of GapR distribution on replicated and unreplicated DNA during replisome progression. GapR is synthesized throughout the cell cycle such that its amount (1,000 molecules) has doubled by the end of the cell cycle. At t = 0 (in cell cycle unit), GapR binding along the chromosome is uniform. We assume that replication starts at t = 0.3 and ends at t = 0.9. The replisome moves at a constant speed from ori to ter and leaves behind two copies of the replicated DNA region (sister chromatids). When the replisome encounters GapR, the replisome displaces GapR from the DNA. The displaced GapR is then randomly re‐distributed, with uniform probability over the two replicated regions and the unreplicated region. See text and Appendix Supplementary Methods for Model simulations.
- Same as in (A), but starting with the GapR distribution at t = 1 in panel (A) to show the effect of a second round of replisome progression on GapR distribution on replicated and unreplicated DNA.
- Kymograph of simulated GapR distribution over cell cycle time in wild‐type cells. The green dashed line indicates replisome progression. GapR distribution between t = 0 and t = 0.2 is the same as between t = 0.2 and t = 0.3.
- Same as (C) but after convolution of the GapR signal with a PSF approximated by a Gaussian with a standard deviation of our optical setup (0.065 in relative cell‐length units).
The next round of replication then started with this pre‐existing gradient of GapR distribution (Fig 8B, t = 0). Replisome progression resulted in a similar pattern as described for the first round, except that the distribution of GapR in front of the replisome was slanted due to the asymmetric distribution of GapR at the start of replication (Fig 8B). Thus, despite the uniform distribution in binding sites, this simple model could recapitulate both the depletion of GapR behind the replisome and the accumulation of GapR in front of replisome observed in the GapR localization experiments (Fig 6D). The asymmetry in GapR binding along the chromosome simply comes from the inherently asymmetric motion of the replisome, always traveling from ori to ter.
Simulating additional rounds of replication did not further change the distribution of GapR (Movie EV1) such that before (t = 0) and after replication (t = 1), GapR displayed a gradient distribution linearly decreasing from ori to ter (Appendix Fig S10). This theoretical curve of GapR distribution along the chromosome coordinates (convolved with the point spread function (PSF) for our optical setup; see Appendix Fig S10) is in qualitative agreement with the GapR localization profile along the cell (Fig 4C) as well as the GapR ChIP peak distribution along the chromosome during G1 phase (Fig 4B). In addition, we used the simulated profiles to calculate the average GapR profile along the chromosome in an asynchronous population. We found that the resulting GapR profile remains asymmetric between ori and ter and that this asymmetry is in good agreement with the ChIP data of asynchronous populations (Appendix Fig S11).
We used the simulated data from the replication‐eviction model and the known spatial arrangement of replicated and unreplicated chromosome regions (Jensen et al, 2001; Fig 6B) to visualize the spatial distribution of GapR during the cell cycle in kymograph form, before (Fig 8C) and after (Fig 8D) convolution with a PSF corresponding to our optical setup. We found that the simulated data (before and after convolution) reproduce the cell cycle localization pattern of GapR, with the gradual “condensation” toward midcell and the flanking depletion zones (see Fig 6D versus Fig 8C and D). In addition, the replication‐eviction model produced the accumulation of GapR in front of the replisome migrating from the old pole (Fig 8B–D), similar to what we observed experimentally (Fig 6D). This accumulation was due to the slanted distribution of GapR in G1 phase caused by the previous replication round, as shown by our model (Fig 8A and B, and Appendix Fig S10). We obtained similar results if the model considered spontaneous dissociation of GapR from the DNA with the characteristic time (τoff = 100 min) corresponding to the recovery timescale observed in FRAP experiments (Appendix Fig S12).
The agreement between model and experiments suggests that a simple replication‐eviction mechanism alone can explain the major features of the spatiotemporal dynamics of GapR.
Discussion
Collectively, our data suggest that GapR and, by extension, the conserved domain DUF2312 encode a NAP function critical for cellular replication. While this manuscript was under revision, the Shapiro group published an article describing the identification of the same nucleoid‐associated protein in C. crescentus (Ricci et al, 2016). The only overlap with our study is the DNA‐binding preference of the protein to AT‐rich DNA sequences and its essential function in cell cycle progression under standard laboratory conditions (nutrient‐rich PYE medium, 30°C). We show here that cells can live without GapR under slow‐growth conditions. However, even under the most optimal conditions tested (nutrient‐poor M2G medium, 22–25°C), ΔgapR cells display significant defects in growth, cell size, DNA replication, chromosome segregation/condensation, and gene expression (Figs 2 and 3). The pleiotropic phenotypes associated with the ΔgapR mutation are probably linked. We envision that, like for other NAPs, GapR binding activity affects local DNA structure. Loss of this activity along the chromosome could affect gene expression, DNA segregation, and the progression of replication forks at a global scale. Stalled forks could then result in DNA lesions, causing an activation of the DNA damage stress response. These defects, which could be manageable under slow‐growth conditions, would be exacerbated under fast‐growth conditions when the DNA repair machinery may become overwhelmed with DNA damage, leading to cell filamentation and ultimately cell lysis. Consistent with this idea, transduction experiments suggest that loss of gapR becomes lethal in the absence of SOS induction, even under slow‐growth conditions. Indeed, we were able to consistently transduce the ΔgapR mutation into the wild‐type background, whereas we reproducibly could not get any ΔgapR colonies in a ΔrecA or lexA K203A background. RecA is essential for SOS induction in C. crescentus (Galhardo et al, 2005), and the LexAK203A mutant is a constitutive inhibitor of SOS induction in this bacterium (Modell et al, 2014). As a control, we confirmed that the ΔrecA and lexA K203A mutants have no viability defect in a wild‐type background under slow‐ or fast‐growth conditions, consistent with a previous report (Modell et al, 2014).
Our results strongly suggest that GapR acts as a global regulator of DNA processes through its broad, asymmetric DNA‐binding activity on the chromosome. We note that GapR may also be involved in specific regulatory functions. While this work focuses on understanding the overall asymmetric binding activity of GapR over the chromosome, the ChIP experiments reveal binding enrichments at specific chromosomal coordinates that cannot be explained by our replication‐eviction model, suggesting that other layers of regulation exist. For example, it is intriguing that GapR binds to the AT‐rich parS and dif regions (Fig EV2E). Since these two regions have been directly implicated in DNA segregation in C. crescentus (Mohl & Gober, 1997; Jensen, 2006; Toro et al, 2008), it is possible that GapR has a specific regulatory function in chromosome segregation. It is also interesting that GapR is found in bacteriophages (Fig EV1B), which suggests that these phages may use GapR to alter chromosome transactions in the host cells.
The observation that the density of GapR binding peaks decreases from ori to ter in G1‐phase cells (Fig 4B and C) indicates that this chromosomal bias is independent of a gene dosage effect. Biased binding on the chromosome has been reported for other NAPs such as Noc in B. subtilis and SlmA, SeqA, and MatP in E. coli (Mercier et al, 2008; Wu et al, 2009; Sanchez‐Romero et al, 2010; Tonthat et al, 2011; Waldminghaus et al, 2012). In these cases, the asymmetric binding profile was due to asymmetrically distributed recognition sequences (Lu et al, 1994; Mercier et al, 2008; Wu et al, 2009; Cho et al, 2011; Tonthat et al, 2011). Here, we show that asymmetric patterning can also be achieved via another mechanism, as we do not see any evidence of a chromosomal bias for the GapR AT‐rich binding motif (Fig 4) or evidence of regulation through cell cycle‐dependent DNA methylation (Appendix Fig S7). Furthermore, the observation that GapR has a negligible rate of spontaneous dissociation from the DNA (Fig 7) precludes any mechanism that would rely on a quick equilibration of GapR binding in response to a change in binding site affinity.
Instead, our experimental and modeling studies suggest that the progression of replication forks shapes the dynamics of GapR (Figs 6, 7, 8). The passage of the replication forks appears to be the major factor that drives GapR dissociation from the DNA, much like the replication fork ejects histones in eukaryotic cells. In our model, the eviction process is considered phenomenologically. How it occurs mechanistically—through a collision between the replisome and GapR or through a local change in DNA structure (e.g., supercoiling) in front of the replication fork—remains to be determined. Regardless of these mechanistic details, our minimal replication‐eviction model demonstrates that the asymmetry in DNA replication (from ori to ter), when combined with slow GapR dissociation from DNA, leads to a biased distribution of GapR from ori to ter between replication cycles (Fig 8, Movie EV1).
It is possible that other layers of regulation (e.g., supercoiling, higher order DNA structures) affect GapR dynamics on the chromosome and during the cell cycle. However, we show that the most parsimonious model (Fig 8), which only considers the role of DNA replication (and does not evoke any asymmetry in binding sites), is sufficient to reproduce the key spatiotemporal features of GapR dynamics at the chromosome scale (Fig 6). To our knowledge, our model describes a novel mechanism of cell cycle regulation in bacteria. Since GapR affects several DNA processes (Fig 3), we speculate that this simple cell cycle control mechanism may provide an important means for the cell to exquisitely couple chromosome dynamics and gene expression to the progress of DNA replication.
DNA replication is known to affect gene expression through gene dosage (doubling gene copy number following replication) and through replisome collisions with RNA polymerases. Our work suggests another mechanism by which DNA replication can affect gene expression. This proposed mechanism may be generalizable beyond GapR homologs (Fig EV1). The replication‐eviction model shows that DNA‐binding proteins with uniform distribution of binding sites along the chromosome will have their binding activity shaped by DNA replication if their spontaneous dissociation is slow relative to the cell cycle (Fig 8). If this is not observed, then it will suggest that other characteristics of the system (e.g., saturation of binding sites) or additional layers of regulation exist to cancel out the asymmetry generated by the motion of the replication forks, which invariably progress from ori to ter. Otherwise, if the asymmetry is not somehow “corrected”, genes regulated by these DNA‐binding proteins will be differentially regulated whether they are in front of or behind the replisome. In addition, gene expression will be affected even when replication is not ongoing, as the asymmetry in replisome motion causes a biased distribution of DNA‐binding activity from ori to ter (Fig 8, Movie EV1), resulting in differential regulation dependent on gene location. The effect of DNA replication on protein binding activity may therefore be a potential source of selective pressure on gene location that, to our knowledge, has not yet been considered.
Materials and Methods
Strains, plasmids, and oligonucleotides
The strains and plasmids used in this study are described in Appendix Table S1. Construction of strains and plasmids is detailed in Appendix Table S2. Oligonucleotides are listed in Appendix Table S3.
Growth conditions
For cloning and imaging purposes, E. coli strains were cultured at 37°C in either LB medium or M9 supplemented medium unless indicated otherwise. Genes under control of the arabinose‐inducible promoter were induced for expression with 0.2 or 0.02% arabinose for 1.5–2 h. Constructs in C. crescentus were natively expressed, or expressed under the control of xylose‐ or vanillate‐inducible promoters by adding 0.3% D‐xylose or 0.5% vanillic acid (Thanbichler et al, 2007). DNA staining with DAPI was performed for 10 min at room temperature using a final concentration of 0.5 μg/ml for C. crescentus or 1–5 μg/ml for E. coli. Medium composition is detailed in Appendix Supplementary Methods.
Electrophoretic mobility shift assay
GapR DNA‐binding capacity was evaluated by incubation of purified GapR with 1.6 pmol of double‐stranded DNA (dsDNA) in the presence of EMSA buffer for 30 min at room temperature and subjected to electrophoresis in a Novex® TBE DNA retardation gel 6% polyacrylamide (Thermo Fisher Scientific) at constant 100 mV for 90 min at 4°C in 0.5× TBE buffer. The protein concentrations were 150 nM, 300 nM, 600 nM, 1.2 μM, 1.5 μM and 3 μM (note that these concentrations reflect measurements from a Bradford assay and not the concentrations of active GapR). DNA–protein complexes were stained with ethidium bromide and imaged with an Amersham Imager 600 (GE Healthcare Bio‐Sciences). The dsDNA probes were generated by PCR amplification or hybridization of reverse complementary oligonucleotides (Appendix Table S3) at 98°C for 5 min followed by cooling to room temperature. Hybridization efficiency was assessed by electrophoresis in a polyacrylamide gel and ethidium bromide staining. Probes were finally purified using a QIAEX II Gel Extraction Kit (Qiagen, Hilden Germany). Buffer composition is detailed in Appendix Supplementary Methods.
Microscopy and image post‐processing analysis
Unless otherwise stated, C. crescentus cells were grown to exponential phase (OD660 nm < 0.3) and spotted on agarose pads containing M2G prior to imaging. Escherichia coli cells were grown to exponential phase (OD600 nm < 0.3) and spotted on agarose pads containing supplemented M9. Epifluorescence microscopy was performed on either an Eclipse 80i microscope or an Eclipse Ti‐E microscope (both from Nikon, Tokyo, Japan). Both microscopes were equipped with Perfect Focus System (Nikon), a phase‐contrast objective Plan Apochromat 100×/1.40 NA (Nikon), and an ORCA‐Flash4.0 V2 Digital CMOS camera (Hamamatsu Photonics, Hamamatsu City, Japan). All images were acquired using either MetaMorph software (Molecular Devices, Sunnyvale, CA, USA) or NIS‐Elements software (Nikon Instruments Inc., Melville, NY USA). FRAP experiments were performed using a Nikon E80i microscope equipped with 100× phase‐contrast objective and an Andor iXonEM+ DU‐897 camera (Hamamatsu Photonics) controlled by the MetaMorph software. Fluorescence photobleaching was performed using a Photonic Instruments Micropoint laser system at the 488 nm (Hamamatsu Photonics). Images were analyzed with MetaMorph, Oufti (Paintdakhi et al, 2016), ImageJ, or MATLAB software (MathWorks). Cell outlines were generated from phase‐contrast images using Oufti. Figures 1C, 4C, 6A, 7C, and Appendix Fig S3B represent the normalized fluorescence intensity per segment area of cell outlines for each signal processed with Oufti.
RNA‐seq
Caulobacter crescentus wild‐type (NA1000) and ΔgapR (CJW5747) cells were grown, in triplicate, at 25°C in M2G until the cultures reached an OD660 nm 0.2–0.275. At this point, 30–40 ml of culture was harvested by centrifugation at 4°C for 10 min at 7,181 × g. Total RNA was isolated with TRIzol (Thermo Fisher Scientific) as described below. Subsequent steps were performed according to the manufacturer's protocol, except that centrifugation was performed at ~21,000 × g. RNA pellets were resuspended in 50 μl of DEPC water and incubated for 5 min at 55°C. Size and integrity of the extracted RNA were assessed by denaturing agarose gel electrophoresis; rRNA bands appeared intact and no RNA smear was apparent. Removal of DNA was completed by incubation of 1 μg of RNA with TURBO DNA‐free™ Kit (Thermo Fisher Scientific) following the manufacturer's protocol. RNA quality was further evaluated by absorbance ratio 260/280 nm and 260/230 nm using a Nanodrop device (Thermo Fisher Scientific). Samples were considered good if the ratio 260/280 nm was > 1.9. RNA samples were immediately frozen and stored at −80°C. See Appendix Supplementary Methods for details on library preparation, sequencing, and data analysis.
ChIP‐seq
ChIP‐seq samples were obtained from cultures (OD660 nm ≈ 0.4) of CJW5534 producing GapR‐Venus grown in PYE at 30°C. In parallel, a mock ChIP sample was collected from a PYE culture of CJW5796 producing freely diffusing Venus after 1 h 30 min of induction with 0.3% xylose. Sample preparation was as described before (Fumeaux et al, 2014) with the following modifications: Pierce™ Protein A/G Magnetic Beads (Thermo Fisher Scientific) and anti‐GFP (JL‐8) Living Colors® Av Monoclonal Antibody (Clontech Laboratories) were used for protein immunoprecipitation, SDS was excluded from ChIP buffer, herring sperm DNA was not used to saturate beads, and sonication was performed using a Digital Sonifier® S‐250D on ice with the 1/8” microtip (Branson Sonic Power Co.) with 45% output and 10 cycles of 30 s ON/30 s OFF. Quality and concentration of the ChIP‐DNA were assessed by estimating the A260/A280 and A260/A230 ratios with a Nanodrop device (Thermo Scientific). See Appendix Supplementary Methods for details on library preparation, sequencing, and data analysis.
Genome sequencing
See Appendix Supplementary Methods for details on culture preparation, DNA extraction, library preparation, sequencing, and data analysis.
FRAP data acquisition and analysis
Strain CJW5808, which expresses gapR‐venus, dnaN‐mCherry, and the cell division gene ftsZ under xylose control, was cultured in M2G supplemented with 0.3% xylose until mid‐log exponential phase. At this point, cells were washed in M2G without xylose and diluted to an approximate OD660 nm ≈ 0.1 to resume growth and allow cell filamentation at 30°C for ~2–6 h. Additionally, when indicated, cells were grown with novobiocin (5 μg/ml) for 30 min prior imaging. Then, cells were spotted on 2% agarose M2G pads supplemented with appropriate drugs. FRAP experiments in both cases were performed at room temperature (~22°C) as described previously (Montero Llopis et al, 2012) with the following modifications. Cells were imaged once before photobleaching and then bleached (> 0.5 s, depending on the experiment). This was followed with imaging in time series at 10s‐ms or 20‐s intervals for 600 or 1,200 s. For analysis, we calculated the difference between pre‐bleach and after‐bleach signals in the region of interest (i.e., bleached area) as a function of time. To take into account photobleaching due to image acquisition, the fluorescence signal was normalized to the total fluorescence per cell. Generated fluorescence recovery curves, S(t), were fitted by the exponential equation S(t) = S0 exp(−t/τ) with two free parameters S0 and τ which are the amplitude of bleaching and the characteristic recovery time, respectively.
Model simulations
We considered the following mechanism. GapR molecules bind to DNA anywhere with the same probability, with no binding saturation. We assumed that spontaneous unbinding from the DNA is slow (relative to the cell cycle), such that GapR dissociates from the DNA only when the moving replisome displaces it during the replication. Free GapR diffuses within the entire cytoplasm until it binds DNA. To simulate the GapR dynamics in such a scenario, we considered a 1D model. In the model, the coordinates correspond to genomic position, from ori to ter. We considered only one arm of the chromosome, as the second arm would behave similarly. In simulations, DNA replication spans 60% of the cell cycle, with the replisome moving at a constant speed. Rebinding of GapR displaced by the replisome was modeled as a random binding with uniform probability at any genomic coordinate, including the second copy of the replicated DNA. To ensure that the GapR amount is doubled at the end of the cell cycle, simulations also included de novo synthesis of GapR, which was modeled as a constant production (with a rate R = n A/T; n A and T are number of GapR molecules and cell cycle time, respectively) with a uniform random distribution throughout the cell cycle. Similarly to the displaced GapR, all newly synthesized GapR randomly associated with the DNA with the same probability at any position. Additionally, we also carried out simulations in which GapR can spontaneously (i.e., independently of replisome progression) unbinds from DNA. In this case, GapR–DNA dissociation was considered as a stochastic process with exponentially distributed times, with characteristic time τoff = 1/koff.
At t = 0, all GapR were randomly distributed throughout the cell (uniform distribution). Cell cycle periods were as follows: pre‐replication (G1) phase (with no replisome): t = 0.0–0.3; replication (S) phase: t = 0.3–0.9; and post‐replication (G2) phase: t = 0.9–1.0. Time evolutions of the system were simulated with time step Δt = 0.2 min. See Code EV2 information for algorithm details.
To simulate the average GapR distribution over the chromosome in asynchronous populations, we used demograph data on DnaN‐CFP for an asynchronous culture to estimate the fraction of the cells in G1 (before replication), S (replication), and G2 (after replication but before division) phases of the cell cycle: 0.17, 0.79, and 0.04, respectively. We considered 7,800 in silico cells and, for each individual cell, we calculated the GapR profile as follows: (i) linear descending gradient for cells in non‐replicating phase (as in Fig 8B, t = 1.0), and (ii) piece‐wise descending linear gradient with a break at the position of the replisome for replicating cells (e.g., as in Fig 8B, t = 0.6). For the replicating cells, we considered that the replisome moves linearly from ori to ter; that is, the probability of finding a replisome at a given chromosomal coordinate is uniformly distributed. Individual GapR distributions were averaged over all cells.
Author contributions
CJ‐W, GSD, MC, and RA‐C designed experiments. GSD and RA‐C performed experiments. MC and RA‐C conceived and performed genomic analyses. IVS designed and performed the modeling. BP conceived the quantitative fluorescence microscopy analysis. CJ‐W supervised the project. CJ‐W, GSD, MC, IVS, BP, and RA‐C wrote the manuscript.
Conflict of interest
The authors declare that they have no conflict of interest.
Supporting information
Appendix
Expanded View Figures PDF
Movie EV1
Dataset EV1
Code EV1
Code EV2
Code EV3
Review Process File
Acknowledgements
We would like to thank all the members of the Jacobs‐Wagner Lab for valuable discussions and critical reading of the manuscript. We are grateful to Drs. Patrick Viollier and Gaël Panis for advice regarding the ChIP‐seq protocol and to Drs. Tung Le and Michael Laub for sharing the Δsmc, Δhup1Δhup2, ΔrecA, and lexA K203A strains. We thank the staff of the Yale Center for Genomic Analysis, in particular Dr. Sameet Mehta for help with ChIP‐seq analysis. This work was supported by the National Institutes of Health (R01 GM065835 to C.J.‐W.). C.J.‐W. is an investigator of the Howard Hughes Medical Institute.
The EMBO Journal (2017) 36: 301–318
References
- Ali Azam T, Iwata A, Nishimura A, Ueda S, Ishihama A (1999) Growth phase‐dependent variation in protein composition of the Escherichia coli nucleoid. J Bacteriol 181: 6361–6370 [DOI] [PMC free article] [PubMed] [Google Scholar]
- Bos J, Yakhnina AA, Gitai Z (2012) BapE DNA endonuclease induces an apoptotic‐like response to DNA damage in Caulobacter . Proc Natl Acad Sci USA 109: 18096–18101 [DOI] [PMC free article] [PubMed] [Google Scholar]
- Bremer H, Churchward G (1977) An examination of the Cooper‐Helmstetter theory of DNA replication in bacteria and its underlying assumptions. J Theor Biol 69: 645–654 [DOI] [PubMed] [Google Scholar]
- Britos L, Abeliuk E, Taverner T, Lipton M, McAdams H, Shapiro L (2011) Regulatory response to carbon starvation in Caulobacter crescentus . PLoS ONE 6: e18179 [DOI] [PMC free article] [PubMed] [Google Scholar]
- Britton RA, Lin DC, Grossman AD (1998) Characterization of a prokaryotic SMC protein involved in chromosome partitioning. Genes Dev 12: 1254–1259 [DOI] [PMC free article] [PubMed] [Google Scholar]
- Browning DF, Grainger DC, Busby SJ (2010) Effects of nucleoid‐associated proteins on bacterial chromosome structure and gene expression. Curr Opin Microbiol 13: 773–780 [DOI] [PubMed] [Google Scholar]
- Chen YE, Tropini C, Jonas K, Tsokos CG, Huang KC, Laub MT (2011) Spatial gradient of protein phosphorylation underlies replicative asymmetry in a bacterium. Proc Natl Acad Sci USA 108: 1052–1057 [DOI] [PMC free article] [PubMed] [Google Scholar]
- Cho H, McManus HR, Dove SL, Bernhardt TG (2011) Nucleoid occlusion factor SlmA is a DNA‐activated FtsZ polymerization antagonist. Proc Natl Acad Sci USA 108: 3773–3778 [DOI] [PMC free article] [PubMed] [Google Scholar]
- Christen B, Abeliuk E, Collier JM, Kalogeraki VS, Passarelli B, Coller JA, Fero MJ, McAdams HH, Shapiro L (2011) The essential genome of a bacterium. Mol Syst Biol 7: 528 [DOI] [PMC free article] [PubMed] [Google Scholar]
- Collier J, Shapiro L (2009) Feedback control of DnaA‐mediated replication initiation by replisome‐associated HdaA protein in Caulobacter . J Bacteriol 191: 5706–5716 [DOI] [PMC free article] [PubMed] [Google Scholar]
- Cox MM, Goodman MF, Kreuzer KN, Sherratt DJ, Sandler SJ, Marians KJ (2000) The importance of repairing stalled replication forks. Nature 404: 37–41 [DOI] [PubMed] [Google Scholar]
- Dorman CJ (2014) Function of nucleoid‐associated proteins in chromosome structuring and transcriptional regulation. J Mol Microbiol Biotechnol 24: 316–331 [DOI] [PubMed] [Google Scholar]
- Elowitz MB, Surette MG, Wolf P‐E, Stock JB, Leibler S (1999) Protein mobility in the cytoplasm of Escherichia coli . J Bacteriol 181: 197‐203 [DOI] [PMC free article] [PubMed] [Google Scholar]
- Ely B, Gibbs W, Diez S, Ash K (2015) The Caulobacter crescentus transducing phage Cr30 is a unique member of the T4‐like family of myophages. Curr Microbiol 70: 854–858 [DOI] [PMC free article] [PubMed] [Google Scholar]
- England JC, Perchuk BS, Laub MT, Gober JW (2010) Global regulation of gene expression and cell differentiation in Caulobacter crescentus in response to nutrient availability. J Bacteriol 192: 819–833 [DOI] [PMC free article] [PubMed] [Google Scholar]
- Fernandez‐Fernandez C, Grosse K, Sourjik V, Collier J (2013) The beta‐sliding clamp directs the localization of HdaA to the replisome in Caulobacter crescentus . Microbiology 159: 2237–2248 [DOI] [PMC free article] [PubMed] [Google Scholar]
- Fumeaux C, Radhakrishnan SK, Ardissone S, Theraulaz L, Frandi A, Martins D, Nesper J, Abel S, Jenal U, Viollier PH (2014) Cell cycle transition from S‐phase to G1 in Caulobacter is mediated by ancestral virulence regulators. Nat Commun 5: 4081 [DOI] [PMC free article] [PubMed] [Google Scholar]
- Galhardo RS, Rocha RP, Marques MV, Menck CF (2005) An SOS‐regulated operon involved in damage‐inducible mutagenesis in Caulobacter crescentus . Nucleic Acids Res 33: 2603–2614 [DOI] [PMC free article] [PubMed] [Google Scholar]
- Gonzalez D, Kozdon JB, McAdams HH, Shapiro L, Collier J (2014) The functions of DNA methylation by CcrM in Caulobacter crescentus: a global approach. Nucleic Acids Res 42: 3720–3735 [DOI] [PMC free article] [PubMed] [Google Scholar]
- Groth A, Rocha W, Verreault A, Almouzni G (2007) Chromatin challenges during DNA replication and repair. Cell 128: 721–733 [DOI] [PubMed] [Google Scholar]
- Gupta RS, Mok A (2007) Phylogenomics and signature proteins for the alpha proteobacteria and its main groups. BMC Microbiol 7: 106 [DOI] [PMC free article] [PubMed] [Google Scholar]
- Helgesen E, Fossum‐Raunehaug S, Saetre F, Schink KO, Skarstad K (2015) Dynamic Escherichia coli SeqA complexes organize the newly replicated DNA at a considerable distance from the replisome. Nucleic Acids Res 43: 2730–2743 [DOI] [PMC free article] [PubMed] [Google Scholar]
- Hiraga S, Niki H, Imamura R, Ogura T, Yamanaka K, Feng J, Ezaki B, Jaffe A (1991) Mutants defective in chromosome partitioning in Escherichia coli . Res Microbiol 142: 189–194 [DOI] [PubMed] [Google Scholar]
- Hocking J, Priyadarshini R, Takacs CN, Costa T, Dye NA, Shapiro L, Vollmer W, Jacobs‐Wagner C (2012) Osmolality‐dependent relocation of penicillin‐binding protein PBP2 to the division site in Caulobacter crescentus . J Bacteriol 194: 3116–3127 [DOI] [PMC free article] [PubMed] [Google Scholar]
- Hong SH, McAdams HH (2011) Compaction and transport properties of newly replicated Caulobacter crescentus DNA. Mol Microbiol 82: 1349–1358 [DOI] [PubMed] [Google Scholar]
- Hu P, Brodie EL, Suzuki Y, McAdams HH, Andersen GL (2005) Whole‐genome transcriptional analysis of heavy metal stresses in Caulobacter crescentus . J Bacteriol 187: 8437–8449 [DOI] [PMC free article] [PubMed] [Google Scholar]
- Huisman O, Faelen M, Girard D, Jaffe A, Toussaint A, Rouviere‐Yaniv J (1989) Multiple defects in Escherichia coli mutants lacking HU protein. J Bacteriol 171: 3704–3712 [DOI] [PMC free article] [PubMed] [Google Scholar]
- Jensen RB, Shapiro L (1999a) The Caulobacter crescentus smc gene is required for cell cycle progression and chromosome segregation. Proc Natl Acad Sci USA 96: 10661–10666 [DOI] [PMC free article] [PubMed] [Google Scholar]
- Jensen RB, Shapiro L (1999b) Chromosome segregation during the prokaryotic cell division cycle. Curr Opin Cell Biol 11: 726–731 [DOI] [PubMed] [Google Scholar]
- Jensen RB, Wang SC, Shapiro L (2001) A moving DNA replication factory in Caulobacter crescentus . EMBO J 20: 4952–4963 [DOI] [PMC free article] [PubMed] [Google Scholar]
- Jensen RB, Wang SC, Shapiro L (2002) Dynamic localization of proteins and DNA during a bacterial cell cycle. Nat Rev Mol Cell Biol 3: 167–176 [DOI] [PubMed] [Google Scholar]
- Jensen RB (2006) Analysis of the terminus region of the Caulobacter crescentus chromosome and identification of the dif site. J Bacteriol 188: 6016–6019 [DOI] [PMC free article] [PubMed] [Google Scholar]
- Kaidow A, Wachi M, Nakamura J, Magae J, Nagai K (1995) Anucleate cell production by Escherichia coli delta hns mutant lacking a histone‐like protein, H‐NS. J Bacteriol 177: 3589–3592 [DOI] [PMC free article] [PubMed] [Google Scholar]
- Kainth P, Gupta RS (2005) Signature proteins that are distinctive of alpha proteobacteria. BMC Genom 6: 94 [DOI] [PMC free article] [PubMed] [Google Scholar]
- Kozdon JB, Melfi MD, Luong K, Clark TA, Boitano M, Wang S, Zhou B, Gonzalez D, Collier J, Turner SW, Korlach J, Shapiro L, McAdams HH (2013) Global methylation state at base‐pair resolution of the Caulobacter genome throughout the cell cycle. Proc Natl Acad Sci USA 110: E4658–E4667 [DOI] [PMC free article] [PubMed] [Google Scholar]
- Lang B, Blot N, Bouffartigues E, Buckle M, Geertz M, Gualerzi CO, Mavathur R, Muskhelishvili G, Pon CL, Rimsky S, Stella S, Babu MM, Travers A (2007) High‐affinity DNA binding sites for H‐NS provide a molecular basis for selective silencing within proteobacterial genomes. Nucleic Acids Res 35: 6330–6337 [DOI] [PMC free article] [PubMed] [Google Scholar]
- Le TB, Imakaev MV, Mirny LA, Laub MT (2013) High‐resolution mapping of the spatial organization of a bacterial chromosome. Science 342: 731–734 [DOI] [PMC free article] [PubMed] [Google Scholar]
- Le TB, Laub MT (2016) Transcription rate and transcript length drive formation of chromosomal interaction domain boundaries. EMBO J 35: 1582–1595 [DOI] [PMC free article] [PubMed] [Google Scholar]
- Lu M, Campbell JL, Boye E, Kleckner N (1994) SeqA: a negative modulator of replication initiation in Escherichia coli . Cell 77: 413–426 [DOI] [PubMed] [Google Scholar]
- Lupas A, Van Dyke M, Stock J (1991) Predicting coiled coils from protein sequences. Science 252: 1162–1164 [DOI] [PubMed] [Google Scholar]
- Machanick P, Bailey TL (2011) MEME‐ChIP: motif analysis of large DNA datasets. Bioinformatics 27: 1696–1697 [DOI] [PMC free article] [PubMed] [Google Scholar]
- Mangan MW, Lucchini S, O'Croinin T, Fitzgerald S, Hinton JC, Dorman CJ (2011) Nucleoid‐associated protein HU controls three regulons that coordinate virulence, response to stress and general physiology in Salmonella enterica serovar Typhimurium. Microbiology 157: 1075–1087 [DOI] [PubMed] [Google Scholar]
- Marbouty M, Le Gall A, Cattoni DI, Cournac A, Koh A, Fiche JB, Mozziconacci J, Murray H, Koszul R, Nollmann M (2015) Condensin‐ and replication‐mediated bacterial chromosome folding and origin condensation revealed by Hi‐C and super‐resolution imaging. Mol Cell 59: 588–602 [DOI] [PubMed] [Google Scholar]
- McGrath PT, Lee H, Zhang L, Iniesta AA, Hottes AK, Tan MH, Hillson NJ, Hu P, Shapiro L, McAdams HH (2007) High‐throughput identification of transcription start sites, conserved promoter motifs and predicted regulons. Nat Biotechnol 25: 584–592 [DOI] [PubMed] [Google Scholar]
- Mercier R, Petit MA, Schbath S, Robin S, El Karoui M, Boccard F, Espeli O (2008) The MatP/matS site‐specific system organizes the terminus region of the Escherichia coli chromosome into a macrodomain. Cell 135: 475–485 [DOI] [PubMed] [Google Scholar]
- Modell JW, Hopkins AC, Laub MT (2011) A DNA damage checkpoint in Caulobacter crescentus inhibits cell division through a direct interaction with FtsW. Genes Dev 25: 1328–1343 [DOI] [PMC free article] [PubMed] [Google Scholar]
- Modell JW, Kambara TK, Perchuk BS, Laub MT (2014) A DNA damage‐induced, SOS‐independent checkpoint regulates cell division in Caulobacter crescentus . PLoS Biol 12: e1001977 [DOI] [PMC free article] [PubMed] [Google Scholar]
- Mohl DA, Gober JW (1997) Cell cycle‐dependent polar localization of chromosome partitioning proteins in Caulobacter crescentus . Cell 88: 675–684 [DOI] [PubMed] [Google Scholar]
- Montero Llopis P, Sliusarenko O, Heinritz J, Jacobs‐Wagner C (2012) In vivo biochemistry in bacterial cells using FRAP: insight into the translation cycle. Biophys J 103: 1848–1859 [DOI] [PMC free article] [PubMed] [Google Scholar]
- Moriya S, Tsujikawa E, Hassan AK, Asai K, Kodama T, Ogasawara N (1998) A Bacillus subtilis gene‐encoding protein homologous to eukaryotic SMC motor protein is necessary for chromosome partition. Mol Microbiol 29: 179–187 [DOI] [PubMed] [Google Scholar]
- Oberto J, Nabti S, Jooste V, Mignot H, Rouviere‐Yaniv J (2009) The HU regulon is composed of genes responding to anaerobiosis, acid stress, high osmolarity and SOS induction. PLoS ONE 4: e4367 [DOI] [PMC free article] [PubMed] [Google Scholar]
- Paintdakhi A, Parry B, Campos M, Irnov I, Elf J, Surovtsev I, Jacobs‐Wagner C (2016) Oufti: an integrated software package for high‐accuracy, high‐throughput quantitative microscopy analysis. Mol Microbiol 99: 767–777 [DOI] [PMC free article] [PubMed] [Google Scholar]
- Prieto AI, Kahramanoglou C, Ali RM, Fraser GM, Seshasayee AS, Luscombe NM (2012) Genomic analysis of DNA binding and gene regulation by homologous nucleoid‐associated proteins IHF and HU in Escherichia coli K12. Nucleic Acids Res 40: 3524–3537 [DOI] [PMC free article] [PubMed] [Google Scholar]
- Ricci DP, Melfi MD, Lasker K, Dill DL, McAdams HH, Shapiro L (2016) Cell cycle progression in Caulobacter requires a nucleoid‐associated protein with high AT sequence recognition. Proc Natl Acad Sci USA 113: E5952–E5961 [DOI] [PMC free article] [PubMed] [Google Scholar]
- Rigden DJ (2011) Ab initio modeling led annotation suggests nucleic acid binding function for many DUFs. OMICS 15: 431–438 [DOI] [PubMed] [Google Scholar]
- da Rocha RP, Paquola AC, Marques Mdo V, Menck CF, Galhardo RS (2008) Characterization of the SOS regulon of Caulobacter crescentus . J Bacteriol 190: 1209–1218 [DOI] [PMC free article] [PubMed] [Google Scholar]
- Sanchez‐Romero MA, Busby SJ, Dyer NP, Ott S, Millard AD, Grainger DC (2010) Dynamic distribution of SeqA protein across the chromosome of Escherichia coli K‐12. MBio 1: e00012–10 [DOI] [PMC free article] [PubMed] [Google Scholar]
- Schrader JM, Zhou B, Li GW, Lasker K, Childers WS, Williams B, Long T, Crosson S, McAdams HH, Weissman JS, Shapiro L (2014) The coding and noncoding architecture of the Caulobacter crescentus genome. PLoS Genet 10: e1004463 [DOI] [PMC free article] [PubMed] [Google Scholar]
- Schwartz MA, Shapiro L (2011) An SMC ATPase mutant disrupts chromosome segregation in Caulobacter . Mol Microbiol 82: 1359–1374 [DOI] [PMC free article] [PubMed] [Google Scholar]
- Siam R, Brassinga AK, Marczynski GT (2003) A dual binding site for integration host factor and the response regulator CtrA inside the Caulobacter crescentus replication origin. J Bacteriol 185: 5563–5572 [DOI] [PMC free article] [PubMed] [Google Scholar]
- Sliusarenko O, Heinritz J, Emonet T, Jacobs‐Wagner C (2011) High‐throughput, subpixel precision analysis of bacterial morphogenesis and intracellular spatio‐temporal dynamics. Mol Microbiol 80: 612–627 [DOI] [PMC free article] [PubMed] [Google Scholar]
- Su'etsugu M, Errington J (2011) The replicase sliding clamp dynamically accumulates behind progressing replication forks in Bacillus subtilis cells. Mol Cell 41: 720–732 [DOI] [PubMed] [Google Scholar]
- Sullivan NL, Marquis KA, Rudner DZ (2009) Recruitment of SMC by ParB‐parS organizes the origin region and promotes efficient chromosome segregation. Cell 137: 697–707 [DOI] [PMC free article] [PubMed] [Google Scholar]
- Teytelman L, Thurtle DM, Rine J, van Oudenaarden A (2013) Highly expressed loci are vulnerable to misleading ChIP localization of multiple unrelated proteins. Proc Natl Acad Sci USA 110: 18602–18607 [DOI] [PMC free article] [PubMed] [Google Scholar]
- Thanbichler M, Shapiro L (2006) MipZ, a spatial regulator coordinating chromosome segregation with cell division in Caulobacter . Cell 126: 147–162 [DOI] [PubMed] [Google Scholar]
- Thanbichler M, Iniesta AA, Shapiro L (2007) A comprehensive set of plasmids for vanillate‐ and xylose‐inducible gene expression in Caulobacter crescentus . Nucleic Acids Res 35: e137 [DOI] [PMC free article] [PubMed] [Google Scholar]
- Tonthat NK, Arold ST, Pickering BF, Van Dyke MW, Liang S, Lu Y, Beuria TK, Margolin W, Schumacher MA (2011) Molecular mechanism by which the nucleoid occlusion factor, SlmA, keeps cytokinesis in check. EMBO J 30: 154–164 [DOI] [PMC free article] [PubMed] [Google Scholar]
- Toro E, Hong SH, McAdams HH, Shapiro L (2008) Caulobacter requires a dedicated mechanism to initiate chromosome segregation. Proc Natl Acad Sci USA 105: 15435–15440 [DOI] [PMC free article] [PubMed] [Google Scholar]
- Viollier PH, Thanbichler M, McGrath PT, West L, Meewan M, McAdams HH, Shapiro L (2004) Rapid and sequential movement of individual chromosomal loci to specific subcellular locations during bacterial DNA replication. Proc Natl Acad Sci USA 101: 9257–9262 [DOI] [PMC free article] [PubMed] [Google Scholar]
- Waldminghaus T, Skarstad K (2009) The Escherichia coli SeqA protein. Plasmid 61: 141–150 [DOI] [PubMed] [Google Scholar]
- Waldminghaus T, Weigel C, Skarstad K (2012) Replication fork movement and methylation govern SeqA binding to the Escherichia coli chromosome. Nucleic Acids Res 40: 5465–5476 [DOI] [PMC free article] [PubMed] [Google Scholar]
- Wang SC, Shapiro L (2004) The topoisomerase IV ParC subunit colocalizes with the Caulobacter replisome and is required for polar localization of replication origins. Proc Natl Acad Sci USA 101: 9251–9256 [DOI] [PMC free article] [PubMed] [Google Scholar]
- Wang L, Brown SJ (2006) BindN: a web‐based tool for efficient prediction of DNA and RNA binding sites in amino acid sequences. Nucleic Acids Res 34: W243–W248 [DOI] [PMC free article] [PubMed] [Google Scholar]
- Wang X, Montero Llopis P, Rudner DZ (2013) Organization and segregation of bacterial chromosomes. Nat Rev Genet 14: 191–203 [DOI] [PMC free article] [PubMed] [Google Scholar]
- Wang X, Le TB, Lajoie BR, Dekker J, Laub MT, Rudner DZ (2015) Condensin promotes the juxtaposition of DNA flanking its loading site in Bacillus subtilis . Genes Dev 29: 1661–1675 [DOI] [PMC free article] [PubMed] [Google Scholar]
- Ward D, Newton A (1997) Requirement of topoisomerase IV parC and parE genes for cell cycle progression and developmental regulation in Caulobacter crescentus . Mol Microbiol 26: 897–910 [DOI] [PubMed] [Google Scholar]
- Wu LJ, Ishikawa S, Kawai Y, Oshima T, Ogasawara N, Errington J (2009) Noc protein binds to specific DNA sequences to coordinate cell division with chromosome segregation. EMBO J 28: 1940–1952 [DOI] [PMC free article] [PubMed] [Google Scholar]
- Yamanaka K, Ogura T, Niki H, Hiraga S (1996) Identification of two new genes, mukE and mukF, involved in chromosome partitioning in Escherichia coli . Mol Gen Genet 250: 241–251 [DOI] [PubMed] [Google Scholar]
- Zweiger G, Marczynski G, Shapiro L (1994) A Caulobacter DNA methyltransferase that functions only in the predivisional cell. J Mol Biol 235: 472–485 [DOI] [PubMed] [Google Scholar]
Associated Data
This section collects any data citations, data availability statements, or supplementary materials included in this article.
Supplementary Materials
Appendix
Expanded View Figures PDF
Movie EV1
Dataset EV1
Code EV1
Code EV2
Code EV3
Review Process File