Abstract
A gene encoding a fluorescent protein from the stony coral Lobophyllia hemprichii has been cloned in Escherichia coli and characterized by biochemical and biophysical methods. The protein, which we named EosFP, emits strong green fluorescence (516 nm) that changes to red (581 nm) upon near-UV irradiation at ≈390 nm because of a photo-induced modification involving a break in the peptide backbone next to the chromophore. Single-molecule fluorescence spectroscopy shows that the wild type of EosFP is tetrameric, with strong Förster resonance coupling among the individual fluorophores. We succeeded in breaking up the tetramer into AB and AC subunit dimers by introducing the single point mutations V123T and T158H, respectively, and the combination of both mutations yielded functional monomers. Fusion constructs with a variety of proteins were prepared and expressed in human cells, showing that normal biological functions were retained. The possibility to locally change the emission wavelength by focused UV light makes EosFP a superb marker for experiments aimed at tracking the movements of biomolecules within the living cell.
In recent years, fluorescent protein (FP) technology has provided powerful new tools for cell biology. FPs can be fused to essentially all proteins of interest, enabling real-time monitoring of biochemical processes in living cells, including protein expression, localization, and movement (1–3). Based on GFP, which is from the luminescent jellyfish Aequorea victoria, a variety of mutants with shifted emission wavelengths and enhanced fluorescence were developed that provide researchers with fluorescent markers in many different hues. The FP toolbox has been greatly extended since the discovery of GFP homologs in nonbioluminescent anthozoa (4–11). Some of the anthozoan FPs exhibit properties that are not found in GFP derivatives, including fluorescence emission in the red spectral range.
The tracking of objects within live cells is an important application in cell biology (12) and can be accomplished by using FP markers that can be activated locally by light. For example, irradiation of the GFP mutant T203H with intense blue light at 413 nm causes an increase of the green emission (excited at 488 nm) by 2 orders of magnitude (12). The red fluorescence of kindling FP 1, a mutant of asCP (A148G), can be increased by a factor of 30 by using green light at 532 nm (13). The FP Kaede, recently isolated from the scleractinian coral Trachyphyllia geoffroyi (14), appears particularly powerful for localized fluorescent marking. Instead of enhancing the emission by photoactivation, Kaede can be irreversibly converted from a green- to a red-emitting form by using near-UV light.
Here we describe the cloning, characterization, and genetic engineering of an FP from the scleractinian coral Lobophyllia hemprichii that irreversibly switches its peak emission from 516 to 581 nm upon UV irradiation. We have christened this protein EosFP after the goddess of dawn in Greek mythology. By introducing mutations in the subunit interfaces, we have created dimeric and monomeric forms with essentially unchanged spectroscopic properties. We also present applications of EosFP as a fusion marker protein.
Materials and Methods
Cloning, Mutagenesis, Protein Expression, and Purification. A cDNA library of L. hemprichii was constructed and expressed in Escherichia coli (XLOLR) (8, 9). During the screening of bacterial colonies for fluorescent clones under the fluorescence microscope, several colonies changed color from green to orange under 365-nm irradiation. The coding cDNA fragment was then subcloned into pQE32 (Qiagen, Hilden, Germany). Site-directed mutagenesis was performed by using the QuikChange Site-Directed Mutagenesis kit (Stratagene). The resulting clones were sequenced by a commercial provider (Microsynth, Balgach, Switzerland). All proteins were expressed in E. coli (M15 pREP4) and purified as described in ref. 9.
Spectroscopic Characterization and SDS/PAGE Analysis. Optical absorption and fluorescence properties were determined as reported in ref. 9. To examine whether photoconversion was accompanied by backbone cleavage, as was shown for Kaede (15), we slowly converted diluted 3-ml samples in the fluorometer by using 400-nm irradiation. The sample in the quartz cuvette was gently stirred to ensure homogeneous exposure to light, and the emission at 581 nm was measured every 2 min. Five 20-μl aliquots were removed during irradiation and analyzed by SDS/PAGE with 15% polyacrylamide gels. After silver staining, the gel was imaged in a Bio-Rad MultiImager and analyzed with multianalyst software. Alternatively, proteins were transferred to a nitrocellulose membrane (NC 45, Serva) after electrophoresis by the semidry blotting procedure described by Khyse-Andersen (16). The membrane was imaged with UV light (366 nm) and a digital camera (Kaiser Fototechnik, Buchen, Germany) equipped with a standard ethidium bromide filter.
Single-Molecule Microscopy. We used 488-nm light from an Ar+/Kr+ ion laser (modified model 164, Spectra-Physics) to excite the green and red forms of EosFP. We passed 800-nm light from an Ar+-laser-pumped Ti:sapphire laser (Innova Sabre/Mira 900, Coherent, Santa Clara, CA) through a frequency doubler (TP1B, Uniwave Technologies, Chatsworth, CA) to generate 400-nm light for green–red photoconversion. The two light sources were combined with a cold mirror (M43–845, Edmund Optics, Barrington, NJ) before entering a single-mode quartz fiber (QSMJ 320, OZ Optics, Carp, Canada) through which the light was fed into a confocal microscope of our own design based on a Zeiss inverted Axiovert 35 microscope with two-channel fluorescence detection and a piezoelectric sample scanning stage (9, 17). For EosFP, we used an excitation dichroic mirror Q495LP (AHF, Tübingen, Germany), green–red beam-splitting dichroic 560 DCXR (AHF), and two bandpass filters, HQ 535/70 and HQ 610/75 (AHF).
For single-molecule microscopy, the EosFP molecules were biotinylated (biotin-XX, sulfosuccinimidyl ester, Molecular Probes) and attached by means of a streptavidin–biotin linkage to glass coverslips coated with biotinylated BSA (BSA–biotin, Sigma–Aldrich) by using standard procedures.
For determining the pH dependence of the photoconversion rate, dense layers of surface-bound EosFP were exposed to 400-nm light. The increase of the red fluorescence with time was measured and analyzed to obtain the rates.
Eukaryotic Expression and Imaging. Vector constructs, transfection, and eukaryotic expression are described in Supporting Materials and Methods: Vector Constructs and Eukaryotic Expression, which is published as supporting information on the PNAS web site.
Cells were imaged by using our home-built microscope with single-molecule sensitivity or a commercial setup (DM IRB, Leica) equipped with a digital camera (C4742, Hamamatsu, Ichinocho, Japan), a 100-W mercury lamp, a BP430/50 excitation filter, and a 425 DCLP beam splitter (AHF) for photoconversion. Photoconversion can also be induced by using a standard 4′,6-diamidino-2-phenylindole (DAPI) filter set. Green and red fluorescence was imaged by using FITC and tetramethylrhodamine B isothiocyanate (TRITC) filter sets.
Results and Discussion
Primary Structure. The FP from L. hemprichii consists of 226 amino acids with a calculated molecular mass of 25.8 kDa and a pI of 6.9. The sequence of EosFP is closest to that of Kaede (84% identical residues) from T. geoffroyi (14). (A sequence alignment is published as Fig. 7, which is published as supporting information on the PNAS web site.) Light-induced green-to-red photoconversion appears to depend on the presence of a histidine in the first position of the tripeptide HYG from which the chromophore is formed. In EosFP, substitution of this residue with M, S, T, and L yielded brightly green FPs that were no longer convertible.
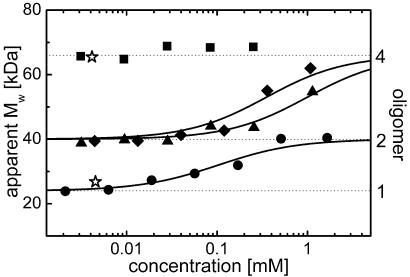
Monomerization of EosFP. Upon expression in E. coli, the wild-type form of EosFP appears as a tetramer in size-exclusion chromatography (Fig. 1), and its apparent molecular mass (MW), of ≈66 kDa, is identical to that of DsRed, which is known to be tetrameric (18, 19). Homology modeling of the interfaces of DsRed; its monomerized version, mRFP1; and EosFP guided our mutation strategy. In DsRed, the interface between subunits A and B displays hydrophobic interactions among amino acids V127, I180, and V96. In the course of DsRed monomerization, the AB interface was made more hydrophilic by introducing the polar mutations V127T and I180T. EosFP has already polar threonine and serine amino acids at the positions corresponding to I180 and V96. To render this interface even more hydrophilic, we introduced the additional substitution V123T. A homologous mutation was also introduced recently in the monomerization of Azami green (20). Size-exclusion chromatography revealed a MW of ≈40 kDa for this variant at 10 μM concentration of monomer subunits, which is between the MW values for tetrameric DsRed and monomeric GFP (Fig. 1), suggesting that this mutant is indeed an AC dimer. We will refer to this mutant as dimer 1 EosFP (d1EosFP). The MW increase toward higher concentrations is consistent with the presence of a dimer–tetramer equilibrium, with a Kd of 0.35 mM (Fig. 1).
Fig. 1.
Concentration dependence of the apparent MW in size-exclusion chromatography experiments on EosFP and mutants. Fitted binding isotherms, calculated by assuming saturation levels at 40 and 66 kDa, are shown as solid lines. Data for the monomeric EGFP and tetrameric DsRed are included for comparison (⋆). ▪, wild type; ♦, d1EosFP; ▴, d2EosFP; •, mEosFP.
In DsRed, the AC interface contains a positively charged R149 interacting with A164 and L174. To break up this interface, a second arginine was introduced by the substitution A164R (18). In EosFP, residues homologous to R149 and L174 are already positively charged (R170 and K145, respectively). This observation suggests that the interactions between the A and C subunits are weaker in EosFP than in DsRed. For another GFP-like protein, RTMS5 (21), F158 was replaced by histidine to break up the AC interface. We introduced the corresponding mutation in EosFP (T158H) and obtained a variant with the same MW as d1EosFP; hence, it is also dimeric (at 10 μM) and will be denoted as dimer 2 EosFP (d2EosFP). Again, an increase of MW toward higher concentrations indicates a shift of the equilibrium to a tetrameric form, with Kd = 1.0 mM. By combining the two mutations, V123T and T158H, both the AB and AC interfaces were broken up simultaneously, yielding a monomeric variant (mEosFP) with an MW of 25 kDa, which is essentially identical to that of monomeric enhanced GFP (EGFP) (Fig. 1). The increase of MW with concentration reflects a tendency to form dimers at higher concentrations. The observed Kd of 0.1 mM is comparable with that of GFP and its variants (22).
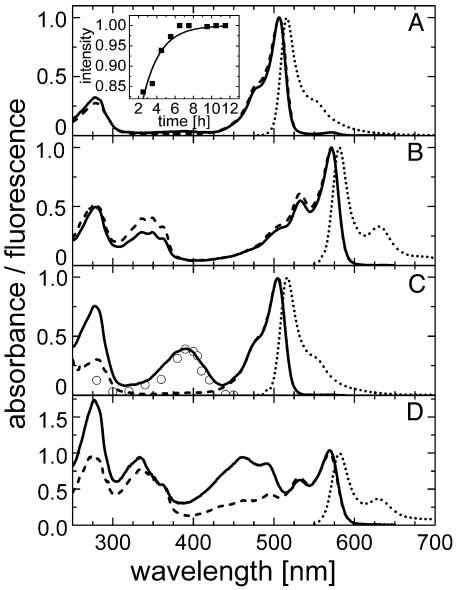
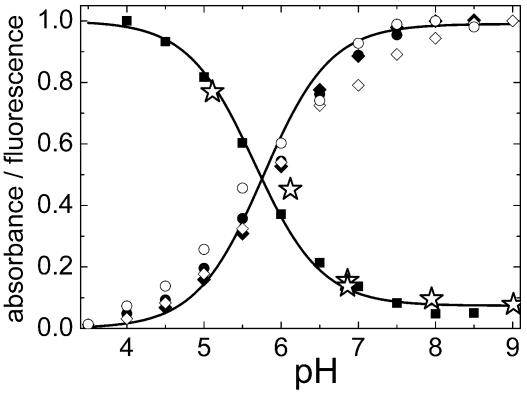
Spectroscopic Characterization. Upon expression in E. coli, EosFP matures to a green-emitting form with a time dependence that can be described by an exponential with a half-life of 1.3 h (Fig. 2A Inset). The absorption spectrum at pH 7 shows a prominent band at 506 nm, with a shoulder at 482 nm (Fig. 2A). The extinction coefficient of the monomeric subunit was determined as 72,000 M–1·cm–1. With decreasing pH, a new band at 390 nm increases at the expense of the 506-nm absorption (Fig. 2C). The pH dependences of the absorbances at 506 and 390 nm can be well fitted by using a Henderson–Hasselbalch relation with pK = 5.8 ± 0.1, suggesting that a single protonation governs the observed spectral changes (Fig. 3). The presence of a crisp isosbestic point at 432 nm also supports an interconversion between two species (data not shown). The band at 390 nm is missing in the excitation spectrum, as is clearly seen in the spectrum at pH 5.5 (Fig. 2C), implying that the protonated species does not fluoresce. For EGFP, similar spectral changes with pH have been observed, with an identical pK of 5.8 (23). They have been attributed to protonation of the hydroxyl group of the tyrosine residue in the chromophore. However, in contrast to EosFP, excitation of the protonated form leads to fluorescence emission in GFP, involving an excited-state deprotonation of the fluorophore (24, 25). In Fig. 2, the absorption at 280 nm is due to aromatic amino acids; they efficiently transfer their excitation energy to the green chromophore. The green fluorescence emission peaks at 516 nm, with a quantum yield of 0.7. The pH dependence of the emission tracks the dependence of the absorption (Fig. 3). This behavior is expected if only the deprotonated species fluoresces with a quantum yield that is insensitive to pH.
Fig. 2.
Spectra of the green and red states of EosFP at pH 7 and pH 5.5. Solid lines, absorbance; dashed lines, excitation; dotted lines, emission spectra. (A and C) Green species at pH 7 (A) and pH 5.5 (C). Excitation (emission) spectra were measured with emission (excitation) set to 520 (490) nm. ○, conversion yields scaled to the absorbance. (Inset) In vitro chromophore maturation at 27°C determined from the absorbance at 506 nm (solid line, exponential fit). (B and D) Red species at pH 7 (B) and pH 5.5 (D). Excitation (emission) spectra were measured with emission (excitation) set to 590 (560) nm.
Fig. 3.
Normalized pH dependencies of absorbance, emission, and photoconversion rate. All data follow a Henderson–Hasselbalch relation with pK of 5.8 ± 0.1 (solid lines). Green species: •, absorbance at 506 nm; ▪, absorbance at 390 nm; ○, fluorescence at 516 nm; ⋆, relative green-to-red conversion rate. Red species: ♦, absorbance at 572 nm; ⋄, fluorescence at 581 nm.
Irradiation with near-UV light at ≈390 nm causes conversion of the green- to the red-emitting form (Fig. 2 B and D). The maximum of the red absorption and excitation is located at 571 nm, and a vibronic sideband is clearly visible at 533 nm. The extinction coefficient per monomer of the red species was determined as 41,000 M–1·cm–1. In addition to the 280-nm band in the near-UV, there is a set of absorption bands of ≈350 nm arising from excitations into higher electronic states. The red fluorescence peaks at 581 nm, and a vibronic is located at 629 nm. The quantum yield of the red-emitting form is 0.55. The spectroscopic data are compiled in Table 1 for wild-type EosFP and its variants. It is evident from these data that dimerization or monomerization does not have detrimental effects on the spectral properties of this protein.
Table 1. Properties of EosFP and mutants.
| Protein | λmax, green ex/em, nm | QYgreen | εgreen, M-1·cm-1 | λmax,red ex/em, nm | QYred | εred, M-1·cm-1 | ΦB × 10-5 |
|---|---|---|---|---|---|---|---|
| Wild-type EosFP | 506/516 | 0.70 ± 0.02 | 72,000 | 571/581 | 0.55 ± 0.03 | 41,000 | — |
| d1EosFP (V123T) | 505/516 | 0.68 ± 0.03 | 74,800 | 571/581 | 0.62 ± 0.03 | 40,000 | 3.2 ± 0.2 |
| d2EosFP (T158H) | 506/516 | 0.66 ± 0.03 | 84,000 | 569/581 | 0.60 ± 0.03 | 33,000 | 2.4 ± 0.2 |
| mEosFP | 505/516 | 0.64 ± 0.03 | 67,200 | 569/581 | 0.62 ± 0.03 | 37,000 | 3.0 ± 0.1 |
All data were determined at pH 7.0. Bleaching yields are given for the green form. ex, Excitation; em, emission; QY, quantum yield.
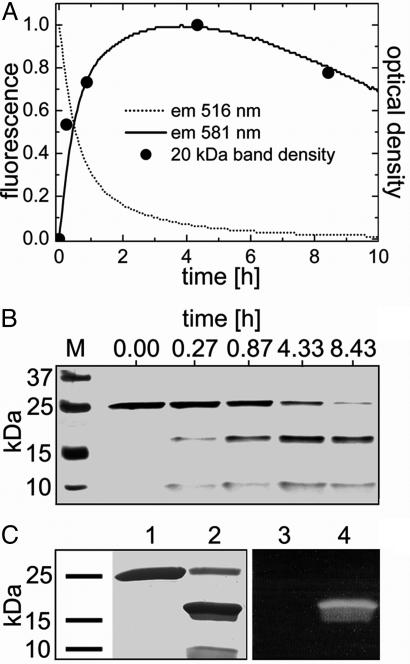
Green-to-Red Photoconversion. The wavelength dependence of the green-to-red conversion yield was determined from the red emission after irradiating green samples (pH 7) at several wavelengths for 3 min in the fluorometer. Fig. 2C shows that the yield closely tracks the 390-nm absorbance band of the green species. Moreover, the pH dependence of the photoconversion rate is proportional to the fraction of protonated EosFP species (Fig. 3). These observations suggest that the protonated form of the chromophore is crucial for photoconversion; excited-state proton transfer is likely involved in the mechanism. Fig. 4 shows results from an experiment in which SDS/PAGE and spectroscopic analysis were combined. While irradiating an EosFP sample in the fluorometer for 10 h with 400-nm light, we observed the disappearance of the green species with concomitant appearance of the red form (Fig. 4A). The increase in the red species was accompanied by the appearance of two peptide fragments on the gel, with apparent MW values of ≈20 and ≈8 kDa (Fig. 4 A and B), whereas the band at ≈25 kDa representing the full-length peptide decreased. Apparently, green-to-red conversion involves dissociation of the peptide backbone, as was also observed for Kaede (14, 15). The 20-kDa band contains the fluorophore, as seen from its fluorescence after transfer to a nitrocellulose membrane (Fig. 4C). For the 8-kDa fragment, matrix-assisted laser desorption ionization–time-of-flight analysis yielded a mass of 8,222 ± 2 Da. This result implies that the peptide break occurs right in front of the fluorophore, between F61 and H62, as is also the case for Kaede (15). Therefore, we assume that the chromophore is also a 2-[(1E)-2-(5-imidazolyl)ethenyl]-4-(p-hydroxybenzylidene)-5-imidazolinone.
Fig. 4.
Time dependence of green-to-red photoconversion monitored by a combination of SDS/PAGE and fluorescence. (A) Fluorescence from green (dotted line) and red (solid line) species. •, Densities of the 20-kDa band in B. (B) SDS gel of marker bands (lane M) and EosFP protein after irradiation for a certain time, showing the correlation between the appearance of the 20- and 8-kDa bands and the red fluorescence. (C) Ponceau staining of the green (lane 1) and red (lane 2) form of EosFP after SDS/PAGE separation and transfer to a nitrocellulose membrane. With 366-nm excitation, red fluorescence is observed for the 20-kDa band (lane 4) but not for the 25-kDa band (lane 3).
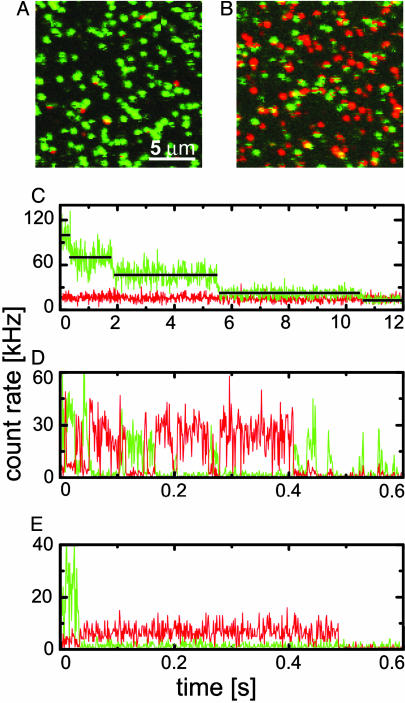
Single-Molecule Experiments. Fig. 5A shows a confocal scan image of wild-type EosFP molecules immobilized on a BSA surface, taken with 4-μW excitation at 488 nm. Each of the green spots represents a tetramer, which becomes apparent from the emission time traces measured on single spots (Fig. 5C), which display a four-step decay because of sequential bleaching of the fluorophores. Dissociation of the EosFP tetramers is apparently slower than the time scale of the experiment. DsRed was also tetrameric in single-molecule studies (26). By contrast, eqFP611 was monomeric under the conditions of single-molecule experiments on immobilized preparations (9, 17).
Fig. 5.
Single-molecule spectroscopy of EosFP immobilized on a BSA surface. Confocal scan images were taken with 488-nm excitation (A) and additional 400-nm irradiation (B). (C) Fluorescence emission traces from an individual EosFP tetramer (488-nm excitation) showing sequential bleaching of the four subunits. (D) An individual EosFP tetramer (488-nm excitation plus 400-nm irradiation) showing green-to-red switching and sequential bleaching. (E) mEosFP (488-nm excitation plus 400-nm irradiation) showing single-step green-to-red conversion and bleaching.
Whereas only very few red spots are visible in Fig. 5A, the majority of the spots turned red when they were irradiated simultaneously with ≈4 μW at 488 nm and ≈1 μW at 400 nm (Fig. 5B). Time traces taken with 400-nm irradiation show extensive switching between green and red emission (Fig. 5D). Whenever the red emission turns on, the green emission is essentially switched off, indicating efficient fluorescence energy transfer. Green-to-red photoconversion of one subunit in the tetramer thus causes overall red emission of the tetramer until the red subunit photobleaches. Afterward, the green emission usually switches back on until the next subunit undergoes photoconversion. Apart from extended periods of red emission, we also observed short spikes of red emission on the millisecond time scale after which green emission resumed, which suggests that the red chromophore may form transiently and then revert back to the green species. Fig. 5E presents a typical time trace of mEosFP, showing simple one-step conversion from a green- to red-emitting species. Interestingly, the dimeric mutants d1EosFP and d2EosFP exhibit the same behavior, implying that they dissociate into monomers when immobilized on a surface. From the time traces of the green emission from several hundred single proteins, we have assembled histograms of the total amounts of photons emitted before photobleaching (see Fig. 8, which is published as supporting information on the PNAS web site). These histograms can be fitted very well with single exponentials, yielding the average number of emitted photons. Estimating a detection efficiency of ≈0.04 for our single-molecule setup, we have calculated the bleaching yields. The resulting ΦB values of ≈3 × 10⁻⁵ (Table 1) are close to the value of 1.9 × 10⁻⁵ determined for surface-immobilized eqFP611 (17).
In Vivo Marker Applications. In many cell biology applications, the fluorescent marking of proteins of interest is pursued by fusing them to FPs. In the fusion construct, both partners must retain their functional integrity under the desired experimental conditions. Especially, the tendency of anthozoan FPs to form tetramers and aggregate can be detrimental for many applications (27, 28). Functional expression of EosFP and its dimeric variants works very well in mammalian cells at 37°C without any signs of aggregation (see Fig. 9, which is published as supporting information on the PNAS web site); only mEosFP is limited to temperatures below 30°C.
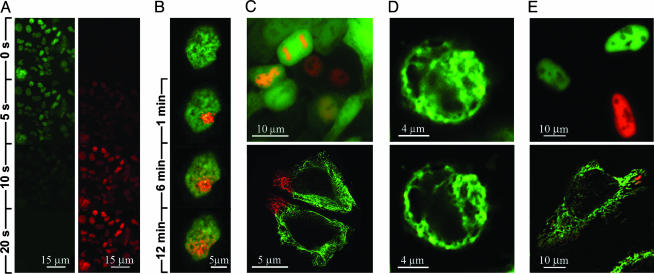
Fusion constructs were prepared with the intracellular domain of mouse Notch-1 protein (mNotch-1-IC–EosFP) and the recombination signal-binding protein (RBP-2N–d2EosFP), a splice variant of RBP-Jκ (29). Both proteins are localized in the nucleus. mNotch-1-IC acts as a strong transcriptional activator by interacting with DNA-bound RBP-2N (30). Therefore, this system offers the opportunity to test whether complex biological functions are retained by the fusion constructs, including protein–protein interaction, DNA binding, and transactivation. A stable HEK293 cell line expressing mNotch1-IC–EosFP fusion protein was established. No toxic effects from the marker protein were noticed. The fluorescence showed the same nuclear localization pattern as reported previously for mNotch1-IC fused to EGFP (31). Within 20 sec, the fluorescent construct was completely converted by irradiation with 400-nm light in the Leica microscope (Fig. 6A). In fluorescence-activated cell sorter studies, the red fluorescence remained detectable in dividing cells for >9 days (data not shown). Fig. 6B shows the fluorescence of RBP-2N–d2EosFP in the nucleus of a HEK293 cell. By exposure to tightly focused 400-nm light with a power density of 0.5 kW/cm2 for 0.5 sec, local photoconversion was achieved within micrometer-sized volumes. The RBP-2N–DNA complex tagged by green-to-red conversion discloses a surprising dynamic: After 12 min, the red fluorescence is almost evenly distributed throughout the nucleus.
Fig. 6.
Cellular applications of the green-to-red photoconvertible protein EosFP. (A) The fusion protein mNotch-1-IC–EosFP, localized in the nuclei of stably transfected HEK293 cells, is converted from green to red under the microscope. (B) Tracking of movement of the fusion protein RBP-2N–d2EosFP in the nucleus by localized photoconversion, observed after 0.5-sec irradiating with 400-nm light (1 μW) in the single-molecule setup. (C) HEK293 cells cotransfected with cDNA of EGFP and RBP-2N–d2EosFP. Chromatin association of RBP-2N is clearly visible after photoconversion. (Upper) EGFP highlights the cell morphology. (Lower) HeLa cells expressing cytokeratin 18-d2EosFP, local conversion. (D) HEK293 cell expressing cytokeratin 18-d2EosFP. (Upper) One-photon excitation at 488 nm. (Lower) Improved image quality with two-photon excitation by 808-nm Ti:sapphire laser pulses. (E) Functional expression at 28°C and local photoconversion of mEosFP fusions in HeLa cells. (Upper) Nuclear localization of mNotch-1-IC–mEosFP. (Lower) Mitochondrial localization of mt-mEosFP.
Tight association of RBP-2N with chromatin is impressively illustrated when imaging cells during different stages of their cell cycle. Fig. 6C Upper shows an example of coexpression of RBP-2N–d2EosFP together with EGFP in HEK293 in a double-labeling experiment. After complete photoconversion, nuclear localization of RBP-2N–d2EosFP in interphase cells and chromosome association during mitosis are clearly visible.
The interaction of RBP-2N-d2EosFP with mNotch-1-IC was tested in vitro by pull-down assays with GST-mNotch-1-IC (see Fig. 10, which is published as supporting information on the PNAS web site). Evidently, the C-terminal fusion of RBP-2N with d2EosFP does not interfere with specific mNotch-1-IC interaction.
To investigate the ability of RBP-2N–d2EosFP to form DNA-binding complexes, we performed electrophoretic mobility shift assays by using in vitro-translated RBP-2N and RBP-2N–d2EosFP and the 32P-labeled double-stranded oligonucleotide FO233 (32) (see Fig. 11, which is published as supporting information on the PNAS web site). The results prove that the fusion protein is fully capable of binding to specific sequence motifs.
Cotransfection of HeLa cells with mNotch-1-IC–EosFP and the mNotch-1-IC-responsive promoter construct HES-1-LUC (32) resulted in a strong increase of promoter activity, comparable with that of mNotch-1-IC–EGFP and unlabeled mNotch-1-IC (see Fig. 12, which is published as supporting information on the PNAS web site). Thus, the C-terminal fusion with EosFP does not interfere with the transactivation function of mNotch-1-IC.
The viability of d2EosFP as a locally photoconvertible marker was also demonstrated in a C-terminal fusion with cytokeratin 18. Fig. 6C Lower shows the fusion protein exclusively localized in the cytoplasm of HeLa cells, where it highlights parts of the cytoskeleton. Compared with one-photon excitation at 488 nm (Fig. 6D Upper), an improved resolution is observed with two-photon excitation at 808 nm (Fig. 6D Lower) when imaging a HEK293 cell expressing cytokeratin 18-d2EosFP. Expression of monomeric mEosFP is shown in Fig. 6E for fusion constructs mNotch-1-IC–mEosFP (Fig. 6D Upper) and the mitochondrial targeting sequence from subunit VIII of cytochrome c oxidase (mt-mEosFP; Fig. 6D Lower).
Conclusions
We have cloned EosFP, an anthozoan green-to-red photoconverting FP, and performed its biochemical and spectroscopic characterization. We have also created and characterized dimeric and monomeric mutants with uncompromised spectral properties and verified that fusion constructs with other proteins are indeed functional. The relative ease with which FPs from scleractinian corals have been converted into monomers (this work and refs. 20 and 21) suggests that FPs from this taxon should be given particular attention for the development of functional, monomeric anthozoan FPs.
Supplementary Material
Acknowledgments
We thank Simone Kredel and Uwe Theilen for skillful technical assistance and Dr. Markus Wunderlin for the matrix-assisted laser desorption ionization–time-of-flight analysis. This work was funded by Deutsche Forschungsgemeinschaft Grants GRK 328 and SFB 569 (to G.U.N.), the Fonds der Chemischen Industrie (to G.U.N.), and Landesstiftung Baden-Württemberg Elite Postdoctoral Program (to J.W.).
Author contributions: J.W., F.O., K.-D.S., and G.U.N. designed research; J.W., S.I., F.O., F.S., C.R., and G.U.N. performed research; A.S. contributed new reagents/analytic tools; J.W., S.I., F.O., F.S., C.R., and G.U.N. analyzed data; and J.W. and G.U.N. wrote the paper.
This paper was submitted directly (Track II) to the PNAS office.
Abbreviations: FP, fluorescent protein; EGFP, enhanced GFP; d1EosFP, dimer 1 EosFP; d2EosFP, dimer 2 EosFP, mEosFP, monomeric EosFP; RBP, recombination signal-binding protein; mNotch, mouse Notch; MW, molecular mass.
Data deposition: The sequence reported in this paper has been deposited in the GenBank database (accession no. AY765217).
References
- 1.Prasher, D. C., Eckenrode, V. K., Ward, W. W., Prendergast, F. G. & Cormier, M. J. (1992) Gene 111, 229–233. [DOI] [PubMed] [Google Scholar]
- 2.Chalfie, M., Tu, Y., Euskirchen, G., Ward, W. W. & Prasher, D. C. (1994) Science 263, 802–805. [DOI] [PubMed] [Google Scholar]
- 3.Tsien, R. Y. (1998) Annu. Rev. Biochem. 67, 509–544. [DOI] [PubMed] [Google Scholar]
- 4.Wiedenmann, J., Röcker, C. & Funke, W. (1999) in Verhandlungen der Gesellschaft für Ökologie, ed. Pfadenhauer, J. (Springer, Heidelberg), Vol. 29, pp. 497–503. [Google Scholar]
- 5.Wiedenmann, J. (1997) in Offenlegungsschrift DE 197 18 640 A1 (German Patent and Trade Mark Office, Munich), pp. 1–18.
- 6.Matz, M. V., Fradkov, A. F., Labas, Y. A., Savitsky, A. P., Zaraisky, A. G., Markelov, M. L. & Lukyanov, S. A. (1999) Nat. Biotechnol. 17, 969–973. [DOI] [PubMed] [Google Scholar]
- 7.Fradkov, A. F., Chen, Y., Ding, L., Barsova, E. V., Matz, M. V. & Lukyanov, S. A. (2000) FEBS Lett. 479, 127–130. [DOI] [PubMed] [Google Scholar]
- 8.Wiedenmann, J., Elke, C., Spindler, K. D. & Funke, W. (2000) Proc. Natl. Acad. Sci. USA 97, 14091–14096. [DOI] [PMC free article] [PubMed] [Google Scholar]
- 9.Wiedenmann, J., Schenk, A., Röcker, C., Girod, A., Spindler, K. D. & Nienhaus, G. U. (2002) Proc. Natl. Acad. Sci. USA 99, 11646–11651. [DOI] [PMC free article] [PubMed] [Google Scholar]
- 10.Wiedenmann, J., Ivanchenko, S., Oswald, F. & Nienhaus, G. U. (2004) Mar. Biotechnol. 6, 270–277. [DOI] [PubMed] [Google Scholar]
- 11.Shagin, D. A., Barsova, E. V., Yanushevich, Y. G., Fradkov, A. F., Lukyanov, K. A., Labas, Y. A., Semenova, T. N., Ugalde, J. A., Meyers, A., Nunez, J. M., et al. (2004) Mol. Biol. Evol. 21, 841–850. [DOI] [PubMed] [Google Scholar]
- 12.Patterson, G. H. & Lippincott-Schwartz, J. (2002) Science 297, 1873–1877. [DOI] [PubMed] [Google Scholar]
- 13.Chudakov, D. M., Belousov, V. V., Zaraisky, A. G., Novoselov, V. V., Staroverov, D. B., Zorov, D. B., Lukyanov, S. & Lukyanov, K. A. (2003) Nat. Biotechnol. 21, 191–194. [DOI] [PubMed] [Google Scholar]
- 14.Ando, R., Hama, H., Yamamoto-Hino, M., Mizuno, H. & Miyawaki, A. (2002) Proc. Natl. Acad. Sci. USA 99, 12651–12656. [DOI] [PMC free article] [PubMed] [Google Scholar]
- 15.Mizuno, H., Mal, T. K., Tong, K. I., Ando, R., Furuta, T., Ikura, M. & Miyawaki, A. (2003) Mol. Cell 12, 1051–1058. [DOI] [PubMed] [Google Scholar]
- 16.Khyse-Andersen, J. (1984) J. Biochem. Biophys. Meth. 10, 203–209. [DOI] [PubMed] [Google Scholar]
- 17.Schenk, A., Ivanchenko, S., Röcker, C., Wiedenmann, J. & Nienhaus, G. U. (2004) Biophys. J. 86, 384–394. [DOI] [PMC free article] [PubMed] [Google Scholar]
- 18.Campbell, R. E., Tour, O., Palmer, A. E., Steinbach, P. A., Baird, G. S., Zacharias, D. A. & Tsien, R. Y. (2002) Proc. Natl. Acad. Sci. USA 99, 7877–7882. [DOI] [PMC free article] [PubMed] [Google Scholar]
- 19.Lounis, B., Deich, J., Rosell, F. I., Boxer, S. G. & Moerner, W. E. (2001) J. Phys. Chem. B 105, 5048–5054. [Google Scholar]
- 20.Karasawa, S., Araki, T., Yamamoto-Hino, M. & Miyawaki, A. (2003) J. Biol. Chem. 278, 34167–34171. [DOI] [PubMed] [Google Scholar]
- 21.Prescott, M., Ling, M., Beddoe, T., Oakley, A. J., Dove, S., Hoegh-Guldberg, O., Devenish, R. J. & Rossjohn, J. (2003) Structure (Cambridge, Mass.) 11, 275–284. [DOI] [PubMed] [Google Scholar]
- 22.Wang, Z., Shah, J. V., Chen, Z., Sun, C. H. & Berns, M. W. (2004) J. Biomed. Opt. 9, 395–403. [DOI] [PubMed] [Google Scholar]
- 23.Haupts, U., Maiti, S., Schwille, P. & Webb, W. W. (1998) Proc. Natl. Acad. Sci. USA 95, 13573–13578. [DOI] [PMC free article] [PubMed] [Google Scholar]
- 24.Chattoraj, M., King, B. A., Bublitz, G. U. & Boxer, S. G. (1996) Proc. Natl. Acad. Sci. USA 93, 8362–8367. [DOI] [PMC free article] [PubMed] [Google Scholar]
- 25.Lossau, H., Kummer, A., Heinecke, R., Pollinger-Dammer, F., Kompa, C., Bieser, G., Jonsson, T., Silva, C. M., Yang, M. M., Youvan, D. C. & Michel-Beyerle, M. E. (1996) Chem. Phys. 213, 1–16. [Google Scholar]
- 26.Cotlet, M., Hofkens, J., Habuchi, S., Dirix, G., Van Guyse, M., Michiels, J., Vanderleyden, J. & De Schryver, F. C. (2001) Proc. Natl. Acad. Sci. USA 98, 14398–14403. [DOI] [PMC free article] [PubMed] [Google Scholar]
- 27.Lauf, U., Lopez, P. & Falk, M. M. (2001) FEBS Lett. 498, 11–15. [DOI] [PubMed] [Google Scholar]
- 28.Mizuno, H., Sawano, A., Eli, P., Hama, H. & Miyawaki, A. (2001) Biochemistry 40, 2502–2510. [DOI] [PubMed] [Google Scholar]
- 29.Dou, S., Zeng, X., Cortes, P., Erdjument-Bromage, H., Tempst, P., Honjo, T. & Vales, L. D. (1994) Mol. Cell. Biol. 14, 3310–3319. [DOI] [PMC free article] [PubMed] [Google Scholar]
- 30.Mumm, J. S. & Kopan, R. (2000) Dev. Biol. 228, 151–165. [DOI] [PubMed] [Google Scholar]
- 31.Oswald, F., Tauber, B., Dobner, T., Bourteele, S., Kostezka, U., Adler, G., Liptay, S. & Schmid, R. M. (2001) Mol. Cell. Biol. 21, 7761–7774. [DOI] [PMC free article] [PubMed] [Google Scholar]
- 32.Oswald, F., Kostezka, U., Astrahantseff, K., Bourteele, S., Dillinger, K., Zechner, U., Ludwig, L., Wilda, M., Hameister, H., Knochel, W., et al. (2002) EMBO J. 21, 5417–5426. [DOI] [PMC free article] [PubMed] [Google Scholar]
Associated Data
This section collects any data citations, data availability statements, or supplementary materials included in this article.


