

Abstract
Despite extensive research into executive function (EF), the precise relationship between brain dynamics and flexible cognition remains unknown. Using a large, publicly available dataset (189 participants), we find that functional connections measured throughout 56 minutes of resting state fMRI data comprise five distinct connectivity states. Elevated EF performance as measured outside of the scanner was associated with greater episodes of more frequently occurring connectivity states, and fewer episodes of less frequently occurring connectivity states. Frequently occurring states displayed metastable properties, where cognitive flexibility may be facilitated by attenuated correlations and greater functional connection variability. Less frequently occurring states displayed properties consistent with low arousal and low vigilance. These findings suggest that elevated EF performance may be associated with the propensity to occupy more frequently occurring brain configurations that enable cognitive flexibility, while avoiding less frequently occurring brain configurations related to low arousal/vigilance states. The current findings offer a novel framework for identifying neural processes related to individual differences in executive function.
Keywords: cognitive flexibility, dynamic functional network connectivity, executive function, human connectome project, resting-state fMRI
Executive function (EF) allows individuals to plan for, and flexibly adjust to, changes in the environment to pursue certain courses of action over others. Neural networks underlying EF have traditionally been investigated using static functional network connectivity approaches (sFNC) that assume invariant temporal coupling between brain areas throughout a functional magnetic resonance imaging (fMRI) scan. Such approaches have identified several brain networks related to EF processes. These include the attention, salience, and cognitive control networks (Dajani and Uddin, 2015) that are composed of frontal, insular, cingulate, and parietal regions (Niendam et al., 2012) engaged during working memory, interference control, and cognitive flexibility (Diamond, 2013). Additionally, the default mode network (DMN) tends to disengage during cognitively demanding tasks (Shulman et al., 1997), and individual differences in behavioral performance variability are related to competitive relationships between the DMN and “task-positive” networks (Kelly, Uddin et al, 2008 Neuriomage). Just as earlier models proposed that distributed brain networks give rise to neurocognitive functions such as attention, language, and memory (Mesulam, 1990), EF appears to rely on several large-scale brain networks working in cooperation or opposition to execute goal-directed behaviors (Dajani and Uddin, 2015).
Although sFNC analyses have increased our understanding of the neural substrates of EF, temporal coupling between brain regions is increasingly viewed as time-variant rather than time-invariant (Hutchison et al., 2013a). New techniques such as dynamic functional network connectivity (dFNC) take into account the mutability of functional connections across time, rather than focusing only on the dominant patterns of connectivity for any particular brain region or network (Allen et al., 2014; Chang and Glover, 2010). This network science approach that identifies time-varying functional relationships between brain regions has recently been described as the “chronnectome” approach (Calhoun et al., 2014). Due to multifarious neural network involvement underlying EF, chronnectomic approaches are vital for a more nuanced understanding of network interactions supporting these abilities.
A limited number of studies have investigated the relationship between dynamic brain organization and EF by focusing on individual networks and brain areas. Recently, Braun et al. (2015) applied dynamic graph theoretical metrics to fixed-length sliding windows to investigate dynamic functional coupling across working memory tasks. They demonstrate similar node network allegiance changes across occipital-parietal and frontal networks during a 0-back task, but increased node network allegiance changes in frontal compared to occipital-parietal networks in a 2-back task. Jia et al. (2014) used multi-level adaptive evolutionary clustering of variable-length sliding windows to examine how dynamic functional coupling between individual brain areas during resting state fMRI (rsfMRI) was related to EF task performance completed outside of the scanner. They found that lower functional coupling transition time between brain areas, indicating greater functional dynamics or neural flexibility, predicted more variance in EF performance than sFNC functional coupling measures. Yang et al. (2014) used hierarchical clustering of fixed sliding windows to examine how dynamic functional connections of the posteromedial cortex during rsfMRI were related to an EF task completed outside of the scanner. They found that individuals who spent a greater amount of time in a dynamic state indexing the functional connections of a visual subregion of the posteromedial cortex performed better on a mental flexibility task.
The current study explores how chronnectomic characteristics of whole brain functional connectivity states are related to individual differences in EF. We applied k-means clustering to fixed-length sliding windows utilizing functional coupling metrics derived from a data-driven whole brain independent component analysis (ICA) parcelletion to identify brain states comprised of large-scale neural networks. Brain state characteristics such as frequency of occurrence, dwell time, and number of transitions between states were identified, and the neural flexibility of each state was quantified by measuring the variability of functional coupling between independent components within that state. Based on previous work showing that neural flexibility is related to cognitive performance (Braun et al., 2015; Jia et al., 2014), we predicted that characteristics of brain states showing greater functional coupling variability would be related to individual differences in EF performance. This approach allows examination of the hypothesis that individuals exhibiting specific intrinsic neural flexibility signatures as indexed by dFNC may be more adept at behaviors requiring flexible cognition.
Materials and Methods
Participants and Data
Data from a parcellated connectome consisting of 489 subjects was downloaded from the Human Connectome Project (HCP) website (https://db.humanconnectome.org/data/projects/HCP_500, labeled as the “HCP Parcellation+Timeseries+Netmats (PTN)” release). Subjects that were left-handed or related to each other were eliminated from the subject pool, resulting in 189 subjects (all right-handed; 97 female; 22–35 years old, M = 28.62, SD = 3.86). The data were preprocessed and subjected to an independent component analysis (ICA) by the HCP team as briefly described below.
The resting state fMRI (rsfMRI) data were acquired on a 3T Siemens “Connectome Skyra” scanner (TR = 0.72 secs) while participants were instructed to lie still with their eyes open and fixated on a cross in the center of a screen. Multiband slice acquisition was utilized (9 groups of 8 slices were acquired simultaneously for a total of 72 slices; TE = 33ms; field of view = anterior – posterior at 208 mm, left-right or right-left using a 104 x 90 matrix, inferior-superior at 144 mm; resolution = 2 x 2 x 2 mm) to acquire 4 separate 14 minute sessions (1200 volumes per session; 4800 volumes total); phase encoding was counterbalanced so that 1 left-right and 1 right-left session was acquired on day one (28 mins), and another left-right and right-left pair was acquired on day two (28 mins). For more details, see (Smith et al., 2013).
Minimal data preprocessing was applied consisting of removal of spatial distortions, realignment, co-registration to a structural image, bias field reduction, and standardization to MNI 2 x 2 x 2 mm space. ICA-Fix was also applied to remove non-neuronal noise signals from the resting state data. Additional regression of 24 movement parameters (6 rigid-parameter time series, their temporal derivatives, plus all 12 regressors squared) was also conducted. For more details, see (Glasser et al., 2013; Salimi-Khorshidi et al., 2014).
Independent Component Analysis
The data from 489 subjects were subjected to an ICA in FSL using various model orders of 25, 50, 100, 200, and 300 independent components (ICs) by the HCP team. The 100 model order ICA was chosen for this study as it consisted of ICs that represented individual brain areas of networks that were not separated in lower model orders of 25 and 50, but were not extremely parcellated as in model orders of 200 and 300. The main difference between model orders of 100, 200, and 300 was the observation of additional extreme parcellation of visual and cerebellar areas in model orders of 200 and 300. Additionally, previous research shows that ICA model orders over 100 show lower repeatability than lower model order numbers (Abou - Elseoud et al., 2010). Thus, the model order of 100 ICs was chosen for this study as it represented a balance between a necessary parcellation of major neural networks in order to map the dynamic connections between individual brain areas, and the avoidance of the extreme parcellation of visual and cerebellar brain areas. Finally, the FSL dual-regression function was used to extract individual time series from each subject related to each component (see http://humanconnectome.org/documentation/S500/HCP500_GroupICA+NodeTS+Netmats_Summary_28aug2014.pdf).
Post-Processing
Time courses were downloaded as a 4800 (volumes) x 100 (independent components) matrix for each of the 189 subjects of interest and were post-processed using the GIFT toolbox (http://mialab.mrn.org/software/gift/) that included detrending, despiking (using AFNI’s 3dDespike algorithm), and lowpass filtering (0.15 Hz). Despiking replaces data points larger than the absolute median deviation with a third order spline fit to the clean portions of the data. This is similar to the “scrubbing” method (Power et al., 2012) with the advantage that it does not eliminate volumes that would disrupt temporal continuity that is vital for a dFNC analysis. Previous research has shown that despiking decreases outlier impact on functional connectivity analyses (Allen et al., 2014). An average of 0.0415% of volumes were despiked for each subject. The average percent of consecutive windows despiked across all subjects can be found in Supplementary Table 1. In order to determine the influence of these post-processing steps, additional analyses were conducted without detrending, despiking, or filtering (See supplementary materials).
Static Functional Network Connectivity
Pearson correlations were calculated between independent components using the post-processed data, resulting in 4,950 functional connections that were fit into a 100 x 100 correlation matrix.
Dynamic Functional Network Connectivity
Dynamic functional network connectivity (dFNC) was calculated using the GIFT toolbox using sliding windows of 64 volumes (46.08 seconds) and slid in steps of 1 TR. The choice of window length was based on previous research also utilizing window sizes between 30–60 seconds (Allen et al., 2014; Hutchison and Morton, 2015; Nomi et al., 2016; Rashid et al., 2014; Yang et al., 2014), and research showing that such window sizes capture variability not found in longer windows (Allen et al., 2014; Hutchison et al., 2013b). All dFNC analyses were repeated using sliding windows of 128 volumes (See Supplementary Materials). To account for possible noise due to limited time points in each window, a tapered window (rectangle convolved with a Gaussian) was utilized to calculate covariance values (Allen et al., 2014; Nomi et al., 2016; Rashid et al., 2014; Yang et al., 2014). This produced a covariance matrix that was 4,736 (sliding windows) x 4,950 (paired connections) per subject. To further account for possible noise due to limited time points, the covariance matrix was regularized using a L1 constraint by optimizing the regularization parameter lamba (λ) to each subject in a cross-validation framework where the log-likelihood of unseen data (windowed covariance matrices) was evaluated separately for each subject in order to produce a correlation matrix (Allen et al., 2014; Nomi et al., 2016; Rashid et al., 2014; Yang et al., 2014). Correlation matrices of all sliding windows were then concatenated across subjects and subjected to k-means clustering.
The optimal number of clusters (k) was chosen by applying the elbow criterion to a subset of sliding windows called subject exemplars. Subject exemplars are defined as the sliding windows from each subject representing local maxima of functional connectivity variance, resulting in 178.92 +/− 11.67 (mean, SD) windows per subject (range: 144 – 212) for 33,816 windows. Subject exemplars are used in order to cut down on processing costs associated with choosing the optimal number of k. Random subsets of subject exemplars were subjected to k-means clustering using values of 2–20. The elbow criterion was then applied to the cluster validity index, the ratio comparing within- and between-cluster distances, to identify the optimal number of k. This method has identified the optimal number of clusters in simulated and real data using bootstrap and split-half resampling approaches (Allen et al., 2014). Twenty iterations of k-means clustering using values 2–20 were conducted with each iteration identifying the optimal number of clusters as being k=5. K-means clustering using k=5 (see Supplementary Materials for results obtained with 4, 6, and 7–10 cluster solutions) was then conducted on the concatenated matrix consisting of all sliding windows from all 189 subjects using the “city block” distance function (Allen et al., 2014). This produced 5 brain states found throughout the 56 minute rsfMRI data, with each sliding window being assigned to a particular brain state. Importantly, this approach has been shown to reliably identify clusters of meaningful information, as this exact methodology applied to Fourier domain phase randomized IC time-courses produces unstructured clusters of brain states (Allen et al., 2014).
Additional dFNC measures were then calculated on the resulting brain states for each participant consisting of a) frequency of occurrence, b) dwell time, c) the number of overall transitions between states, and d) the probability of transitions between specific states. Frequency was calculated as the percent that a brain state occurred throughout the duration of the rsfMRI data. Dwell time was calculated as the average length of time, measured in sliding windows, that a participant stayed in a given brain state. The number of transitions signifies the average amount of times that individuals switched between each brain state during the rsfMRI scan. Finally, the probability of transitions between specific states is the likelihood of switching from a specific state to another specific state (e.g., the probability of switching from state 1 to state 2).
Within-subject variance was calculated by acquiring individual subject standard deviation values of Fisher-z transformed correlations for each sliding window for each brain state. For each subject, five matrices each consisting of n (sliding windows that assigned to a particular state) x 4950 (connections) were calculated representing each brain state. The standard deviation for each connection was then calculated for each subject for each state resulting in five 1 (standard deviation) x 4950 (connections) vectors. For each state, standard deviations for each connection pair were then averaged across all subjects to create five standard deviation matrices.
Correlation between behavioral measures and dFNC measures
Five behavioral measures related to executive function were correlated with the results of the dFNC results. The 5 cognitive tasks measure executive function/cognitive flexibility (Dimensional Change Cart Sort), executive function/inhibition (Flanker Task), fluid intelligence (Penn Progressive Matrices), processing speed (Pattern Completion Processing Speed), and working memory (List Sorting). Fluid intelligence and processing speed were included in the behavioral tests because it is still unclear exactly how these processes are related to executive function; some researchers have argued for a relationship with executive function (Duncan et al., 1996; Obonsawin et al., 2002; Salthouse, 2005), while others have argued that they are separate constructs (Ardila et al., 2000; Crinella and Yu, 1999; Friedman et al., 2006) (for a review see, (Jurado and Rosselli, 2007)). More information on each task can be found in (Barch et al., 2013). Age-adjusted values (except for Penn Progressive Matrices) acquired from the HCP website were utilized in the current study.
Pearson correlations were calculated between behavioral values and the dFNC measures related to frequency of occurrence, dwell time, overall number of transitions, and the probability of transitioning between specific states. Alpha values were Bonferroni corrected for each comparison; frequency of occurrence (5 states x 5 behavioral tests, 0.05/25 = 0.002), dwell time (5 states x 5 behavioral tests, .05/25 = 0.002), number of transitions (5 states, 0.05/5 = 0.01), and transition probability (25 transitions, 0.05/25 = 0.002). Because all scores were age adjusted and the age range of participants was small, only gender was utilized as a nuisance covariate in the correlation analysis.
First- and Second-Half Analyses
The 56 minute resting state data used in the current study was collected over 2 days with 28 minutes of rsfMRI data collected on the first day and 28 minutes collected on the second day. Separate analyses were conducted to determine if correlations found in the overall analysis were replicated in each 28-minute data set. In order to assess possible differences between dFNC brain states between the first and second days, test-retest reliability intra-class correlations (ICC) (Shrout and Fleiss, 1979) were calculated using the Statistical Package for the Social Sciences (SPSS) for frequency of occurrence, dwell time, and number of transitions.
Results
Independent Component Analysis
The efficient reduction of non-neuronal signals from ICA + Fix resulted in no visible noise components produced from the ICA related to movement, white matter, or cerebral spinal fluid. Thus, all 100 components were analyzed, as each IC represents a functionally relevant brain area. Spatial maps representing the 100 independent components (ICs) can be seen in Figure 1 and have been grouped into ten functional domains to facilitate correlation matrix interpretation: subcortical, default mode network (DMN), sensorimotor, temporal/parietal, brain stem, visual, frontal, salience network (SN), central executive network (CEN), and the cerebellum, mirroring the groupings used in previous dFNC studies utilizing ICA approaches (Allen et al., 2014; Nomi et al., 2016; Rashid et al., 2014).
Figure 1.

Spatial maps of the 100 independent components.
Static Network Functional Connectivity
The sFNC analysis replicates previous work showing positive within-network correlations for ICs within somatosensory, visual, default mode network (DMN) and cerebellar networks and anti-correlations between DMN/cerebellar components with other brain systems (Allen et al., 2014; Damaraju et al., 2014; Nomi et al., 2016) (Supplementary Figure 1).
Dynamic Functional Network Connectivity
The dFNC analysis results are depicted in Figure 2. Frequency of occurrence, mean dwell times, and number of transitions for the overall 56-minute data set can be found in Figure 3. In general, more frequently occurring states have a larger number of correlations centered around zero, while less frequently occurring states have more dispersed correlation distributions. That is, correlation magnitudes are attenuated in more frequently occurring states and stronger in less frequently occurring states. Additionally, the functional connections within each dynamic state showed marked differences within and across networks. For example, the positive and negative DMN connections with other networks are similar in states 1 and 2, but are different in the other three states. Strong anti-correlations between the subcortical network with temporal, sensorimotor, and visual networks appear in states 4 and 5 while strong positive correlations appear with the cerebellar network in state 5. Strong integration can be seen for the sensorimotor and temporal network in states 4 and 5, the cerebellar network in state 5, and the visual network in states 3, 4, and 5. Finally, different sub-clusters of the cerebellar network appear in states 1 and 2 as opposed to the other three states.
Figure 2. Dynamic functional network connectivity matrices, histograms, and standard deviation matrices for the overall analysis.

Five reoccurring brain states are ordered from most frequently occurring (state 1) to least frequently occurring (state 5) (top); percent occurrence is listed next to each state in parenthesis. Histograms (middle) represent Fisher-z transformed correlation distributions demonstrating that more frequently occurring states have distributions centered around zero while less frequently occurring states have more dispersed distributions. Standard deviation matrices (bottom) show the average standard deviation for each subject is generally larger for more frequently occurring states. SC, subcortical; T/P, temporal/parietal; SM, sensorimotor; CEN, central executive network; SN, salience network; DMN, default mode network; CB, cerebellum; BS, brainstem.
Figure 3.
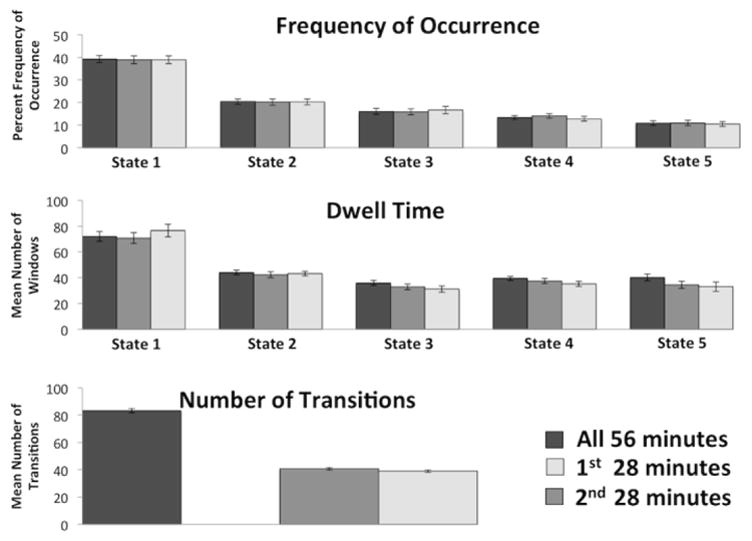
Group averages for frequency of occurrence, dwell time, and number of transitions for the overall, first-half, and second-half analyses. Frequency of occurrence, dwell time, and number of transitions are similar for the first- and second-half analyses. Error bars represent standard error of the mean.
Within subject variability was calculated by acquiring the standard deviation across all sliding windows related to a specific brain state for each functional connection, then averaging SD values across subjects. Standard deviation matrices show that frequently occurring states tend to have greater variance for any given connection than less frequently occurring states. More specifically, standard deviations within and across higher-level cognitive networks such as frontal, CEN, SN, and DMN networks are larger in states 1 and 2 compared with the other three states. Additionally, standard deviations within the cerebellar and visual networks as well as between cerebellar and visual networks are much lower in state 5 compared with other states.
Correlations between dFNC and behavioral measures
Behavioral scores consisted of correct responses (Penn Progressive Matrices and Processing Speed), correctly recalled items (List Sort), and a combination of accuracy and reaction time (Card Sort and Flanker). For all tasks, higher scores represent better performance (Table 1). Correlations between behavioral measures showed that the Flanker Task, Processing Speed, and Card Sort had higher correlations with each other than with other tasks (r’s > 0.40) (Table 2).
Table 1.
The five tasks of interest are listed with their task name and associated cognitive process that is measured.
| Cognitive Process | Task | Mean (SD) | Range |
|---|---|---|---|
| Processing Speed | Processing Speed | 100.02 (18.13) | 47.35–144.38 |
| Inhibition/Attention | Flanker | 102.72 (9.89) | 73.64–123.56 |
| Cognitive Flexibility | Card Sort | 102.18 (9.92) | 67.32–122.65 |
| Fluid Intelligence | Penn Progressive Matrices | 16.84 (4.68) | 6–24 |
| Working Memory | List Sort | 102.11 (13.80) | 60.09–132.49 |
Note: all means are age adjusted (M = 100) except for Progressive Matrices
Table 2.
Correlations between cognitive measures show that the Flanker Task, Card Sort Task, and Processing Speed Tasks have higher correlations with each other than other tasks.
| Processing | Progressive | ||||
|---|---|---|---|---|---|
| Speed | Flanker | Card Sort | Matrices | List Sort | |
| Processing Speed | - | ||||
| Flanker | 0.41 *** | - | |||
| Card Sort | 0.45 *** | 0.48 *** | - | ||
| Progressive Matrices | 0.17 * | 0.19 ** | 0.15 * | - | |
| List Sort | 0.15 * | 0.18 * | 0.14 | 0.33 *** | - |
p < 0.05;
p < 0.01;
p < 0.001;
bold is Bonferroni corrected at p < 0.005
Card Sort task performance was negatively correlated with frequency of occurrence for state 3 (r = −0.226; p = 0.002) and marginally positively correlated with frequency of occurrence for state 2 (r = 0.209; p = 0.004). In other words, better Card Sort task performance was correlated with increased state 2 and decreased state 3 occurrences.
List Sort task performance was positively correlated with frequency of occurrence for State 1 (r = 0.228; p = 0.002) and negatively correlated with frequency of occurrence for state 5 (r = −0.236; p = 0.001). Thus, better List Sort task performance was correlated with increased state 1 and decreased state 5 occurrences (Supplementary Figure 2).
The probability of transitioning between specific states showed two significant correlations with EF performance (Supplementary Figure 3). There was a positive correlation with the transition from state 1 to state 2 for the Card Sort task (r = 0.222, p = 0.002) and a positive correlation when participants remain in state 1 for the List Sort task (r = 0.216, p = 0.003). Thus, participants who performed better on the Card Sort task were more likely to transition into state 2 from state 1. This is in accordance with the state frequency correlation where participants who performed better in the Card Sort task had greater incidences of state 2. Participants who performed better on the List Sort task were more likely to stay in state 1 and is in accord with the state frequency correlation where participants who performed better on the List Sort task had greater incidences of state 1. Correlations between behavioral performance and dynamic brain state characteristics revealed no significant relationships with the number of state transitions (p’s > 0.01) or dwell time (p’s > 0.006) for any measure (Bonferroni corrected at 5 states x 5 behavioral tasks: 0.05/25 = 0.002). All other correlations between tasks and state frequency (p’s ≥ 0.008) or between specific state transition probabilities ( p’s ≥ 0.006) did not survive multiple comparison correction.
Relationship Between States
To investigate the relationship between states 2 and 3 (implicated in the Card Sort task), and between states 1 and 5 (implicated in the List Sort task), correlations were calculated between state-pairs across all 189 subjects. This is because one set of subjects could be responsible for the positive correlations and another set of subjects could be responsible for the negative correlations in the previous analysis. Calculating a difference score ensures that the increase in one state frequency and the decrease in another state frequency, and its relation to EF performance, is consistent across subjects. Both state-pairs showed strong negative correlations (states 2 and 3 were negatively correlated: r = −0.619, p = 2.65e-21; states 1 and 5 were negatively correlated: r = −0.687, p = 1.44e-27) demonstrating that as state 2 frequency went up, state 3 frequency went down, and as state 1 frequency went up, state 5 frequency went down across all subjects.
To determine the relationship of these correlations with cognitive performance, frequency of occurrence difference scores were calculated by subtracting state 3’s frequency values from state 2 and also by subtracting state 5’s frequency values from state 1 for each subject. These difference scores were then correlated with cognitive performance to directly relate cognitive performance with the relationship between states 2 and 3 (Figure 4), and between states 1 and 5 (Figure 5). As expected, there was a positive difference score correlation for states 2 and 3 with Card Sort task performance (r = 0.242, p = 0.001) (Bonferroni corrected to an alpha level of 0.5/5 = 0.01) and a positive difference score correlation for states 1 and 5 with List Sort task performance (r = 0.25, p = 0.001). This demonstrates that larger difference scores were related to better task performance. That is, state 2’s increase in frequency was related to state 3’s decrease in frequency across subjects, with larger differences between states related to better Card Sort task performance. Similarly, the state 1’s increase in frequency was related to state 5’s decrease in frequency across subjects, with larger differences between states related to better List Sort task performance.
Figure 4. Frequency of occurrence difference scores.

State 2 minus state 3 (x axis) correlated with behavioral performance (y axis) for the overall, first-half, and second-half analyses for all 189 subjects. Greater difference scores are positively correlated with better performance on the Card Sort task for all three analyses.
Figure 5. Frequency of occurrence difference scores.

State 1 minus state 5 (x axis) correlated with behavioral performance (y axis) for the overall, first-half, and second-half analyses for all 189 subjects. Greater difference scores are positively correlated with better performance on the List Sort task for all three analyses.
First- and Second-half Analyses
As in the overall dFNC analysis, the optimal cluster solution for each 28 minutes of data was determined by applying the elbow criterion to random subject exemplar subsets producing an optimal cluster solution of k=5 for each half of data. The resulting correlation matrices are virtually indistinguishable from the overall correlation matrices (Supplementary Figures 3 and 4).
Test-retest correlations for frequency of occurrence, dwell time, and number of transitions (Table 3) show that frequency had higher test-retest correlations than dwell time and number of transitions. This suggests that how often a brain state appears (frequency) is more stable across days than the average time spent in a brain state, or transitions between states.
Table 3.
Test-retest intra-class correlations for frequency of occurrence, dwell time, and number of transitions between the 1st 28 minutes and 2nd 28 minutes of resting state data for all 189 subjects.
| State 1 | State 2 | State 3 | State 4 | State 5 | |
|---|---|---|---|---|---|
| Frequency (r) | 0.74 | 0.83 | 0.73 | 0.62 | 0.72 |
| 95% CI | 0.65, 0.80 | 0.77, 0.87 | 0.64, 0.80 | 0.50, 0.72 | 0.62, 0.79 |
| Dwell Time (r) | 0.60 | 0.70 | 0.60 | 0.57 | 0.60 |
| 95% CI | 0.46, 0.70 | 0.60, 0.78 | 0.47, 0.70 | 0.43, 0.68 | 0.46, 0.70 |
| Overall | |||||
| Transitions (r) | 0.54 | ||||
| 95% CI | 0.40, 0.66 | ||||
Correlations between frequency of occurrence and behavioral scores demonstrated the same general trends found in the overall analysis in both the first- and second-half of the data (Supplementary Figure 2). Performance on the Card Sort task was negatively correlated with frequency of occurrence for state 3 and positively correlated with state 2, while List Sort task performance was positively correlated with frequency of occurrence for state 1 and negatively correlated with state 5.
The main results of interest were the difference score correlations that were applied to each half of the data replicating the overall results. The first 28 minutes showed negative correlations between states 2 and 3 (r = −0.610, p = 1.64e-20) and between states 1 and 5 (r = −0.672, p = 4.27e-26) across subjects. Correlations between difference scores and cognitive performance also showed the same patterns in the overall analysis. Difference scores between states 2 and 3 were positively correlated with Card Sort task performance (r = 0.219, p = 0.002) while difference scores between states 1 and 5 were positively correlated List Sort task performance (r = 0.256, p = 0.0004) (Figures 4 and 5).
The second 28 minutes showed the same pattern with negative correlations between states 2 and 3 (r = −0.581, p = 2.16e-18) and between states 1 and 5 (r = −0.635, p = 1.37e-22) across subjects. The difference scores between states 2 and 3 were positively correlated with Card Sort task performance (r = 0.224, p = 0.002) while difference scores between states 1 and 5 were positively correlated with List Sort task performance (r = 0.186, p = 0.011) (Figures 4 and 5). This demonstrates the same pattern of results in each half of data as in the overall analysis that included all 56 minutes of data.
Additional Cluster Solutions, Window Size, Alternate K-means Distance Functions, and Post-processing
Because both optimal cluster solution amount (Leonardi et al., 2014) and window size (Leonardi and Van De Ville, 2015) and can influence results, additional analyses were conducted using different cluster solutions for the original analysis (4, 6, and 7–10 cluster solutions), and a different window size (92 seconds; 128 volumes with cluster solutions of 4, 5 and 6). To examine how different k-means algorithms influence the results, alternate k-means distance functions (Euclidean, correlation, cosine) were also employed for the overall 56 minutes of data using a cluster solution of five. Finally, in order to determine if the inclusion of post-processing steps in conjunction with the already applied ICA-FIX denoising influenced the results, additional analyses were conducted for the 46 second windows using cluster solutions of 4, 5, and 6 (cityblock k-means distance function) without the inclusion of despiking, detrending, and filtering.
Correlation matrices, histogram distributions of correlations, and standard deviation matrices for each analysis replicated the main findings showing that more frequently occurring states tend to have more correlations centered around zero with larger standard deviations (Supplementary Figures 5–20). Follow up analyses replicated the overall findings where individuals who perform better on Card Sort and List Sort tasks have increased incidences of more frequently occurring states and decreased incidences of less frequently occurring states (Supplementary Figures 21–36) The main difference was that processing speed showed similar patterns of significance as the Card Sort task in some analyses. These additional results demonstrate that the general findings of the current study are not restricted to a particular window size, specific cluster solution, specific k-means distance function, or the presence of the despiking, detrending, and filtering post-processing steps.
Consideration of Motion Artifacts
As previous research has shown that motion artifacts can impact the strength of functional connections (Power et al., 2012), relative root mean square (RMS) motion parameters for each subject were acquired from the HCP database and compared to executive function performance and dynamic brain states. Relative RMS was negatively correlated with executive function performance for all 5 tasks (r’s = −0.109 to −0.069) such that individuals who perform better on executive function tasks have less scanner movement, but these correlations were not significant (p’s > .08). Additionally, the proportion of windows exhibiting relative RMS values greater than the mean (M = 0.0895) for each state was calculated (Supplementary Table 2). There were no systematic relationships between state frequency and relative RMS (i.e., more frequent states were not characterized by increased movement, and vice versa) indicating that movement was not a confounding factor in the analysis.
Discussion
Individuals vary widely in their ability to flexibly adapt their behaviors. We tested the hypothesis that EF ability is related to the intrinsic ability of the brain to dynamically reconfigure into states characterized by greater variability and flexibility of functional connections. The current study utilized a chronnectomic systems approach where whole-brain states are determined by both positive and negative functional connections across brain regions. Such an approach offers insights into how intrinsic dynamic shifts within and between large-scale brain networks are related to executive function abilities across neurotypical individuals.
The analysis revealed 5 distinct brain states in neurotypical adults across 56 minutes of rsfMRI data. Results show that the brains of individuals who perform better on measures of cognitive flexibility and working memory are characterized by the tendency to occupy more frequently occurring states that presented with a larger number of correlations near zero and larger variability, rather than less frequently occurring states with more dispersed correlation distributions and lower variability. Additionally, there were no strong relationships with dwell time or the number of transitions between brain states with measures of behavioral performance. This suggests that the frequency of brain state occurrence is important for certain EF tasks, rather than time spent in a state, or the amount of switching between states. Finally, cognitive flexibility (Card Sort), processing speed, and working memory tasks (List Sort) were associated with brain state frequency, while fluid intelligence (Ravens) and inhibition/attention (Flanker Task) tasks were not, demonstrating the specificity of the brain state findings to measures of EF.
Brain State Frequency, Metastability, and Arousal
The frequently occurring states implicated in EF performance were generally characterized by distributions consisting of a larger number of correlations centered around zero and larger standard deviations than less frequently occurring states. One explanation for why these characteristics may enable better EF task performance is that they allow for more flexible functional coupling configurations between brain regions. This is because correlations near zero with greater standard deviations allow for a range of connections from positive to negative, as opposed to correlations further from zero with smaller standard deviations. That is, correlations far from zero with less variability are less likely to fluctuate from positive to negative and are likely to stay either positive or negative. Thus, the more frequently occurring brain states allow for a greater range of either integration (positive correlations) or segregation (negative correlations) between neural networks and individual brain areas. This in turn allows for greater neural flexibility via reconfiguration of general brain state organization.
This proposal mirrors previous findings showing that neural flexibility during a task is advantageous for cognitive processes such as learning (Bassett et al., 2011; Braun et al., 2015; Cole et al., 2013). It is also in line with previous reports showing that intrinsic flexibility of individual brain areas can be related to cognitive performance (Jia et al., 2014; Yang et al., 2014). The current study extends these findings to intrinsically occurring dynamic brain states, suggesting that the flexibility in the general organization of the brain facilitates cognitive performance on certain EF tasks.
The characteristics of the more frequently occurring brain states also relate to a field called Coordination Dynamics (Tognoli and Kelso, 2014) that is concerned with how metastable properties of functional brain networks are related to cognitive function (Kringelbach et al., 2015). Metastable brain states allow for the flexible reconfiguration of neural networks while avoiding extreme integrative or segregative brain configurations (Hellyer et al., 2015). Thus, a metastable brain state resides in the middle of a continuum situated between chaos and extreme rigidity. In the current study, more frequently occurring states have characteristics of metastable brain states, as they fluctuate between weak and moderate integrative and segregative neural network configurations (correlations close to zero and increased variation in functional connections), while less frequently occurring states have characteristics of extreme rigidity (extreme correlations representing high segregation and integration, and small variations in functional connections). Thus, the current study supports the notion that metastability and cognitive flexibility may arise from similar brain configurations, as brain states exhibiting metastable tendencies are also those states that allow for greater cognitive flexibility necessary for successful completion of executive function tasks.
Dynamic-FNC investigations utilizing simultaneous EEG-rsfMRI data have shown that less frequently occurring brain states characterized by strong visual-sensorimotor integration and subcortical-cortical segregation are associated with EEG signatures of low arousal states (Allen, Submitted). Other research investigating arousal states in monkeys has shown local field potentials and eyelid behavior indexing reduced arousal is also characterized by cortical integration and subcortical-cortical segregation (Chang et al., 2016). These findings are consistent with other research showing subcortical-cortical segregation is associated with states of increased daytime sleepiness (Killgore et al., 2015). Because optimal EF requires sustained attention and focus, entering into states of low arousal and vigilance would most likely be detrimental to task performance. In the context of the current study, it may be the case that brains intrinsically avoiding low arousal states at rest may be better equipped to avoid entering low arousal states that would interfere with EF task performance. This suggests that one trait of intrinsic brain function enabling elevated EF performance is the propensity of the brain to be in configurations enabling cognitive flexibility, while also avoiding configurations related to lower states of arousal.
Differences Among Tasks
Although the cognitive flexibility task (Card Sort), inhibition/attention task (Flanker), and processing speed tasks showed correlations with each other (r’s = 0.41 to 0.48), only cognitive flexibility task performance and processing speed were related to brain state frequency. While arguments exist for a single ability underlying all EF abilities (de Frias et al., 2006), the current study suggests that this underlying feature is not related to individual intrinsic dynamic brain state organization, and parallels other views proposing that contradistinctive constructs regulate various EF abilities (Godefroy et al., 1999). Also, there were no relationships between fluid intelligence (Penn Progressive Matrices) and any of the dFNC measures. This is in accord with previous work suggesting that the EF and fluid intelligence can be both related (Duncan et al., 1996; Obonsawin et al., 2002; Salthouse, 2005) and unique constructs (Ardila et al., 2000; Crinella and Yu, 1999; Friedman et al., 2006).
First- and Second-Half Analyses
The correlations linking overall brain state difference scores to EF tasks completed outside of scanner were replicated in each half of the data. This demonstrates that the overall pattern of results could be reproduced on separate days using smaller rsfMRI data sets. This supports the argument that it is the propensity of certain flexible brain states to occur that relates to EF performance, and not random day-to-day brain state frequency fluctuations. Accordingly, the test-retest reliability calculations for frequency of occurrence (r’s = 0.62 – 0.83) were higher than dwell time (r’s = 0.57 – 0.70) and the number of transitions (r = 0.54), suggesting that frequency was the most reliable measure. This may be why EF task performance was correlated with frequency but not dwell time or number of transitions. These findings also build on previous research showing reproducibility of static neural networks (Zuo and Xing, 2014) and dynamically reoccurring brain states (Yang et al., 2014).
Limitations
One limitation of the current study is that a context-based approach that explores brain states does not identify any specific brain area or brain network that would be most important in driving the effects in the current study. However, it has previously been suggested that the function of any single brain area or neural network relies on the functional connections of adjacent brain areas and neural networks (McIntosh, 2004; Pessoa, 2014) emphasizing the importance of a brain state approach. Recent work has also shown that graph-theory measures of brain areas during a rsfMRI scan, found outside of the frontal-parietal network, are associated with EF task performance outside of the scanner (Reineberg and Banich, 2016) showing the importance of a whole brain approach to investigating EF. Thus, if EF performance relies on general whole brain dynamics, then ignoring the context of the entire brain would be detrimental to identifying general mechanisms of cognitive performance. Additionally, EF relies on a number of neural networks related to maintenance, manipulation, attention, switching, and inhibition processes. The current study cannot determine if one specific aspect of performance related to EF tasks were driving the relationship between brain state frequency and task performance.
Another limitation is that we chose a parcellation scheme based on an ICA. Although ICA has multiple benefits including the identification of only functionally independent brain areas specifically related to the current data set, the ability to account for overlapping networks, and the filtering of artifacts. Alternative functional parcellation schemes (Craddock et al., 2012; Gordon et al., 2014; Power et al., 2011; Yeo et al., 2011) should be explored in the future.
Finally, the current fixed-sliding window dFNC approach adopted in the current study uses the k-means clustering algorithm and focuses on metrics such as state frequency, dwell time, probability of state transitions, and number of overall transitions. All of these metrics are based on identifying differences among sliding windows within a single dimension (i.e., the cluster that each sliding window belongs to). Other fixed-sliding window dFNC approaches have utilized methods to recast each sliding window as a weighted sum of connectivity patterns that places each sliding window in the context of a multi-dimensional state-space. In this approach, the trajectory of sliding-windows can be traced through more than one dimension (Yaesoubi et al., 2015). This would allow one to investigate if a subject has a smaller multi-dimensional state space than another subject, or if they traverse smaller distances through multi-dimensional state space than another subject. Smaller multi-dimensional state space and restricted movement through multi-dimensional state space has been associated with schizophrenia compared to typical controls, along with additional advanced concepts such as that of an “absorbing hub”, which has been found to be associated with negative symptoms in schizophrenia (Yaesoubi et al., 2015). Future work should consider how different types of dFNC approaches identify different aspects of brain function related to executive function.
Conclusions
The current study demonstrates a relationship between EF abilities and the brain’s propensity to occupy a specific functional connectivity configuration, or state. Thus, performance on a cognitive task may not be based entirely on the changes occurring during the specif(Allen et al., 2014) task itself, or the dynamic functional coupling of any single brain area, but it may also depend on the intrinsic organization of dynamic shifts between entire brain states or systems. Additionally, not all behavioral measures were related to brain state frequency, demonstrating differences in the relationship between various EFs and intrinsic dynamic brain states. Finally, the current study suggests an intrinsic brain trait enabling elevated EF performance may be the propensity to occupy brain configurations enabling cognitive flexibility and avoid configurations related to low arousal/vigilance. Taken together, these results demonstrate the unique way that chronnectomic approaches contribute to our understanding of the neural basis of individual differences in EF in the neurotypical population and can serve as a framework for future investigations exploring EF in clinical populations.
Supplementary Material
Acknowledgments
This work was supported by awards K01MH092288 and R01MH107549 from the National Institute of Mental Health, a Slifka/Ritvo Innovation in Autism Research Award, and a NARSAD Young Investigator Grant to LQU, along with an Institutional Development Award P20GM103472 from the National Institute of General Medical Sciences and award R01EB020407 from The National Institute of Biomedical Imaging and Bioengineering as well as an NSF EPSCoR grant #1539067 to VDC.
Footnotes
Publisher's Disclaimer: This is a PDF file of an unedited manuscript that has been accepted for publication. As a service to our customers we are providing this early version of the manuscript. The manuscript will undergo copyediting, typesetting, and review of the resulting proof before it is published in its final citable form. Please note that during the production process errors may be discovered which could affect the content, and all legal disclaimers that apply to the journal pertain.
References
- Abou-Elseoud A, Starck T, Remes J, Nikkinen J, Tervonen O, Kiviniemi V. The effect of model order selection in group PICA. Hum Brain Mapp. 2010;31:1207–1216. doi: 10.1002/hbm.20929. [DOI] [PMC free article] [PubMed] [Google Scholar]
- Allen EA, Damaraju E, Plis SM, Erhardt EB, Eichele T, Calhoun VD. Tracking Whole-Brain Connectivity Dynamics in the Resting State. Cereb Cortex. 2014;24:663–676. doi: 10.1093/cercor/bhs352. [DOI] [PMC free article] [PubMed] [Google Scholar]
- Allen EA, Damaraju E, Eichele T, Wu L, Calhoun VD. EEG signatures of dynamic functional network connectivity states. doi: 10.1007/s10548-017-0546-2. Submitted. [DOI] [PMC free article] [PubMed] [Google Scholar]
- Ardila A, Pineda D, Rosselli M. Correlation between intelligence test scores and executive function measures. Archives of clinical neuropsychology. 2000;15:31–36. [PubMed] [Google Scholar]
- Barch DM, Burgess GC, Harms MP, Petersen SE, Schlaggar BL, Corbetta M, Glasser MF, Curtiss S, Dixit S, Feldt C. Function in the human connectome: task-fMRI and individual differences in behavior. Neuroimage. 2013;80:169–189. doi: 10.1016/j.neuroimage.2013.05.033. [DOI] [PMC free article] [PubMed] [Google Scholar]
- Bassett DS, Wymbs NF, Porter MA, Mucha PJ, Carlson JM, Grafton ST. Dynamic reconfiguration of human brain networks during learning. Proceedings of the National Academy of Sciences. 2011;108:7641–7646. doi: 10.1073/pnas.1018985108. [DOI] [PMC free article] [PubMed] [Google Scholar]
- Braun U, Schäfer A, Walter H, Erk S, Romanczuk-Seiferth N, Haddad L, Schweiger JI, Grimm O, Heinz A, Tost H. Dynamic reconfiguration of frontal brain networks during executive cognition in humans. Proceedings of the National Academy of Sciences. 2015;112:11678–11683. doi: 10.1073/pnas.1422487112. [DOI] [PMC free article] [PubMed] [Google Scholar]
- Calhoun VD, Miller R, Pearlson G, Adali T. The Chronnectome: Time-Varying Connectivity Networks as the Next Frontier in fMRI Data Discovery. Neuron. 2014;84:262–274. doi: 10.1016/j.neuron.2014.10.015. [DOI] [PMC free article] [PubMed] [Google Scholar]
- Chang C, Glover GH. Time-frequency dynamics of resting-state brain connectivity measured with fMRI. Neuroimage. 2010;50:81–98. doi: 10.1016/j.neuroimage.2009.12.011. [DOI] [PMC free article] [PubMed] [Google Scholar]
- Chang C, Leopold DA, Schölvinck ML, Mandelkow H, Picchioni D, Liu X, Frank QY, Turchi JN, Duyn JH. Tracking brain arousal fluctuations with fMRI. Proceedings of the National Academy of Sciences. 2016 doi: 10.1073/pnas.1520613113. 201520613. [DOI] [PMC free article] [PubMed] [Google Scholar]
- Cole MW, Reynolds JR, Power JD, Repovs G, Anticevic A, Braver TS. Multi-task connectivity reveals flexible hubs for adaptive task control. Nat Neurosci. 2013;16:1348–1355. doi: 10.1038/nn.3470. [DOI] [PMC free article] [PubMed] [Google Scholar]
- Craddock RC, James GA, Holtzheimer PE, 3rd, Hu XP, Mayberg HS. A whole brain fMRI atlas generated via spatially constrained spectral clustering. Hum Brain Mapp. 2012;33:1914–1928. doi: 10.1002/hbm.21333. [DOI] [PMC free article] [PubMed] [Google Scholar]
- Crinella FM, Yu J. Brain mechanisms and intelligence. Psychometric g and executive function. Intelligence. 1999;27:299–327. [Google Scholar]
- Dajani DR, Uddin LQ. Demystifying cognitive flexibility: Implications for clinical and developmental neuroscience. Trends in neurosciences. 2015;38:571–578. doi: 10.1016/j.tins.2015.07.003. [DOI] [PMC free article] [PubMed] [Google Scholar]
- Damaraju E, Allen EA, Belger A, Ford JM, McEwen S, Mathalon DH, Mueller BA, Pearlson GD, Potkin SG, Preda A, Turner JA, Vaidya JG, van Erp TG, Calhoun VD. Dynamic functional connectivity analysis reveals transient states of dysconnectivity in schizophrenia. Neuroimage Clin. 2014;5:298–308. doi: 10.1016/j.nicl.2014.07.003. [DOI] [PMC free article] [PubMed] [Google Scholar]
- de Frias CM, Dixon RA, Strauss E. Structure of four executive functioning tests in healthy older adults. Neuropsychology. 2006;20:206. doi: 10.1037/0894-4105.20.2.206. [DOI] [PubMed] [Google Scholar]
- Diamond A. Executive functions. Annual review of psychology. 2013;64:135. doi: 10.1146/annurev-psych-113011-143750. [DOI] [PMC free article] [PubMed] [Google Scholar]
- Duncan J, Emslie H, Williams P, Johnson R, Freer C. Intelligence and the frontal lobe: The organization of goal-directed behavior. Cognitive psychology. 1996;30:257–303. doi: 10.1006/cogp.1996.0008. [DOI] [PubMed] [Google Scholar]
- Friedman NP, Miyake A, Corley RP, Young SE, DeFries JC, Hewitt JK. Not all executive functions are related to intelligence. Psychological science. 2006;17:172–179. doi: 10.1111/j.1467-9280.2006.01681.x. [DOI] [PubMed] [Google Scholar]
- Glasser MF, Sotiropoulos SN, Wilson JA, Coalson TS, Fischl B, Andersson JL, Xu J, Jbabdi S, Webster M, Polimeni JR. The minimal preprocessing pipelines for the Human Connectome Project. Neuroimage. 2013;80:105–124. doi: 10.1016/j.neuroimage.2013.04.127. [DOI] [PMC free article] [PubMed] [Google Scholar]
- Godefroy O, Cabaret M, Petit-Chenal V, Pruvo JP, Rousseaux M. Control functions of the frontal lobes. Modularity of the central-supervisory system? Cortex. 1999;35:1–20. doi: 10.1016/s0010-9452(08)70782-2. [DOI] [PubMed] [Google Scholar]
- Gordon EM, Laumann TO, Adeyemo B, Huckins JF, Kelley WM, Petersen SE. Generation and Evaluation of a Cortical Area Parcellation from Resting-State Correlations. Cereb Cortex. 2014 doi: 10.1093/cercor/bhu239. [DOI] [PMC free article] [PubMed] [Google Scholar]
- Hellyer PJ, Scott G, Shanahan M, Sharp DJ, Leech R. Cognitive flexibility through metastable neural dynamics is disrupted by damage to the structural connectome. The Journal of Neuroscience. 2015;35:9050–9063. doi: 10.1523/JNEUROSCI.4648-14.2015. [DOI] [PMC free article] [PubMed] [Google Scholar]
- Hutchison RM, Morton JB. Tracking the Brain's Functional Coupling Dynamics over Development. The Journal of Neuroscience. 2015;35:6849–6859. doi: 10.1523/JNEUROSCI.4638-14.2015. [DOI] [PMC free article] [PubMed] [Google Scholar]
- Hutchison RM, Womelsdorf T, Allen EA, Bandettini PA, Calhoun VD, Corbetta M, Della Penna S, Duyn JH, Glover GH, Gonzalez-Castillo J, Handwerker DA, Keilholz S, Kiviniemi V, Leopold DA, de Pasquale F, Sporns O, Walter M, Chang C. Dynamic functional connectivity: promise, issues, and interpretations. Neuroimage. 2013a;80:360–378. doi: 10.1016/j.neuroimage.2013.05.079. [DOI] [PMC free article] [PubMed] [Google Scholar]
- Hutchison RM, Womelsdorf T, Gati JS, Everling S, Menon RS. Resting - state networks show dynamic functional connectivity in awake humans and anesthetized macaques. Hum Brain Mapp. 2013b;34:2154–2177. doi: 10.1002/hbm.22058. [DOI] [PMC free article] [PubMed] [Google Scholar]
- Jia H, Hu X, Deshpande G. Behavioral Relevance of the Dynamics of the Functional Brain Connectome. Brain Connect. 2014;4:741–759. doi: 10.1089/brain.2014.0300. [DOI] [PMC free article] [PubMed] [Google Scholar]
- Jurado MB, Rosselli M. The elusive nature of executive functions: a review of our current understanding. Neuropsychology review. 2007;17:213–233. doi: 10.1007/s11065-007-9040-z. [DOI] [PubMed] [Google Scholar]
- Killgore WD, Vanuk JR, Knight SA, Markowski SM, Pisner D, Shane B, Fridman A, Alkozei A. Daytime sleepiness is associated with altered resting thalamocortical connectivity. Neuroreport. 2015;26:779–784. doi: 10.1097/WNR.0000000000000418. [DOI] [PubMed] [Google Scholar]
- Kringelbach ML, McIntosh AR, Ritter P, Jirsa VK, Deco G. The Rediscovery of Slowness: Exploring the Timing of Cognition. Trends Cogn Sci. 2015;19:616–628. doi: 10.1016/j.tics.2015.07.011. [DOI] [PubMed] [Google Scholar]
- Leonardi N, Shirer WR, Greicius MD, Van De Ville D. Disentangling dynamic networks: separated and joint expressions of functional connectivity patterns in time. Hum Brain Mapp. 2014;35:5984–5995. doi: 10.1002/hbm.22599. [DOI] [PMC free article] [PubMed] [Google Scholar]
- Leonardi N, Van De Ville D. On spurious and real fluctuations of dynamic functional connectivity during rest. Neuroimage. 2015;104:430–436. doi: 10.1016/j.neuroimage.2014.09.007. [DOI] [PubMed] [Google Scholar]
- McIntosh AR. Contexts and catalysts. Neuroinformatics. 2004;2:175–181. doi: 10.1385/NI:2:2:175. [DOI] [PubMed] [Google Scholar]
- Mesulam M-M. Large scale neurocognitive networks and distributed processing for attention. Annals of neurology. 1990:28. doi: 10.1002/ana.410280502. [DOI] [PubMed] [Google Scholar]
- Niendam TA, Laird AR, Ray KL, Dean YM, Glahn DC, Carter CS. Meta-analytic evidence for a superordinate cognitive control network subserving diverse executive functions. Cogn Affect Behav Neurosci. 2012;12:241–268. doi: 10.3758/s13415-011-0083-5. [DOI] [PMC free article] [PubMed] [Google Scholar]
- Nomi JS, Farrant K, Damaraju E, Rachakonda S, Calhoun VD, Uddin LQ. Dynamic functional network connectivity reveals unique and overlapping profiles of insula subdivisions. Hum Brain Mapp. 2016;37:1770–1787. doi: 10.1002/hbm.23135. [DOI] [PMC free article] [PubMed] [Google Scholar]
- Obonsawin M, Crawford J, Page J, Chalmers P, Cochrane R, Low G. Performance on tests of frontal lobe function reflect general intellectual ability. Neuropsychologia. 2002;40:970–977. doi: 10.1016/s0028-3932(01)00171-3. [DOI] [PubMed] [Google Scholar]
- Pessoa L. Understanding brain networks and brain organization. Physics of life reviews. 2014;11:400–435. doi: 10.1016/j.plrev.2014.03.005. [DOI] [PMC free article] [PubMed] [Google Scholar]
- Power JD, Barnes KA, Snyder AZ, Schlaggar BL, Petersen SE. Spurious but systematic correlations in functional connectivity MRI networks arise from subject motion. Neuroimage. 2012;59:2142–2154. doi: 10.1016/j.neuroimage.2011.10.018. [DOI] [PMC free article] [PubMed] [Google Scholar]
- Power JD, Cohen AL, Nelson SM, Wig GS, Barnes KA, Church JA, Vogel AC, Laumann TO, Miezin FM, Schlaggar BL. Functional network organization of the human brain. Neuron. 2011;72:665–678. doi: 10.1016/j.neuron.2011.09.006. [DOI] [PMC free article] [PubMed] [Google Scholar]
- Rashid B, Damaraju E, Pearlson GD, Calhoun VD. Dynamic connectivity states estimated from resting fMRI Identify differences among Schizophrenia, bipolar disorder, and healthy control subjects. Front Hum Neurosci. 2014:8. doi: 10.3389/fnhum.2014.00897. [DOI] [PMC free article] [PubMed] [Google Scholar]
- Reineberg AE, Banich MT. Functional connectivity at rest is sensitive to individual differences in executive function: A network analysis. Hum Brain Mapp. 2016 doi: 10.1002/hbm.23219. [DOI] [PMC free article] [PubMed] [Google Scholar]
- Salimi-Khorshidi G, Douaud G, Beckmann CF, Glasser MF, Griffanti L, Smith SM. Automatic denoising of functional MRI data: combining independent component analysis and hierarchical fusion of classifiers. Neuroimage. 2014;90:449–468. doi: 10.1016/j.neuroimage.2013.11.046. [DOI] [PMC free article] [PubMed] [Google Scholar]
- Salthouse TA. Relations between cognitive abilities and measures of executive functioning. Neuropsychology. 2005;19:532. doi: 10.1037/0894-4105.19.4.532. [DOI] [PubMed] [Google Scholar]
- Shrout PE, Fleiss JL. Intraclass correlations: uses in assessing rater reliability. Psychological bulletin. 1979;86:420. doi: 10.1037//0033-2909.86.2.420. [DOI] [PubMed] [Google Scholar]
- Shulman GL, Fiez JA, Corbetta M, Buckner RL, Miezin FM, Raichle ME, Petersen SE. Common blood flow changes across visual tasks: II. Decreases in cerebral cortex. J Cogn Neurosci. 1997;9:648–663. doi: 10.1162/jocn.1997.9.5.648. [DOI] [PubMed] [Google Scholar]
- Smith SM, Beckmann CF, Andersson J, Auerbach EJ, Bijsterbosch J, Douaud G, Duff E, Feinberg DA, Griffanti L, Harms MP, Kelly M, Laumann T, Miller KL, Moeller S, Petersen S, Power J, Salimi-Khorshidi G, Snyder AZ, Vu AT, Woolrich MW, Xu J, Yacoub E, Uğurbil K, Van Essen DC, Glasser MF. Resting-state fMRI in the Human Connectome Project. Neuroimage. 2013;80:144–168. doi: 10.1016/j.neuroimage.2013.05.039. [DOI] [PMC free article] [PubMed] [Google Scholar]
- Tognoli E, Kelso JS. The metastable brain. Neuron. 2014;81:35–48. doi: 10.1016/j.neuron.2013.12.022. [DOI] [PMC free article] [PubMed] [Google Scholar]
- Yaesoubi M, Allen EA, Miller RL, Calhoun VD. Dynamic coherence analysis of resting fMRI data to jointly capture state-based phase, frequency, and time-domain information. Neuroimage. 2015;120:133–142. doi: 10.1016/j.neuroimage.2015.07.002. [DOI] [PMC free article] [PubMed] [Google Scholar]
- Yang Z, Craddock RC, Margulies DS, Yan CG, Milham MP. Common intrinsic connectivity states among posteromedial cortex subdivisions: Insights from analysis of temporal dynamics. Neuroimage. 2014;93(Pt 1):124–137. doi: 10.1016/j.neuroimage.2014.02.014. [DOI] [PMC free article] [PubMed] [Google Scholar]
- Yeo BT, Krienen FM, Sepulcre J, Sabuncu MR, Lashkari D, Hollinshead M, Roffman JL, Smoller JW, Zöllei L, Polimeni JR. The organization of the human cerebral cortex estimated by intrinsic functional connectivity. Journal of neurophysiology. 2011;106:1125–1165. doi: 10.1152/jn.00338.2011. [DOI] [PMC free article] [PubMed] [Google Scholar]
- Zuo XN, Xing XX. Test-retest reliabilities of resting-state FMRI measurements in human brain functional connectomics: a systems neuroscience perspective. Neurosci Biobehav Rev. 2014;45:100–118. doi: 10.1016/j.neubiorev.2014.05.009. [DOI] [PubMed] [Google Scholar]
Associated Data
This section collects any data citations, data availability statements, or supplementary materials included in this article.