

Abstract
Adoptive T cell therapies have shown significant promise in the treatment of cancer and viral diseases. One approach, that introduces antigen-specific T cell receptors (TCRs) into ex vivo activated T cells, is designed to overcome central tolerance mechanisms that prevent responses by endogenous T cell repertoires. Studies have suggested that use of higher affinity TCRs against class I MHC antigens could drive the activity of both CD4+ and CD8+ T cells, but the rules that govern the TCR binding optimal for in vivo activity are unknown. Here we describe a high-throughput platform of “reverse biochemistry” whereby a library of TCRs with a wide range of binding properties to the same antigen is introduced into T cells and adoptively transferred into mice with antigen-positive tumors. Extraction of RNA from tumor-infiltrating lymphocytes or lymphoid organs allowed high-throughput sequencing to determine which TCRs were selected in vivo. The results showed that CD8+ T cells expressing the highest affinity TCR variants were deleted in both the tumor infiltrating lymphocyte population and in peripheral lymphoid tissues. In contrast, these same high-affinity TCR variants were preferentially expressed within CD4+ T cells in the tumor, suggesting they played a role in antigen-specific tumor control. The findings thus revealed that the affinity of the transduced TCRs controlled the survival and tumor infiltration of the transferred T cells. Accordingly, the TCR library strategy enables rapid assessment of TCR binding properties that promote peripheral T cell survival and tumor elimination.
Keywords: TCR, T cell display, adoptive T cell therapy, affinity engineering, tumor targeting
INTRODUCTION
The interaction between TCR and peptide/MHC is the key recognition event initiating functional T cell responses. While much has been learned about the structure and function of this interaction 1–4, many aspects of the processes that operate in vivo remain unknown. This is particularly relevant in T cell-based cancer therapies, where the questions include what TCR binding affinities will achieve optimal destruction of tumors, drive differentiation into distinct effector types, and promote persistence of peripheral T cells.
While there are many examples of tumor-infiltrating lymphocytes (TILs) that have been isolated from human cancers 5, these T cells have rarely been cloned or their TCRs examined biochemically in binding or structural studies. The major obstacles to studying the role of binding affinity in clinically relevant TCR:pepMHC interactions involves the difficulties in the expression of soluble TCRs and the low affinities of wild-type TCRs 1. Thus, binding properties of most TCRs used in clinical trials have not been measured, nor has there been a broader study of the TCR properties that promote TIL activity, migration, or differentiation into memory T cells. Among the questions are whether there is a certain TCR affinity threshold that is absolutely required for antigen-specific T cell tumor infiltration. In the context of adoptive T cell therapies with TCR gene transfer, the questions extend to whether this affinity threshold may vary due to lower surface expression levels of the exogenous TCR, and whether different affinities drive the activities and differentiation of the plethora of T cell subsets 6–9.
Recently, strategies have been developed to delineate the fate of T cells not only on a population-wide scale but on a single-cell basis. These systems range from intravital imaging to retroviral introduction of unique DNA sequences (termed “cellular barcodes”), allowing the fate of single naïve T cells to be tracked under different conditions 10,11. While progress has been made in elucidating the mechanisms involved in T cell lineage decisions using these techniques, there remains a need to more rapidly assess the relationships between TCR binding properties and T cell function, persistence, and lineage commitment in vivo. This information would be of significant value in the choice of TCRs for adoptive T cell therapies 12–14.
Prompted by this lack of a high-throughput strategy to explore optimal tumor targeting properties of T cells with exogenous TCRs, here we describe a system based on the rational design of TCR libraries with a wide range of affinities for a model cancer antigen. To develop the system, we took advantage of the well-studied binding properties and structures of the 2C TCR 15, specific for class I MHC Kb bound to a foreign peptide SIY 16, and its high-affinity TCR variant called m33 17,18. The generation of single-amino acid substitution libraries in 2C and m33 provided a 10,000-fold range in binding affinities among the TCR variants. The approach can be applied to virtually any TCR, given that mouse and human TCRs have several CDR1 or CDR2 residues that are energetically important in MHC binding 2,3.
Here we defined, in one sorting step, TCR variants that bound with the highest affinities (the “binding signature”) to the antigen in vitro and compared them to what was selected when libraries containing these variants were introduced into CD4+ and CD8+ T cells and transferred into tumor-bearing mice. CD8+ T cells expressing the highest affinity TCRs were deleted in vivo (in the tumor and lymphoid tissues), whereas the CD4+ T cells expressing these TCRs remained in the periphery, and were present at higher levels in the tumor. However, even CD4+ T cells with the lowest affinity TCRs were capable of infiltration into the tumor. The TCR library approach provides a platform for understanding the many aspects of how TCR binding operates to control T cell function in vivo.
RESULTS
Design principles for T cell receptor libraries with diverse binding affinities
To overcome limitations with characterizing TCR binding properties of TILs, we adopted an approach in which a library of related TCRs was engineered. The strategy took advantage of findings that a single residue in CDR2 of TCR variable regions contributes significant binding energy 2,3,19,20. We used the 2C TCR and its high-affinity variant m33 (with affinity-increasing mutations in CDR3α). These TCRs bind with known affinity to the foreign peptide SIYRYYGL (SIY) and the structurally similar self-peptide EQYKFYSV (dEV8), both restricted by Kb (Fig. 1a) 21–23. 2C recognizes SIY/Kb as a strong agonist, while dEV8/Kb could potentially act in positive-selection 24. Affinities of 2C and m33 for SIY/Kb are 1000-fold different (30 μM and 30 nM, respectively), yet their affinities for dEV8/Kb are only about two-fold different (80 μM and 40 μM, respectively) 17,25. Nevertheless, CD8+ T cells (but not CD4+ T cells) that express the m33 TCR are capable of being stimulated by dEV8 17, suggesting that dEV8/Kb on normal cells in an H-2b mouse could interact productively with m33 CD8+ T cells.
Figure 1. Design and characterization of 2C and m33 Y46β libraries.

(a) Peptides recognized by the 2C and m33 TCRs in the context of Kb: the model tumor antigen SIYRYYGL (SIY) in blue and self-peptide EQYKFYSV (dEV8) in red. (b) Location of Y46β in the CDR2β of 2C and m33 relative to the α1 helix on Kb. (c) Affinity spectrum covering all Y46β library residues in 2C and m33 for the model tumor antigen SIY/Kb; m33-wt having the highest affinity (KD = 0.03 μM) and 2C-Y46βA having the lowest affinity (KD > 300 μM), representing a 10,000 fold difference. (d) Residue frequency of Y46β library, expected (teal bars) and observed for 2C (blue bars) and m33 (red bars), using the NNS library, where “N” is any base and “S” is either cytosine or guanine giving a total number of 32 possible codons. The number of sequences analyzed by 454 sequencing for the 2C library is 901 and 10,604 for the m33 library.
Two residues of the 2C CDR2β, Y46β and Y48β that dock over the α1 helix of Kb 26 are energetically important for SIY/Kb binding 20 (Fig. 1b). As the m33 alanine mutant of Y46β exhibited a 100-fold reduction in affinity 18, we reasoned that a library of all possible 20 amino acid substitutions in a single residue such as Y46β introduced into 2C and m33 would provide a wide range of affinities, over 10,000-fold (Fig. 1c). It is possible to generate TCR libraries in retroviral vectors for transducing T cells 27,28. Thus, we applied this strategy to an in vivo system, with the potential to extract information directly from TILs and lymphoid tissue, by generating position 46β libraries (NNS) in the pMP71 vector 29,30 that contained 2C and m33 TCRs with disulfide-stabilized constant regions 31–33.
While the libraries used here were relatively small (two libraries of 21 TCR variants each, including the stop codon), this strategy represents a valid way to evaluate the method, since it covers a wide range of affinities for our target and includes many variants that have not been characterized and several variants for which we have significant knowledge of the boundaries and properties of pepMHC binding. In the future, the technique need not be restricted to a single codon degeneracy:, each mouse received approximately 7x10⁶ transduced T cells, and transduction efficiencies ranged from 50–80%; a library of about 106 T cells could cover the diversity of four degenerate codons (324).
In order to examine codon frequencies present in the libraries, DNA from pMP71/TCR-transformed E. coli was subjected to PCR and 454 sequencing. The observed frequencies were consistent with expected (NNS) frequencies (Fig. 1d), although several slightly over- or under-represented codons were present within each library. Nevertheless, all amino acids were represented in the libraries, and the E. coli frequencies could be used for comparison with various frequencies “selected” in vitro and in vivo.
Strong amino acid bias in the CDR2β libraries selected in vitro for binding by SIY-Kb
To examine the importance of Tyr 46β in pepMHC binding, selections in vitro were performed. First, 2C and the 2C library were transduced separately into a T cell hybridoma that expresses CD8αβ (cell surface binding of SIY/Kb multimers by 2C requires CD8 34,35). Based on staining of the 2C/CD8+ T cells (Fig. 2a), 10 nM SIY/Kb-Ig dimers were used to sort the 2C library without interference by TCR-independent CD8 binding. After one round of sorting, RNA was isolated from the selected cells, and RT-PCR/454 sequencing was performed (Fig. 2b). While Tyr was a predominant residue, Phe and His also were highly selected. Comparison of the ratio of frequencies in the selected population versus the E. coli library revealed that five residues were selected for SIY/Kb binding (called the “binding signature” here): Phe=Tyr=His>Met=Trp (Fig. 2c). Thus, although Tyr is a preferred residue at position 46 of the CDR2β, other side chains allow significant MHC binding as well.
Figure 2. Selection of SIY/Kb-binding “signature” residues in TCRs at position 46β.

(a) SIY/Kb binding to T cell hybridoma cells transduced with 2C (left, top panel) or m33 (right, top panel) TCRs, with or without co-expression of CD8αβ, respectively. T cell hybridomas expressed with (top panels) or without (bottom panels) the TCRs were stained with the indicated concentrations of SIY/Kb Ig-dimer, followed by PE-labeled goat anti-mouse Ig, and analyzed by flow cytometry. (b) Frequency of residues from SIY/Kb-selected TCR libraries. T cell hybridomas were transduced with a library of TCRs with variation at position 46β in the 2C or m33 TCR, with or without co-expression of CD8αβ, respectively. The top 1.4% of SIY/Kb Ig dimer-binding T cells were sorted, RNA was isolated, and cDNA was used for PCR, followed by 454 sequencing. The frequencies measured for each amino acid residue at position 46β are shown for the 2C TCR library (selected with 10 nM SIY/Kb Ig-dimer, left panel, representing 29,754 sequences) and m33 TCR library (selected with 2 nM SIY/Kb Ig-dimer, right panel, representing18,560 sequences). (c) Relative representation of individual amino acid residues from the original, pre-selection library were analyzed by plotting the logarithm of the frequency of each residue in the SIY/Kb selected library divided by the frequency for that residue in the original E. coli library (Log[residue frequency, selected/residue frequency, original]). A value of +1 indicates the residue is 10-fold over-represented compared to the unselected library, while a value of −1 indicates the residue is 10-fold under-represented compared to the unselected library. Representative data are shown from four experiments. For the signature residues (Met, Phe, Trp, Tyr, and His) selected from the 2C library, the Tyr, Phe, and His residues were significantly enhanced (p<0.001). For the signature residues selected from the m33 library, the Tyr, Phe, His, and Trp residues were significantly enhanced, and the Met was significantly reduced (p<0.001)
A similar experiment was performed with m33 and the m33 library, both transduced into the T cell hybridoma without CD8 (m33 TCR does not require CD8 for staining with SIY/Kb-Ig dimers; Fig. 2a). A concentration of 2 nM SIY/Kb-Ig dimers was used for sorting, and for m33, Phe was again a predominant selected residue (Fig. 2b); relative to E. coli frequencies, a “binding signature” similar to 2C was observed (the only differences for m33 were that Trp appeared to be more prevalent, and Met less prevalent, than seen for 2C) (Fig 2c).
Antigen-bearing tumors are infiltrated by T cells transduced with libraries of high and low affinity TCRs
To apply the selection of TCR from libraries in vivo, we used SIY as a model tumor antigen 36,37. The parental melanoma line B16-F10 and the SIY-transfected line B16-SIY were used as transplantable, subcutaneous tumors for these studies 38. B16-F10 and B16-SIY tumor cells were transplanted bilaterally and five days later, when tumors were readily palpable, approximately 7 x 10⁶ T cells of various transduced preparations were introduced (Supplementary Fig. 1, 2). As a source of T cells, we used purified CD4+ or CD8+ T cell populations from C57BL/6 mice, activated in vitro with anti-CD3/anti-CD28-coated beads and IL-2. Based on previous kinetic analyses of T cell infiltration into tumors 39,40, mice were sacrificed five days after adoptive transfer for immunohistology and TCR sequence analyses.
Immunohistology of tumors showed that 2C-transduced CD8+ T cells (Fig. 3a) and 2C-transduced CD4+ T cells, but not the mock-transduced T cells, infiltrated the antigen-bearing tumors (Fig. 3b). No significant infiltration was seen by any of the T cell populations in the B16 parental tumors (data not shown). Notably, the m33-transduced CD8+ T cells were not present in B16-SIY tumors, whereas m33-transduced CD4+ T cells were present. The absence of m33-transduced CD8+ T cells is consistent with our recent observation that these cells are deleted within hours of transfer into an H-2b mouse 33. In general, 2C- or m33-transduced CD4+ cells tended to be present at lower levels than the 2C-transduced CD8+ T cells. Both CD4+ and CD8+ T cells transduced with the 2C and m33 libraries exhibited extensive infiltration into the B16-SIY tumors. Accordingly, the m33 library of TCRs in CD8+ T cells presumably had a substantial number of variants that did not result in deletion as observed for the Tyr46β m33, enabling these to migrate to the tumor. This is consistent with the finding that most of the m33 variants were not as high-affinity as the Tyr46β-containing m33 (Fig. 2b,c).
Figure 3. Infiltration by T cells transduced with 2C or m33 TCR libraries.

(a,b,c) Immunohistochemistry of B16-SIY tumors 5 days post-transfer with either transduced CD8+ (a) or CD4+ (b,c) T cells. B16-SIY tumors were stained for CD3 to visualize T cell infiltration. For CD8+ transduced T cells (a), there is a marked T cell infiltrate for 2C, 2C library and m33 library while there are no T cells found in B16-SIY tumors treated with mock or m33 T cells. For CD4+ transduced T cells (b), all four T cell populations, except mock, are detected in the tumor at day 5 post-T cell transfer. (c) B16-SIY tumor tissue section from 2C CD4+ treated mouse dual stained for total T cell infiltration (anti-CD3, green) and 2C-positive T cells (1B2, red), to show antigen specific vs. non-antigen specific T cell response. Several 1B2-negative, CD3-positive cells are shown with arrows.
In order to assess whether some of the infiltrating T cells in the B16-SIY tumors might have been non-specific, and possibly present due to antigen-specific (SIY) T cell-mediated inflammation, we stained tumor sections from 2C-transduced T cells with the clonotypic antibody 1B2 and with anti-CD3 (Fig. 3c). This staining revealed that of the CD3+ cells, approximately 60% were 1B2-positive and 40% were 1B2-negative. Thus, although antigen-specific T cells were necessary to observe significant T cell infiltration, many of the T cells present appeared to express only their endogenous TCRs and were presumably not antigen specific.
Over the five-day period prior to analysis by histology and sequencing (below), we measured tumor sizes to assess immediate functional responses. In order to easily compare 17 different treatment groups, the growth rates of the tumors (in mm3/day) were determined from measurements over the five-day period (Fig. 4). The growth rates of parental tumors (B16-F10) during this period were unaffected by any CD8+ (Fig. 4a) or CD4+ T cell treatment (data not shown). In contrast, growth of B16-SIY was completely arrested when treated with 2C-transduced CD8+ T cells (Fig. 4b). As expected from histological analysis, m33-transduced CD8+ T cells were unable to slow the growth of B16-SIY tumors. CD8+ T cells transduced with either 2C or m33 libraries were also able to control of B16-SIY tumor growth. CD4+ T cells expressing the higher affinity m33 and m33 library were both capable of slowing early growth of B16-SIY (Fig. 4b), whereas CD4+ T cells transduced with 2C or the 2C library did not show significant effects on tumor growth.
Figure 4. Antigen-specific delay in tumor growth from T cells transduced with 2C or m33 TCR libraries.

(a) Tumor growth rate for mice implanted with B16-F10 parental tumors at day 5 post-T cell transfer shows no effective response across all transduced T cell types. (b) Tumor growth rate for mice implanted with B16-SIY tumors at day 5 post-T cell transfer. For CD8+ T cells, 2C, 2C-library and m33-library T cells were able to significantly reduce growth of the antigen-bearing SIY tumor compared to mock CD8+ cells (2C CD8+ p = 0.01, 2C-library CD8+ p = 0.02, m33-library CD8+ p = 0.02) or m33 T cells, which had very little effect. In CD4+ T cells, m33 and m33-library significantly reduced tumor growth compared to mock transduced CD4+ T cells (m33 CD4+ p = 0.01, m33-library CD4+ p = 0.02), whereas wt 2C CD4+ and 2C library CD4+ did not differ from mock.
Tumor-infiltrating CD8+ T cells express diverse TCR affinities but the highest affinity TCRs are absent
Since the CD8+ T cells transduced with the 2C and m33 libraries were found at the site of B16/SIY tumors on day 5 (Fig. 3a), and these cells were capable of controlling tumor growth (Fig. 4b), we were interested in determining if there would be tumor-driven selection for TCR variants within a defined affinity range. Tumors were excised and RNA was used for RT-PCR followed by 454 sequencing of transcripts and the amino acid frequencies at position 46β were determined (Fig. 5a). TILs derived from the 2C library showed a significant bias toward the “binding signature” residues, but not to the extent of selection observed with a single sort in vitro (see Supplementary Fig. 3a, 4 for detailed statistical analyses of residue frequencies). This result is not surprising given the apparent extent of non-antigen specific infiltration that occurred in the B16/SIY tumors (Fig 3c). Thus, the “binding signature” of the 2C TILs was actually superimposed on the background of the non-antigen specific process, perhaps associated with inflammation initiated by the highest affinity SIY-specific T cells.
Figure 5. Frequencies of TCR 46β residues in TCR library-transduced T cells isolated from tumor and other tissues (in vivo selection).

(a) Comparison of relative frequencies of TCR 46β residues selected for binding SIY/Kb in vitro (left panels) with TCR 46β residues isolated from B16-SIY tumors in mice treated with CD8+ (middle panels) or CD4+ (right panels) T cells transduced with the 2C (top row) or m33 (bottom row) libraries. The averages of two independent mice are shown, and data for individual mice can be seen in Supplementary Fig. 3. For the 2C library in CD8+ T cells, analysis of signature residues (Met, Phe, Trp, Tyr, and His) appearing in the tumor showed that Tyr, Phe, Met, and His were significantly enhanced. (p<0.001). Signature residues located in the tumor from the m33 library in CD4+ T cells that are significantly enhanced are Phe, His, and Met (p<0.001) compared to a significant reduction of residues Tyr, Phe, Met, His, and Trp in the tumor of m33 library CD8+ T cells (p<0.001). (b) Relative frequencies of TCR 46β residues for T cells isolated from the draining lymph node (first and third columns) or spleen (second and fourth columns) of B16-SIY tumor-bearing mice treated with CD8+ (left two columns) or CD4+ (right two columns) T cells transduced with the 2C TCR library (top row) or the m33 TCR library (bottom row). The averages of two independent mice are shown for all samples, except for the 2C CD8+ library in the draining lymph node (6,629 sequences; one mouse) and spleen (8,809 sequences; one mouse), and for the m33 CD8+ library in the spleen (15,400; one mouse). There is a significant enhancement of Phe, Trp (p<0.001) and Tyr, His (p<0.01) found in the tumor draining lymph node from the 2C library in CD8+ T cells while Tyr, Phe and His from the same library were significantly enhanced in the spleen (p<0.001). For the 2C library in CD4+ T cells, a significant enhancement of Tyr, Phe, Met and His was found in the tumor draining lymph node (p<0.001). For the m33 library in CD8+ T cells, there is a significant reduction of residues Tyr, Phe, Met, His and Trp found in the tumor draining lymph node (p<0.001). Graphs for individual mice averaged in (a) and (b), along with the number of sequences analyzed per sample are shown in Supplementary Figure 3. A statistical approach to determine significance of amino acid selections in vivo is described in Supplementary Figures 4 and 5. The approach uses the frequencies of all 20 amino acid frequencies and the single-stop codon for each in vivo sample, in comparison with the in vitro SIY/Kb-selected frequencies.
The results of the sequencing analysis of TILs from the m33 library in CD8+ T cells was quite striking, as the SIY/Kb “binding signature” residues were strongly selected against in the B16-SIY tumors (Fig. 5a, Supplementary Fig. 3b, 5). This result is undoubtedly due to the deletion of CD8+ T cells that express the highest binding affinity, as with the Tyr46β-containing m33 (ref 33 and see below). In contrast to the loss of “binding signature” TCRs, m33 TCRs with other residues, including alanine, were now preferentially selected in the tumors. These TCRs would be expected to have affinities in the low micromolar range (e.g. KD value of about 3 μM for the m33 Y46βA mutant 18). These affinities are still considerably higher than the wild type 2C, and it is these TCRs that account for the control of B16-SIY tumor growth with the m33 library in CD8+ T cells (Fig. 4b).
Tumor-infiltrating CD4+ T cell libraries express residues with diverse TCR affinities including highest affinity TCRs
CD4+ T cells with both the 2C and m33 libraries also infiltrated the B16-SIY tumor. Thus, to examine the impact of TCR affinity on redirecting CD4+ T cells to a class I tumor antigen, transcripts from TILs of 2C and m33 libraries were sequenced. In this case, CD4+ T cells with the 2C library showed no obvious skewing (Fig. 5a, Supplementary Fig. 3a), consistent with a weak response by this diverse collection of low affinity TCRs (Fig. 4b). Nevertheless, the selective infiltration of these cells compared to the mock transduced CD4+ T cells suggest that some of the cells migrate and are retained in the tumor due to antigen specificity. CD4+ T cells transduced with the m33 library showed a distinct emergence of TCRs with the SIY/Kb “binding signature” (Fig. 5a, Supplementary Fig. 3b, 5), similar to that observed with CD8+ T cells expressing the 2C library. Thus, control of tumor growth by the m33 CD4+ T cells (Fig. 4b) was associated with skewing of TCR residues at position 46β toward higher-affinity SIY/Kb binding, whereas CD8+ T cells expressing these same TCRs were absent in the tumors.
Peripheral T cells with transduced TCRs have affinity distributions similar to TILs
The TCR library approach provides the opportunity to examine the influence of exogenous TCRs on peripheral T cell distribution and survival (e.g. the impact of 2C or m33 binding to self-peptide dEV8/Kb) 41,42. To examine these issues, various lymphoid tissues from mice with adoptively transferred T cells were examined 5 days after transfer by 454 sequencing analysis: these included the draining lymph nodes, non-draining lymph nodes, and spleens from tumor bearing mice (Fig. 5b). For the 2C library, CD8+ T cells showed modest skewing toward “signature binding” residues in draining LNs and spleen (Supplementary Fig. 3c, 4). This suggests that the 2C TCRs, probably in synergy with CD8, influenced the distribution to these tissues or the overall survival of transferred T cells, perhaps through binding to self dEV8/Kb or SIY/Kb. However, CD4+ T cells showed a more random distribution of residues in the libraries with perhaps some skewing toward “signature binding” residues in the draining LN (Fig. 5b).
Results of m33 library sequencing showed clearly that exogenous TCRs could determine the fate of peripheral T cells. In CD8+ T cells, m33 TCRs with the SIY/Kb “binding signature” residues had disappeared from lymph nodes and spleen, consistent with our recent finding that m33 transduced into CD8+ T cells also disappeared rapidly from the periphery (Fig. 5b, Supplementary Fig 3d, 5) 33. The magnitude of the disappearance (−1 on a log scale) was equivalent to a 10-fold reduction in the m33 CD8+ T cells for each of the 46β variants, Met, Phe, Trp, Tyr, His. Interestingly, m33 TCRs with the Met at 46β were among those that disappeared, yet this m33 variant was not identified in the in vitro affinity selection (Fig. 5a). This result suggests that the in vitro selection condition (2 nM SIY/Kb-Ig) differs from the threshold for TCR-mediated deletion in vivo. Presumably, the binding interactions that are associated with in vivo deletion involve self-peptide/Kb complexes such as dEV8/Kb, which for m33 have an affinity several orders of magnitude below the interactions with SIY/Kb 17. As the binding difference between 2C and m33 for dEV8 is only about two-fold, it is clear that the threshold for in vivo deletion is quite narrow.
As with the 2C library in CD4+ T cells, there was no obvious skewing of the variants from the m33 library in CD4+ T cells within the draining LNs or spleen (Fig. 5b). The data suggest that the Trp variant may have shown a two- to three-fold increase in frequency in both draining LNs and spleen, but this observation remains to be tested further.
T cells with single amino acid substitutions at position 46β reveal distinct activity profiles depending on the presence of CD8 or CD4 co-receptor
To provide a more thorough view of the SIY-specific in vitro activation profiles of individual TCR variants, we transduced CD4+ and CD8+ T cells with several TCR variants and assayed them for activity. In addition to the wild type TCRs with a Tyr at 46β, we chose both “binding signature” variants and variants that did not bind with higher affinity to SIY/Kb. As described, the variants possess binding affinities that range from 30 nM (e.g. m33 Y46β) to lower than 300 μM (e.g. Y46βA of 2C).
To examine the TCRs at the lower range of affinities, retrovirus vectors encoding tyrosine (wt), alanine, phenylalanine, methionine, glycine or leucine at 46β for the 2C TCR were transduced into CD8+ (Fig. 6a) or CD4+ (Fig. 6b) T cells from C57BL/6 mice. Transduced cells were stimulated with: 1) anti-CD3, 2) SIY-pulsed antigen-presenting cell line T2-Kb, 3) the null peptide OVA-pulsed antigen-presenting cell line T2-Kb, or 4) transduced cells alone. We have shown previously that in the presence of CD8, TCRs can exhibit KD values as low as 300 μM yet still retain significant peptide-specific activity 43. In line with this phenomenal ability of CD8 to synergize with very low affinity TCRs, all of the 2C variants including the alanine variant, were stimulated by SIY/Kb (Fig. 6a). These results are consistent with the ability of the CD8+ T cells transduced with the 2C library to infiltrate the tumor (Fig. 3a), and to exhibit significant SIY-specific anti-tumor effects (Fig. 4b).
Figure 6. In vitro activity of primary T cells transduced with individual amino acid residues at 46β.
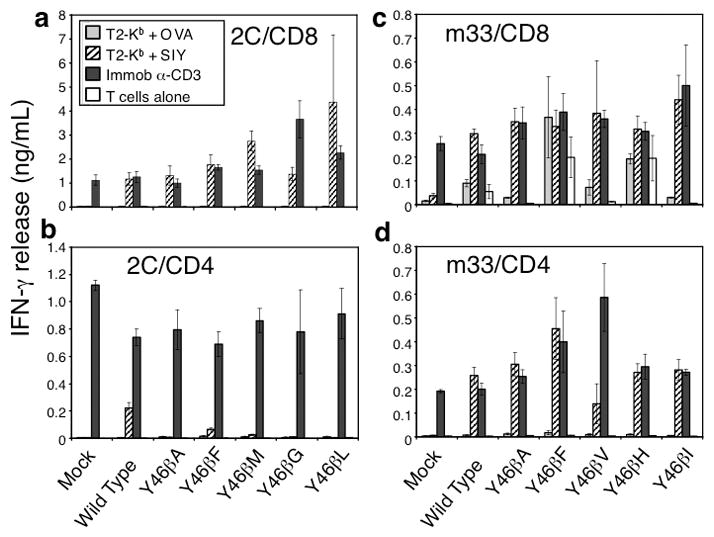
CD8+ or CD4+ positive C57Bl/6 T cells were isolated and transduced with either 2C (left panel) or m33 (right panel) DNA encoding single amino acid residues at 46β. T cell populations were incubated with indicated stimulus for 24 hours and assayed for IFN-γ production. OVA and SIY peptides were added at 10 μM with T2-Kb cells. Error bars represent standard deviation of two separate experiments performed with each variant.
In contrast to CD8+ T cells, the CD4+ T cells transduced with the same 2C TCR variants showed very low activity (wild type Tyr; Phe) or no activity (Ala, Met, Gly, Leu) (Fig. 6b, note the different scale). Thus, the 2C TCR is near the threshold for CD4+ T cell activity, and is suboptimal for induction of these cells. Interestingly, the minimal activity associated with a few of the variants in the library must be adequate to drive SIY-specific infiltration (Fig. 3a); however, as described above, many of the inactive variants in the library may be recruited to the tumor in an antigen non-specific process.
To examine the TCRs at the higher range of affinities, retrovirus vectors encoding tyrosine, alanine, phenylalanine, valine, histidine or isoleucine at 46β for the m33 TCR were transduced into CD8+ (Fig. 6c) or CD4+ (Fig. 6d) T cells from C57BL/6 mice. These TCRs exhibit affinities in the range of 30 nM (Tyr) to at least 3 μM (Y46βA), which is still ten-times higher affinity than the 2C wild type TCR. As we have shown previously with the m33 TCR in a CD8+ T cell hybridoma 17, the m33 TCR in CD8+ T cells mediated activation by self-pepMHC, even in the absence of SIY or OVA, although the level of activation was increased in the presence of SIY peptide (Fig. 6c). Similarly, CD8+ T cells expressing m33 TCRs with other “binding signature” residues (Phe, His) also showed self-peptide/MHC reactivity. These results are consistent with the finding that CD8+ T cells with these TCRs (m33 Tyr, Phe, and His at 46β) were deleted in vivo (Fig. 5). The three variants, Ala, Val, and Ile did not show significant stimulation with self-peptide/MHC in vitro, although they were stimulated effectively by SIY. Furthermore, these variants were not deleted in vivo, suggesting that in vitro self-peptide MHC activation results provide a useful surrogate indicator of in vivo CD8+ T cell deletion.
CD4+ T cells transduced with these same m33 TCR variants showed very strong, SIY-specific activity, although the Val variant was slightly reduced compared to the others (Fig. 6d). These results indicate that almost all of the m33 variants would be superior to the wild type 2C TCR in mediating CD4+ T cell activity, consistent with the prediction that they have higher affinities for SIY/Kb than the 2C TCR. These results also explain why the m33 library was superior to either 2C wt or 2C library in the control of the B16-SIY tumor (Fig. 4b).
DISCUSSION
The system described here, with TCR libraries exhibiting a wide range of affinities for a class I pepMHC ligand, provides an opportunity to rapidly assess the TCR-binding properties associated with various T cell processes. TCR libraries transduced into polyclonal CD8+ T cells revealed the importance of choosing TCRs with affinities below a critical deletion threshold; T cells with TCRs above this threshold were rapidly eliminated. This process occurred with wt m33 in the absence of SIY antigen 33. While CD8+ T cells with the m33 “binding signature” residues were eliminated, those variants with reduced affinity (e.g. alanine) remained. These “lower” affinity m33 variants are still considerably higher affinity than the wt 2C TCR, and were fully capable of mediating antigen-specific CD8+ T cell activity and tumor inhibition. Perhaps related to the effects with the m33 CD8+ T cell results, TCR transgenic CD4+ T cells with higher affinity and effective activity in vitro against a class II ligand exhibited reduced activity in vivo 44.
The ability of CD4+ T cells expressing 2C and 2C library TCRs to traffic to the tumor was surprising given their relatively low affinities (e.g. KD = 30 –300 μM). Upon histological examination of tumors with transduced 2C CD4+ T cells, the majority of T cells present were not 2C (1B2+) (Fig 3c). This process was dependent on some infiltration of antigen-specific T cells (1B2+ in this case), as mock-transduced CD4 (or CD8) T cells were not present in the tumor at day 5 (Fig. 3a, b). The phenomenon of non-antigen specific T cell recruitment has been shown in a Th1 – driven delayed type hypersensitivity model which illustrated inflammation at the site of antigen injection was caused by the release of TNF-α and INF-γ from the arrival of a very few number of antigen specific T cells, leading to the infiltration of a large number of non-antigen specific T cells 45. Non-antigen specific recruitment of both CD4 and CD8+ T cells, dependent on an inflammatory environment promoted by the antigen-specific T cells, most likely explains the level of infiltration of non-antigen specific CD4+ T cells into tumors treated with 2C or 2C library. For example, it appears that over 80% of the TCRs in the 2C TCR library in CD4+ T cells did not respond to the SIY tumor antigen by IFN-γ release (Fig 6b), yet sequencing of transcripts from CD4+ TILs showed the presence of all residues within the library, with no obvious bias toward TCRs containing a particular residue(s) (Fig. 5a).
The importance of antigen specificity in tumor infiltration and control by the transduced T cells was apparent by various findings. For example, mock-transduced CD4+ or CD8+ T cells were not found in antigen-bearing tumors on day 5 (Fig. 3) and there was no infiltration of T cell populations in the parental tumor B16-F10, which lacks the SIY antigen, on day 5 (data not shown). This result contrasts with a previous finding that showed trafficking of gp100-specific CD8+ T cells to both a gp100-positive tumor and a gp100-negative tumor implanted contralaterally 46. Differences in T cell activation status could possibly account for the differences between the two studies; T cells in the gp100 study were transgenic and activated in vivo with gp100 vaccine and repeated high doses of IL-2, whereas our study used polyclonal T cells, activated in vitro with anti-CD3/anti-CD28 beads and lower doses of IL-2 followed by transduction with antigen-specific TCRs before transfer; neither a vaccine or IL-2 were included in our study. It is also possible that the antigen specificity of T cell infiltration varies among tumor models. For example, bioluminescence imaging studies using different tumor models showed only antigen-specific CD8+ T cell infiltration into EL4 tumors, but non-specific infiltration into MCA-205 tumors 47. The non-specific infiltration into antigen-negative MCA-205 tumors showed delayed kinetics compared to the antigen-positive tumors. In our model we examined tumors only at day 5, so it is possible some infiltration in the B16 parental tumor might have occurred later. As such, it will be important to examine if the extent or kinetics of T cell infiltration differ depending on these conditions (i.e. tumor model, transgenic vs. transduced T cells, activating conditions) and perhaps even between CD4+ and CD8+ T cells.
For clinical application of this therapy, the ideal scenario would be to introduce a single TCR with an affinity that is optimal for activity in both CD4+ and CD8+ T cells. The TCR library approach described here suggests that the optimal affinities will differ for CD4+ and CD8+ T cells, but that if a single TCR is to be chosen, for use in both CD4+ and CD8+ T cells, it would be one that exhibits an affinity above 2C but below m33. Such a candidate TCR would include the alanine variant of m33 which exhibited potent CD4+ and CD8+ T cell activity in vitro, no detectable self-reactivity in CD8+ T cells, minimal in vivo deletion in CD8+ T cells, and persistence in tumors and peripheral lymphoid organs at day 5. Efforts are in progress to examine the activity of this variant compared to the wild type 2C and m33 TCRs.
The design principles of the TCR libraries described here can be extended to other TCRs, as it is now clear that one or a few specific CDR1 or CDR2 residues provide significant binding energies in the interactions with the MHC restricting elements 2,3. Accordingly, these residues not only influence binding to the agonist pepMHC ligand, but they determine the in vivo properties of T cells that depend on interactions between the TCR and self-pepMHC (e.g. in persistence and homeostatic proliferation) 42. This is indeed why the TCRs with “binding signature” residues in the m33 library were deleted, presumably by binding to self-pepMHC, such as dEV8/Kb. Consistent with the hypothesis that Tyr46β of the Vβ8 region evolved to bind MHC, there was clear selection for TCRs with this residue (i.e. binding selection based on in vitro experiments, and in vivo CD8+ T cell deletion in the periphery). However, amino acids at this position with alternative, conserved side chains (e.g. Phe) also mediated efficient binding indicating that there is not a strict evolutionary selection for only tyrosine at position 46β. In this respect, it is also important to point out that this approach (TCR libraries) will allow the analysis of in vivo MHC-based selections to be examined without having to examine single-site mutations one at a time, as has been done previously 48.
The studies described here also raise the possibility that different T cell subsets will be optimally recruited with TCRs of different affinities against the class I MHC antigen. Accordingly, TCRs with different affinities might: 1) mediate distinct effector functions, 2) direct T cells toward different lineages, or 3) control memory T cell development 49. In this regard, recent studies have revealed that TCR/class II MHC affinity plays a role in the induction of Foxp3 50, yet the relationships of TCR affinity with each of these properties (especially in a CD4, class I-specific system) remain to be determined. The TCR library approach described here provides a system to dissect these issues. Finally, it should be possible to use higher affinity human TCRs as templates for the approach 51–53. Similarly, a library-based in vivo strategy should be applicable to optimizing adoptive T cell therapies mediated by CARs through engineering of their CDR residues, or perhaps even their signaling domains 54,55.
MATERIALS AND METHODS
TCR retrovirus constructs and libraries
The TCR gene, codon optimized for expression in murine T cells (GeneArt, Regensburg, Germany), was cloned in as 2Cβ – P2A – 2Cα or m33α using the Not I restriction site at the 5′ end and EcoRI restriction site at the 3′ end into the MP71 retroviral vector. MP71 contains the LTR (long terminal repeat) from the myeloproliferative sarcoma virus and an improved 5′ untranslated sequence from the murine embryonic stem cell virus 56. For construction of the libraries, all oligonucleotide primers were ordered from Integrated DNA Technologies (IDT, Coralville, Iowa, USA). Two sets of primers were used in the construction of the library at position 46 of the CDR2β. Primer set 1 Forward 5′ – CAAGCTCACTTACAGGCGGCCGCCACCATGAGCAACACC – 3′, Primer set 1 Reverse 5′ – GTGGATCAGTCTCAGTCCGTGGCCGGTGTCCTG – 3′. Primer set 2 contains the oligonucleotide primer with the degeneracy (underlined) at position 46: Primer set 2 Forward 5′-ACCGGCCACGGACTGAGACTGATCCACNNSAGCTACGGCGCTGGCAGCACCGAGAAGGGC – 3′, Primer set 2 Reverse 5′ – GGCCATCAGCACCAGTCCGGACAC – 3′. The two products from these reactions are then used to create the library product using the forward primer from set 1 and the reverse primer from set 2 by splice-overlap extension (SOE). The resulting PCR product from the second PCR reaction can be sequenced to ascertain if diversity exists at codon 46β. The PCR product containing the library was cloned into either 2C or m33-MP71 using the In-Fusion reaction kit (Clontech, Moutain View, CA, USA) via the Not I and BspE I restriction sites. Product from the In-Fusion reaction was added to Turbo Competent – High Efficiency E. coli (New England Biolabs) for transformation. Resulting transformants were plated on LB/Ampicillin and grown overnight at 37°C at which time DNA was isolated from individual colonies (Qiagen) to confirm library diversity at position 46 in the CDR2β.
Retrovirus production and transduction of T cells
The retroviral packaging line, Plat E 57 was plated at 4 x 10⁶ cells per 10 cm dish in DMEM (supplemented with 10% FCS, 2 mM L-glu and pen/strep). Twenty-four hours after plating, cells were transfected with 40 μg of retroviral DNA (either wild-type or library) via Lipofectamine 2000 transfection reagent (Invitrogen, Carlsbad, CA, USA). Four hours post-transfection, the transfection mixture was aspirated and Plat E washed once with T cell media (IMDM + 10% FCS, 2 mM L-glu, 50 mM 2-mercaptoethanol, pen/strep), aspirated and replenished with 6 mL of fresh T cell media. Forty-eight hours post-transfection, the supernatant containing the packaged virus was harvested and passed through a 0.45 μm syringe filter to remove any cellular debris/particulates.
Spleens from C57BL/6 mice were harvested and passed through a 100 μm filter to obtain a single cell suspension. Following red blood cell lysis, either CD8+ or CD4+ T cells were isolated from the splenocyte population by negative selection using the mouse CD8α+ or CD4 T cell Isolation Kit II (Miltenyi, Germany). 106 isolated cells were plated per well in a 24-well dish in 1 mL of fresh T cell media. Each well of 106 T cells was incubated with 25 μL of anti-CD3/anti-CD28 mouse T-activator Dynabeads (Invitrogen) in addition to 30 U of recombinant mouse IL-2 (Roche, Germany) for 24 hours. After Dynabead removal, activated T cells (in 1 mL) were added to a 24-well plate pre-coated with 15 μg/mL of Retronectin (Takara, Japan) followed by 1 mL of retroviral supernatant with an additional 60 U of recombinant mouse IL-2. The plate was then centrifuged at 2000 x g for 1 hour at 30°C. After centrifugation, the plate was incubated at 37°C, 5% CO2 for 48 hours before analysis of TCR transgene expression by FACS via Vβ8.1/8.2 (BD Pharmingen). CD4 or CD8 expression was confirmed using anti-CD4:APC conjugated antibody clone RM4-5 (BD Pharmingen) or anti-CD8α:APC conjugated antibody clone 53–6.7 (eBioscience).
In vitro sorting of highest affinity TCRs
58−/− T cell hybridomas were transduced with m33 wild-type TCR or the m33 Y46β library, and 58−/− co-expressing CD8αβ were transduced 2C wild-type TCR or the 2C Y46β library. To find a sensitive ligand binding concentration without background from TCR-negative cells, the wild-type TCR-expressing hybridomas were stained with SIY/Kb Ig dimers at various concentrations in phosphate buffered saline with 0.5% bovine serum albumin (PBS-BSA) on ice, washed, and stained with goat anti-mouse labeled with phycoerythrin. Cells were washed with PBS-BSA and analyzed on an Accuri C6 flow cytometer. From those data, a SIY/Kb Ig dimer concentration of 10 nM was selected to sort the 2C library, and 2 nM was selected to sort the m33 library. Library-expressing T cells were stained as before, and sorted under sterile conditions on a BD FACSAria, collecting the 1.4% top binding cells for both the 2C and the m33 library. The cells were expanded briefly in culture after sorting, followed by RNA isolation and sequence analysis (see below).
Sequencing of TCR transcripts
To isolate total RNA from a T cell suspension or tumor tissue, up to 107 cells were pelleted (for T cell suspension of 58−/− hybridoma) or up to 100 mg of tissue were dissociated (for tissue). TRIzol RNA extraction was carried out on the pelleted cells or dissociated tissue using the PureLink RNA Mini Kit (Invitrogen). From isolated RNA, total cDNA was prepared using the QuantiTect Reverse Transcription Kit (Qiagen). TCR Vβ8 genes were amplified from the total cDNA using sequence-specific primers that included tags and sorting sequences for use in 454 Next Generation Sequencing. TCR genes from multiple tissues were each amplified with a unique sorting sequence in the amplification primers. Vβ8 amplicons were purified using AMPure XP Beads (Agencourt), and the concentration of each was measured using a Qubit dsDNA HS Detection Kit and Qubit 2.0 Fluorometer (Invitrogen). Amplicons with different sorting sequences were combined at equal mass ratios into a single sequencing sample. Uniformity of amplicon size was verified using an Agilent 2100 Bioanalyzer (Agilent). Sequence analysis of individual DNA strands within each amplicon mixture was performed on a Roche/454 Genome Sequencer FLX+ (Roche). Bioanalysis and 454 sequencing was carried out at the W.M. Keck Center for Comparative and Functional Genomics (University of Illinois, Urbana-Champaign). Sequences were sorted by unique tag (to each tissue/cDNA preparation) within each sample. Between 900–35,000 sequences were obtained for each cDNA preparation (total library size of 32 codons). Within the complete sequence set for each tissue, the occurrence of each codon in the library for TCRβ46 was enumerated by searching for the unique string for each library codon in Microsoft Word (Microsoft). For amino acids encoded by multiple codons, the total occurrences were added together to give an overall amino acid frequency. Selection bias for individual TCRs was calculated by taking the logarithm of the post-selection frequency of each TCR variant (in vitro SIY/Kb dimer sort or in vivo TIL or lymphoid tissue) divided by the frequency of each TCR variant in the original, pre-selection library as propagated in E. coli to give the equation: Log[(frequency of TCR variant, selected)/(frequency of TCR variant, E. coli)]. A value of +1 indicates the residue is 10-fold over-represented compared to the unselected library, while a value of -1 indicates the residue is 10-fold under-represented compared to the unselected library.
Tumor cell lines and transplantable model
C57BL/6 and C57BL/6 Rag1−/− mice originally purchased from The Jackson Laboratory (Bar Harbor, ME) were maintained as colonies in the animal facilities at the University of Illinois. Mice were 2–5 months of age at the time of experiments and all animal studies were approved by the Institutional Animal Care and Use Committee at the University of Illinois at Urbana-Champaign. The B16 F10 murine melanoma cell line was purchased from American Type Culture Collection (Manassas, VA) and B16-SIY murine melanoma cell line was a gift from Dr. Thomas Gajewski (University of Chicago, IL). B16-SIY cancer cells were derived by retroviral transduction of B16 F10 cells with a fusion protein of the Kb-binding peptide SIYRYYGL (SIY) and enhanced green fluorescent protein (EGFP) 38,58. The cell lines were grown in complete RPMI 1640 medium supplemented with 5 mM HEPES, 10% fetal bovine serum (FBS), 1.3 mM L-glutamine, 50 μM 2-ME, penicillin, and streptomycin at 37°C in 5% CO2 in a humidified incubator.
Melanoma tumor cells were trypsinized, centrifuged at 1,200 rpm for 7 min at 4°C, and washed twice with Hanks Balanced Salt Solution (HBSS, Cellgro Mediatech Inc). Cells were suspended in HBSS at a concentration of 1–1.5 x 10⁶ cells/150 μl and injected subcutaneously (s.c.) into the right and left flank of shaved mice under isoflurane (Baxter) inhalation anesthesia. Mock transduced and TCR-transduced T cells were collected from 24-well plates and washed twice with HBSS. Mice were injected with saline, mock transduced or TCR-transduced T cells into the tail vein, 5 days after tumor implantation. The length and width of s.c tumor masses were measured with a caliper. Tumor volume was expressed as (length × (width2))/2. Mice euthanized five days after transfer of transduced T cells had subcutaneous tumors harvested and processed for immunohistochemistry or isolation of TCR DNA.
Immunohistology
Rabbit anti-mouse CD3 gamma monoclonal antibody was purchased from Epitomics (Burlingame, CA). DyLight 594-AffiniPure F(ab′)2 Fragment Donkey Anti-Rabbit IgG (H+L) was purchased from Jackson ImmunoResearch Laboratories (West Grove, PA).
Mice were sacrificed 5 days following transfer of mock and TCR-transduced T cells. The tumors were embedded in OCT medium. Staining was performed on 8-micron cryostat sections, mildly fixed by incubation in 95% ethanol at −20°C for 20 min. Blocking was done with SuperBlock (ThermoScientific) and 5% normal donkey serum. Anti-CD3 gamma primary Ab was applied at 1:100 dilution for 24 h in blocking solution with 20% PBS/Glycerol. Tissue sections were incubated with donkey anti rabbit secondary Ab at a concentration of 7.5 μg/ml for 1 h.
In vitro stimulation of primary T cells
C57Bl/6 T cells were isolated and transduced (as described above) with retrovirus vectors containing 2C or m33 TCR variants with substitutions of individual amino acid residues at position 46β. Transduced T cells (5 x 10⁴) were incubated with: 1) 5 x 10⁴ of the lymphoblastoma antigen-presenting cell line T2-Kb with either SIYRYYGL (SIY) or SIINFEKL (OVA) peptide at concentrations of 10 μM, 2) 10 μg/mL of anti-CD3 (clone 145-2C11), or 3) media (transduced T cells only). After 24 hours supernatants were assayed for IFN-γ using the Mouse IFN gamma ELISA Ready-Set-GO kit (eBioscience, San Diego, USA).
Statistical analyses
Tumor growth rates and volume measurements were compared using a one-way analysis of variance followed by comparisons of individual treatments using the Bonnferoni correction for multiple comparisons (Graphpad Prism). Transfectants in CD4+ and CD8+ cells were compared with their respective mock transfectants. Individual p values are given in figure captions. Selection of the highest binding TCR variants in vitro (Fig. 2b,c) shows representative data from four independent experiments, while in vivo selections of tumor infiltrating lymphocytes or T cells in various lymphoid tissues (Fig. 5) show the average values of two mice, where TCR variant selection in individual mice is shown in Supplementary Fig. 3, including the number of sequences analyzed from each tissue. Statistical significance of differences in residue frequencies after in vitro or in vivo selection (Figs. 2, 5) compared to pre-selection library frequencies from E. coli were calculated using a standard chi-squared test of significance. Values for significance of individual TCR variant selection in tumors and tissues (p values) are given in the figure legends for “binding signature” residues in those tumors or tissues where the signature residues were significantly enhanced or reduced (see Supplementary Figs. 4, 5).
Supplementary Material
Acknowledgments
The authors would like to thank Janie Frye for her assistance with RNA isolation, Tom Gajewski for his gift of B16-SIY, Barbara Pilas and Ben Montez in the University of Illinois Flow Cytometry Facility for assistance with in vitro cell sorting, and Alvaro Hernandez and Chris Wright at the University of Illinois High-Throughput Sequencing and Genotyping Unit for assistance with 454 sequence analysis. This work was supported by NIH grant CA097296 (to DMK and HS) and a grant from the Melanoma Research Alliance (to DMK). BE was supported by a Research Fellowship of the DFG; JDS was supported by the Samuel and Ruth Engelberg/Irvington Institute Fellowship of the Cancer Research Institute.
References
- 1.Rudolph MG, Stanfield RL, Wilson IA. How TCRs bind MHCs, peptides, and coreceptors. Annu Rev Immunol. 2006;24:419–466. doi: 10.1146/annurev.immunol.23.021704.115658. [DOI] [PubMed] [Google Scholar]
- 2.Garcia KC, Adams JJ, Feng D, Ely LK. The molecular basis of TCR germline bias for MHC is surprisingly simple. Nat Immunol. 2009;10:143–147. doi: 10.1038/ni.f.219. [DOI] [PMC free article] [PubMed] [Google Scholar]
- 3.Marrack P, Scott-Browne JP, Dai S, Gapin L, Kappler JW. Evolutionarily conserved amino acids that control TCR-MHC interaction. Annu Rev Immunol. 2008;26:171–203. doi: 10.1146/annurev.immunol.26.021607.090421. [DOI] [PMC free article] [PubMed] [Google Scholar]
- 4.Gras S, Kjer-Nielsen L, Burrows SR, McCluskey J, Rossjohn J. T-cell receptor bias and immunity. Curr Opin Immunol. 2008;20:119–125. doi: 10.1016/j.coi.2007.12.001. [DOI] [PubMed] [Google Scholar]
- 5.Dudley ME, Rosenberg SA. Adoptive-cell-transfer therapy for the treatment of patients with cancer. Nat Rev Cancer. 2003;3:666–675. doi: 10.1038/nrc1167. [DOI] [PMC free article] [PubMed] [Google Scholar]
- 6.Gattinoni L, Powell DJ, Jr, Rosenberg SA, Restifo NP. Adoptive immunotherapy for cancer: building on success. Nat Rev Immunol. 2006;6:383–393. doi: 10.1038/nri1842. [DOI] [PMC free article] [PubMed] [Google Scholar]
- 7.Schmitt TM, Ragnarsson GB, Greenberg PD. T cell receptor gene therapy for cancer. Hum Gene Ther. 2009;20:1240–1248. doi: 10.1089/hum.2009.146. [DOI] [PMC free article] [PubMed] [Google Scholar]
- 8.Bendle GM, Haanen JB, Schumacher TN. Preclinical development of T cell receptor gene therapy. Curr Opin Immunol. 2009;21:209–214. doi: 10.1016/j.coi.2009.02.007. [DOI] [PubMed] [Google Scholar]
- 9.Schumacher TN, Restifo NP. Adoptive T cell therapy of cancer. Curr Opin Immunol. 2009;21:187–189. doi: 10.1016/j.coi.2009.03.006. [DOI] [PMC free article] [PubMed] [Google Scholar]
- 10.Schepers K, Swart E, van Heijst JW, Gerlach C, Castrucci M, Sie D, et al. Dissecting T cell lineage relationships by cellular barcoding. J Exp Med. 2008;205:2309–2318. doi: 10.1084/jem.20072462. [DOI] [PMC free article] [PubMed] [Google Scholar]
- 11.Gerlach C, van Heijst JW, Swart E, Sie D, Armstrong N, Kerkhoven RM, et al. One naive T cell, multiple fates in CD8+ T cell differentiation. J Exp Med. 2010;207:1235–1246. doi: 10.1084/jem.20091175. [DOI] [PMC free article] [PubMed] [Google Scholar]
- 12.Morgan RA, Dudley ME, Wunderlich JR, Hughes MS, Yang JC, Sherry RM, et al. Cancer regression in patients after transfer of genetically engineered lymphocytes. Science. 2006;314:126–129. doi: 10.1126/science.1129003. [DOI] [PMC free article] [PubMed] [Google Scholar]
- 13.Johnson LA, Morgan RA, Dudley ME, Cassard L, Yang JC, Hughes MS, et al. Gene therapy with human and mouse T-cell receptors mediates cancer regression and targets normal tissues expressing cognate antigen. Blood. 2009;114:535–546. doi: 10.1182/blood-2009-03-211714. [DOI] [PMC free article] [PubMed] [Google Scholar]
- 14.Rosenberg SA. Of mice, not men: no evidence for graft-versus-host disease in humans receiving T-cell receptor-transduced autologous T cells. Mol Ther. 2010;18:1744–1745. doi: 10.1038/mt.2010.195. [DOI] [PMC free article] [PubMed] [Google Scholar]
- 15.Chen J, Eisen HN, Kranz DM. A model T-cell receptor system for studying memory T-cell development. Microbes Infect. 2003;5:233–240. doi: 10.1016/s1286-4579(03)00016-9. [DOI] [PubMed] [Google Scholar]
- 16.Udaka K, Wiesmuller K, Kienle S, Jung G, Walden P. Self-MHC-restricted peptides recognized by an alloreactive T-lymphocyte clone. J Immunol. 1996;157:670–678. [PubMed] [Google Scholar]
- 17.Holler PD, Chlewicki LK, Kranz DM. TCRs with high affinity for foreign pMHC show self-reactivity. Nat Immunol. 2003;4:55–62. doi: 10.1038/ni863. [DOI] [PubMed] [Google Scholar]
- 18.Chervin AS, Stone JD, Holler PD, Bai A, Chen J, Eisen HN, et al. The impact of TCR-binding properties and antigen presentation format on T cell responsiveness. J Immunol. 2009;183:1166–1178. doi: 10.4049/jimmunol.0900054. [DOI] [PMC free article] [PubMed] [Google Scholar]
- 19.Manning TC, Schlueter CJ, Brodnicki TC, Parke EA, Speir JA, Garcia KC, et al. Alanine scanning mutagenesis of an alphabeta T cell receptor: mapping the energy of antigen recognition. Immunity. 1998;8:413–425. doi: 10.1016/s1074-7613(00)80547-6. [DOI] [PubMed] [Google Scholar]
- 20.Lee PU, Churchill HR, Daniels M, Jameson SC, Kranz DM. Role of 2C T cell receptor residues in the binding of self- and allo- major histocompatibility complexes. J Exp Med. 2000;191:1355–1364. doi: 10.1084/jem.191.8.1355. [DOI] [PMC free article] [PubMed] [Google Scholar]
- 21.Tallquist MD, Yun TJ, Pease LR. A single T cell receptor recognizes structurally distinct MHC/peptide complexes with high specificity. J Exp Med. 1996;184:1017–1026. doi: 10.1084/jem.184.3.1017. [DOI] [PMC free article] [PubMed] [Google Scholar]
- 22.Garcia KC, Tallquist MD, Pease LR, Brunmark A, Scott CA, Degano M, et al. Alphabeta T cell receptor interactions with syngeneic and allogeneic ligands: affinity measurements and crystallization. Proc Natl Acad Sci U S A. 1997;94:13838–13843. doi: 10.1073/pnas.94.25.13838. [DOI] [PMC free article] [PubMed] [Google Scholar]
- 23.Garcia KC, Degano M, Stanfield RL, Brunmark A, Jackson MR, Peterson PA, et al. An alphabeta T cell receptor structure at 2. 5 A and its orientation in the TCR-MHC complex. Science. 1996;274:209–219. doi: 10.1126/science.274.5285.209. [DOI] [PubMed] [Google Scholar]
- 24.Santori FR, Kieper WC, Brown SM, Lu Y, Neubert TA, Johnson KL, et al. Rare, structurally homologous self-peptides promote thymocyte positive selection. Immunity. 2002;17:131–142. doi: 10.1016/s1074-7613(02)00361-8. [DOI] [PubMed] [Google Scholar]
- 25.Holler PD, Kranz DM. Quantitative analysis of the contribution of TCR/pepMHC affinity and CD8 to T cell activation. Immunity. 2003;18:255–264. doi: 10.1016/s1074-7613(03)00019-0. [DOI] [PubMed] [Google Scholar]
- 26.Degano M, Garcia KC, Apostolopoulos V, Rudolph MG, Teyton L, Wilson IA. A functional hot spot for antigen recognition in a superagonist TCR/MHC complex. Immunity. 2000;12:251–261. doi: 10.1016/s1074-7613(00)80178-8. [DOI] [PubMed] [Google Scholar]
- 27.Kessels HW, van Den Boom MD, Spits H, Hooijberg E, Schumacher TN. Changing T cell specificity by retroviral T cell receptor display. Proc Natl Acad Sci U S A. 2000;97:14578–14583. doi: 10.1073/pnas.97.26.14578. [DOI] [PMC free article] [PubMed] [Google Scholar]
- 28.Chervin AS, Aggen DH, Raseman JM, Kranz DM. Engineering higher affinity T cell receptors using a T cell display system. J Immunol Methods. 2008;339:175–184. doi: 10.1016/j.jim.2008.09.016. [DOI] [PMC free article] [PubMed] [Google Scholar]
- 29.Engels B, Noessner E, Frankenberger B, Blankenstein T, Schendel DJ, Uckert W. Redirecting human T lymphocytes toward renal cell carcinoma specificity by retroviral transfer of T cell receptor genes. Hum Gene Ther. 2005;16:799–810. doi: 10.1089/hum.2005.16.799. [DOI] [PubMed] [Google Scholar]
- 30.Schambach A, Wodrich H, Hildinger M, Bohne J, Krausslich HG, Baum C. Context dependence of different modules for posttranscriptional enhancement of gene expression from retroviral vectors. Mol Ther. 2000;2:435–445. doi: 10.1006/mthe.2000.0191. [DOI] [PubMed] [Google Scholar]
- 31.Kuball J, Dossett ML, Wolfl M, Ho WY, Voss RH, Fowler C, et al. Facilitating matched pairing and expression of TCR chains introduced into human T cells. Blood. 2007;109:2331–2338. doi: 10.1182/blood-2006-05-023069. [DOI] [PMC free article] [PubMed] [Google Scholar]
- 32.Cohen CJ, Li YF, El-Gamil M, Robbins PF, Rosenberg SA, Morgan RA. Enhanced antitumor activity of T cells engineered to express T-cell receptors with a second disulfide bond. Cancer Res. 2007;67:3898–3903. doi: 10.1158/0008-5472.CAN-06-3986. [DOI] [PMC free article] [PubMed] [Google Scholar]
- 33.Engels B, Chervin AS, Sant AJ, Kranz DM, Schreiber H. Long-term persistence of CD4(+) but rapid disappearance of CD8(+) T cells expressing an MHC class I-restricted TCR of nanomolar affinity. Mol Ther. 2012;20:652–660. doi: 10.1038/mt.2011.286. [DOI] [PMC free article] [PubMed] [Google Scholar]
- 34.Daniels MA, Jameson SC. Critical role for CD8 in T cell receptor binding and activation by Peptide/Major histocompatibility complex multimers. J Exp Med. 2000;191:335–346. doi: 10.1084/jem.191.2.335. [DOI] [PMC free article] [PubMed] [Google Scholar]
- 35.Cho BK, Lian KC, Lee P, Brunmark A, McKinley C, Chen J, et al. Differences in antigen recognition and cytolytic activity of CD8(+) and CD8(−) T cells that express the same antigen-specific receptor. Proc Natl Acad Sci U S A. 2001;98:1723–1727. doi: 10.1073/pnas.98.4.1723. [DOI] [PMC free article] [PubMed] [Google Scholar]
- 36.Spiotto MT, Rowley DA, Schreiber H. Bystander elimination of antigen loss variants in established tumors. Nat Med. 2004;10:294–298. doi: 10.1038/nm999. [DOI] [PubMed] [Google Scholar]
- 37.Cheung AF, Dupage MJ, Dong HK, Chen J, Jacks T. Regulated expression of a tumor-associated antigen reveals multiple levels of T-cell tolerance in a mouse model of lung cancer. Cancer Res. 2008;68:9459–9468. doi: 10.1158/0008-5472.CAN-08-2634. [DOI] [PMC free article] [PubMed] [Google Scholar]
- 38.Blank C, Brown I, Peterson AC, Spiotto M, Iwai Y, Honjo T, et al. PD-L1/B7H-1 inhibits the effector phase of tumor rejection by T cell receptor (TCR) transgenic CD8+ T cells. Cancer Res. 2004;64:1140–1145. doi: 10.1158/0008-5472.can-03-3259. [DOI] [PubMed] [Google Scholar]
- 39.Koya RC, Mok S, Comin-Anduix B, Chodon T, Radu CG, Nishimura MI, et al. Kinetic phases of distribution and tumor targeting by T cell receptor engineered lymphocytes inducing robust antitumor responses. Proc Natl Acad Sci U S A. 2010;107:14286–14291. doi: 10.1073/pnas.1008300107. [DOI] [PMC free article] [PubMed] [Google Scholar]
- 40.Thomas DL, Kim M, Bowerman NA, Narayanan S, Kranz DM, Schreiber H, et al. Recurrence of intracranial tumors following adoptive T cell therapy can be prevented by direct and indirect killing aided by high levels of tumor antigen cross-presented on stromal cells. J Immunol. 2009;183:1828–1837. doi: 10.4049/jimmunol.0802322. [DOI] [PubMed] [Google Scholar]
- 41.Ge Q, Hu H, Eisen HN, Chen J. Different contributions of thymopoiesis and homeostasis-driven proliferation to the reconstitution of naive and memory T cell compartments. Proc Natl Acad Sci U S A. 2002;99:2989–2994. doi: 10.1073/pnas.052714099. [DOI] [PMC free article] [PubMed] [Google Scholar]
- 42.Surh CD, Sprent J. Homeostasis of naive and memory T cells. Immunity. 2008;29:848–862. doi: 10.1016/j.immuni.2008.11.002. [DOI] [PubMed] [Google Scholar]
- 43.Bowerman NA, Crofts TS, Chlewicki L, Do P, Baker BM, Christopher Garcia K, et al. Engineering the binding properties of the T cell receptor:peptide:MHC ternary complex that governs T cell activity. Mol Immunol. 2009;46:3000–3008. doi: 10.1016/j.molimm.2009.06.012. [DOI] [PMC free article] [PubMed] [Google Scholar]
- 44.Corse E, Gottschalk RA, Krogsgaard M, Allison JP. Attenuated T cell responses to a high-potency ligand in vivo. PLoS Biol. 2010:8. doi: 10.1371/journal.pbio.1000481. [DOI] [PMC free article] [PubMed] [Google Scholar]
- 45.Ghani S, Feuerer M, Doebis C, Lauer U, Loddenkemper C, Huehn J, et al. T cells as pioneers: antigen-specific T cells condition inflamed sites for high-rate antigen-non-specific effector cell recruitment. Immunology. 2009;128:e870–880. doi: 10.1111/j.1365-2567.2009.03096.x. [DOI] [PMC free article] [PubMed] [Google Scholar]
- 46.Palmer DC, Balasubramaniam S, Hanada K, Wrzesinski C, Yu Z, Farid S, et al. Vaccine-stimulated, adoptively transferred CD8+ T cells traffic indiscriminately and ubiquitously while mediating specific tumor destruction. J Immunol. 2004;173:7209–7216. doi: 10.4049/jimmunol.173.12.7209. [DOI] [PMC free article] [PubMed] [Google Scholar]
- 47.Charo J, Perez C, Buschow C, Jukica A, Czeh M, Blankenstein T. Visualizing the dynamic of adoptively transferred T cells during the rejection of large established tumors. Eur J Immunol. 2011;41:3187–3197. doi: 10.1002/eji.201141452. [DOI] [PubMed] [Google Scholar]
- 48.Scott-Browne JP, White J, Kappler JW, Gapin L, Marrack P. Germline-encoded amino acids in the alphabeta T-cell receptor control thymic selection. Nature. 2009;458:1043–1046. doi: 10.1038/nature07812. [DOI] [PMC free article] [PubMed] [Google Scholar]
- 49.Stemberger C, Huster KM, Koffler M, Anderl F, Schiemann M, Wagner H, et al. A single naive CD8+ T cell precursor can develop into diverse effector and memory subsets. Immunity. 2007;27:985–997. doi: 10.1016/j.immuni.2007.10.012. [DOI] [PubMed] [Google Scholar]
- 50.Gottschalk RA, Corse E, Allison JP. TCR ligand density and affinity determine peripheral induction of Foxp3 in vivo. J Exp Med. 2010;207:1701–1711. doi: 10.1084/jem.20091999. [DOI] [PMC free article] [PubMed] [Google Scholar]
- 51.Li Y, Moysey R, Molloy PE, Vuidepot AL, Mahon T, Baston E, et al. Directed evolution of human T-cell receptors with picomolar affinities by phage display. Nat Biotechnol. 2005;23:349–354. doi: 10.1038/nbt1070. [DOI] [PubMed] [Google Scholar]
- 52.Aggen DH, Chervin AS, Insaidoo FK, Piepenbrink KH, Baker BM, Kranz DM. Identification and engineering of human variable regions that allow expression of stable single-chain T cell receptors. Protein Engineering, Design, & Selection. 2011;24:361–372. doi: 10.1093/protein/gzq113. [DOI] [PMC free article] [PubMed] [Google Scholar]
- 53.Li LP, Lampert JC, Chen X, Leitao C, Popovic J, Muller W, et al. Transgenic mice with a diverse human T cell antigen receptor repertoire. Nat Med. 2010;16:1029–1034. doi: 10.1038/nm.2197. [DOI] [PubMed] [Google Scholar]
- 54.Eshhar Z, Waks T, Gross G, Schindler DG. Specific activation and targeting of cytotoxic lymphocytes through chimeric single chains consisting of antibody-binding domains and the gamma or zeta subunits of the immunoglobulin and T-cell receptors. Proc Natl Acad Sci U S A. 1993;90:720–724. doi: 10.1073/pnas.90.2.720. [DOI] [PMC free article] [PubMed] [Google Scholar]
- 55.Porter DL, Levine BL, Kalos M, Bagg A, June CH. Chimeric antigen receptor-modified T cells in chronic lymphoid leukemia. N Engl J Med. 2011;365:725–733. doi: 10.1056/NEJMoa1103849. [DOI] [PMC free article] [PubMed] [Google Scholar]
- 56.Engels B, Cam H, Schuler T, Indraccolo S, Gladow M, Baum C, et al. Retroviral vectors for high-level transgene expression in T lymphocytes. Hum Gene Ther. 2003;14:1155–1168. doi: 10.1089/104303403322167993. [DOI] [PubMed] [Google Scholar]
- 57.Morita S, Kojima T, Kitamura T. Plat-E: an efficient and stable system for transient packaging of retroviruses. Gene Ther. 2000;7:1063–1066. doi: 10.1038/sj.gt.3301206. [DOI] [PubMed] [Google Scholar]
- 58.Spiotto MT, Yu P, Rowley DA, Nishimura MI, Meredith SC, Gajewski TF, et al. Increasing tumor antigen expression overcomes “ignorance” to solid tumors via crosspresentation by bone marrow-derived stromal cells. Immunity. 2002;17:737–747. doi: 10.1016/s1074-7613(02)00480-6. [DOI] [PubMed] [Google Scholar]
Associated Data
This section collects any data citations, data availability statements, or supplementary materials included in this article.