

Abstract
As a central element within the RAS/ERK pathway, the serine/threonine kinase BRAF plays a key role in development and homeostasis and represents the most frequently mutated kinase in tumors. Consequently, it has emerged as an important therapeutic target in various malignancies. Nevertheless, the BRAF activation cycle still raises many mechanistic questions as illustrated by the paradoxical action and side effects of RAF inhibitors. By applying SEC‐PCP‐SILAC, we analyzed protein–protein interactions of hyperactive BRAFV 600E and wild‐type BRAF (BRAFWT). We identified two macromolecular, cytosolic BRAF complexes of distinct molecular composition and phosphorylation status. Hyperactive BRAFV 600E resides in large complexes of higher molecular mass and activity, while BRAFWT is confined to smaller, slightly less active complexes. However, expression of oncogenic K‐RasG12V, either by itself or in combination with RAF dimer promoting inhibitors, induces the incorporation of BRAFWT into large, active complexes, whereas pharmacological inhibition of BRAFV 600E has the opposite effect. Thus, the quaternary structure of BRAF complexes is shaped by its activation status, the conformation of its kinase domain, and clinically relevant inhibitors.
Keywords: 14‐3‐3 proteins, geldanamycin, HSP90 CDC37 complex, sorafenib, vemurafenib
Subject Categories: Molecular Biology of Disease, Signal Transduction
Introduction
The ARAF, BRAF, and CRAF kinases play a central role in physiological and pathological conditions by controlling cell fate decisions such as proliferation, differentiation, and survival. BRAF is the most frequently mutated kinase in tumors with particularly high frequencies in low‐grade astrocytoma, melanoma, and hairy cell leukemia (Röring & Brummer, 2012; Samatar & Poulikakos, 2014). Furthermore, BRAF mutant colorectal carcinoma (CRC) with microsatellite stability represents the most aggressive sub‐entity (see Herr et al, 2015 and references therein).
Consequently, BRAF has become an important therapeutic target in cancer (Holderfield et al, 2014; Turski et al, 2016), with other proliferative diseases such as RASopathies and polycystic kidney disease potentially following suit, as it has been suggested by animal models (Inoue et al, 2014; Chang et al, 2015). The clinically most advanced compounds, vemurafenib or dabrafenib, as well as the first RAF inhibitor sorafenib are ATP competitive drugs. Indeed, vemurafenib and dabrafenib have significantly improved the treatment options for metastatic melanoma harboring BRAFV600E/K mutations (Chapman et al, 2011; Hauschild et al, 2012) and similar outcomes may be achieved in other malignancies driven by BRAFV600E such as hairy cell leukemia (Dietrich et al, 2016). Nevertheless, even initially responding BRAF mutant melanomas acquire drug resistance (Moriceau et al, 2015). Moreover, other tumor entities such as CRC do not display such uniform responses due to primary resistance caused by rapid reactivation of the EGFR pathway (Corcoran et al, 2012; Prahallad et al, 2012). This insight led to the development of clinical trials combining multiple targeted therapy compounds.
Indeed, many of the recently documented inhibitor resistance mechanisms can be linked to the intricate feedback regulation of the ERK pathway (Sturm et al, 2010; Fritsche‐Guenther et al, 2011; Lito et al, 2012) and the paradoxical behavior of RAF inhibitors (Hatzivassiliou et al, 2010; Heidorn et al, 2010; Poulikakos et al, 2010). Although the precise mode of action is still under debate, the latter phenomenon relies on the presence of active GTP‐loaded RAS and the formation of BRAF homo‐ or heterodimers (Röring & Brummer, 2012; Lavoie & Therrien, 2015). Based on the observation that an intact dimer interface (DIF) is required for the paradoxical action of kinase‐inhibited BRAF molecules (Röring et al, 2012), it can be anticipated that binding of the inhibitor to one RAF molecule locks this protomer into a conformation in which it can transactivate the drug free protomer of the dimer by an allosteric mechanism.
The paradoxical action of RAF inhibitors is of high clinical relevance as it: (i) precludes the use of selective BRAF inhibitors in RAS mutant tumors highlighting the need to stratify cancer patients prior to drug administration (Holderfield et al, 2014; Samatar & Poulikakos, 2014), (ii) contributes to acquired drug resistance, for example, by positively selecting tumor cells with secondary mutations or amplifications in RAS or receptor tyrosine kinase genes (Röring & Brummer, 2012; Straussman et al, 2012; Ahronian et al, 2015; Moriceau et al, 2015), and (iii) by promoting secondary neoplasms (Callahan et al, 2012; Su et al, 2012; Yaktapour et al, 2014; Carlino et al, 2015; Dietrich et al, 2016). These limitations of RAF inhibitors highlight the need for better understanding of normal and mutant BRAF signaling at the molecular level, in particular of the composition and regulation of BRAF signaling complexes during the activation cycle of the kinase.
Indeed, the BRAF activation cycle remains incompletely understood. So far, it has emerged that activation of BRAF is triggered by its interaction with GTP‐loaded RAS proteins and is accompanied by changes in its phosphorylation status and protein interaction repertoire, including the formation of homo‐ and/or heterodimers (Baljuls et al, 2013; Cseh et al, 2014) and the interaction with the HSP90/CDC37 complex (Jaiswal et al, 1996; Vaughan et al, 2006). The phospho‐serine binding proteins of the 14‐3‐3 family regulate various steps of the activation cycle by either stabilizing the closed, inactive conformation of BRAF, or by promoting dimerization and downstream signaling. This dual role of 14‐3‐3 is reflected by the observations that alanine substitution of the C‐terminal 14‐3‐3 binding site S729 abolishes BRAF activity (except for BRAFV600E), whereas that of the N‐terminal motif around S365 increases kinase activity (MacNicol et al, 2000; Brummer et al, 2006; Rodriguez‐Viciana et al, 2006; Hmitou et al, 2007; Fischer et al, 2009; Ritt et al, 2010). Furthermore, mutations of the RDRSSS365AP motif, likely interfering with S365 phosphorylation and/or 14‐3‐3 binding, have been found in tumors, further highlighting its relevance for negative regulation (Eisenhardt et al, 2016).
Numerous, mostly ill‐defined kinases mediate feed‐forward and‐back phosphorylation of BRAF by upstream activators and downstream effectors, respectively. For example, wild‐type BRAF (BRAFWT) is stringently controlled by RAS‐dependent phosphorylation‐induced conformational change of its activation loop (Zhang & Guan, 2000). This in turn restructures its catalytic center, leading to DIF exposure, allosteric transactivation and ultimately the generation of a fully active BRAF signaling complex (Wan et al, 2004; Hu et al, 2013; Thevakumaran et al, 2015; Köhler et al, 2016). The most prevalent oncogenic BRAF mutation, V600E, mimics activation loop phosphorylation and locks the kinase in an active conformation by forming a mutation‐specific salt‐bridge, thereby causing a short‐circuit in the activation cycle and leading to chronic MEK/ERK signaling (Wan et al, 2004). Thus, V600E bypasses several steps required for the activation of BRAFWT such as N‐region phosphorylation, RAS, and 14‐3‐3 binding and dimerization, but also renders the oncoprotein resistant to negative regulation (Tsavachidou et al, 2004; Emuss et al, 2005; Brummer et al, 2006; Brady et al, 2009; Fischer et al, 2009; Poulikakos et al, 2011; Röring et al, 2012; Freeman et al, 2013).
The homo‐ and hetero‐dimerization of BRAF is highly relevant for drug action: Firstly, tumor‐associated N‐terminally truncated BRAF proteins, which have lost large portions of the regulatory regions required for auto‐inhibition and consist merely of the kinase domain, display increased activity and homo‐dimerization potential. The latter also confers an intrinsic resistance toward vemurafenib and sorafenib. Importantly, these proteins can be re‐sensitized to these drugs by a point mutation in the DIF, suggesting that rather the quaternary structure of the BRAF complex than the altered BRAF tertiary structure determines drug binding (Poulikakos et al, 2011; Sievert et al, 2013; Karajannis et al, 2014; Karoulia et al, 2016).
To comprehensively study BRAF activation, the rewiring of protein–protein interactions of BRAFWT and BRAFV600E and their role in cell transformation and paradoxical ERK activation, we globally analyzed macromolecular, cytosolic protein complexes by a combination of size exclusion chromatography and mass spectrometry (Kristensen et al, 2012). We characterized discrete macromolecular BRAF complexes of distinct composition. Their differences in activity and interaction partners were linked to altered phosphorylation patterns. Our data show that, in contrast to previous concepts, the interactions of wild‐type and oncogenic BRAF with 14‐3‐3 proteins and the HSP90/CDC37 complex are dynamically regulated, explaining among others the observation that BRAF mutant tumors are sensitive to clinically relevant HSP90 inhibitors, and outlining strategies for combination therapies.
Results
BRAF expression levels do not influence overall protein abundances
To study the influence of BRAF variants on the composition of macromolecular cytosolic protein complexes, we used CaCo‐2 sublines fitted with a doxycycline (Dox)‐inducible expression system of either hemagglutinin (HA)‐tagged BRAFWT or BRAFV600E (Herr et al, 2011; Röring et al, 2012). These CaCo‐2tet cells are derived from a colon adenocarcinoma and lack BRAF or KRAS mutations and thus represent an ideal model system to study CRC‐associated oncogenes in the context of colonic epithelium (Herr et al, 2015). Cells were treated with Dox for up to 96 h, and protein abundances were analyzed by immunoblotting (Fig 1A). After 6–12 h, HA‐BRAF could be detected and cells responded with an increase in phospho‐MEK and phospho‐ERK levels (Fig 1B), with BRAFV600E inducing a faster response and a differential of more than ninefold. Importantly, MEK levels stayed relatively constant over the timeframe of treatment. Interestingly, the differential in MEK/ERK phosphorylation elicited by BRAFV600E compared to BRAFWT became less pronounced with increasing induction time. The exact reason for this phenomenon is unknown, but could be potentially explained by the aforementioned feedback phenomena. The reduced Western blot signal of MEK compared to phospho‐MEK is due to a phosphorylation‐dependent decrease in antibody reactivity (Appendix Fig S1). After 48 h of Dox treatment, BRAF levels were stable, indicating a steady state. This also applied for downstream signaling pathways. Therefore, in all following experiments, oncogene expression was induced for 48 h. The advantage of the CaCo‐2tet system is that experiments addressing the influence of potent oncogenes on protein homeostasis can be carried out in an isogenic background. However, overexpression may also lead to artifacts. To exclude that BRAF expression globally alters protein abundances, we compared BRAF‐expressing cells with vector control cells also being treated with Dox by SILAC‐based proteomics (Fig 1C). In total, 1,945 proteins were quantified. BRAF itself was approximately ninefold enriched in the BRAF‐expressing cell lines. All other proteins exhibited normal distributions with 95% of proteins showing maximally a twofold difference in abundance. Importantly, abundances of known and novel BRAF interactors identified in this study, like the 14‐3‐3 and HSP90 proteins, NRAS, KRAS, and MEKs did not differ in cells ectopically expressing HA‐BRAF variants (Fig 1D, Appendix Fig S1). Overexpression of either wild‐type or oncogenic BRAF does neither alter global protein abundances nor abundances of proximal up‐ and down‐stream BRAF signaling partners. In that regard, it should be noted that even higher increases in BRAF protein expression occur in response to drug exposure in vitro and in patients, indicating that this degree of overexpression of BRAF in our Caco‐2tet system is relevant (Little et al, 2011; Moriceau et al, 2015). Thus, the influence of BRAFWT and BRAFV600E expression on macromolecular protein dynamics can be studied in an inducible, isogenic cell system with relevance to colon cancer.
Figure 1. Isogenic cell system employed to study the effects of BRAFWT and BRAFV600E on the composition of cytosolic macromolecular protein complexes.
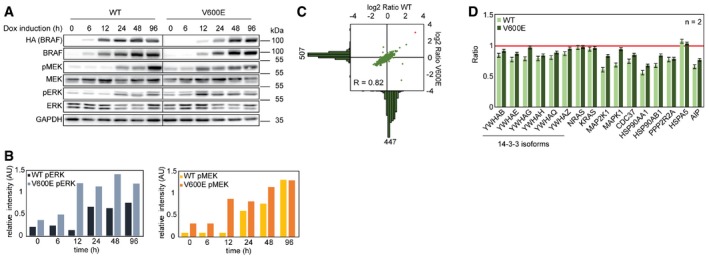
- The time‐dependent effect of HA‐BRAFWT (WT) and HA‐BRAFV600E (V600E) expression in CaCo‐2 cells is monitored by Western blot. Expression of HA‐tagged fusion constructs is induced for the annotated timeframes by the addition of doxycycline (Dox). Effects of oncogene expression are monitored by the abundance of the downstream target sites pMEK and pERK. Vertical line indicates two separately blotted gels.
- Quantifications of blots shown in panel (A) normalized to the GAPDH signal.
- To analyze effects of oncogene overexpression on global protein abundance, SILAC‐labeled cells overexpressing WT and V600E are compared to Dox‐treated unlabeled vector control cells (ctrl). Histograms highlight detected protein numbers. BRAF is marked in red.
- Abundance differences of known and newly identified BRAF binding partners are shown comparing WT‐ and V600E‐expressing cells with vector control cells. Red line indicates levels in vector control cells. Error bars indicate standard deviation.
Source data are available online for this figure.
Analysis of cytosolic macromolecular protein complexes by SEC‐PCP‐SILAC
To comprehensively characterize the global interactome in HA‐BRAFWT and HA‐BRAFV600E‐expressing cells, we applied SEC‐PCP‐SILAC, which combines native size exclusion chromatography with quantitative proteomics (Kristensen et al, 2012; Kirkwood et al, 2013). CaCo‐2tet cells were SILAC labeled and HA‐BRAF expression was induced for 48 h by Dox addition (Fig 2A). A mixture of light‐labeled cells expressing BRAFWT and BRAFV600E served as a control to identify cytosolic complexes in heavy‐labeled BRAFWT and medium‐heavy‐labeled BRAFV600E‐expressing cells, respectively. From the acquired data, the identified proteins engaged in interactions are observed as strongly co‐eluting (Fig 2B), and by hierarchical clustering (Fig 2C), a landscape of protein interactions and complexes was obtained (Fig 2D; see Materials and Methods for details). We performed three biological replicates with swapped SILAC labels and found a good reproducibility of protein elution profiles between all replicates (Fig 2E; median correlation coefficient of 0.65). Combining the data from all replicates, we extracted 3,739 binary interactions of 555 proteins after stringently filtering the data and requiring the interaction to be observed in at least two replicates (Appendix Fig S2, Dataset EV1; MS raw data can be found in PRIDE DB; Vizcaino et al, 2016, dataset identifier PXD004585).
Figure 2. SEC‐PCP‐SILAC workflow and data analysis.
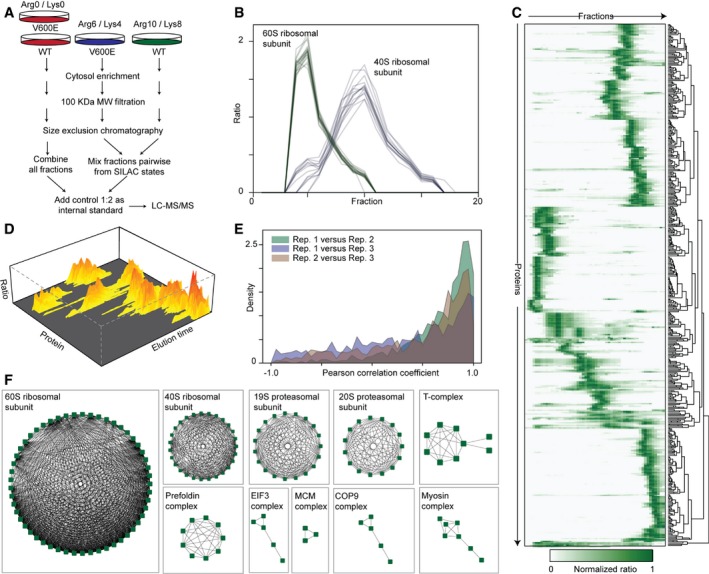
- WT‐ and V600E‐expressing cells are differentially SILAC labeled and lysed. Organelles and nuclei are removed by ultra‐centrifugation and the cytosol is filtered. Protein complexes larger than 100 kDa are separated by SEC. Fractions are mixed and combined with a light‐labeled internal standard (Arg0/Lys0). Prior LC‐MS/MS analysis proteins are digested with trypsin.
- SEC‐PCP‐SILAC elution profiles of 60S (green, 26 proteins) and 40S (blue, 21 proteins) ribosomal subunits. Each line represents the elution profile of a specific protein (see Datasets EV1 and EV2 for complete lists).
- Heatmap of normalized SILAC ratios of proteins identified from SEC fractions with each row corresponding to one individual protein. As an example, WT elution data from replicate 1 are shown. SILAC protein ratios of WT proteins versus the internal standard were normalized to one, highlighting the relative abundance of a specific protein in all SEC fractions. Rows are hierarchically clustered to show similar eluting protein groups.
- 3D visualization of filtered proteins showing the appearances of protein complexes as hills with proteins of similar intensity in the same fractions grouped together.
- Distribution of the Pearson correlation coefficients between the elution profiles for each protein in three biological replicates.
- Network diagrams of selected protein complexes inferred from the data. Edges indicate interactions and nodes indicate single proteins.
The inferred interactions could be clustered into 77 clusters representing potential complexes (Dataset EV2; Nepusz et al, 2012). Upon inspection, we could reconstitute many of the major cytosolic complexes from the list of observed complexes. This demonstrates that SEC‐PCP‐SILAC is suitable for obtaining an unbiased overview of protein–protein interactions (Fig 2F).
BRAFWT and BRAFV600E localize to discrete protein complexes
To identify proteins that change their interactions in response to oncoprotein induction, we compared HA‐BRAFWT and HA‐BRAFV600E‐expressing cells and plotted the sum of squared differences of SEC‐PCP‐SILAC ratios of three biological replicates (Fig 3A). To our surprise, the protein exhibiting the most robust change across the fractions was BRAF itself. Indeed, SEC‐PCP‐SILAC profiles of HA‐BRAFWT and HA‐BRAFV600E differed tremendously (Fig 3B). Whereas a large proportion of BRAFV600E localized to SEC fractions 22–26 corresponding to a molecular weight of ~600 kDa (Appendix Fig S3), the majority of BRAFWT was found in fractions 38–42, which harbored protein complexes of about 200 kDa. As the elution profiles are stoichiometric, the area under the curve of the two BRAFV600E complexes indicates that the high molecular weight (MW) complex contains roughly one‐third of cytosolic BRAFV600E (Appendix Fig S3). In contrast, BRAFWT is present at much lower levels in the high MW complex (Fig 3B).
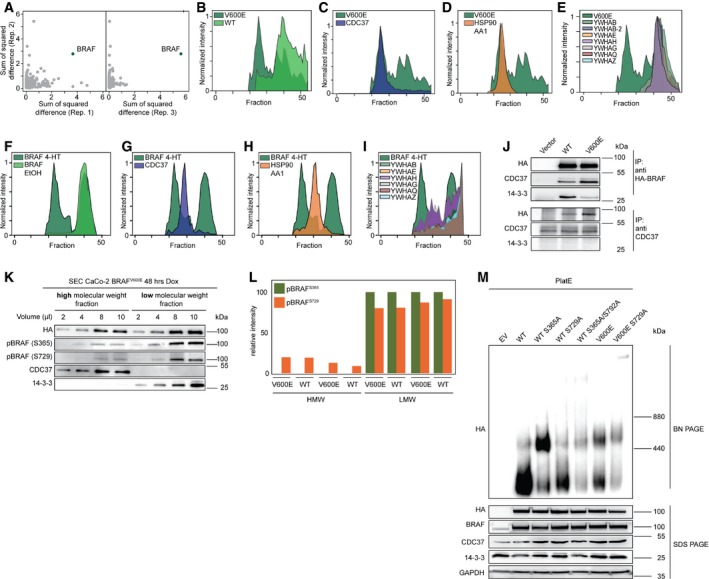
Figure 3. WT and V600E localize to discrete macromolecular protein complexes.
-
ATo screen for proteins changing their interactions the differences in CaCo‐2tet SEC‐PCP‐SILAC chromatograms are calculated. Only proteins with a value for the sum of squared difference in all three replicates are considered. BRAF is marked.
-
BOverlay of SEC elution profiles for V600E and WT in replicate 1 are shown.
-
C–EOverlay of V600E and CDC37 (C), HSP90 (D), or 14‐3‐3 (E) elution profiles.
-
FOverlay of SEC elution profiles for Braf floxV600E; Rosa26::CreERT2 MEFs expressing either BRAFWT (EtOH) or BRAFV600E (4‐HT) are shown.
-
G–IOverlay of V600E (4‐HT) and CDC37 (G), HSP90 (H), or 14‐3‐3 (I) elution profiles.
-
J14‐3‐3 proteins interact stronger with WT, CDC37 stronger with V600E as shown by anti‐HA and anti‐CDC37 IPs from CaCo‐2 whole‐cell lysate. CDC37 does not directly interact with 14‐3‐3 proteins.
-
K, L(K) Western blot of CaCo‐2 SEC fractions representing the high and low molecular weight complexes. 14‐3‐3 proteins are found predominantly in the low weight fractions and CDC37 in the high weight fractions. 14‐3‐3 binding sites of BRAF are phosphorylated in the low weight fractions promoting BRAF–14‐3‐3 interaction and less so in the high weight fractions as shown by phosphosite‐specific Western blot and (L) mass spectrometry (n = 2).
-
MPlat‐E cells were transiently transfected with indicated BRAF variants and complex distributions were analyzed by blue native (BN) PAGE followed by Western blot. SDS–PAGE Western blots served as loading control.
Source data are available online for this figure.
This segregation into two distinctly sized BRAF complexes, as defined by size exclusion chromatography, is reminiscent to our previous blue native PAGE (BN–PAGE) experiments showing that BRAFV600E is predominantly located in larger complexes (Röring et al, 2012). The BN–PAGE approach, however, is very limited when it comes to the identification of complex composition as antibodies for potential candidates must be highly specific and able to recognize their epitope in the non‐denatured protein (Swamy et al, 2006). In sharp contrast, SEC‐PCP‐SILAC enabled us now to analyze the compositions of the high and low MW complexes in an unbiased manner. Indeed, the analysis of known BRAF binding partners also showed a surprising differential distribution. The chaperone HSP90 and its cofactor CDC37 were found in the high MW complex (Fig 3C and D). On the contrary, 14‐3‐3 proteins (YWHAx) predominantly localized to the low MW complex (Fig 3E).
To analyze whether the differential distribution of BRAFWT and BRAFV600E and its binding partners can also be observed under endogenous BRAF expression levels, we established murine embryonic fibroblasts (MEFs) from homozygous Braf floxV600E knock‐in mice (Dankort et al, 2007) carrying a Rosa26::CreERT2 allele expressing a 4‐hydroxytamoxifen (4‐HT) inducible Cre recombinase (Ventura et al, 2007). Prior to 4‐HT exposure, these Braf floxV600E; Rosa26::CreERT2 MEFs express BRAFWT from its own endogenous promoter. Upon Cre activation, however, the mini‐gene allowing the expression of BRAFWT is excised from both alleles and the restored reading frames encode Braf V600E instead (Dankort et al, 2007). We performed SEC‐PCP‐SILAC analyses as described and also identified high and low MW complexes depending on the expressed BRAF variant (Fig 3F). Although elution profiles did not overlap completely as in the human CaCo‐2 cells, BRAF binding partners showed a similar differential distribution, with the larger complex being characterized by CDC37 and HSP90 and the smaller by 14‐3‐3 proteins (Fig 3G–I). Thus, the differential distribution of BRAFWT and BRAFV600E complexes and their distinct composition is not confined to ectopically expressed BRAF in human cells, but is also observed for endogenous BRAF in murine cells.
The differential distribution of the HSP90 complex and 14‐3‐3 proteins between complexes and thus between BRAFV600E and BRAFWT could also been shown by classical affinity purifications targeting BRAF itself, as well as by reverse immunoprecipitation (IP) targeting CDC37 (Fig 3J). CDC37 bound stronger to BRAFV600E and we were not able to co‐purify 14‐3‐3 proteins with CDC37. Minimum binding of 14‐3‐3 proteins to BRAF is dependent on its phosphorylation at either Ser365 or Ser729, with the latter representing the high affinity and major binding site (Brummer et al, 2006; Fischer et al, 2009). In agreement with the differential distribution of 14‐3‐3 proteins, we could show that both sites are highly phosphorylated in the low MW complex and hardly phosphorylated in the high MW complex (Fig 3K and L). Importantly, the activation status of BRAF appears critical for its allocation into either the small or large complex, as the activating S365A mutation shifted the majority of BRAFS365A molecules into the larger complex (Fig 3M). Commensurate with earlier findings that the gain of function imposed by the S365A mutation is offset by the S729A substitution (Brummer et al, 2006; Fischer et al, 2009), a large proportion of BRAFS365A/S729A proteins is found in the smaller complex again. BRAFV600E/S729A, which has been previously shown to retain most of its signaling capacity reacts less pronounced and stays in the larger complex (Brummer et al, 2006; Fischer et al, 2009; Ritt et al, 2010).
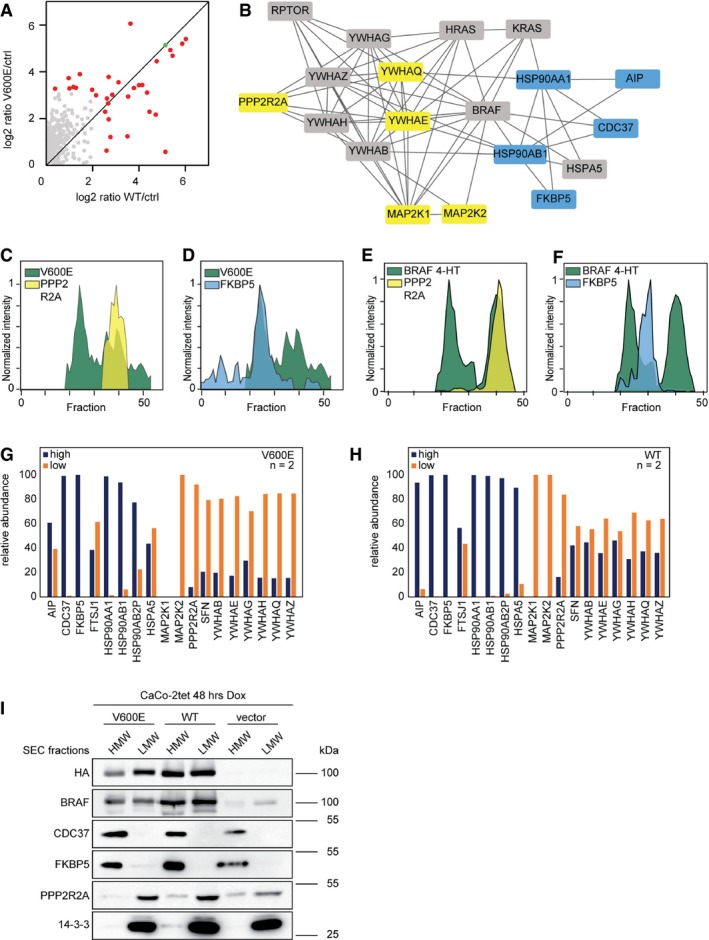
To comprehensively study BRAF interactions and analyze the distribution of binding partners between the macromolecular complexes, we also characterized the interactomes of BRAFV600E and BRAFWT by conventional IPs from CaCo‐2 whole‐cell lysate using SILAC‐based quantitative MS (Appendix Fig S4, Dataset EV3). In two biological replicates, 32 significantly enriched binding partners were identified (Fig 4A, P < 0.05, Benjamini–Hochberg (BH) corrected). A network of 19 proteins could be constructed using STRING DB (Fig 4B; Szklarczyk et al, 2015). As observed before, HSP90 proteins and CDC37 were found at higher levels in BRAFV600E precipitates. Furthermore, two novel interaction partners, the aromatic hydrocarbon (AH) receptor‐interacting protein (AIP) and the peptidyl‐prolyl cis‐trans isomerase FKBP5 were also found to interact more strongly with BRAFV600E. In contrast, 14‐3‐3 theta (YWHAQ) and epsilon (YWHAE) were found to associate predominantly with BRAFWT. Of note, also the serine/threonine‐protein phosphatase 2A subunit B (PPP2R2A) and MEK (MAP2K1/2) were more abundant in BRAFWT complexes. The latter finding is in agreement with the fact that BRAFV600E leads to increased MEK phosphorylation weakening the BRAFV600E–MEK interaction (Haling et al, 2014). FKBP5 and PPP2R2A were also identified by SEC‐PCP‐SILAC, and in agreement to the co‐IP data, the elution profile of FKBP5 indicates its interaction with the high MW complex, whereas the elution profile of PPP2R2A identifies the phosphatase subunit as a component of the low MW complex. This is true for CaCo‐2 cells ectopically expressing BRAF variants (Fig 4C and D) and for MEFs endogenously expressing BRAF (Fig 4E and F). To further corroborate the differential distribution of BRAF binding partners to the high and low MW complexes, we directly performed IPs out of SEC fractions and analyzed protein abundances by label‐free MS. As expected, proteins found to associate more with one or the other isoform of BRAF in the previous experiments could be observed as enriched in the respective high and low MW complexes (Fig 4G and H). For example, FKBP5, HSP90, and CDC37 were enriched in the high MW complex, whereas PPP2RA, MEK, and all 14‐3‐3 proteins are more strongly associated with the low MW BRAF complex, with the differences being more pronounced in V600E cells than in WT‐expressing cells. This differential distribution could also be shown by Western blot analyses of pooled high and low MW SEC fractions (Fig 4I).
Figure 4. Molecular composition of macromolecular BRAF complexes.
-
AAnti‐HA affinity purification from whole‐cell lysate of SILAC‐labeled cells expressing WT and V600E is compared to unlabeled vector control cells (ctrl). BRAF is marked in green, significantly interacting proteins in red (P < 0.05, BH corrected).
-
BA protein interaction network of BRAF binding partners identified in (A) is shown. Proteins interacting stronger with V600E are colored blue, proteins interacting stronger with WT yellow. Proteins binding to both forms with similar strength are colored gray.
-
C, DCaCo‐2tet SEC‐PCP‐SILAC profiles of differential BRAF binding partners are shown relative to the V600E profile.
-
E, FMEF SEC‐PCP‐SILAC profiles of differential BRAF binding partners are shown relative to the V600E profile (4‐HT).
-
G, H(G) Anti‐HA‐BRAFV600E and (H) anti‐HA‐BRAFWT IPs from SEC fractions corresponding to high and low MW complexes indicate differential localizations of interaction partners shown in (B). Relative protein abundances are based on iBAQ values.
-
IHigh and low MW complexes are separated by SEC, several SEC fractions were combined, and bulk protein abundance was analyzed by Western blot.
Source data are available online for this figure.
Taken together, BRAF localizes to structurally discrete macromolecular protein complexes. A considerable part of oncogenic BRAFV600E resides in a complex of ~600 kDa together with CDC37 and HSP90. In contrast, the majority of BRAFWT is found in a complex of ~200 kDa together with 14‐3‐3 proteins and MEK.
Pharmacological interference indicates differential regulation of BRAFV600E‐ and BRAFWT‐containing complexes
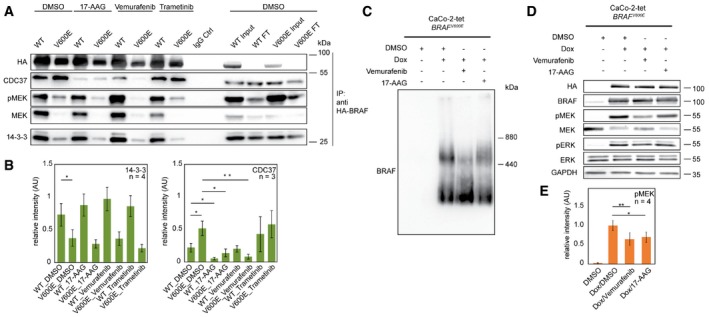
Several kinase inhibitors targeting BRAF itself or members of the MAPK signaling cascade are currently in (pre‐)clinical use. The so‐called paradoxical ERK activation observed in BRAFWT cells upon treatment with BRAF inhibitors and in the context of excessive RAS‐GTP levels has highlighted the fact that a better understanding of underlying protein dynamics is vital for the design of effective anti‐cancer therapies (Hatzivassiliou et al, 2010; Heidorn et al, 2010; Poulikakos et al, 2010). Therefore, we tested the effects of the approved drugs 17‐AAG, a derivative of the HSP90/CDC37 complex inhibitor geldanamycin, vemurafenib and trametinib, a MEK inhibitor, on BRAFWT–protein and BRAFV600E–protein interactions. Anti‐HA affinity purifications from whole‐cell lysate showed again the differential binding of 14‐3‐3 proteins and CDC37 to the two variants of BRAF (Fig 5A and B). Whereas 17‐AAG reduced CDC37‐binding to both BRAF forms, it did not influence BRAF/14‐3‐3 interactions. Interestingly, 17‐AAG also led to a reduction of the high molecular weight complex containing BRAFV600E (Fig 5C) and reduced BRAFV600E activity as indicated by MEK phosphorylation (Fig 5D and E). Thus, the CDC37–BRAF interaction appears to be vital for the formation of the large complex and for BRAFV600E activity. Importantly, timing and concentration of 17‐AAG were chosen in such a way that BRAF levels were not yet affected by degradation (Appendix Fig S5; Grbovic et al, 2006).
Figure 5. Modulation of protein–protein interactions by pharmacological interference highlights differences between WT‐ and V600E‐containing complexes.
-
ABRAF‐containing protein complexes were purified via anti‐HA IPs of WT‐ and V600E‐expressing CaCo‐2 cells treated with the indicated inhibitors. DMSO treatment served as control.
-
BQuantification of blots shown in (A). Error bars indicate SD; *P < 0.05, **P < 0.01, unpaired Student's t‐test.
-
C, DThe influence of 17‐AAG and vemurafenib on (C) protein complexes of V600E‐expressing CaCo‐2 cells is analyzed by blue native PAGE and on (D) signal transduction is analyzed by SDS–PAGE. The expression of V600E leads to the formation of two macromolecular complexes. Addition of both drugs leads to a reduction in the larger protein complex and reduced BRAFV600E activity as indicated by the level of phospho‐MEK (pMEK). Note: the antibodies used for detection of MEK react less with phosphorylated MEK.
-
EQuantification of blots shown in (D). Error bars indicate SD; *P < 0.05, **P < 0.01, unpaired Student's t‐test.
Source data are available online for this figure.
Vemurafenib had no obvious influence on the BRAFWT–CDC37 interaction; however, it did significantly decrease the BRAFV600E–CDC37 interaction, also indicating that BRAFV600E signaling relies on CDC37 (Grbovic et al, 2006). Furthermore, vemurafenib affected the formation of the discrete large complex (Fig 5C) and decreased BRAFV600E activity (Fig 5D and E). MEK, total as well as phosphorylated, interacted more strongly with BRAFWT compared to BRAFV600E. Interestingly, MEK inhibition by trametinib reduced the interaction of inactive MEK with BRAFWT and led to an increased interaction with CDC37 in the case of both BRAFV600E and BRAFWT (Fig 5A and B). As MEK inhibition abolishes the negative feedback from ERK to BRAF (Brummer et al, 2003; Rushworth et al, 2006; Pratilas et al, 2009; Ritt et al, 2010; Fritsche‐Guenther et al, 2011), these data could reflect an accumulation of active BRAF that needs to be chaperoned by the HSP90/CDC37 complex.
BRAF high and low molecular weight complexes exhibit differential activities
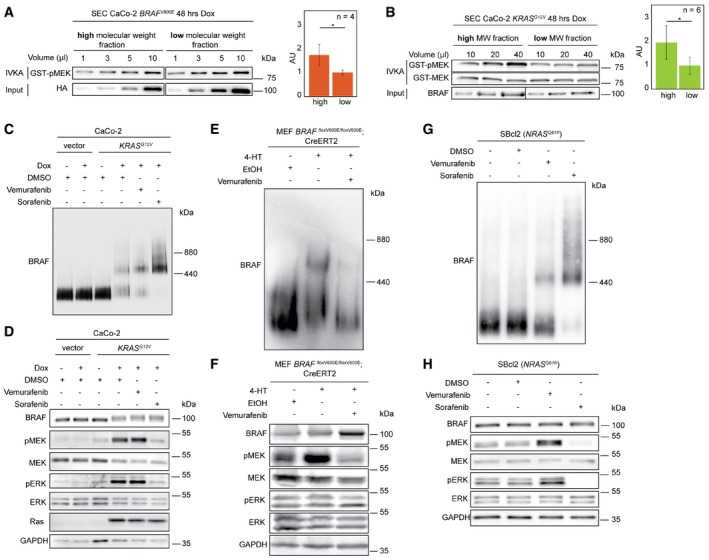
As the binding of CDC37 has been linked to BRAF activity (da Rocha Dias et al, 2005; Grbovic et al, 2006) and as we could show that vemurafenib and 17‐AAG reduce the abundance of the high MW complex, we analyzed BRAF kinase activities in SEC fractions of high and low MW of BRAFV600E and BRAFWT by in vitro kinase assays (Fig 6A and B). BRAFV600E in the high MW complex was 1.7 times more active than BRAFV600E in the low MW complex. To further prove that complex size was correlated with the active conformation of BRAF, we purified endogenous BRAFWT from CaCo‐2tet cells engineered to express oncogenic KRASG12V upon Dox treatment (Möller et al, 2014). Indeed, KRASG12V induced a segregation of initially homogenous BRAF low MW population into high and low MW complexes in CaCo‐2tet cells (Fig 6C). Again, BRAFWT in the high molecular weight complex was twice more active than BRAFWT in the low molecular weight complex and kinase activity could be blocked by the addition of vemurafenib (Fig 6B, Appendix Fig S6). This reorganization of endogenous BRAFWT complexes and the associated increase in activity was accompanied by the phosphorylation of BRAFWT, as indicated by its electrophoretic mobility shift in SDS–PAGE, and the phosphorylation levels of MEK and ERK (Fig 6D). As expected from its property as a pan‐RAF inhibitor (Wilhelm et al, 2004), sorafenib drastically reduced MEK and ERK phosphorylation (Fig 6D). Interestingly and in stark contrast to BRAFV600E (Fig 5C), abundance of the high MW complex of BRAFWT was further increased by vemurafenib, while sorafenib shifted all detectable BRAFWT molecules into the high MW fraction (Fig 6C). These effects might reflect the different abilities of vemurafenib (or its predecessor PLX4720) and sorafenib to induce weak and particularly stable BRAF dimers, respectively (Röring et al, 2012).
Figure 6. BRAF complexes exhibit differential activities.
-
AThe high and low molecular weight complexes of V600E are fractionated by SEC, and kinase activity is analyzed by in vitro kinase assays (IVKA). The phosphorylation of purified GST‐MEK is detected by a phosphosite‐specific antibody recognizing phospho‐Ser217/221 (pMEK). The HA signal is used as loading control. Bar diagram shows quantification of blots normalized to HA‐BRAF. AU: arbitrary unit. Error bars indicate SD; *P < 0.05, unpaired Student's t‐test.
-
BIVKA of WT complexes. Error bars indicate SD; *P < 0.05, unpaired Student's t‐test.
-
C, DWT complexes are analyzed by (C) BN–PAGE and (D) SDS–PAGE followed by Western blot using CaCo‐2 cells inducibly expressing KRASG12V.
-
E, FMEFs BRAFfloxV600E/floxV600E expressing WT or V600E upon 4‐HT induction are analyzed as in (C and D). EtOH treatment served as vehicle control.
-
G, HHuman SBcl2 melanoma cells expressing endogenous NRASQ61K are treated and analyzed as described in panels (C and D).
Source data are available online for this figure.
To further confirm that distinct BRAF complexes can also be observed endogenously and that these distinct complexes exhibit differential activities, we turned again to the aforementioned MEF BRAFfloxV600E/floxV600E system as well as to human melanoma cells. Unlike to the situation of most human cancer cell lines, which co‐express BRAFWT and BRAFV600E and are likely to produce BRAF complexes from three distinct homo‐dimers consisting of either wild‐type and/or mutant proteins, our MEF isogenic experimental setup produces only complexes made up by either wild‐type or mutant BRAF and therefore might provide a better discrimination of the complexes in BN–PAGE. Indeed, 4‐HT induces not only MEK phosphorylation but also a shift of BRAF from the low to the high MW fraction (Fig 6E and F), as it was already observed in CaCo‐2tet cells expressing HA‐BRAFV600E (Fig 5C). Because both events are vemurafenib sensitive, we conclude again that the high MW fraction is dependent on either the activity or active conformation of BRAFV600E. Finally, we used human SBcl2 melanoma cells, which lack a BRAF mutation, but carry an endogenous NRAS Q61K oncogene and in which paradoxical ERK activation can be rapidly provoked by BRAF selective inhibitors in a dimerization‐dependent manner (Fig 6G and H; Röring et al, 2012). Like in KRASG12V‐expressing CaCo‐2tet cells, vemurafenib and sorafenib promoted or completely induced the transfer of BRAFWT from the low into the high MW complex, respectively (Fig 6G). In summary, our data indicate that BRAF activation leads to the assembly of distinct protein complexes that exhibit differential activities and may address specific roles within the cell.
Discussion
BRAF is a therapeutic target of growing relevance across various clinical disciplines (Turski et al, 2016). Despite all the impressive therapeutic responses elicited by BRAF inhibitors reported since 2010, these drugs often fail to provide sustainable treatment options due to the emergence of drug resistance and side effects associated with the aforementioned “paradoxical ERK activation” observed in cells with elevated RAS activity (Samatar & Poulikakos, 2014; Yaktapour et al, 2014; Lavoie & Therrien, 2015). Indeed, this phenomenon illustrates that the complexity of RAF signaling has been underestimated and highlights the need for a better understanding how BRAF entertains protein–protein interactions, forms protein complexes, and how these events guide the kinase through its activation cycle.
With the current study, we aimed to decipher the complexities of signaling complexes organized by either wild‐type or oncogenic BRAF by applying a recently developed proteomic approach to a panel of human and murine cell line models and primary cells. By fitting CaCo‐2tet cells with inducible BRAFWT, BRAFV600E, and KRASG12V expression systems, we could study the molecular functions of respective oncoproteins in an isogenic setting. Ectopic BRAF expression did not alter global protein abundances, and the observed ninefold increase in BRAF itself is still in the range of abundance levels observed in patients harboring acquired resistance to BRAFV600E inhibition by gene ultra‐amplification (Moriceau et al, 2015). Importantly, not only do we corroborate our previous finding from BN–PAGE analyses that BRAFWT and BRAFV600E predominantly localize to protein complexes of distinct and discrete sizes (Röring et al, 2012), but we also demonstrate now that these complexes differ in their composition and activity. We show that the formation of the larger BRAF complexes represents a function of kinase activation as BRAFWT is transferred into the larger complex upon inducible expression of oncogenic KRAS (Fig 7). Importantly, our key findings were confirmed in the human melanoma cell line SBcl2 and an isogenic MEF system expressing endogenous BRAFWT and BRAFV600E, indicating that our results are neither cell line nor organism dependent nor influenced by BRAF expression levels. However, as we did not perform detailed interactome studies of the different complexes in all tested cell lines–drugs combinations, we cannot rule out that the similar sized complexes differ in single components. This has to be addressed by future studies.
Figure 7. Model of BRAF complex dynamics.
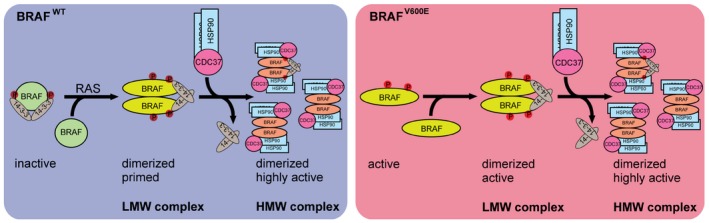
Left cartoon: BRAFWT is present in a monomeric form and depending on its phosphorylation status (S365, S729 marked in red) bound to 14‐3‐3. In the presence of active RAS, BRAF becomes phosphorylated and forms homo‐ or heterodimers by conformational changes in the kinase domain (Thevakumaran et al, 2015) and the concerted action of 14‐3‐3 proteins promoting dimerization at the RAF C‐termini. Dimerization promotes allosteric activation and a fully active conformation of BRAF, leading to recruitment of one asymmetric HSP90/CDC37 dimer per RAF protomer. Right cartoon: In contrast to BRAFWT, BRAFV600E is locked in an active conformation (Wan et al, 2004; Thevakumaran et al, 2015) and thus can remain active upon mutation of dimerization devices such as the C‐terminal 14‐3‐3 motif and the DIF (Röring et al, 2012). However, in cancer cells, BRAFV600E is predominantly found in a dimeric state. Upon translocation to the high molecular weight complexes BRAF variants become dephosphorylated reducing the interaction with 14‐3‐3 proteins and concurrently increasing the interaction with HSP90/CDC37. See Discussion for further details and additional references.
It is well understood that BRAFWT and some of its gain‐of‐function mutants need to form side‐to‐side homo‐ and heterodimers (Rajakulendran et al, 2009; Thevakumaran et al, 2015), while BRAFV600E can potentially signal as a monomer, for example, by introduction of mutations abolishing DIF function and/or 14‐3‐3 binding (Poulikakos et al, 2011; Röring et al, 2012; Freeman et al, 2013). However, this does not necessarily mean that BRAFV600E always exists as a monomer in living cells. In fact, we and others have shown that BRAFV600E and other high activity oncoproteins are more abundantly purified in their dimeric form than BRAFWT (Röring et al, 2012; Thevakumaran et al, 2015). Using BN–PAGE, we could show that both ectopically and endogenously expressed BRAFV600E appear more likely in larger protein complexes than BRAFWT and that the HMW complex requires an intact DIF in BRAF, suggesting that dimerization represents a key prerequisite for its formation (Röring et al, 2012). More importantly, we have identified now at least two distinct multimeric, macromolecular protein complexes harboring BRAF. One complex of ~600 kDa is characterized by BRAF, CDC37, HSP90, and FKBP5, and the other predominant complex of ~200 kDa contains BRAF, 14‐3‐3 proteins, MEK, and PPP2R2A (Fig 7).
Although some of the complex components such as HSP90/CDC37 and the 14‐3‐3s have been identified as BRAF interactors previously (Jaiswal et al, 1996; Papin et al, 1996; Eisenhardt et al, 2016), we report here for the first time their differential binding pattern. Binding of 14‐3‐3 proteins is critical for BRAF complex distribution as mutations of their recruitment sites altered the ratio between the large and small BRAF complexes. In addition to these well‐established interaction partners, our SEC‐PCP‐SILAC approach also identified the discrete distribution of less known interaction partners, such as FKBP5 that we recently identified as BRAF interaction partner in chicken DT40 and human MCF‐10A cells (Eisenhardt et al, 2016). Here, we show that this peptidyl‐prolyl cis/trans isomerase represents a hallmark of the high molecular weight BRAF complex. FKBP5 plays a role in the regulation of multiple signaling pathways, in tumorigenesis and chemoresistance (Li et al, 2011), and has been identified to act as a negative regulator of AKT (Pei et al, 2009). AKT3 lowers BRAFV600E activity by phosphorylating BRAF within the 14‐3‐3 binding motif around Ser365 that is critical for BRAF inhibition, even within the highly active V600E context (Cheung et al, 2008). As FKBP5 interacts with BRAFV600E in the high MW complex in which phosphorylation of BRAF at Ser365 is almost absent, it is tempting to speculate that the FKBP5‐mediated inactivation of AKT3 accounts for the loss of pS365 on BRAF and thereby the reduction of 14‐3‐3 in the high MW complex. FKBP5 was absent in the low MW complex in which Ser365 was phosphorylated. On the other hand, PPP2R2A interacts with BRAFV600E in the low MW complex and has been suggested to dephosphorylate hyper‐phosphorylated BRAF (Ritt et al, 2010), suggesting that BRAFV600E in this complex is less active or becomes inactivated. Alternatively but not necessarily excluding these possibilities, loss of 14‐3‐3 in the high MW BRAFV600E complexes could expose pS365 and pS729 to phosphatases, thereby preventing 14‐3‐3 re‐binding by dephosphorylation.
The reciprocal distribution of the HSP90/CDC37 complex and the 14‐3‐3 isoforms is a surprising finding (Fig 7). In fact, one of the first studies reporting the BRAF/HSP90 interaction in unstimulated and NGF‐treated PC12 cells suggested a more or less constitutive interaction between BRAFWT and the chaperone complex (Jaiswal et al, 1996). Likewise, despite the dynamic on/off recruitment of 14‐3‐3s to the N‐terminal 14‐3‐3 binding site (S365 in BRAF) during the activation cycle of BRAF and CRAF (Dhillon et al, 2002; Rodriguez‐Viciana et al, 2006), it was assumed that the 14‐3‐3 dimer remains more or less constitutively bound to the high affinity 14‐3‐3 binding motif at the C‐terminus of RAF‐kinases (Ser729 in BRAF), including BRAFV600E. This assumption was based on co‐immunoprecipitation studies and GST‐14‐3‐3 pulldowns and by genetic data showing that this protein–protein interaction appears necessary for auto‐inhibition, dimerization, and MEK phosphorylation (MacNicol et al, 2000; Brummer et al, 2006; Fischer et al, 2009; Ritt et al, 2010). Nevertheless, it must be kept in mind that neither co‐immunoprecipitation/pull‐down studies nor genetic approaches can provide the spatial resolution delivered by SEC‐PCP‐SILAC. In hindsight, however, our discovery that BRAFV600E occurs in at least two complexes, with the larger being more active and bound to HSP90/CDC37 but basically lacking 14‐3‐3 proteins, provides now a mechanistic explanation for several phenomena published within the last decade. Firstly, we and others have shown that loss of 14‐3‐3 binding to Ser729 abrogates the signaling potential of BRAFWT and several gain‐of‐function mutants but not of BRAFV600E (Brummer et al, 2006; Fischer et al, 2009; Ritt et al, 2010). Thus, BRAFV600E, despite the fact that it can bind to 14‐3‐3s if it is present in the low MW complex, does not require these phospho‐serine binding proteins for downstream signaling, hence there is no need to retain them in the large and more active complex. Secondly, while the interaction of 14‐3‐3 proteins with the C‐terminus of BRAF is critical to initiate dimerization (Ritt et al, 2010), a considerable fraction of the low MW 14‐3‐3‐containing complex could represent a population that has been inactivated recently. Indeed, AMPK‐mediated phosphorylation of Ser729 has been suggested to disrupt the BRAF/KSR1 complex and thereby to attenuate downstream signaling (Shen et al, 2013). Thirdly, BRAFV600E associates more strongly with the HSP90/CDC37 complex compared to BRAFWT (Grbovic et al, 2006). Fourthly and most critically from a clinical perspective, our data explain as to why HSP90 inhibitors such as geldanamycin or ganetespib show efficacy in BRAF mutant tumor cells, even in those with acquired vemurafenib resistance, while sparing cell lines lacking BRAF V600E mutations (da Rocha Dias et al, 2005; Grbovic et al, 2006; Acquaviva et al, 2014). Thus, the more active high MW complex of BRAFV600E might represent the major oncogenic driver and consequently its tight interaction with HSP90/CDC37 provides an Achilles heel to BRAFV600E addiction of tumor cells by HSP90 inhibitors.
But what determines whether a BRAF molecule becomes incorporated into the low or high MW complex? Based on our data and previous work, we posit that it is the combination of the active conformation of the kinase domain and the dimerization status of BRAF that determines the composition, order and quaternary structure of these complexes. Indeed, DIF mutations impair not only the homo‐dimerization of BRAFV600E, but also its incorporation into the high MW complex (Röring et al, 2012). Moreover, by assessing endogenous BRAFWT in CaCo‐2tet cells in the absence or presence of KRASG12V, we now demonstrate that this oncogenic GTPase not only activates BRAF/MEK/ERK signaling, as expected, but also shifts BRAF from the low into the high MW complex. As active RAS promotes dimerization of RAF, most likely by promoting the aforementioned conformational change within its kinase domain ultimately leading to DIF exposure (Heidorn et al, 2010; Thevakumaran et al, 2015; Köhler et al, 2016), this observation implies again that BRAF has to acquire a fully active conformation to assemble the high MW complex (Fig 7). Our observation that vemurafenib disrupts the high MW complexes organized by HA‐tagged or endogenous BRAFV600E further supports this model. Moreover, Thevakumaran et al (2015) demonstrated that this inhibitor induces an “off‐state like” conformation and thereby acts as a homo‐dimer breaker. Thus, based on these insights, it is not surprising that DIF mutations or vemurafenib abolish the high MW complex. Likewise, vemurafenib, which has been shown to disrupt the interaction between CDC37 and the isolated kinase domain of BRAF (Polier et al, 2013), also reduced the abundance of complexes between CDC37 and full‐length BRAFV600E in our experimental system. This was associated with a reduction in kinase activity and the abundance of the high MW complex. In summary, our data suggest that BRAFWT, once it has acquired its fully active conformation, or BRAFV600E, which is stabilized in its active conformation due to a mutation‐specific salt‐bridge (Wan et al, 2004; Hu et al, 2013; Thevakumaran et al, 2015), display a higher affinity to but also dependence for the HSP90/CDC37 complex (Fig 7). This concept is further supported by the BRAFS365A mutant, which is predominantly incorporated into the large BRAF complex. This mutant is primed for full activation by relief from 14‐3‐3‐mediated auto‐inhibition (MacNicol et al, 2000; Brummer et al, 2006; Fischer et al, 2009; Ritt et al, 2010), probably leading to a better exposure of the kinase domain and facilitating dimerization‐driven transactivation (Röring et al, 2012). Thus, this mutant imitates a state in which BRAFWT only exists following its recruitment by RAS‐GTP. This concept is supported by previous studies showing that RAS‐GTP activates BRAF and CRAF by cooperating with a phosphatase complex that displaces 14‐3‐3 proteins and prevents their re‐binding by de‐phosphorylation of S365 (or S259 in CRAF) (Dhillon et al, 2002; Rodriguez‐Viciana et al, 2006; Deswal et al, 2013).
We also investigated higher order complexes of BRAFWT in the setting of the paradoxical action of vemurafenib in NRASQ61K‐driven human melanoma cells and in the context of the pan‐RAF inhibitor sorafenib. Interestingly, these experimental setups revealed the formation of larger complexes, although ERK phosphorylation was further reduced by sorafenib. At first glance, this finding appears to contradict our model, which is in part based on the vemurafenib‐sensitive high MW BRAFV600E complexes. However, if we consider that sorafenib and, albeit to a lesser extent, also vemurafenib do not abrogate, but rather promote BRAF hetero‐dimerization (Heidorn et al, 2010; Röring et al, 2012), it is conceivable that these high MW complexes differ in their composition from those organized by BRAFV600E and might rather contain RAF heterodimers at their center. This represents an area for future studies.
Our data have several important translational implications. Firstly, it is critical to comprehensively study BRAF isoform‐specific protein–protein interactions in an inhibitor‐dependent fashion as each drug might provoke distinct multi‐protein complexes. Secondly, the clinically relevant MEK inhibitor trametinib, which reduces the negative feedback from ERK to BRAF (Brummer et al, 2003; Rushworth et al, 2006), enforces CDC37 association and thereby probably sustains the longevity of the large and more active complexes. This might be relevant for our understanding of MEK inhibitors, for example, within a combination therapy setting. Thirdly, next to directly targeting BRAF activity by ATP competitors, compounds blocking the HSP90/CDC37 interaction could provide an additive value, in particular as HSP90 inhibitors are increasingly trialed and applied in a clinical setting (Neckers & Workman, 2012; Acquaviva et al, 2014). Indeed, a very recent report demonstrated that the HSP90 inhibitor XL888 suppressed vemurafenib induced paradoxical ERK activation in NRAS mutant melanoma cell lines and the incidence of secondary skin lesions in vemurafenib‐treated patients (Phadke et al, 2015). Taken together, the presented work sheds new light on the BRAF activation cycle and the quaternary structure of multimeric, cytosolic BRAF complexes. It underscores the importance of studying the spatial organization of multi‐protein complexes and identifies important regulatory mechanisms, which can be employed in the design of new combination therapies addressing hyperactive BRAF in disease.
Materials and Methods
Cell lines
Plat‐E, SBcl2, CaCo‐2tet HA‐BRAF WT, CaCo‐2tet HA‐BRAF V600E, CaCo‐2tet KRAS G12V , and CaCo‐2tet vector cells were cultivated as previously described (Röring et al, 2012; Herr et al, 2015). Expression of HA‐BRAF WT, HA‐BRAF V600E , or KRAS G12V was induced with 2 μg/ml doxycycline (Sigma‐Aldrich, Taufenkirchen, Germany) for indicated time points or if not mentioned differently for 48 h. All cell lines were cultivated under water vapor‐saturated conditions at 37°C and 5% CO2. Inhibitors were dissolved in DMSO and final concentrations were: vemurafenib 1 μM, 17‐AAG 1 μM, trametinib 10 nM; maximum concentration of DMSO was 0.01%.
Mouse embryonic fibroblasts
The generation of the MEF Braf floxV600E/floxV600E and MEF Braf floxV600E/floxV600E/Rosa26::CreERT2 was performed as follows. All procedures involving mice were carried out in accordance with the local animal ethics committee (X‐14/47H). Conditional Braf floxV600E/knock‐in mice were originally generated by the McMahon laboratory and were described in detail previously (Dankort et al, 2007). Mice were purchased from The Jackson Laboratory in Bar Harbor (Maine, USA) and delivered on a pure C57BL/6 background. Genotyping was performed using the protocols published by Dankort et al (2007). After embryo transfer into our facility, mice were maintained on a C57BL/6 background and then mated with Rosa26::CreERT2 mice (Ventura et al, 2007), also backcrossed to a C57BL/6 background. Subsequently, the resulting Braf floxV600E/+/Rosa26::CreERT2F1 animals were bred to homozygosity in respect to the Braf floxV600E allele. Braf floxV600E/floxV600E/Rosa26::CreERT2 animals were then mated with Braf floxV600E/floxV600E mice to generate embryos for MEF preparation as described previously (Röring et al, 2012). Briefly, embryos were isolated at embryonic day 12.5. The head and fetal liver were removed, and the torso was minced and digested in 0.25% trypsin/EDTA solution at 37°C for 30 min. Cells were spun down and then cultivated in Dulbecco's modified Eagle's medium supplemented with 20% fetal calf serum, 2 mM l‐glutamine, 10 mM HEPES, 200 U/ml penicillin, 200 μg/ml streptomycin; 2.5 μg/ml amphotericin B all from PAN, Aidenbach, Germany) in a vapor‐saturated atmosphere at 37°C and 5% CO2. MEF pools with the appropriate genotypes were expanded for a few days and then immortalized by infection using the pQCXIH/Tag retroviral construct, which encodes the large T antigen (Tag) of simian virus 40. Infected cells were selected with hygromycin B (200 μg/ml). Immortalized MEFs, which retained their normal morphology and displayed proper contact inhibition response upon confluency, were used for further studies. Expression of Braf V600E was induced with a 1 day 1 μM 4‐hydroxytamoxifen (4‐HT; Sigma‐Aldrich, Taufenkirchen, Germany) pulse to allow for CreERT2‐mediated recombination of Braf floxV600E alleles.
Stable isotope labeling by amino acids in cell culture (SILAC)
For SILAC labeling, CaCo‐2tet HA‐BRAF WT, CaCo‐2tet HA‐BRAF V600E , and CaCo‐2tet vector cells were grown in high glucose (4.5 g/l) SILAC‐DMEM (PAN, Aidenbach, Germany) with 1% glutamine, 1% penicillin/streptomycin, and 10% dialyzed fetal bovine serum (Invitrogen, Darmstadt, Germany) containing either 88.3 mg/ml l‐arginine HCl, 76.3 mg/ml l‐lysine for light labeling (Arg0, Lys0) (Sigma‐Aldrich), or l‐arginine‐13C6 14N4 and l‐lysine‐2H4 (Arg6, Lys4) for medium‐heavy labeling, or l‐arginine‐13C6 15N4 and l‐lysine‐13C6 15N2 (Arg10, Lys8) for heavy labeling (Eurisotop, Saarbrücken, Germany). The cells were grown for at least 2 weeks to ensure 100% incorporation of labeled amino acids.
Western blot
To gain whole‐cell lysate (WCL) from cells, these were lysed in either normal lysis buffers (NLB: 50 mM Tris/HCl, pH 7.5; 1% Triton X‐100; 137 mM sodium chloride; 1% glycerin; protease inhibitors and phosphatase inhibitors) or 4% SDS in 100 mM Tris, pH 7.6 (for inhibitor titration Western blots). Protein concentration determination was performed via BCA assay (Thermo Fisher Scientific, Langenselbold, Germany). Equal protein amounts were loaded for PAGE. Blotted proteins were visualized with horseradish peroxidase‐conjugated secondary antibodies (Roche Diagnostics GmbH, Mannheim, Germany) using the Blot Detection Kit Immobilon Western (Millipore, Schwalbach, Germany) and the LAS‐4000 reader (Fujifilm Europe GmbH, Düsseldorf, Germany). Densitometry measurements were performed using ImageJ 1.49k (Wayne Rasband, National Institutes of Health, USA).
Immunoprecipitations
Cells were lysed in NLB as described for Western blot. Depending on the subsequent analysis strategy the volume of anti‐HA (3F10) affinity matrix (Roche Diagnostics GmbH, Mannheim, Germany) to precipitate HA‐BRAF was chosen to match 30–60 μg of anti‐HA antibody. For immunoprecipitation of CDC37, 15 μg of anti CDC37‐antibody (Santa Cruz Biotechnology Inc., Heidelberg, Germany) was used. The same amount of normal mouse IgG (Santa Cruz Biotechnology Inc., Heidelberg, Germany) served as control for potential unspecific protein binding. Protein G sepharose fast flow beads (Sigma‐Aldrich, Taufenkirchen, Germany) were mixed thoroughly before the same volume as antibody solution was taken to a fresh reaction tube. The antibody solution was then added on top. Last, the sample lysate was added into the same reaction tube. An aliquot of each lysate was retained before IP serving as an input control for the presence of the protein being precipitated. IPs were incubated at 4°C on an overhead rotator overnight. The next day an aliquot of the supernatant was taken apart as flow through (FT) control. The pelleted beads were subsequently washed three times with lysis buffer and resuspended in 2× SDS loading buffer with 5 mM DTT. Precipitated proteins were eluted by boiling at 95°C. Equal volumes of eluates were loaded for analysis via Western blot.
Antibodies
Antibodies used in this study are from Cell Signaling Technology, MA, USA: anti‐phospho‐MEK1/2 (pS217/221) (# 9121L), anti‐MEK1/2 (# 9122L), anti‐phospho‐p44/42 MAPK (ERK1/2) (Thr202/Tyr204) (#9101), anti‐p44/42 MAPK (ERK1/2) (#9102); from Santa Cruz Biotechnology Inc., Heidelberg, Germany: anti‐Ras (# 3965), anti‐GAPDH (FL335) (# sc‐25778), anti‐BRAF (F7) (# sc‐5284), anti‐CDC37 (C‐11) (# sc‐13129), anti‐pan‐14‐3‐3 (H‐8) (# sc‐1657), normal mouse IgG (sc‐2025); anti‐HA (3F10) (# 11867423001, Roche Diagnostics GmbH, Mannheim, Germany), anti‐HA (3F10) Affinity Matrix (# 11815016001, Roche); donkey anti‐rabbit HRP (# NA9344V, GE Healthcare, Munich, Germany), sheep anti‐mouse HRP (# NA931V, GE Healthcare); goat anti‐rat HRP (# 112‐035‐003, Dianova GmbH, Hamburg, Germany); anti‐mouse IgG VeriBlot for IP secondary antibody (HRP) (# ab131368, Abcam, Cambridge, United Kingdom). The anti‐BRAFV600E (VE1) was kindly provided by Prof. A. v. Deimling and has been described previously (Capper et al, 2011; Röring et al, 2012).
BN–PAGE analysis
CaCo‐2 cells were plated 24 h before doxycycline‐induced expression of HA‐BRAF V600E or KRAS G12V. Subsequent cells were either treated for 1 h with 1 μM PLX4032 (vemurafenib; Selleck Chemicals, Munich, Germany) or with 10 μM sorafenib (Santa Cruz Biotechnologies, USA) or for 4 h with 1 μM 17‐AAG (Tanespimycin; Selleck Chemicals, Munich, Germany). DMSO (Sigma‐Aldrich, Taufenkirchen, Germany) served as negative control.
Alternatively, SBcl2 melanoma cells were plated 24 h prior to treatment with PLX4032, sorafenib, or DMSO in the same manner as described for CaCo‐2 cells. Cells were lysed by adding 1 ml of cold BN‐lysis buffer (20 mM Bis‐Tris, pH 7.0, 20 mM NaCl, 2 mM EDTA, pH 8.0, 10% glycerol) supplemented with 1% Triton X‐100, protease, and phosphatase inhibitors (Complete protease inhibitor cocktail, PhosSTOP EasyPack; Roche Diagnostics GmbH, Mannheim, Germany) to the cell culture dish. After incubation on a rocking platform for 30 min at 4°C, the lysate was centrifuged at 13,000 g at 4°C for 10 min. The supernatant was removed and stored on ice for the following steps. A 1:20 dilution of a ferritin mark (440 and 880 kDa; Sigma‐Aldrich, Taufenkirchen, Germany) was used as marker. 2 μl of sample was loaded on a precast BN gel (NativePAGE™ Novex 4–16% Bis‐Tris Protein Gels; Invitrogen, Darmstadt, Germany) and overlaid with dark blue cathode buffer (NativePAGE Running buffer kit; Invitrogen, Darmstadt, Germany). 1% glycerol was added to the samples before loading. The BN gel electrophoresis was performed at 4°C for 1 h using dark blue cathode buffer and anode buffer (NativePAGE™ Running buffer kit; Invitrogen, Darmstadt, Germany), followed by two more hours with light blue cathode buffer and anode buffer (NativePAGE™ Running buffer kit; Invitrogen Darmstadt, Germany).
Subsequently, BN–PAGE separated proteins were blotted onto PVDF membranes (Immobilon‐PSQ; Merck Millipore, Merck KGaA, Darmstadt, Germany) by wet protein transfer using 1× TGS containing 0.02% SDS (Bio‐Rad, Munich, Germany) and 20% methanol (VWR, International GmbH, Bruchsal, Germany). Loading controls of BN–PAGE experiments were made from cell lysates gained from BN–PAGE cell lysis as described above. Equal volumes of each sample were loaded for analysis via Western blot.
In vitro kinase assay (IVKA)
Expression of HA‐BRAF V600E or KRAS G12V in CaCo‐2tet cells was induced, and size exclusion chromatography (SEC) was performed. SEC fractions corresponding to the high molecular weight complex (fractions 23–29) and fractions corresponding to the low molecular weight complex (fractions 38–46) were combined after chromatographic separation. From BRAFV600E samples, 1, 3, 5, and 10 μl were supplemented with kinase assay buffer (KAB; 20 mM 4‐morpholinepropanesulfonic acid (MOPS), pH 7.2; 5 mM EGTA, 1× phosphatase inhibitors, 1 mM dithiothreitol) to 20 μl total volume. Then, these suspensions were mixed with 2 μg recombinant GST‐MEK1 and 5 mM ATP in 20 μl KAB. The IVK reaction was incubated at 30°C for 30 min at 700 rpm in a thermomixer. For the IVKA performed with BRAFWT from CaCo‐2tet KRAS G12V cells, the volume of the combined fractions was decreased to half by using a 10 kDa cutoff filter (Sartorius AG, Göttingen, Germany). Then, 10 and 20 μl were supplemented with SEC lysis buffer to 40 μl total volume. Additionally, 40 μl of the concentrated, combined SEC fractions were left unsupplemented. Next, these suspensions were mixed with 40 μl of KAB. Finally, 80 μl of the GST‐ATP‐MEK‐Mix was added. IVK reaction was incubated at 30°C as well but for 60 min. Kinase reactions were immediately stopped by addition of 2× SDS sample buffer containing 1 mM DTT and boiling for 10 min at 95°C. Subsequently, the reactions were analyzed by Western blot. Here, the degree of phosphorylated GST‐MEK served as read out for the kinase activity. Detection against BRAF or HA served as loading control.
SEC‐PCP‐SILAC
After doxycycline treatment, cells were washed once with ice‐cold DPBS (PAN, Aidenbach, Germany) and subsequently lysed in a Dounce homogenizer (Wheaton, Millville, NJ USA) in size exclusion chromatography (SEC) mobile phase (50 mM KCl, 50 mM NaCH3COO, pH 7.2) including protease inhibitors and phosphatase inhibitors (Roche Diagnostics GmbH, Mannheim, Germany) (SEC lysis buffer). 1.5 ml of each lysate was clarified of debris by a 10‐min centrifugation (3,220 g). Soluble, cytosolic complexes were enriched by a 20‐min ultracentrifugation (100,000 g) using a iodixanol (Sigma‐Aldrich, Taufenkirchen, Germany) gradient before being concentrated to 100 μl using ultrafiltration (100,000 MWCO; Sartorius AG, Göttingen, Germany). Cytosolic complexes were loaded onto an ÄKTA Purifier 10 semi‐preparative HPLC (GE Healthcare, Munich, Germany) equipped with a 600 × 7.8 mm BioSep4000 Column (Phenomenex, Aschaffenburg, Germany) (resolving power 25,000 plates) controlled at 15°C and a flow rate of 0.5 ml/min. 20 fractions were collected from 20 to 30 min, and 34 fractions were collected from 30 to 41.5 min. The corresponding medium and heavy fractions were recombined just after size exclusion chromatographic separation. The light SILAC populations were similarly separated by SEC, after which all fractions were recombined and mixed thoroughly before being spiked equally into each of the medium/heavy fractions.
MS sample preparation
Fractions from SEC‐PCP‐SILAC were conducted to an in‐solution digest. For protein denaturation and reduction, 1% sodium deoxycholate and 10 mM DTT were added to each fraction prior to boiling at 95°C for 5 min followed by 56°C for 20 min. To alkylate proteins, addition of 4.5 mM iodoacetamide and incubation at room temperature for 25 min in the dark followed. A tryptic digest was performed overnight at 37°C. The next day, the peptides were purified via STAGE tip (Rappsilber et al, 2007).
For in‐gel digestion, protein mixtures were separated by SDS–PAGE using 4–12% Bis–Tris mini gradient gels (NuPAGE, Invitrogen, Darmstadt, Germany). The gel lanes were cut into 10 equal slices, which were in‐gel digested with trypsin (Promega, Mannheim, Germany) (Shevchenko et al, 2006), and the resulting peptide mixtures were processed on STAGE tips. The effect of oncogene overexpression on global protein abundance was measured from WCL of SILAC‐labeled CaCo‐2tet cells that were lysed in 4% SDS in 100 mM Tris pH 7.6. Lysates were denatured and reduced at 95°C with 1 mM DTT followed by alkylation with 5.5 mM iodoacetamide at room temperature in the dark. Samples were conducted to an in‐gel digest as described above. For MS analysis of BRAF interaction partners, an anti‐HA IP was performed as described above with WCL of SILAC‐labeled CaCo‐2tet cells. Eluted proteins were alkylated and processed as described above to in‐gel digest.
MS analysis
Mass spectrometric measurements were performed on LTQ Orbitrap XL mass spectrometer (Thermo Fisher Scientific, Langenselbold, Germany) coupled to an Agilent 1200 nanoflow–HPLC (Agilent Technologies GmbH, Waldbronn, Germany) or a NanoLC Ultra (Eksigent, AB Sciex, Radio Rd Redwood City, CA, USA). HPLC‐column tips (fused silica) with 75 μm inner diameter (New Objective, Woburn, MA, USA) were self‐packed (Ishihama et al, 2002) with Reprosil–Pur 120 ODS–3 (Dr. Maisch, Ammerbuch, Germany) to a length of 20 cm. Samples were applied directly onto the column without pre‐column. A gradient of A (0.5% acetic acid (high purity, LGC Promochem, Wesel, Germany) in water and B (0.5% acetic acid in 80% ACN (LC–MS grade, Wako Chemicals GmbH, Neuss, Germany) in water) with increasing organic proportion was used for peptide separation (loading of sample with 2% B; separation ramp: from 10 to 30% B within 80 min). The flow rate was 250 nl/min and for sample application 500 nl/min. The mass spectrometer was operated in the data‐dependent mode and switched automatically between MS (max. of 1 × 10⁶ ions) and MS/MS. Each MS scan was followed by a maximum of five MS/MS scans in the linear ion trap using normalized collision energy of 35% and a target value of 5,000. Parent ions with a charge state from z = 1 and unassigned charge states were excluded for fragmentation. The mass range for MS was 370–2,000 m/z. The resolution was set to 60,000. MS parameters were as follows: spray voltage 2.3 kV; no sheath and auxiliary gas flow; ion transfer tube temperature 125°C.
Identification of proteins and protein ratio assignment using MaxQuant
The MS raw data files were uploaded into the MaxQuant software (Cox & Mann, 2008) version 1.3.0.5., which performs peak detection, label‐free quantification, and generates peak lists of mass error corrected peptides using the following parameters: Carbamidomethylcysteine was set as fixed modification, and methionine oxidation and protein amino‐terminal acetylation were set as variable modifications. Three miss cleavages were allowed, enzyme specificity was trypsin/P + DP, and the MS/MS tolerance was set to 0.5 Da. Peak lists were searched by Andromeda for peptide identification using a Uniprot human database from July 2012 containing common contaminants such as keratins and enzymes used for in‐gel digestion (86,749 entries). Peptide lists were further used by MaxQuant to identify and relatively quantify proteins using the following parameters: peptide and protein false discovery rates were set to 0.01, maximum peptide posterior error probability (PEP) was set to 1, minimum peptide length was set to 7, the PEP was based on Andromeda score, minimum number peptide for identification and quantitation of proteins was set to one and must be unique, and identified proteins have been re‐quantified.
The mass spectrometry proteomics data have been deposited to the ProteomeXchange Consortium via the PRIDE partner repository with the dataset identifier PXD004585 (Vizcaino et al, 2016).
Analysis of SEC‐MS data
Preprocessing
From the LC‐MS/MS runs of the individual size exclusion fractions, we extracted the SILAC ratios of the signal of each protein in each fraction compared to the spiked in standard. Combining the ratios across the size exclusion fractions, we could construct chromatograms. Since we observed some differences in the chromatography between the replicates, we processed the data from the replicates separately.
The extracted chromatograms contained low level noise which could potentially interfere with downstream analysis steps, and thus, when plotting the distribution of all ratios, we observed a bimodal distribution. Based on the assumptions that the lower of the two underlying distributions contained the noise, we fitted two Gaussian distributions to the frequency of SILAC ratios (Appendix Fig S2A). The two distributions were partially overlapping, and thus, we selected as noise threshold the point in which the signal from the noise was 10 times more frequent than the signal from the useful data. We selected this threshold to ensure that we would only remove few data points from actual elution profiles (filter 1). Conversely, to ensure that we observed a sufficiently strong signal to confidently assign interactions, we required at least one ratio above the point where the true data signal is 10‐fold more frequent than the noise (filter 2). For some proteins, especially those close to the detection limit, the chromatogram appeared scratchy with unexpected peak shapes. To ensure that only proteins which showed a reasonable peak shape were kept, we required a signal in at least five consecutive fractions. In cases where only data for four points were available, the fifth was imputed as the average of the value in the two neighboring fractions. The first two filter steps removed only few protein IDs from the dataset, but the number of ratios for each protein was considerably lower due to the removal of noise (Appendix Fig S2B and C). However, the requirement of signal being present in five consecutive fractions caused a ~1/3 reduction in the number of proteins. In Dataset EV1 are the filtered elution profiles from both samples (V600E and WT) in the three replicates.
Interaction inference
To infer potentially interacting proteins from the collection of chromatograms, we screened the data for proteins with highly similar elution patterns. In the case a protein is part of two or more complexes, it would have several elution peaks, while the potential interactors might overlap with only one of these (Appendix Fig S2D). To be able to catch respective interactions, we fitted between 1 and 3 Gaussian distribution to raw chromatograms, with each fitted distribution corresponding to different putative interactions. Since not all chromatograms could be decomposed into a mixture of Gaussian distributions, we filtered out proteins in which the residuals between the data and the fit were above the 1.58 interquartile ranges (corresponding to the whiskers on a standard boxplot). In the majority of cases (91%), we fitted only one Gaussian, with the proteins remaining split between fitting two and three Gaussians for 7 and 2% of proteins, respectively.
To score the degree of co‐elution, we calculated the distance between each Gaussian curve to all other Gaussian fits. To estimate a suitable cutoff for the distance between elution peaks required for these proteins to be regarded as potentially interacting, we constructed precision‐recall curves using the CORUM database (Ruepp et al, 2010). For this, we extracted the subset of the identified proteins which are in the CORUM database and compared the interactions in the database to the interactions inferred from the data when increasing the distance threshold between two elution peaks from zero to the maximum observed distance. As threshold, we chose the distance which resulted in a precision value of 0.5, as this gave also a reasonable recall, thus allowing for identification of potentially novel interactions.
Next, we extracted the interactions between all proteins with the threshold established from the subset in CORUM. Applying this threshold limited the interactions from all possible ~365,000 interactions to 17,560. To increase the confidence further, we also required an interaction to be found in at least two of the three biological replicates in the same cell line, resulting in the final 3,739 reported interactions. To group the list of identified binary interactions into potential complexes, we used the Cytoscape plugin ClusterONE (Nepusz et al, 2012) with default parameters except that we allowed also for complexes composed of only two proteins resulting of the grouping of the inferred interactions into 77 clusters representing potential complexes.
Author contributions
BD performed all experiments with the help of SK‐P and CG. KTGR performed data analysis, MR conducted BN–PAGE analysis and generated the MEF system. RH generated cell lines. BD, MR, RFM, TB, and JD designed the study. All authors interpreted data and gave intellectual input. BD, TB, and JD wrote the manuscript.
Conflict of interest
The authors declare that they have no conflict of interest.
Supporting information
Appendix
Dataset EV1
Dataset EV2
Dataset EV3
Review Process File
Source Data for Figure 1
Source Data for Figure 3
Source Data for Figure 4
Source Data for Figure 5
Source Data for Figure 6
Acknowledgements
This work was supported by the German Research Foundation (DFG) through the Emmy‐Noether‐and Heisenberg programs (TB), CRC 850, projects B4 (TB) and B8 (JD), CRC 1140 (JD) and the Excellence Initiative of the German Federal and State Governments through FRIAS (JD) and EXC 294 BIOSS (TB, JD). This study was also supported by the BMBF through e:Bio 0316184D. KTGR is supported by the Danish Natural Sciences Research Council. RFM and JD are supported by the Alexander von Humboldt Foundation.
The EMBO Journal (2017) 36: 646–663
Contributor Information
Tilman Brummer, Email: tilman.brummer@zbsa.uni-freiburg.de.
Jörn Dengjel, Email: joern.dengjel@unifr.ch.
References
- Acquaviva J, Smith DL, Jimenez JP, Zhang C, Sequeira M, He S, Sang J, Bates RC, Proia DA (2014) Overcoming acquired BRAF inhibitor resistance in melanoma via targeted inhibition of Hsp90 with ganetespib. Mol Cancer Ther 13: 353–363 [DOI] [PubMed] [Google Scholar]
- Ahronian LG, Sennott EM, Van Allen EM, Wagle N, Kwak EL, Faris JE, Godfrey JT, Nishimura K, Lynch KD, Mermel CH, Lockerman EL, Kalsy A, Gurski JM Jr, Bahl S, Anderka K, Green LM, Lennon NJ, Huynh TG, Mino‐Kenudson M, Getz G et al (2015) Clinical acquired resistance to RAF inhibitor combinations in BRAF‐mutant colorectal cancer through MAPK pathway alterations. Cancer Discov 5: 358–367 [DOI] [PMC free article] [PubMed] [Google Scholar]
- Baljuls A, Kholodenko BN, Kolch W (2013) It takes two to tango – signalling by dimeric Raf kinases. Mol BioSyst 9: 551–558 [DOI] [PubMed] [Google Scholar]
- Brady SC, Coleman ML, Munro J, Feller SM, Morrice NA, Olson MF (2009) Sprouty2 association with B‐Raf is regulated by phosphorylation and kinase conformation. Cancer Res 69: 6773–6781 [DOI] [PMC free article] [PubMed] [Google Scholar]
- Brummer T, Naegele H, Reth M, Misawa Y (2003) Identification of novel ERK‐mediated feedback phosphorylation sites at the C‐terminus of B‐Raf. Oncogene 22: 8823–8834 [DOI] [PubMed] [Google Scholar]
- Brummer T, Martin P, Herzog S, Misawa Y, Daly RJ, Reth M (2006) Functional analysis of the regulatory requirements of B‐Raf and the B‐Raf(V600E) oncoprotein. Oncogene 25: 6262–6276 [DOI] [PubMed] [Google Scholar]
- Callahan MK, Rampal R, Harding JJ, Klimek VM, Chung YR, Merghoub T, Wolchok JD, Solit DB, Rosen N, Abdel‐Wahab O, Levine RL, Chapman PB (2012) Progression of RAS‐mutant leukemia during RAF inhibitor treatment. N Engl J Med 367: 2316–2321 [DOI] [PMC free article] [PubMed] [Google Scholar]
- Capper D, Preusser M, Habel A, Sahm F, Ackermann U, Schindler G, Pusch S, Mechtersheimer G, Zentgraf H, von Deimling A (2011) Assessment of BRAF V600E mutation status by immunohistochemistry with a mutation‐specific monoclonal antibody. Acta Neuropathol 122: 11–19 [DOI] [PubMed] [Google Scholar]
- Carlino MS, Kwan V, Miller DK, Saunders CA, Yip D, Nagrial AM, Tomlinson J, Grimmond SM, Scolyer RA, Kefford RF, Biankin AV, Long GV (2015) New RAS‐mutant pancreatic adenocarcinoma with combined BRAF and MEK inhibition for metastatic melanoma. J Clin Oncol 33: e52–e56 [DOI] [PubMed] [Google Scholar]
- Chang E, Park EY, Woo Y, Kang DH, Hwang YH, Ahn C, Park JH (2015) Restoring multidrug resistance‐associated protein 3 attenuates cell proliferation in the polycystic kidney. Am J Physiol Renal Physiol 308: F1004–F1011 [DOI] [PubMed] [Google Scholar]
- Chapman PB, Hauschild A, Robert C, Haanen JB, Ascierto P, Larkin J, Dummer R, Garbe C, Testori A, Maio M, Hogg D, Lorigan P, Lebbe C, Jouary T, Schadendorf D, Ribas A, O'Day SJ, Sosman JA, Kirkwood JM, Eggermont AM et al (2011) Improved survival with vemurafenib in melanoma with BRAF V600E mutation. N Engl J Med 364: 2507–2516 [DOI] [PMC free article] [PubMed] [Google Scholar]
- Cheung M, Sharma A, Madhunapantula SV, Robertson GP (2008) Akt3 and mutant V600E B‐Raf cooperate to promote early melanoma development. Cancer Res 68: 3429–3439 [DOI] [PMC free article] [PubMed] [Google Scholar]
- Corcoran RB, Ebi H, Turke AB, Coffee EM, Nishino M, Cogdill AP, Brown RD, Della Pelle P, Dias‐Santagata D, Hung KE, Flaherty KT, Piris A, Wargo JA, Settleman J, Mino‐Kenudson M, Engelman JA (2012) EGFR‐mediated re‐activation of MAPK signaling contributes to insensitivity of BRAF mutant colorectal cancers to RAF inhibition with vemurafenib. Cancer Discov 2: 227–235 [DOI] [PMC free article] [PubMed] [Google Scholar]
- Cox J, Mann M (2008) MaxQuant enables high peptide identification rates, individualized p.p.b.‐range mass accuracies and proteome‐wide protein quantification. Nat Biotechnol 26: 1367–1372 [DOI] [PubMed] [Google Scholar]
- Cseh B, Doma E, Baccarini M (2014) “RAF” neighborhood: protein‐protein interaction in the Raf/Mek/Erk pathway. FEBS Lett 588: 2398–2406 [DOI] [PMC free article] [PubMed] [Google Scholar]
- Dankort D, Filenova E, Collado M, Serrano M, Jones K, McMahon M (2007) A new mouse model to explore the initiation, progression, and therapy of BRAFV600E‐induced lung tumors. Genes Dev 21: 379–384 [DOI] [PMC free article] [PubMed] [Google Scholar]
- Deswal S, Meyer A, Fiala GJ, Eisenhardt AE, Schmitt LC, Salek M, Brummer T, Acuto O, Schamel WW (2013) Kidins220/ARMS associates with B‐Raf and the TCR, promoting sustained Erk signaling in T cells. J Immunol 190: 1927–1935 [DOI] [PubMed] [Google Scholar]
- Dhillon AS, Meikle S, Yazici Z, Eulitz M, Kolch W (2002) Regulation of Raf‐1 activation and signalling by dephosphorylation. EMBO J 21: 64–71 [DOI] [PMC free article] [PubMed] [Google Scholar]
- Dietrich S, Pircher A, Endris V, Peyrade F, Wendtner CM, Follows GA, Hullein J, Jethwa A, Ellert E, Walther T, Liu X, Dyer MJ, Elter T, Brummer T, Zeiser R, Hermann M, Herold M, Weichert W, Dearden C, Haferlach T et al (2016) BRAF inhibition in hairy cell leukemia with low‐dose vemurafenib. Blood 127: 2847–2855 [DOI] [PubMed] [Google Scholar]
- Eisenhardt AE, Sprenger A, Roring M, Herr R, Weinberg F, Kohler M, Braun S, Orth J, Diedrich B, Lanner U, Tscherwinski N, Schuster S, Dumaz N, Schmidt E, Baumeister R, Schlosser A, Dengjel J, Brummer T (2016) Phospho‐proteomic analyses of B‐Raf protein complexes reveal new regulatory principles. Oncotarget 7: 26628–26652 [DOI] [PMC free article] [PubMed] [Google Scholar]
- Emuss V, Garnett M, Mason C, Marais R (2005) Mutations of C‐RAF are rare in human cancer because C‐RAF has a low basal kinase activity compared with B‐RAF. Cancer Res 65: 9719–9726 [DOI] [PubMed] [Google Scholar]
- Fischer A, Baljuls A, Reinders J, Nekhoroshkova E, Sibilski C, Metz R, Albert S, Rajalingam K, Hekman M, Rapp UR (2009) Regulation of RAF activity by 14‐3‐3 proteins: RAF kinases associate functionally with both homo‐ and heterodimeric forms of 14‐3‐3 proteins. J Biol Chem 284: 3183–3194 [DOI] [PubMed] [Google Scholar]
- Freeman AK, Ritt DA, Morrison DK (2013) Effects of Raf dimerization and its inhibition on normal and disease‐associated Raf signaling. Mol Cell 49: 751–758 [DOI] [PMC free article] [PubMed] [Google Scholar]
- Fritsche‐Guenther R, Witzel F, Sieber A, Herr R, Schmidt N, Braun S, Brummer T, Sers C, Bluthgen N (2011) Strong negative feedback from Erk to Raf confers robustness to MAPK signalling. Mol Syst Biol 7: 489 [DOI] [PMC free article] [PubMed] [Google Scholar]
- Grbovic OM, Basso AD, Sawai A, Ye Q, Friedlander P, Solit D, Rosen N (2006) V600E B‐Raf requires the Hsp90 chaperone for stability and is degraded in response to Hsp90 inhibitors. Proc Natl Acad Sci USA 103: 57–62 [DOI] [PMC free article] [PubMed] [Google Scholar]
- Haling JR, Sudhamsu J, Yen I, Sideris S, Sandoval W, Phung W, Bravo BJ, Giannetti AM, Peck A, Masselot A, Morales T, Smith D, Brandhuber BJ, Hymowitz SG, Malek S (2014) Structure of the BRAF‐MEK complex reveals a kinase activity independent role for BRAF in MAPK signaling. Cancer Cell 26: 402–413 [DOI] [PubMed] [Google Scholar]
- Hatzivassiliou G, Song K, Yen I, Brandhuber BJ, Anderson DJ, Alvarado R, Ludlam MJ, Stokoe D, Gloor SL, Vigers G, Morales T, Aliagas I, Liu B, Sideris S, Hoeflich KP, Jaiswal BS, Seshagiri S, Koeppen H, Belvin M, Friedman LS et al (2010) RAF inhibitors prime wild‐type RAF to activate the MAPK pathway and enhance growth. Nature 464: 431–435 [DOI] [PubMed] [Google Scholar]
- Hauschild A, Grob JJ, Demidov LV, Jouary T, Gutzmer R, Millward M, Rutkowski P, Blank CU, Miller WH Jr, Kaempgen E, Martin‐Algarra S, Karaszewska B, Mauch C, Chiarion‐Sileni V, Martin AM, Swann S, Haney P, Mirakhur B, Guckert ME, Goodman V et al (2012) Dabrafenib in BRAF‐mutated metastatic melanoma: a multicentre, open‐label, phase 3 randomised controlled trial. Lancet 380: 358–365 [DOI] [PubMed] [Google Scholar]
- Heidorn SJ, Milagre C, Whittaker S, Nourry A, Niculescu‐Duvas I, Dhomen N, Hussain J, Reis‐Filho JS, Springer CJ, Pritchard C, Marais R (2010) Kinase‐dead BRAF and oncogenic RAS cooperate to drive tumor progression through CRAF. Cell 140: 209–221 [DOI] [PMC free article] [PubMed] [Google Scholar]
- Herr R, Wohrle FU, Danke C, Berens C, Brummer T (2011) A novel MCF‐10A line allowing conditional oncogene expression in 3D culture. Cell Commun Signal 9: 17 [DOI] [PMC free article] [PubMed] [Google Scholar]
- Herr R, Kohler M, Andrlova H, Weinberg F, Moller Y, Halbach S, Lutz L, Mastroianni J, Klose M, Bittermann N, Kowar S, Zeiser R, Olayioye MA, Lassmann S, Busch H, Boerries M, Brummer T (2015) B‐Raf inhibitors induce epithelial differentiation in BRAF‐mutant colorectal cancer cells. Cancer Res 75: 216–229 [DOI] [PubMed] [Google Scholar]
- Hmitou I, Druillennec S, Valluet A, Peyssonnaux C, Eychene A (2007) Differential regulation of B‐raf isoforms by phosphorylation and autoinhibitory mechanisms. Mol Cell Biol 27: 31–43 [DOI] [PMC free article] [PubMed] [Google Scholar]
- Holderfield M, Deuker MM, McCormick F, McMahon M (2014) Targeting RAF kinases for cancer therapy: BRAF‐mutated melanoma and beyond. Nat Rev Cancer 14: 455–467 [DOI] [PMC free article] [PubMed] [Google Scholar]
- Hu J, Stites EC, Yu H, Germino EA, Meharena HS, Stork PJ, Kornev AP, Taylor SS, Shaw AS (2013) Allosteric activation of functionally asymmetric RAF kinase dimers. Cell 154: 1036–1046 [DOI] [PMC free article] [PubMed] [Google Scholar]
- Inoue S, Moriya M, Watanabe Y, Miyagawa‐Tomita S, Niihori T, Oba D, Ono M, Kure S, Ogura T, Matsubara Y, Aoki Y (2014) New BRAF knockin mice provide a pathogenetic mechanism of developmental defects and a therapeutic approach in cardio‐facio‐cutaneous syndrome. Hum Mol Genet 23: 6553–6566 [DOI] [PubMed] [Google Scholar]
- Ishihama Y, Rappsilber J, Andersen JS, Mann M (2002) Microcolumns with self‐assembled particle frits for proteomics. J Chromatogr A 979: 233–239 [DOI] [PubMed] [Google Scholar]
- Jaiswal RK, Weissinger E, Kolch W, Landreth GE (1996) Nerve growth factor‐mediated activation of the mitogen‐activated protein (MAP) kinase cascade involves a signaling complex containing B‐Raf and HSP90. J Biol Chem 271: 23626–23629 [DOI] [PubMed] [Google Scholar]
- Karajannis MA, Legault G, Fisher MJ, Milla SS, Cohen KJ, Wisoff JH, Harter DH, Goldberg JD, Hochman T, Merkelson A, Bloom MC, Sievert AJ, Resnick AC, Dhall G, Jones DT, Korshunov A, Pfister SM, Eberhart CG, Zagzag D, Allen JC (2014) Phase II study of sorafenib in children with recurrent or progressive low‐grade astrocytomas. Neuro Oncol 16: 1408–1416 [DOI] [PMC free article] [PubMed] [Google Scholar]
- Karoulia Z, Wu Y, Ahmed TA, Xin Q, Bollard J, Krepler C, Wu X, Zhang C, Bollag G, Herlyn M, Fagin JA, Lujambio A, Gavathiotis E, Poulikakos PI (2016) An integrated model of RAF inhibitor action predicts inhibitor activity against oncogenic BRAF signaling. Cancer Cell 30: 485–498 [DOI] [PMC free article] [PubMed] [Google Scholar]
- Kirkwood KJ, Ahmad Y, Larance M, Lamond AI (2013) Characterization of native protein complexes and protein isoform variation using size‐fractionation‐based quantitative proteomics. Mol Cell Proteomics 12: 3851–3873 [DOI] [PMC free article] [PubMed] [Google Scholar]
- Köhler M, Röring M, Schorch B, Heilmann K, Stickel N, Fiala GJ, Schmitt LC, Braun S, Ehrenfeld S, Uhl FM, Kaltenbacher T, Weinberg F, Herzog S, Zeiser R, Schamel WW, Jumaa H, Brummer T (2016) Activation loop phosphorylation regulates B‐Raf in vivo and transformation by B‐Raf mutants. EMBO J 35: 143–161 [DOI] [PMC free article] [PubMed] [Google Scholar]
- Kristensen AR, Gsponer J, Foster LJ (2012) A high‐throughput approach for measuring temporal changes in the interactome. Nat Methods 9: 907–909 [DOI] [PMC free article] [PubMed] [Google Scholar]
- Lavoie H, Therrien M (2015) Regulation of RAF protein kinases in ERK signalling. Nat Rev Mol Cell Biol 16: 281–298 [DOI] [PubMed] [Google Scholar]
- Li L, Lou Z, Wang L (2011) The role of FKBP5 in cancer aetiology and chemoresistance. Br J Cancer 104: 19–23 [DOI] [PMC free article] [PubMed] [Google Scholar]
- Lito P, Pratilas CA, Joseph EW, Tadi M, Halilovic E, Zubrowski M, Huang A, Wong WL, Callahan MK, Merghoub T, Wolchok JD, de Stanchina E, Chandarlapaty S, Poulikakos PI, Fagin JA, Rosen N (2012) Relief of profound feedback inhibition of mitogenic signaling by RAF inhibitors attenuates their activity in BRAFV600E melanomas. Cancer Cell 22: 668–682 [DOI] [PMC free article] [PubMed] [Google Scholar]
- Little AS, Balmanno K, Sale MJ, Newman S, Dry JR, Hampson M, Edwards PA, Smith PD, Cook SJ (2011) Amplification of the driving oncogene, KRAS or BRAF, underpins acquired resistance to MEK1/2 inhibitors in colorectal cancer cells. Sci Signal 4: ra17 [DOI] [PubMed] [Google Scholar]
- MacNicol MC, Muslin AJ, MacNicol AM (2000) Disruption of the 14‐3‐3 binding site within the B‐Raf kinase domain uncouples catalytic activity from PC12 cell differentiation. J Biol Chem 275: 3803–3809 [DOI] [PubMed] [Google Scholar]
- Möller Y, Siegemund M, Beyes S, Herr R, Lecis D, Delia D, Kontermann R, Brummer T, Pfizenmaier K, Olayioye MA (2014) EGFR‐targeted TRAIL and a smac mimetic synergize to overcome apoptosis resistance in KRAS mutant colorectal cancer cells. PLoS ONE 9: e107165 [DOI] [PMC free article] [PubMed] [Google Scholar]
- Moriceau G, Hugo W, Hong A, Shi H, Kong X, Yu CC, Koya RC, Samatar AA, Khanlou N, Braun J, Ruchalski K, Seifert H, Larkin J, Dahlman KB, Johnson DB, Algazi A, Sosman JA, Ribas A, Lo RS (2015) Tunable‐combinatorial mechanisms of acquired resistance limit the efficacy of BRAF/MEK cotargeting but result in melanoma drug addiction. Cancer Cell 27: 240–256 [DOI] [PMC free article] [PubMed] [Google Scholar]
- Neckers L, Workman P (2012) Hsp90 molecular chaperone inhibitors: are we there yet? Clin Cancer Res 18: 64–76 [DOI] [PMC free article] [PubMed] [Google Scholar]
- Nepusz T, Yu H, Paccanaro A (2012) Detecting overlapping protein complexes in protein‐protein interaction networks. Nat Methods 9: 471–472 [DOI] [PMC free article] [PubMed] [Google Scholar]
- Papin C, Denouel A, Calothy G, Eychene A (1996) Identification of signalling proteins interacting with B‐Raf in the yeast two‐hybrid system. Oncogene 12: 2213–2221 [PubMed] [Google Scholar]
- Pei H, Li L, Fridley BL, Jenkins GD, Kalari KR, Lingle W, Petersen G, Lou Z, Wang L (2009) FKBP51 affects cancer cell response to chemotherapy by negatively regulating Akt. Cancer Cell 16: 259–266 [DOI] [PMC free article] [PubMed] [Google Scholar]
- Phadke M, Gibney GT, Rich CJ, Fedorenko IV, Chen YA, Kudchadkar RR, Sondak VK, Weber J, Messina JL, Smalley KS (2015) XL888 limits vemurafenib‐induced proliferative skin events by suppressing paradoxical MAPK activation. J Invest Dermatol 135: 2542–2544 [DOI] [PMC free article] [PubMed] [Google Scholar]
- Polier S, Samant RS, Clarke PA, Workman P, Prodromou C, Pearl LH (2013) ATP‐competitive inhibitors block protein kinase recruitment to the Hsp90‐Cdc37 system. Nat Chem Biol 9: 307–312 [DOI] [PMC free article] [PubMed] [Google Scholar]
- Poulikakos PI, Zhang C, Bollag G, Shokat KM, Rosen N (2010) RAF inhibitors transactivate RAF dimers and ERK signalling in cells with wild‐type BRAF. Nature 464: 427–430 [DOI] [PMC free article] [PubMed] [Google Scholar]
- Poulikakos PI, Persaud Y, Janakiraman M, Kong X, Ng C, Moriceau G, Shi H, Atefi M, Titz B, Gabay MT, Salton M, Dahlman KB, Tadi M, Wargo JA, Flaherty KT, Kelley MC, Misteli T, Chapman PB, Sosman JA, Graeber TG et al (2011) RAF inhibitor resistance is mediated by dimerization of aberrantly spliced BRAF(V600E). Nature 480: 387–390 [DOI] [PMC free article] [PubMed] [Google Scholar]
- Prahallad A, Sun C, Huang S, Di Nicolantonio F, Salazar R, Zecchin D, Beijersbergen RL, Bardelli A, Bernards R (2012) Unresponsiveness of colon cancer to BRAF(V600E) inhibition through feedback activation of EGFR. Nature 483: 100–103 [DOI] [PubMed] [Google Scholar]
- Pratilas CA, Taylor BS, Ye Q, Viale A, Sander C, Solit DB, Rosen N (2009) (V600E)BRAF is associated with disabled feedback inhibition of RAF‐MEK signaling and elevated transcriptional output of the pathway. Proc Natl Acad Sci USA 106: 4519–4524 [DOI] [PMC free article] [PubMed] [Google Scholar]
- Rajakulendran T, Sahmi M, Lefrancois M, Sicheri F, Therrien M (2009) A dimerization‐dependent mechanism drives RAF catalytic activation. Nature 461: 542–545 [DOI] [PubMed] [Google Scholar]
- Rappsilber J, Mann M, Ishihama Y (2007) Protocol for micro‐purification, enrichment, pre‐fractionation and storage of peptides for proteomics using StageTips. Nat Protoc 2: 1896–1906 [DOI] [PubMed] [Google Scholar]
- Ritt DA, Monson DM, Specht SI, Morrison DK (2010) Impact of feedback phosphorylation and Raf heterodimerization on normal and mutant B‐Raf signaling. Mol Cell Biol 30: 806–819 [DOI] [PMC free article] [PubMed] [Google Scholar]
- da Rocha Dias S, Friedlos F, Light Y, Springer C, Workman P, Marais R (2005) Activated B‐RAF is an Hsp90 client protein that is targeted by the anticancer drug 17‐allylamino‐17‐demethoxygeldanamycin. Cancer Res 65: 10686–10691 [DOI] [PubMed] [Google Scholar]
- Rodriguez‐Viciana P, Oses‐Prieto J, Burlingame A, Fried M, McCormick F (2006) A phosphatase holoenzyme comprised of Shoc2/Sur8 and the catalytic subunit of PP1 functions as an M‐Ras effector to modulate Raf activity. Mol Cell 22: 217–230 [DOI] [PubMed] [Google Scholar]
- Röring M, Brummer T (2012) Aberrant B‐raf signaling in human cancer – 10 years from bench to bedside. Crit Rev Oncog 17: 97–121 [DOI] [PubMed] [Google Scholar]
- Röring M, Herr R, Fiala GJ, Heilmann K, Braun S, Eisenhardt AE, Halbach S, Capper D, von Deimling A, Schamel WW, Saunders DN, Brummer T (2012) Distinct requirement for an intact dimer interface in wild‐type, V600E and kinase‐dead B‐Raf signalling. EMBO J 31: 2629–2647 [DOI] [PMC free article] [PubMed] [Google Scholar]
- Ruepp A, Waegele B, Lechner M, Brauner B, Dunger‐Kaltenbach I, Fobo G, Frishman G, Montrone C, Mewes HW (2010) CORUM: the comprehensive resource of mammalian protein complexes–2009. Nucleic Acids Res 38: D497–D501 [DOI] [PMC free article] [PubMed] [Google Scholar]
- Rushworth LK, Hindley AD, O'Neill E, Kolch W (2006) Regulation and role of Raf‐1/B‐Raf heterodimerization. Mol Cell Biol 26: 2262–2272 [DOI] [PMC free article] [PubMed] [Google Scholar]
- Samatar AA, Poulikakos PI (2014) Targeting RAS‐ERK signalling in cancer: promises and challenges. Nat Rev Drug Discov 13: 928–942 [DOI] [PubMed] [Google Scholar]
- Shen CH, Yuan P, Perez‐Lorenzo R, Zhang Y, Lee SX, Ou Y, Asara JM, Cantley LC, Zheng B (2013) Phosphorylation of BRAF by AMPK impairs BRAF‐KSR1 association and cell proliferation. Mol Cell 52: 161–172 [DOI] [PMC free article] [PubMed] [Google Scholar]
- Shevchenko A, Tomas H, Havlis J, Olsen JV, Mann M (2006) In‐gel digestion for mass spectrometric characterization of proteins and proteomes. Nat Protoc 1: 2856–2860 [DOI] [PubMed] [Google Scholar]
- Sievert AJ, Lang SS, Boucher KL, Madsen PJ, Slaunwhite E, Choudhari N, Kellet M, Storm PB, Resnick AC (2013) Paradoxical activation and RAF inhibitor resistance of BRAF protein kinase fusions characterizing pediatric astrocytomas. Proc Natl Acad Sci USA 110: 5957–5962 [DOI] [PMC free article] [PubMed] [Google Scholar]
- Straussman R, Morikawa T, Shee K, Barzily‐Rokni M, Qian ZR, Du J, Davis A, Mongare MM, Gould J, Frederick DT, Cooper ZA, Chapman PB, Solit DB, Ribas A, Lo RS, Flaherty KT, Ogino S, Wargo JA, Golub TR (2012) Tumour micro‐environment elicits innate resistance to RAF inhibitors through HGF secretion. Nature 487: 500–504 [DOI] [PMC free article] [PubMed] [Google Scholar]
- Sturm OE, Orton R, Grindlay J, Birtwistle M, Vyshemirsky V, Gilbert D, Calder M, Pitt A, Kholodenko B, Kolch W (2010) The mammalian MAPK/ERK pathway exhibits properties of a negative feedback amplifier. Sci Signal 3: ra90 [DOI] [PubMed] [Google Scholar]
- Su F, Viros A, Milagre C, Trunzer K, Bollag G, Spleiss O, Reis‐Filho JS, Kong X, Koya RC, Flaherty KT, Chapman PB, Kim MJ, Hayward R, Martin M, Yang H, Wang Q, Hilton H, Hang JS, Noe J, Lambros M et al (2012) RAS mutations in cutaneous squamous‐cell carcinomas in patients treated with BRAF inhibitors. N Engl J Med 366: 207–215 [DOI] [PMC free article] [PubMed] [Google Scholar]
- Swamy M, Siegers GM, Minguet S, Wollscheid B, Schamel WW (2006) Blue native polyacrylamide gel electrophoresis (BN‐PAGE) for the identification and analysis of multiprotein complexes. Sci STKE 2006: pl4 [DOI] [PubMed] [Google Scholar]
- Szklarczyk D, Franceschini A, Wyder S, Forslund K, Heller D, Huerta‐Cepas J, Simonovic M, Roth A, Santos A, Tsafou KP, Kuhn M, Bork P, Jensen LJ, von Mering C (2015) STRING v10: protein‐protein interaction networks, integrated over the tree of life. Nucleic Acids Res 43: D447–D452 [DOI] [PMC free article] [PubMed] [Google Scholar]
- Thevakumaran N, Lavoie H, Critton DA, Tebben A, Marinier A, Sicheri F, Therrien M (2015) Crystal structure of a BRAF kinase domain monomer explains basis for allosteric regulation. Nat Struct Mol Biol 22: 37–43 [DOI] [PubMed] [Google Scholar]
- Tsavachidou D, Coleman ML, Athanasiadis G, Li S, Licht JD, Olson MF, Weber BL (2004) SPRY2 is an inhibitor of the ras/extracellular signal‐regulated kinase pathway in melanocytes and melanoma cells with wild‐type BRAF but not with the V599E mutant. Cancer Res 64: 5556–5559 [DOI] [PubMed] [Google Scholar]
- Turski ML, Vidwans SJ, Janku F, Garrido‐Laguna I, Munoz J, Schwab R, Subbiah V, Rodon J, Kurzrock R (2016) Genomically driven tumors and actionability across histologies: BRAF‐mutant cancers as a paradigm. Mol Cancer Ther 15: 533–547 [DOI] [PubMed] [Google Scholar]
- Vaughan CK, Gohlke U, Sobott F, Good VM, Ali MM, Prodromou C, Robinson CV, Saibil HR, Pearl LH (2006) Structure of an Hsp90‐Cdc37‐Cdk4 complex. Mol Cell 23: 697–707 [DOI] [PMC free article] [PubMed] [Google Scholar]
- Ventura A, Kirsch DG, McLaughlin ME, Tuveson DA, Grimm J, Lintault L, Newman J, Reczek EE, Weissleder R, Jacks T (2007) Restoration of p53 function leads to tumour regression in vivo . Nature 445: 661–665 [DOI] [PubMed] [Google Scholar]
- Vizcaino JA, Csordas A, del‐Toro N, Dianes JA, Griss J, Lavidas I, Mayer G, Perez‐Riverol Y, Reisinger F, Ternent T, Xu QW, Wang R, Hermjakob H (2016) 2016 update of the PRIDE database and its related tools. Nucleic Acids Res 44: D447–D456 [DOI] [PMC free article] [PubMed] [Google Scholar]
- Wan PT, Garnett MJ, Roe SM, Lee S, Niculescu‐Duvaz D, Good VM, Jones CM, Marshall CJ, Springer CJ, Barford D, Marais R (2004) Mechanism of activation of the RAF‐ERK signaling pathway by oncogenic mutations of B‐RAF. Cell 116: 855–867 [DOI] [PubMed] [Google Scholar]
- Wilhelm SM, Carter C, Tang L, Wilkie D, McNabola A, Rong H, Chen C, Zhang X, Vincent P, McHugh M, Cao Y, Shujath J, Gawlak S, Eveleigh D, Rowley B, Liu L, Adnane L, Lynch M, Auclair D, Taylor I et al (2004) BAY 43‐9006 exhibits broad spectrum oral antitumor activity and targets the RAF/MEK/ERK pathway and receptor tyrosine kinases involved in tumor progression and angiogenesis. Cancer Res 64: 7099–7109 [DOI] [PubMed] [Google Scholar]
- Yaktapour N, Meiss F, Mastroianni J, Zenz T, Andrlova H, Mathew NR, Claus R, Hutter B, Frohling S, Brors B, Pfeifer D, Pantic M, Bartsch I, Spehl TS, Meyer PT, Duyster J, Zirlik K, Brummer T, Zeiser R (2014) BRAF inhibitor‐associated ERK activation drives development of chronic lymphocytic leukemia. J Clin Invest 124: 5074–5084 [DOI] [PMC free article] [PubMed] [Google Scholar]
- Zhang BH, Guan KL (2000) Activation of B‐Raf kinase requires phosphorylation of the conserved residues Thr598 and Ser601. EMBO J 19: 5429–5439 [DOI] [PMC free article] [PubMed] [Google Scholar]
Associated Data
This section collects any data citations, data availability statements, or supplementary materials included in this article.
Supplementary Materials
Appendix
Dataset EV1
Dataset EV2
Dataset EV3
Review Process File
Source Data for Figure 1
Source Data for Figure 3
Source Data for Figure 4
Source Data for Figure 5
Source Data for Figure 6