Abstract
Individual inbreeding and historical demography can be estimated by analyzing runs of homozygosity (ROH), which are indicative of chromosomal segments of identity by descent (IBD). Such analyses have so far been rare in natural populations due to limited genomic resources. We analyzed ROH in whole genome sequences from 287 Ficedula flycatchers representing four species, with the objectives of evaluating the causes of genome-wide variation in the abundance of ROH and inferring historical demography. ROH were clearly more abundant in genomic regions with low recombination rate. However, this pattern was substantially weaker when ROH were mapped using genetic rather than physical single nucleotide polymorphism (SNP) coordinates in the genome. Empirical results and simulations suggest that high ROH abundance in regions of low recombination was partly caused by increased power to detect the very long IBD segments typical of regions with a low recombination rate. Simulations also showed that hard selective sweeps (but not soft sweeps or background selection) likely contributed to variation in the abundance of ROH across the genome. Comparisons of the abundance of ROH among several study populations indicated that the Spanish pied flycatcher population had the smallest historical effective population size (Ne) for this species, and that a putatively recently founded island (Baltic) population had the smallest historical Ne among the collared flycatchers. Analysis of pairwise IBD in Baltic collared flycatchers indicated that this population was founded <60 generations ago. This study provides a rare genomic glimpse into demographic history and the mechanisms underlying the genome-wide distribution of ROH.
Keywords: runs of homozygosity, effective population size, population genomics
RELATEDNESS and inbreeding (mating between relatives) have been central concepts in evolutionary biology since the early stages of the modern synthesis (Wright 1931). Related individuals share homologous chromosome segments that coalesce in a recent common ancestor. These segments are said to be “identical by descent” (IBD), as they represent identical copies derived from a single chromosome segment in a common ancestor. Inbred individuals inherit IBD chromosome segments, which are characterized by stretches of homozygous loci (i.e., “runs of homozygosity,” ROH; Figure 1). Following early observations of ROH in humans (Broman and Weber 1999), the ability to genotype large numbers of mapped single nucleotide polymorphisms (SNPs) sparked interest in ROH as a means to precisely estimate individual inbreeding, i.e., the proportion of the genome that is IBD (McQuillan et al. 2008; Keller et al. 2011; Kardos et al. 2015a, 2016). Identification of ROH also implied new possibilities to infer effective population size (Ne) and demographic history (Kirin et al. 2010; Pemberton et al. 2012; MacLeod et al. 2013; Browning and Browning 2015; Kardos et al. 2016), to map loci contributing to recessive disorders (Lander and Botstein 1987; Alkuraya 2010), and to explain variation in the abundance of ROH across the genome (Pemberton et al. 2012).
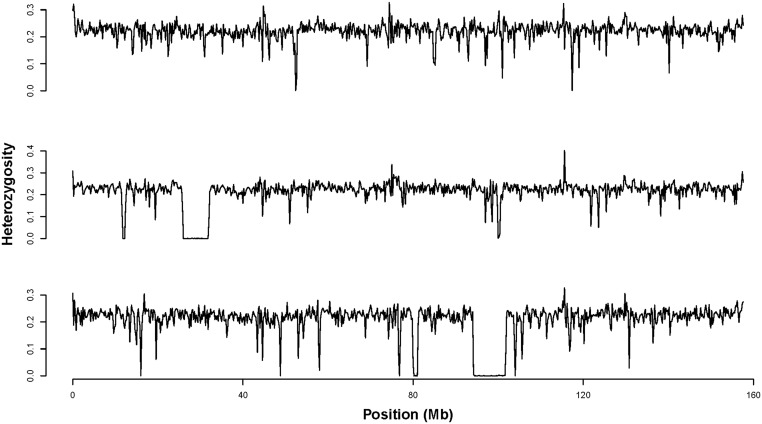
Figure 1.
Heterozygosity across chromosome 2 in three collared flycatchers. Heterozygosity (proportion of heterozygous SNPs) was measured in nonoverlapping 200-kb windows across the entire chromosome. Large IBD segments can be seen as contiguous stretches of windows with zero (or very near zero) heterozygosity.
Although the frequency and genomic distribution of ROH has been characterized in humans (McQuillan et al. 2008, 2012; Auton et al. 2009; Nalls et al. 2009; Kirin et al. 2010; Nothnagel et al. 2010; Polašek et al. 2010; Pemberton et al. 2012) and commercial livestock or closely related species (Pollinger et al. 2011; Purfield et al. 2012; Ferenčaković et al. 2013; Kim et al. 2013; MacLeod et al. 2013), we know little about ROH in natural populations of nonmodel organisms where demographic histories and genomic characteristics often differ substantially from humans and livestock. The rapidly increasing availability of genome assemblies and resequencing data in nonmodel organisms now makes it possible to study ROH at a very high resolution in any species. Studying ROH in whole genome resequencing data from natural populations could substantially advance our understanding of the frequency of inbreeding and inbreeding depression, the genetic basis of inbreeding depression, demographic history, and the mechanisms responsible for genome-wide variation in individual genetic diversity (McQuillan et al. 2008; Keller et al. 2011; Pemberton et al. 2012; Browning and Browning 2015; Kardos et al. 2015a).
Studies in humans and livestock have generally found that the abundance of ROH within populations varies considerably across the genome. ROH may be more abundant in regions with low recombination rates, strong linkage disequilibrium, high gene density, signatures of positive selection, and in regions containing genes thought to be subject to strong purifying selection (Gibson et al. 2006; Wang et al. 2006; Pemberton et al. 2012; Curik et al. 2014). Natural selection may interact with the recombination rate to influence the distribution of the abundance of ROH across the genome. Specifically, both positive and background (purifying) selection reduce Ne and genetic variation at closely linked loci, and this effect should extend over larger chromosome segments in regions with stronger/more frequent selection or lower recombination rate (Charlesworth et al. 1993; Charlesworth 2009).
Analyses of ROH are a potentially powerful way to infer population dynamics because historical fluctuations in Ne affect both the abundance and the length distribution of ROH in a population (Kirin et al. 2010; Pemberton et al. 2012; MacLeod et al. 2013; Browning and Browning 2015). The abundance of short ROH [measured in terms of centimorgans (cM)] is informative of Ne further back in time, while very long ROH are informative of more recent Ne. This is because ROH deriving from more distant ancestors are shorter on average than those arising from more recent ancestors due to longer time for recombination to break up haplotypes. Thus, analyses of the abundance of ROH in different length classes are informative of relative Ne over time (Kirin et al. 2010).
Chromosome segments shared IBD between individuals (i.e., pairwise IBD segments) can also be used to infer historical demography. The relationship between the distribution of pairwise IBD segments and Ne has been analyzed in detail to estimate a time series of recent Ne (Browning and Browning 2015). The approach introduced by Browning and Browning (2015) could potentially make it possible to estimate the timing and magnitude of recent population bottlenecks or founding events, and to evaluate whether anthropogenic interventions or habitat changes have affected Ne over the recent population history. This approach may represent a major advance in the ability to estimate changes in Ne over the recent past. Other methods based on large-scale genomic data (e.g., pairwise sequentially Markovian coalescent, PSMC) can estimate the trajectory of Ne over very long stretches of time in deep population history (Li and Durbin 2011; MacLeod et al. 2013).
In the present study, we analyze ROH in whole genome resequencing data from 10 populations of four closely related Ficedula flycatcher species, representing a total of 284 individuals. These species have recently been subject to detailed genomic investigation, including the development of a 1.1 Gb genome assembly for the collared flycatcher, Ficedula albicollis (Ellegren et al. 2012, Kawakami et al. 2014b), and extensive population genomics analyses of the four Ficedula species that have revealed divergence times of <1 MYA, long-term Ne of 100,000–200,000, and a heterogeneous pattern of genetic differentiation across the genome (Ellegren et al. 2012; Nadachowska-Brzyska et al. 2013, 2016; Kawakami et al. 2014a; Burri et al. 2015; Nater et al. 2015). We evaluate the distribution of ROH abundance across the genome, the relationship of ROH abundance to recombination rate and genetic diversity, and use segments of IBD to infer historical Ne in the study populations. To our knowledge, this is the most extensive ROH study of natural populations so far presented.
Methods
Study populations
We used sequence data from 10 populations of Ficedula flycatchers, representing four different species (Burri et al. 2015; Kardos et al. 2015b). One hundred and four collared flycatchers (F. albicollis) were sampled from the Baltic island of Öland, and 20 collared flycatchers each were sampled from Hungary, the Czech Republic, and Italy. Twenty pied flycatchers (F. hypoleuca) each were sampled from Spain, the Swedish mainland, the Baltic island of Öland, and the Czech Republic. Twenty Atlas flycatchers (F. speculigera) were sampled from the Moroccan Atlas Mountains and 20 semicollared flycatchers (F. semitorquata) were sampled from Bulgaria. Long-term pedigree information suggests that close relatives rarely mate in the Öland collared flycatcher population (A. Qvarnström, unpublished data). The other study populations (where pedigree information is unavailable) are relatively large, and it is therefore likely that mating between close relatives is rare.
DNA extraction, genome resequencing, SNP calling, and filtering
Details of DNA extraction, genome sequencing and alignment, and variant calling methods are described elsewhere (Burri et al. 2015; Kardos et al. 2015b). Briefly, DNA was extracted from blood and all individuals were subjected to 100-bp paired-end whole genome sequencing on an Illumina HiSequation 2000 instrument. Raw sequence reads were mapped to the F. albicollis genome assembly version FicAlb1.5 (Kawakami et al. 2014b) with BWA version 0.7.4 (Li and Durbin 2009). Variant calling and genotyping were carried out on each population individually using the UnifiedGenotyper in the Genome Analysis Tool Kit (McKenna et al. 2010).
Mean sequence coverage at SNP positions ranged from 7.4 to 32.5 (mean = 18.5, SD = 4.8) among all individuals included in the study. The distribution of mean read depth among individuals within each study population is shown in Supplemental Material, Figure S1. The number of SNPs remaining after all filtering steps ranged from 4.6 million for the 20 semicollared flycatchers, to 8.7 million for the 104 Baltic collared flycatchers (Table S1), with mean minor allele frequencies ranging from 0.151 for the Baltic, Italian, and Hungarian collared flycatchers to 0.173 for the Atlas flycatchers (Table S1).
Postvariant calling SNP filtering was done for each population separately using VCFtools (Danecek et al. 2011). We first removed all genotypes with a Phred-scaled genotype quality score <20. We then removed SNPs with genotypes remaining in <75% of individuals, and SNPs that had more than two alleles, to produce the final set of loci that were used in the analyses described below. All of our analyses arbitrarily assumed 5-kb gaps between adjacent scaffolds in the collared flycatcher genome assembly.
Identifying ROH
We used a likelihood-based method to identify ROH in each individual (Broman and Weber 1999; Wang et al. 2009; Pemberton et al. 2012). We used sliding windows of 60 consecutive SNPs with a step size of 10 SNPs. Doubling the window size to 120 SNPs did not substantively affect our results. For each 60-SNP window i, and individual j, we calculated the probability of the genotype at each SNP k (Gk) assuming the SNP is IBD and non-IBD. We then calculated a LOD score by summing the log10 of the ratio of these probabilities across all loci within the window:
The genotype probabilities under IBD and non-IBD were calculated according to Wang et al. (2009), accounting for occasional heterozygous positions within ROH arising from sequencing error and mutation. We assumed that errors and mutations would occur at a rate of 0.0012 within ROH, which was set as being slightly higher than the proportion of nonmatching genotypes for two collared flycatchers whose genomes were each sequenced twice (mean error rate ≈ 0.001) according to the methods described above. We calculated the mismatch rate as the fraction of SNPs where the genotype differed between the two sequencing repeats for each individual; the two individuals had genotype mismatch rates of 0.00062 and 0.00132, respectively.
After calculating the LOD score for each 60-SNP window in each individual, we fitted a density function to the distribution of LOD scores among all individuals within each population using the density function (with a Gaussian smoothing kernel) in the program R. The LOD scores within a population are expected to display a bimodal distribution, with windows located within IBD segments having high LOD scores and windows outside of IBD segments having low scores (Pemberton et al. 2012). Such bimodal distribution of LOD scores was found in each study population (Figure S2). We identified a LOD score threshold as the minimum fitted value of the density function between the two modes of LOD scores in each population. Windows with LOD scores greater than this threshold were classified as putatively IBD. Overlapping windows classified as IBD were joined to form a single ROH. We defined the boundaries of each ROH by the coordinates of the first and last SNP located within the ROH. The high density of SNPs resulting from whole genome resequencing meant that rather short IBD segments arising from distant ancestors could be detected.
Genome-wide distribution of ROH
We used the largest sample of collared flycatchers (104 Baltic island individuals) to determine how ROH abundance varied across the genome, and how ROH abundance was related to recombination rate and nucleotide diversity (π). We mapped ROH using genetic SNP coordinates (i.e., position in linkage map), and separately using physical SNP coordinates. The recombination rate estimates (in 200-kb windows) were from a pedigree-based linkage mapping study (Kawakami et al. 2014b). π was estimated using allele frequencies derived from allele counts among the 104 Baltic collared flycatchers. The genetic mapping position of each SNP was inferred while assuming a constant recombination rate within each 200-kb window.
We measured ROH abundance in nonoverlapping 0.5-cM windows across each chromosome. For each window, we measured ROH abundance as the total overlapping length (in centimorgans) of ROH segments among all 104 individuals. For physical mapping of ROH, we defined ROH abundance as the total amount (in megabases) of ROH among all 104 individuals measured in nonoverlapping 200-kb windows.
Simulations
We used simulations to test the relative importance and possible interaction between selection and recombination rate in explaining variation in ROH abundance across the genome. Background selection or positive selection can reduce Ne in the chromosomal regions surrounding the selected sites. Everything else being equal, the size of the region with reduced Ne due to selection is expected to be larger in genomic regions with low recombination rate. A relatively small number of haplotypes are expected to occur at high frequency where Ne is smaller, and we thus expect a higher proportion of individuals to carry IBD chromosome copies in these regions.
Alternatively, the recombination rate itself could affect the abundance of detected ROH via its effect on the physical length of ROH. ROH are expected to be shorter in regions with high recombination rate. Shorter ROH are expected to go undetected more frequently due to the smaller number of SNPs they contain on average compared to physically longer ROH typical of genomic regions with lower recombination rates. However, this effect could potentially be canceled out by the lower density of SNPs in genomic regions with low recombination rate in Ficedula flycatchers (Burri et al. 2015).
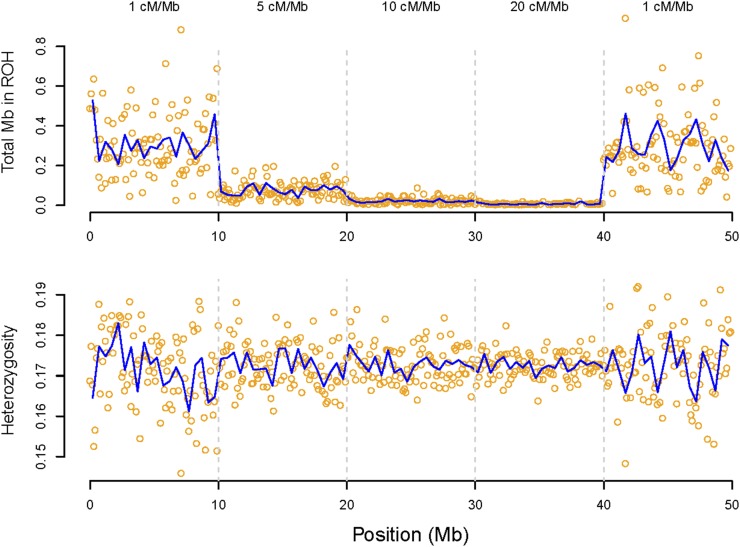
We ran a neutral coalescent simulation in the program fastsimcoal2 (Excoffier et al. 2013) with a realistic value of Ne and the mutation rate to quantify the effect of variation in the recombination rate on the density of detected ROH in the absence of selection. We simulated constant Ne = 100,000 (Nadachowska-Brzyska et al. 2016), and mutation rate (μ) = 5 × 10⁻⁹ per base pair per generation (Ellegren 2007; Smeds et al. 2016) on a single 50-Mb chromosome with variable recombination rate along its length. We set recombination rates that were representative of the spectrum of recombination rates in the collared flycatcher genome, ranging from 1 to 20 cM/Mb in 10-Mb blocks along the length of the simulated chromosome. ROH analysis was done as described above on 100 individuals sampled at the end of the simulation.
We simulated positive selection with the program MSMS (Ewing and Hermisson 2010) to evaluate the effects of complete and incomplete hard and soft selective sweeps on the abundance of detected ROH. Each of 20 simulation replicates assumed 4Neμ = 0.002, Ne = 10,000 (arbitrarily), a recombination rate (r) = 3.1 × 10⁻⁸ per base pair per generation [which is equal to the sex-averaged mean recombination rate across the genome in the collared flycatcher (Kawakami et al. 2014b)], and a single 30-Mb chromosome.
For simulations of complete selective sweeps, a novel positively selected allele was introduced into the population 600 generations before the end of the simulation exactly at the physical center of the chromosome. A relatively large value of the selection coefficient (s = 0.1) was chosen so that the selected mutation would be swept to fixation in a reasonably large proportion of the simulation repetitions. Simulation repetitions where the selected mutation was not swept to fixation (population allele frequency <0.99) were discarded. For hard selective sweeps, the initial frequency of the selected mutation was set to 0.00005, mimicking a single de novo mutation to the positively selected allele. For soft selective sweeps (i.e., sweeps on standing genetic variation, still with s = 0.1) (Pennings and Hermisson 2006), the initial frequency of the selected mutation was 0.05, mimicking the onset of positive selection on a preexisting genetic variant.
Incomplete selective sweeps were simulated by altering the timing of the onset of selection so that the positively selected allele would frequently be at a high frequency (85–95%), but not fixation, at the end of the simulations. Selection was begun 120 generations before the end of the simulations of incomplete hard sweeps. Positive selection was begun 58 generations before the end of the simulations of incomplete soft sweeps. The timing of the onset of selection was based on preliminary simulations where we estimated the number of generations necessary for the selected alleles to reach a frequency between 0.85 and 0.95. For all simulations of both hard and soft incomplete sweeps, only 20 simulation replicates where the positively selected allele reached a frequency between 0.85 and 0.95 were retained. ROH analyses were done on 50 s diploid individuals sampled at the end of each MSMS simulation replicate.
We used the forward genomic simulation program SLiM (Messer 2013) to simulate populations with strong background (purifying) selection. Each of 20 simulation replicates used an initial population size of N = 225 for the first 2500 generations. The population size was lowered to N = 50 between generations 2501 and 2510, and then increased to N = 225 for 10 additional generations, at which point the simulation was ended. The 10-generation population bottleneck was included because preliminary simulations without such a bottleneck resulted in too few ROH to be reliably detected with our analytical approach (data not shown). Each simulation included two 3-Mb chromosomes, and assumed a population-scaled mutation rate of 4Neμ = 0.006, where Ne was equal to the initial population size (225). Initial testing showed that the relatively high value of 4Neμ was necessary to achieve a reasonable level of genetic variation in the SLiM simulations, likely due to the 10-generation population bottleneck. The population-scaled recombination rate (ρ = 4Ner) was set to be representative of the range of recombination rates across the collared flycatcher genome. ρ was set to 0.0005 between positions 1.2 and 1.8 Mb and to 0.05 elsewhere on each chromosome. We simulated strong purifying selection by specifying that 10% of mutations were deleterious with a selection coefficient of s = −0.03. The other 90% of mutations were selectively neutral. ROH analyses were done on 100 diploid individuals sampled at the end of each SLiM simulation replicate. If background selection substantively increased the abundance of ROH in low recombination regions, then we expected to observe a larger increase in ROH in the low recombination region of the chromosome with background selection than on the chromosome without background selection. Repeating the background selection simulations with the program SFSCODE (Hernandez 2008), including a larger selection coefficient on deleterious alleles (s = −0.1), and less genome-wide variation in the recombination rate (ρ = 0.003 in low recombination regions and ρ = 0.03 in high recombination regions) did not substantively affect the results (results not shown).
After all simulations were finished, we estimated the abundance of ROH in each population (in nonoverlapping windows) as described above for the analyses of the empirical flycatcher resequencing data.
Inferring demography from segments of identity by descent
We used two approaches to evaluate historical Ne in the study populations. First, following earlier work in humans (Kirin et al. 2010, Pemberton et al. 2012), we qualitatively evaluated historical Ne among the study populations via analysis of the abundance of ROH in different length categories. This approach is possible because parents are more closely related on average (thus increasing the amount of IBD in offspring) in populations with smaller Ne. We categorized each ROH according to its map length. Three ROH length categories were determined so that the analysis would provide information on Ne during three different time spans: up to 20 generations ago, 20–100 generations ago, and >100 generations ago. The minimum and maximum centimorgan of ROH included in each category were determined by solving the equation l = 100/2g cM (where g is the number of generations back to the common ancestor for the two homologous sequence copies within an ROH, Thompson 2013) for l after replacing g with the number of generations of interest. We then summed the lengths of ROH within each category for each individual and divided this by the map length of the collared flycatcher genome. Populations with a larger average abundance of ROH in a particular length class were inferred to have smaller Ne during that particular time span.
We then took advantage of the large amount of sequence data (104 individuals) from the Baltic collared flycatcher population to quantitatively estimate a time series of recent Ne, following the approach of Browning and Browning (2015). This is possible because the Ne of a population g generations ago determines the expected frequency of segments of pairwise IBD with l = 100/2g cM. For this analysis, we used all SNPs identified in the Baltic collared flycatcher population after the quality control filtering steps described above (8.8 million SNPs). We used the program IBDSeq (Browning and Browning 2013) to identify pairwise IBD segments, using the default settings for the program. We then used output from the IBDSeq analysis as input for the program IBDNe (Browning and Browning 2015) to estimate a time series of historical Ne up to 150 generations into the past. We limited this analysis to data from the 20 chromosomes with the longest estimated map lengths according to a pedigree-based linkage mapping study (Kawakami et al. 2014b). This was done because the method of Browning and Browning (2015) requires >50 cM of contiguous data per chromosome for reliable results. Having overlapping generations means that g and time measured in terms of years cannot be 100% correlated; this may introduce some imprecision in the estimates of recent Ne based on IBD segments.
Data availability
The genome resequencing data used in this study are freely available in EMBL-EBI European Nucleotide Archive (http://www.ebi.ac.uk/ena) under accession numbers PRJEB7359 and PRJEB11502.
Results
Genome-wide distribution of ROH
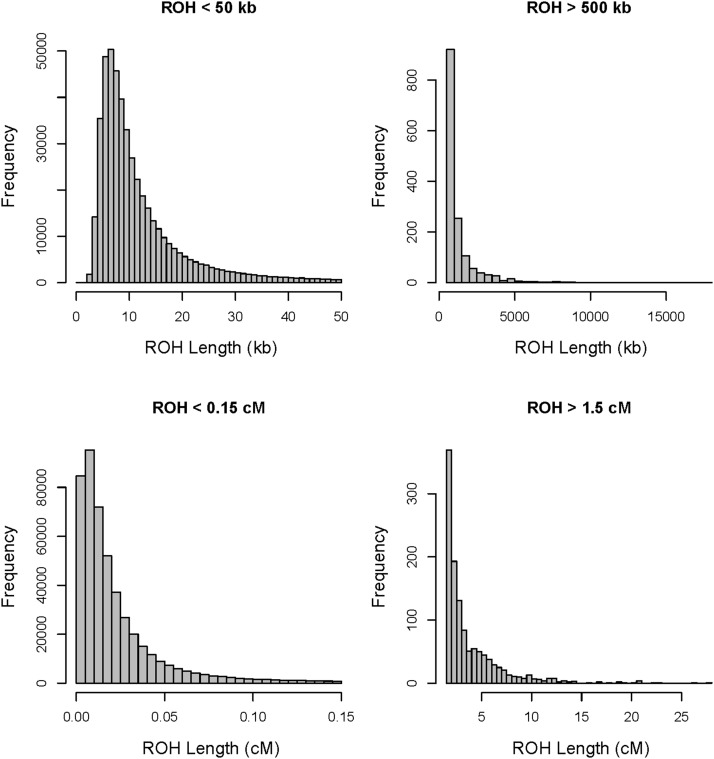
We initially focused on the population with the largest sample size: 104 resequenced genomes of Baltic collared flycatchers with 8.7 million SNPs remaining after quality control filtering. The fraction of the genomes in ROH of any length was what might be considered surprisingly high for a relatively large natural vertebrate population, ranging from 0.07 to 0.16 per individual (Figure S3). The physical lengths of ROH ranged from 953 bp to 17.5 Mb with the genetic and physical ROH lengths being correlated (r2 = 0.53, P < 0.001, Figure S4). ROH ranged from 0 cM (ROH residing entirely in regions with an estimated recombination rate of 0 cM/Mb) to 27.8 cM in genetic length. The distribution of the lengths of IBD segments is shown in Figure 2 and examples of ROH from one chromosome are shown in Figure 1.
Figure 2.
The distribution of IBD segment lengths in 104 Baltic collared flycatchers. (A and B) Physical lengths of IBD segments. (C and D) Genetic IBD segment lengths.
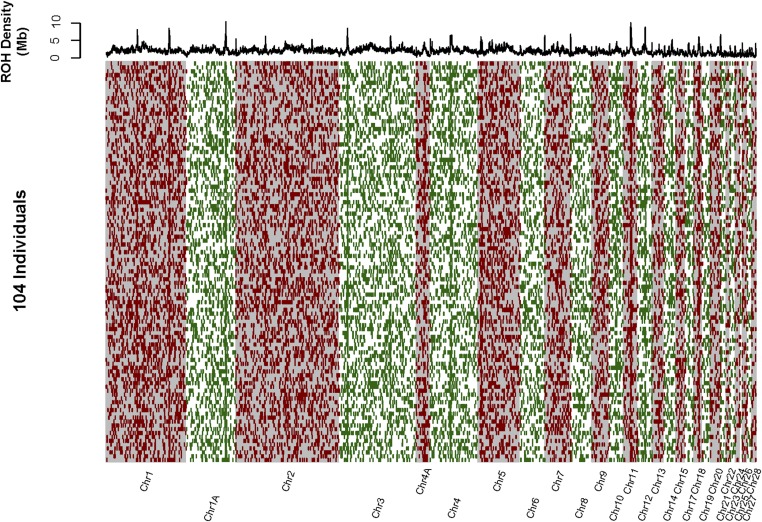
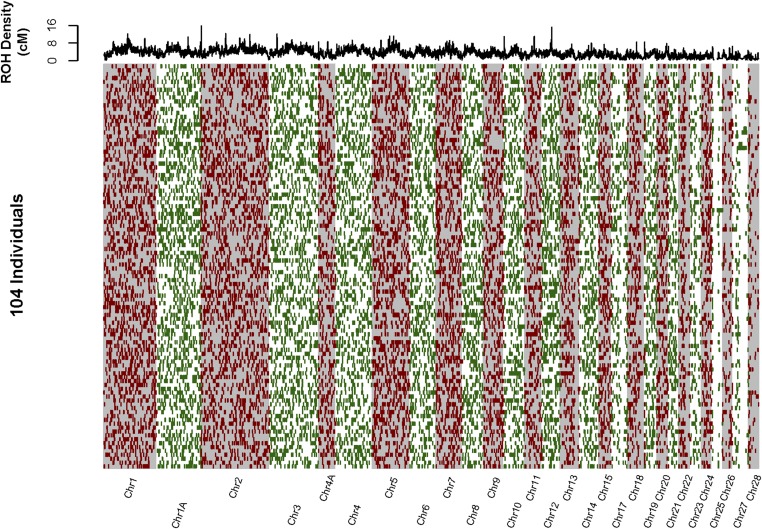
The genome-wide distribution of ROH summed over all 104 individuals is shown in Figure 3 (physical ROH mapping) and Figure 4 (genetic ROH mapping). There were many regions where physically mapped ROH were much more abundant than elsewhere in the genome (i.e., “ROH hotspots,” Figure 3, upper panel). These ROH hotspots frequently coincided with regions with very low recombination rate, and elevated genetic differentiation within and among species (Figure 5, Figure S5, Figure S6, File S2, and File S3). The density of physically mapped ROH was correlated with the recombination rate [r2 = 0.43 linear regression log(total Mb in ROH) vs. log(cM/Mb), P < 0.001], with higher measured ROH abundance occurring in regions with lower recombination rate (Figure S6). ROH “hotspots” were still present, but to a lesser extent, when ROH were mapped in terms of their genetic position in the genome (Figure 4). In particular, the distribution or ROH abundance across the genome was less skewed toward high densities (skewness = 0.67) than when ROH were mapped physically (skewness = 1.82) (Figure S7). Many of the very distinct ROH “hotspots” present in the distribution of physically mapped ROH nearly disappeared when they were mapped genetically.
Figure 3.
The physical mapping of all long (>50 kb) IBD segments in 104 Baltic collared flycatchers. Chromosomes are arranged left to right (alternating gray and white background). The 104 individuals are represented in rows. IBD segments are represented as red and green bars across each individual’s genome. The density of IBD segments across all individuals is represented in the top panel as the sum of the lengths of all overlapping IBD segments in nonoverlapping 200-kb windows.
Figure 4.
The genetic mapping of all long (>0.15 cM) IBD segments in 104 Baltic collared flycatchers. Chromosomes are arranged left to right (alternating gray and white background). The 104 individuals are represented in rows. IBD segments are represented as red and green bars across each individual’s genome. The density of IBD segments across all individuals is represented in the top panel as the sum of the lengths of all overlapping IBD segments in nonoverlapping 0.5-cM windows.
Figure 5.
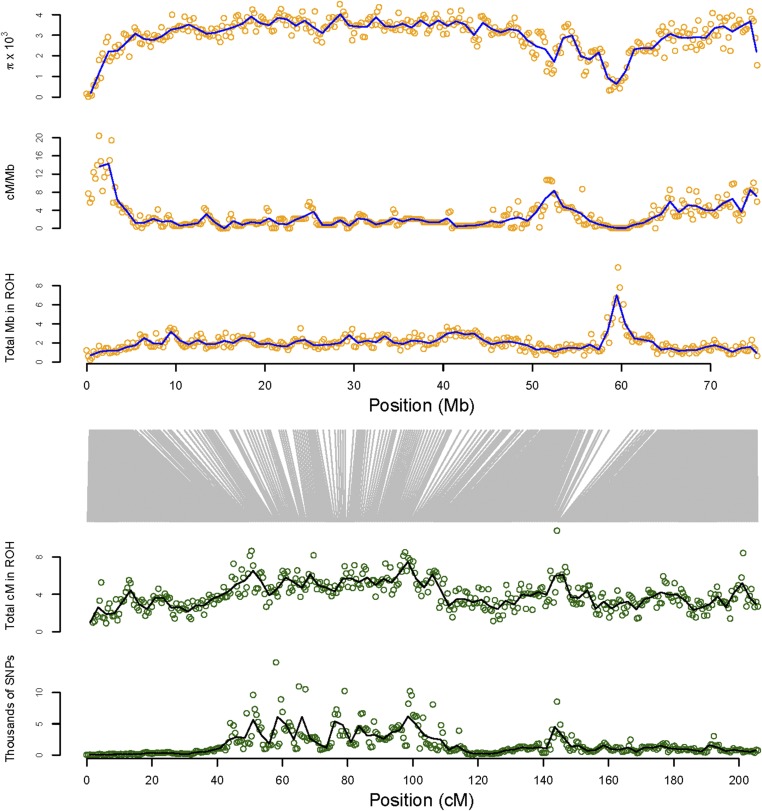
Map of ROH, recombination rate, and estimates of genetic diversity across chromosome 1A from 104 Baltic collared flycatchers. The top three panels (orange points) show nucleotide diversity (π), recombination rate (cM/Mb), and the density of ROH physically mapped in nonoverlapping 200-kb windows. The bottom two panels show the density of ROH and the number of SNPs (thousands) genetically mapped in nonoverlapping 0.5-cM windows. The vertical gray lines translate the center points of the 0.5-cM windows in the lower two panels to the corresponding physical positions in the three upper panels.
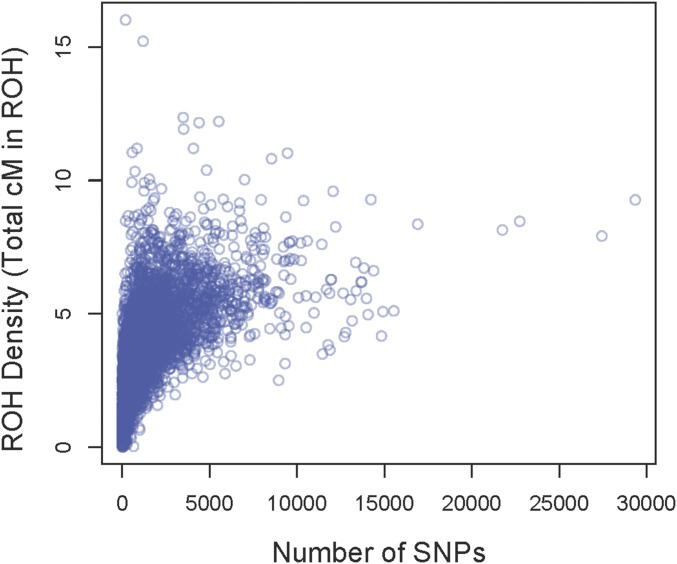
The observation of a negative association between ROH abundance and recombination rate is expected since more recombination results in shorter IBD segments, which are likely less reliably detected. Specifically, the shorter IBD segments in regions with a high recombination rate are expected to contain fewer SNPs on average, and thus to be more difficult to discern from non-IBD segments, than the longer IBD segments typical of regions with lower recombination rate. Moreover, ROH abundance was clearly associated with SNP density per genetic map unit of the genome (Figure 5, Figure 6, and Figure S8) [P < 0.001, r2 = 0.52, linear regression of log(total cM in ROH + 1) vs. log(number of SNPs + 1)]. Thus, our approach to detect ROH likely had elevated power in regions with low recombination rate due to the physically longer ROH present in these regions. Perhaps surprisingly, genomic regions with the lowest nucleotide diversity often had exceptionally high densities of SNPs per centimorgan (Figure 5). This is likely the result of a given genetic distance (e.g., 1 cM) spanning much larger physical chromosome distances in regions with low recombination rate.
Figure 6.
The density of genetically mapped ROH (y-axis) plotted against the number of SNPs in 0.5-cM windows (x-axis).
Effects of recombination rate and natural selection on the abundance of ROH
We used simulations to explore the effects of recombination rate and natural selection on the abundance of detected ROH. First, we simulated chromosomes with varying recombination rate. In the absence of selection, the recombination rate strongly affected the inferred density of ROH (Figure 7). For example, detected ROH were 4.1 times more abundant in regions with a recombination rate of 1 cM/Mb than in parts of the genome with 5 cM/Mb, despite no effect of recombination rate on observed heterozygosity (and thus individual inbreeding) (Figure 7) and nucleotide diversity in the absence of selection (Figure S9).
Figure 7.
Effect of recombination rate on the detection of ROH in a simulated population. The recombination rate for each 10-Mb chromosome block is given at the top. The upper panel shows the density of ROH in nonoverlapping 100-kb windows plotted against physical position on the chromosome (Mb). The bottom panel shows mean observed heterozygosity plotted against physical position in the same 100-kb windows. More ROH are detected in low recombination regions despite no systematic effect of recombination rate on heterozygosity (and thus individual inbreeding).
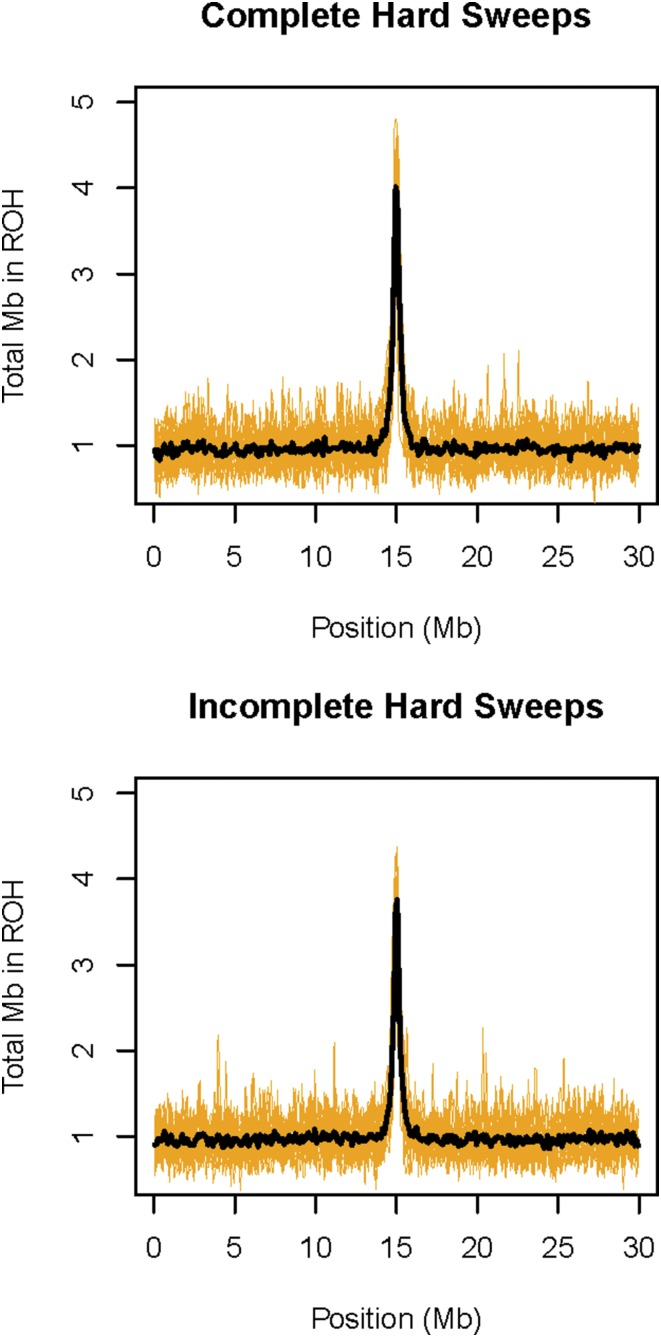
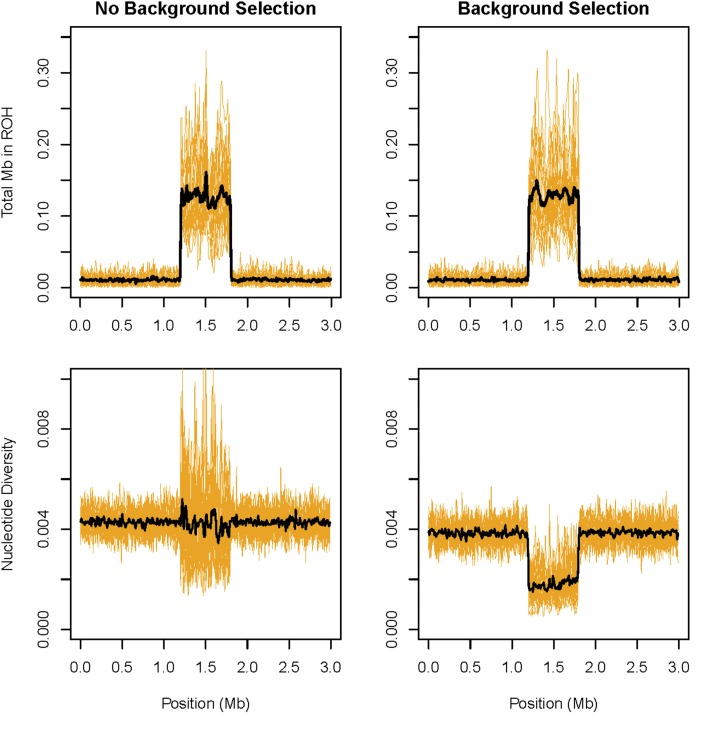
Natural selection greatly influenced the abundance of ROH in simulated populations. Specifically, complete and incomplete hard selective sweeps substantially increased the abundance of ROH in regions surrounding the positively selected alleles (Figure 8). Soft sweeps (selective sweeps on standing genetic variation) had no effect on the density of ROH (Figure S10). Strong background selection also did not substantively affect the abundance of ROH, not even in genomic regions with low recombination rate (Figure 9). Specifically, the increase in ROH abundance in low recombination rate regions relative to the high recombination rate regions was not statistically significantly different between the chromosomes with and without strong purifying selection (P = 0.72, randomization test, see File S4 for details). As expected, π was lower on average (by 53%) in the low recombination region compared to elsewhere on the chromosome with background selection. Only the variance in π (and not its mean) was affected by the recombination rate on the chromosome without background selection.
Figure 8.
Effects of hard selective sweeps on the abundance of ROH. Results from simulations of complete selective sweeps are shown in the top panel, and results from incomplete selective sweeps are shown in the lower panel. The orange lines represent the total Mb in ROH in 100-kb windows for each of 20 replicate simulations. The black links represent the mean Mb in ROH across all simulation repetitions in the same 100-kb windows.
Figure 9.
Effects of recombination rate and background selection on the abundance of ROH. The left panels show the density of ROH (top panel) and nucleotide diversity (bottom panel) in 10-kb windows on the chromosome without purifying selection. The panels on the right show the same results for the chromosome with background selection. The region between 1.2 and 1.8 Mb on each chromosome has a recombination rate 100 times lower than elsewhere on the chromosome. Yellow lines represent the estimates from individual simulation repetitions. The black lines represent the mean windowed estimates across all 20 simulation repetitions.
Inferring demography from ROH abundance in different length categories
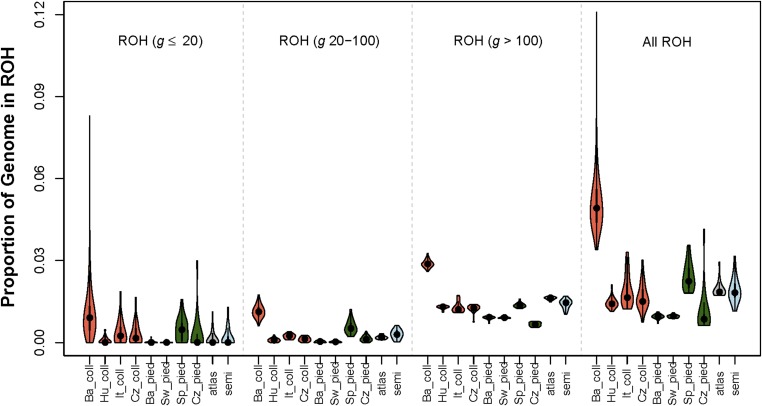
The abundance of ROH in different length categories can be used to qualitatively evaluate the historical demography of populations and species (Kirin et al. 2010). The results presented here are based on analyses of an equal density of SNPs in each study population in order to minimize variation among the study populations in the power to detect IBD segments. The distribution of the proportion of the genome in ROH with estimated g in three different categories is shown in Figure 10 for each study population. Among collared flycatchers, ROH were more abundant in all g categories in the Baltic collared flycatcher population. The high abundance of ROH with both g ≤20 and g >100 suggests that Ne was small for the Baltic collared flycatcher both recently and in deep population history compared to the other collared flycatcher populations. Among the pied flycatchers, the highest total ROH abundance, and the highest ROH abundance in each g category, was found in the Spanish population. This suggests that the Spanish population has had the smallest Ne among the pied flycatcher populations, both recently and in deep history. The Atlas and semicollared flycatchers had ROH abundances similar to the non-Baltic collared flycatcher populations, which suggests that Ne has been relatively large in these populations recently as well as in deep population history.
Figure 10.
Fiddle plot of the fraction of the genome in ROH in three classes of the estimated TRMCA (three left panels), and when considering all ROH (far right panel). Color codes: orange (collared flycatchers); green (pied flycatchers); gray (Atlas flycatchers); light blue (semicollared flycatchers).
A time series of recent Ne for Baltic collared flycatchers
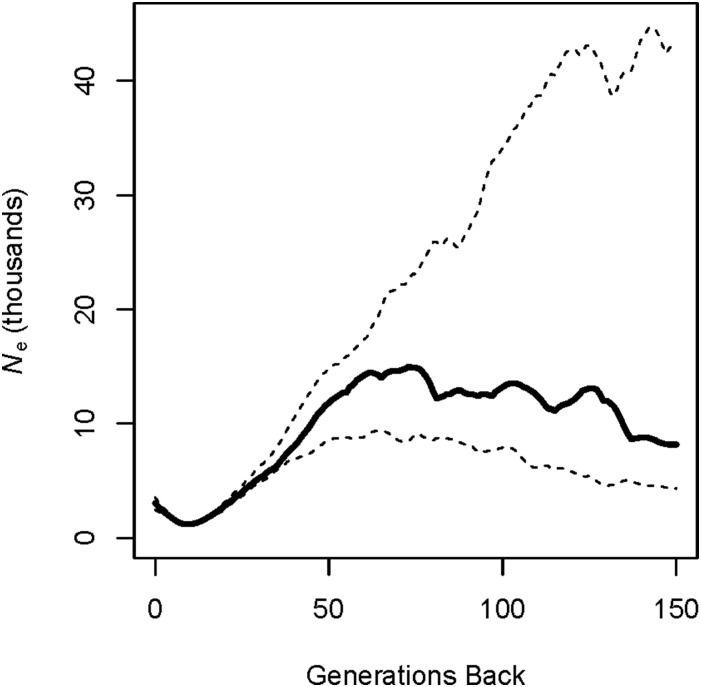
We used resequencing data from the 104 individuals to estimate recent Ne in the Baltic collared flycatcher population, which is thought to have been founded recently. An estimated time series of Ne based on analyses in IBDSeq and IBDNe is shown in Figure 11. The estimates of Ne declined sharply in the population over the last ∼60 generations, with the minimum Ne of 1200 occurring nine generations back, followed by a recent population expansion. Ne ranged between ∼8100 and 15,000 before 60 generations back. This is far less than the estimated long-term Ne for collared flycatchers, i.e., >100,000 (Nadachowska-Brzyska et al. 2016).
Figure 11.
Estimates of recent historical Ne based on pairwise IBD segments in the Baltic collared flycatcher population. The solid black line represents the point estimates of Ne. The dashed lines represent the 95% confidence interval for Ne.
IBDNe tends to smooth over rapid changes in Ne (Browning and Browning 2015), which may be why the results are characterized by a consistent (rather than sudden) reduction in Ne, between ∼60 and 12 generations back. This makes it difficult to precisely identify the time of the founding event. The 95% confidence intervals for Ne were quite narrow back to ∼50 generations ago. However, the confidence intervals for Ne were considerably wider for more distant generations.
Discussion
Genome resequencing of flycatchers provided an excellent opportunity to evaluate the mechanisms underlying genome-wide variation in the density of ROH, and to infer historical demography from sequence data in natural avian populations. The large number of SNPs resulting from full resequencing of 284 genomes made it possible to identify short ROH with higher resolution in this vertebrate system compared to previous analyses of humans and domestic livestock based on SNP genotyping arrays (Kirin et al. 2010; McQuillan et al. 2012; Pemberton et al. 2012; Ferenčaković et al. 2013). Additionally, the substantial variation in recombination rate present within and among chromosomes in flycatchers (Kawakami et al. 2014b) coupled with very high SNP density made it possible to study the relationship between ROH and recombination at a high resolution.
A major observation in our study was that a substantial fraction of the genome was in ROH for individuals from each study population (Figure 10 and Figure S3). The highest proportion of the genome in ROH was found for Baltic collared flycatchers where up to ∼12% of the genome was found to be IBD (after equalizing SNP density among populations, Figure 10). However, individuals from other populations with estimated Ne > 100,000 over the long term (Nadachowska-Brzyska et al. 2013, 2016) also had IBD segments encompassing a considerable fraction of the genome (i.e., ∼1–3%, Figure 10). This result highlights the perhaps counterintuitive expectation from theoretical population genetics that individuals from quite large populations are indeed expected to have a measurable proportion of the genome that is IBD. Heterozygosity is expected to be lost (and inbreeding is expected to increase) at a rate of 1/2Ne per generation (Crow and Kimura 1970). Thus, the mean IBD proportion of individual genomes in a population with Ne = 100,000 after 5000 generations is expected to be 0.025. The great majority of ROH in such large populations are expected to arise from ancestors in deep history, and this is what we found in our results. For example, several Baltic collared flycatcher individuals carried no ROH with estimated g of 20 or fewer generations, while all individuals had a substantial fraction of the genome in ROH with g ≥20 and 100 generations (Figure 10).
Recombination rate and the abundance of ROH
Physically mapped ROH were substantially more abundant in genomic regions with low recombination rate (Figure 5 and Figure S6). This is consistent with results from studies in humans (Pemberton et al. 2012) and livestock (Curik et al. 2014), where such “ROH hotspots” were also found in regions with low recombination rate. This pattern is expected, because an individual is more likely to be homozygous for a physically long haplotype in regions with low recombination rate than in regions with high recombination rate. The longer IBD segments in low recombination regions are more likely to contain enough genotyped SNPs to reliably call the segment as being IBD via analysis of sliding windows containing a given number of SNPs. It is important while interpreting these results to consider that the probability of an individual being IBD at a locus is constant across the genome (i.e., it is unaffected by the recombination rate) under neutral evolution. Thus, the true abundance of IBD segments with a given g is not expected to vary across the genome in the absence of natural selection (see discussion below in Effects of natural selection and the abundance of ROH).
ROH were also more abundant in regions of low recombination rate when they were mapped genetically, but this pattern was less strong (i.e., the distribution of ROH was less skewed) compared to the physically mapped ROH. This likely occurred because the genetic map lengths of ROH are unaffected by the recombination rate. Our results suggest that at least part of the genome-wide variation in the abundance of genetically mapped ROH is due to the effects of SNP density on the power to detect ROH. Specifically, the higher density of SNPs per genetic map unit in regions with low recombination rate appears to have increased the likelihood of detecting ROH in these regions.
The fact that there was a clear positive relationship between the number of SNPs per centimorgan and the abundance of ROH (Figure 6) suggests that the power to detect ROH was indeed higher in regions with low recombination rate. Results from the neutral coalescent simulations, where the density of detected ROH was much higher in low recombination regions (despite no effect of recombination rate on genetic diversity), further support this view. As an example of how recombination rate is likely to affect power to detect ROH, consider a large number of ROH with g = 50 generations. Such ROH are expected to have mean genetic map lengths of 1 cM, and a mean physical length of 100 kb in regions with a recombination rate of 10 cM/Mb but only 10 kb in regions with a recombination rate of 1 cM/Mb. The number of SNPs residing within such an ROH will obviously be much higher on average in the low recombination regions (assuming constant nucleotide diversity across the genome), clearly resulting in an increased likelihood of detecting ROH with a given g in the low recombination regions.
Perhaps surprisingly, the genomic regions with very low nucleotide diversity and recombination rate often had exceptionally high densities of SNPs per centimorgan (Figure 5). This means that power to detect ROH with any given g was elevated in the regions with low nucleotide diversity, at least partially explaining the frequent observation of high ROH abundance in regions of low recombination and very low genetic variation. However, as discussed below, we cannot exclude the possibility that natural selection is responsible for part of the variation in the abundance of ROH across the genome.
These results have implications for the design and interpretation of future studies of ROH in any species. Chromosome segments are inherited as a result of Mendelian segregation and recombination events throughout an individual’s ancestry. Our theoretical understanding of the inheritance of IBD segments is thus naturally written in terms of their expected map lengths (Fisher 1954; Thompson 2013). Additionally, formal inference of demography from ROH or pairwise IBD requires segments to be defined in terms of their genetic mapping positions. Thus, while previous studies have generally focused on physical mapping of ROH (Pemberton et al. 2012; Curik et al. 2014), we recommend that future studies focus analyses on genetic mapping positions of ROH, when possible. Genetically mapping ROH will generally result in a more homogeneous distribution of the density of ROH across the genome, and will explicitly account for the effects of varying recombination rate, and may therefore help to determine whether other factors of interest (e.g., natural selection) substantially affect ROH abundance. Similarly, accounting for the effects of SNP density (i.e., number of SNPs/mapping unit of the genome) on the power to detect ROH will help to accurately identify regions where natural selection has caused a high abundance of ROH.
Effects of natural selection and the abundance of ROH
The simulations including natural selection suggest that complete and incomplete hard selective sweeps substantially increased the abundance of ROH in the region of the selected mutation(s). These results support the idea that regions with high ROH abundance are likely to arise around loci subjected to positive selection (Pemberton et al. 2012; Curik et al. 2014). However, ROH abundance was unaffected by soft selective sweeps according to the simulations, which demonstrates that positive selection is unlikely to create regions of high ROH abundance when the selected allele has a relatively high frequency at the onset of selection.
The high ROH abundance in low recombination regions observed in the Baltic collared flycatcher population may be partially caused by positive selection. However, our results suggest that selection cannot be the sole cause of higher abundance of ROH in regions with low recombination, where increased SNP density per centimorgan increases the likelihood of detecting ROH. Because of the strong effects of positive selection expected on ROH abundance, observing regions with high ROH outside of low recombination rate regions would strongly suggest positive selection as a likely explanation. We did not observe such regions in our study.
Strong background selection did not affect the abundance of ROH in our simulations (Figure 9). We expected that if there was an effect of purifying selection on ROH abundance, it would have been most visible in the low recombination regions, where this mode of selection can strongly affect genetic variation (Figure 9 and Charlesworth et al. 1993). However, there was no such effect, despite nucleotide diversity being strongly reduced in these regions (Figure 9). Thus, we believe that background selection is unlikely to have contributed to the observed high ROH abundance in regions with low recombination rate.
The absence of effects of soft sweeps and background selection on ROH abundance should be seen in the context of the nature of their effects on haplotype diversity. While a hard selective sweep dramatically increases the frequency of a single haplotype in a population, neither soft selective sweeps nor background selection have such an effect. While both soft and hard sweeps increase the frequency of a mutation in the population, only hard sweeps act on a single haplotype, because by definition a hard sweep operates on a de novo mutation. However, when positive selection operates on an allele at relatively high frequency at the onset of selection, a potentially very large number of haplotypes are linked to the positively selected allele, meaning that haplotype diversity can be quite high around the positively selected mutation (Pennings and Hermisson 2006).
Recombination plays a key role in studies of inbreeding, inbreeding depression, and historical demography. It is clearly crucial to account for recombination rate variation across the genome when using IBD information to infer historical demography (Browning and Browning 2015), and when estimating individual inbreeding (Kardos et al. 2016). Recombination rate may also influence the dynamics of inbreeding depression and the efficiency of natural selection at purging of deleterious recessive alleles (Bersabé et al. 2016). Any type of directional selection on a site in the genome will reduce Ne at closely linked sites. The reduction in Ne as a result of selection extends over larger distances across a chromosome when the recombination rate is low (Hill and Robertson 1966; Smith and Haigh 1974; Charlesworth et al. 1993). Selection against deleterious recessive alleles (as with any form of selection) is less efficient when Ne is small (García-Dorado 2012). Thus, it is plausible that populations and genomic regions with low recombination rate may tend to harbor a higher density of deleterious recessive alleles, to suffer stronger inbreeding depression, and to be less responsive to purging selection.
Abundance of ROH and demographic inference in flycatchers
Sequencing individuals from multiple species and populations allowed us to compare ROH abundance among populations, and thus to qualitatively infer differences in historical demography. The very high abundance of ROH with estimated g ≤20 generations in the Baltic collared flycatcher population is consistent with recent founding of this population. The large abundance of ROH with larger g in the Baltic collared flycatcher population relative to other collared flycatcher populations suggests that deep historical Ne was also relatively small for this population. This means that the founders of (and immigrants into) the Öland collared flycatchers likely originated from a relatively small source population (e.g., the neighboring Baltic island of Gotland is a possible source of the founders and immigrants into the Öland population of collared flycatchers). The substantially lower abundance of ROH in the Hungarian, Italian, and Czech collared flycatcher populations suggests that these populations have had relatively large Ne for long periods of time.
The detection of pairwise IBD segments among the large number of resequenced Baltic collared flycatchers using IBDSeq and IBDNe (Browning and Browning 2013, 2015) provided a rare genomic glimpse into the recent demographic history of this population. The time series of estimates of Ne suggest a recent and substantial restriction in this population (Figure 11). These results are consistent with the hypothesis of a recent founding event for the collared flycatchers on the island of Öland (Qvarnström et al. 2009).
It is difficult to determine from our results with precision how small the founding population was, and when the founding event occurred. IBDNe assumes a closed population (Browning and Browning 2015), which is unlikely to hold in this study population. Immigration into the study population from elsewhere likely inflated the estimates of Ne relative to a truly closed population of the same size as the local population. Thus, the estimated minimum Ne during the founding event is likely to overestimate the true minimum during this time period. Additionally, the tendency of IBDNe to smooth over sudden changes in Ne (Browning and Browning 2015) means we cannot precisely pinpoint the timing of the founding event. However, our results suggest that the population was founded no earlier than ∼60 generations ago (Qvarnström et al. 2009).
We interpret the Ne estimates for the time period before 60 generations ago as reflecting the Ne of the source population for Baltic collared flycatchers. The global long-term Ne for collared flycatchers has been estimated at >100,000 (Nadachowska-Brzyska et al. 2013). This suggests that Öland was colonized by individuals from one or a few subpopulations of collared flycatchers (e.g., neighboring Baltic island Gotland).
One of the more surprising results from our ROH analyses was that the Spanish pied flycatcher population had the highest abundance of ROH for all g categories among all populations in this species. Spain is thought to be a glacial refugium from which other European pied flycatchers originated (Nadachowska-Brzyska et al. 2016). Additionally, PSMC analysis results suggest that deep historical Ne was larger in Spain than elsewhere (Nadachowska-Brzyska et al. 2016). Spain being the source population for the other European pied flycatchers would predict higher genetic variation and lower inbreeding in Spain than in the Czech, Swedish, and Baltic populations. However, we observed higher inbreeding (Figure 10) and lower genetic variation (Table S1) in Spain than in the other study populations. These results suggest either that Spain was not the source population for the other study populations, or that demographic events within Spain after other populations had emigrated to the rest of Europe resulted in low genetic variation and high inbreeding in Spain. For example, low habitat quality or climatic events that were most extreme in Spain relative to the rest of Europe could have caused particularly strong recent restrictions in Ne in Spanish pied flycatchers. The lower abundance of ROH in the Czech, Swedish, and Baltic pied flycatchers suggests that these populations have been relatively large for many generations. The Atlas and semicollared flycatchers had ROH abundances similar to collared flycatcher populations aside from the Baltic populations, which suggests that Ne has been relatively large in these populations for quite some time.
In conclusion, our study illustrates that genomic signatures of IBD can provide valuable glimpses into individual inbreeding and the historical demography of natural populations (in this case Ficedula flycatchers) (Palkopoulou et al. 2015; Xue et al. 2015). We expect that many similar investigations will follow as genomic resources become increasingly available for natural populations and as the cost of large-scale sequencing continues to decline. Such investigations will undoubtedly help to elucidate demographic history, the effects of natural selection on the genome-wide patterns of IBD, and the strength of inbreeding depression and its genetic basis in wild populations.
Supplementary Material
Supplemental material is available online at www.genetics.org/lookup/suppl/doi:10.1534/genetics.116.198861/-/DC1.
Acknowledgments
We thank two anonymous reviewers for helpful comments on a previous version of the manuscript. Financial support was provided by the Swedish Research Council, and the Knut and Alice Wallenberg Foundation.
Footnotes
Communicating editor: J. D. Wall
Literature Cited
- Alkuraya F. S., 2010. Homozygosity mapping: one more tool in the clinical geneticist’s toolbox. Genet. Med. 12: 236–239. [DOI] [PubMed] [Google Scholar]
- Auton A., Bryc K., Boyko A. R., Lohmueller K. E., Novembre J., et al. , 2009. Global distribution of genomic diversity underscores rich complex history of continental human populations. Genome Res. 19: 795–803. [DOI] [PMC free article] [PubMed] [Google Scholar]
- Bersabé D., Caballero A., Pérez-Figueroa A., García-Dorado A., 2016. On the consequences of purging and linkage on fitness and genetic diversity. G3 (Bethesda) 6: 171–181. [DOI] [PMC free article] [PubMed] [Google Scholar]
- Broman K. W., Weber J. L., 1999. Long homozygous chromosomal segments in reference families from the centre d’Etude du polymorphisme humain. Am. J. Hum. Genet. 65: 1493–1500. [DOI] [PMC free article] [PubMed] [Google Scholar]
- Browning B. L., Browning S. R., 2013. Detecting identity by descent and estimating genotype error rates in sequence data. Am. J. Hum. Genet. 93: 840–851. [DOI] [PMC free article] [PubMed] [Google Scholar]
- Browning S. R., Browning B. L., 2015. Accurate non-parametric estimation of recent effective population size from segments of identity by descent. Am. J. Hum. Genet. 97: 404–418. [DOI] [PMC free article] [PubMed] [Google Scholar]
- Burri R., Nater A., Kawakami T., Mugal C. F., Olason P. I., et al. , 2015. Linked selection and recombination rate variation drive the evolution of the genomic landscape of differentiation across the speciation continuum of Ficedula flycatchers. Genome Res. 25: 1656–1665. [DOI] [PMC free article] [PubMed] [Google Scholar]
- Charlesworth B., 2009. Effective population size and patterns of molecular evolution and variation. Nat. Rev. Genet. 10: 195–205. [DOI] [PubMed] [Google Scholar]
- Charlesworth B., Morgan M., Charlesworth D., 1993. The effect of deleterious mutations on neutral molecular variation. Genetics 134: 1289–1303. [DOI] [PMC free article] [PubMed] [Google Scholar]
- Crow J. F., Kimura M., 1970. An Introduction To Population Genetics Theory. The Blackburn Press, Caldwell, NJ. [Google Scholar]
- Curik I., Ferenčaković M., Sölkner J., 2014. Inbreeding and runs of homozygosity: a possible solution to an old problem. Livest. Sci. 166: 26–34. [Google Scholar]
- Danecek P., Auton A., Abecasis G., Albers C. A., Banks E., et al. , 2011. The variant call format and VCFtools. Bioinformatics 27: 2156–2158. [DOI] [PMC free article] [PubMed] [Google Scholar]
- Ellegren H., 2007. Molecular evolutionary genomics of birds. Cytogenet. Genome Res. 117: 120–130. [DOI] [PubMed] [Google Scholar]
- Ellegren H., Smeds L., Burri R., Olason P. I., Backström N., et al. , 2012. The genomic landscape of species divergence in Ficedula flycatchers. Nature 491: 756–760. [DOI] [PubMed] [Google Scholar]
- Ewing G., Hermisson J., 2010. MSMS: a coalescent simulation program including recombination, demographic structure and selection at a single locus. Bioinformatics 26: 2064–2065. [DOI] [PMC free article] [PubMed] [Google Scholar]
- Excoffier L., Dupanloup I., Huerta-Sánchez E., Sousa V. C., Foll M., 2013. Robust demographic inference from genomic and SNP data. PLoS Genet. 9: e1003905. [DOI] [PMC free article] [PubMed] [Google Scholar]
- Ferenčaković M., Hamzić E., Gredler B., Solberg T., Klemetsdal G., et al. , 2013. Estimates of autozygosity derived from runs of homozygosity: empirical evidence from selected cattle populations. J. Anim. Breed. Genet. 130: 286–293. [DOI] [PubMed] [Google Scholar]
- Fisher R. A., 1954. A fuller theory of “junctions” in inbreeding. Heredity 8: 187–197. [Google Scholar]
- García-Dorado A., 2012. Understanding and predicting the fitness decline of shrunk populations: inbreeding, purging, mutation, and standard selection. Genetics 190: 1461–1476. [DOI] [PMC free article] [PubMed] [Google Scholar]
- Gibson J., Morton N. E., Collins A., 2006. Extended tracts of homozygosity in outbred human populations. Hum. Mol. Genet. 15: 789–795. [DOI] [PubMed] [Google Scholar]
- Hernandez R. D., 2008. A flexible forward simulator for populations subject to selection and demography. Bioinformatics 24: 2786–2787. [DOI] [PMC free article] [PubMed] [Google Scholar]
- Hill W. G., Robertson A., 1966. The effect of linkage on limits to artificial selection. Genet. Res. 8: 269–294. [PubMed] [Google Scholar]
- Kardos M., Luikart G., Allendorf F. W., 2015a Measuring individual inbreeding in the age of genomics: marker-based measures are better than pedigrees. Heredity 115: 63–72. [DOI] [PMC free article] [PubMed] [Google Scholar]
- Kardos M., Husby A., McFarlane S. E., Qvarnström A., Ellegren H., 2015b Whole-genome resequencing of extreme phenotypes in collared flycatchers highlights the difficulty of detecting quantitative trait loci in natural populations. Mol. Ecol. Resour. 16: 727–741. [DOI] [PubMed] [Google Scholar]
- Kardos M., Taylor H. R., Ellegren H., Luikart G., Allendorf F. W., 2016. Genomics advances the study of inbreeding depression in the wild. Evol. Appl. 9: 1205–1218. [DOI] [PMC free article] [PubMed] [Google Scholar]
- Kawakami T., Backström N., Burri R., Husby A., Olason P., et al. , 2014a Estimation of linkage disequilibrium and interspecific gene flow in Ficedula flycatchers by a newly developed 50k single-nucleotide polymorphism array. Mol. Ecol. Resour. 14: 1248–1260. [DOI] [PMC free article] [PubMed] [Google Scholar]
- Kawakami T., Smeds L., Backström N., Husby A., Qvarnström A., et al. , 2014b A high-density linkage map enables a second-generation collared flycatcher genome assembly and reveals the patterns of avian recombination rate variation and chromosomal evolution. Mol. Ecol. 23: 4035–4058. [DOI] [PMC free article] [PubMed] [Google Scholar]
- Keller M. C., Visscher P. M., Goddard M. E., 2011. Quantification of inbreeding due to distant ancestors and its detection using dense single nucleotide polymorphism data. Genetics 189: 237–249. [DOI] [PMC free article] [PubMed] [Google Scholar]
- Kim E.-S., Cole J. B., Huson H., Wiggans G. R., Van Tassell C. P., et al. , 2013. Effect of artificial selection on runs of homozygosity in US Holstein cattle. PLoS One 8: e80813. [DOI] [PMC free article] [PubMed] [Google Scholar]
- Kirin M., McQuillan R., Franklin C. S., Campbell H., McKeigue P. M., et al. , 2010. Genomic runs of homozygosity record population history and consanguinity. PLoS One 5: e13996. [DOI] [PMC free article] [PubMed] [Google Scholar]
- Lander E. S., Botstein D., 1987. Homozygosity mapping: a way to map human recessive traits with the DNA of inbred children. Science 236: 1567–1570. [DOI] [PubMed] [Google Scholar]
- Li H., Durbin R., 2009. Fast and accurate short read alignment with Burrows–Wheeler transform. Bioinformatics 25: 1754–1760. [DOI] [PMC free article] [PubMed] [Google Scholar]
- Li H., Durbin R., 2011. Inference of human population history from individual whole-genome sequences. Nature 475: 493–496. [DOI] [PMC free article] [PubMed] [Google Scholar]
- MacLeod I. M., Larkin D. M., Lewin H. A., Hayes B. J., Goddard M. E., 2013. Inferring demography from runs of homozygosity in whole genome sequence, with correction for sequence errors. Mol. Biol. Evol. 30: 2209–2223. [DOI] [PMC free article] [PubMed] [Google Scholar]
- McKenna A., Hanna M., Banks E., Sivachenko A., Cibulskis K., et al. , 2010. The Genome Analysis Toolkit: a MapReduce framework for analyzing next-generation DNA sequencing data. Genome Res. 20: 1297–1303. [DOI] [PMC free article] [PubMed] [Google Scholar]
- McQuillan R., Leutenegger A. L., Abdel-Rahman R., Franklin C. S., Pericic M., et al. , 2008. Runs of homozygosity in European populations. Am. J. Hum. Genet. 83: 359–372. [DOI] [PMC free article] [PubMed] [Google Scholar]
- McQuillan R., Eklund N., Pirastu N., Kuningas M., McEvoy B. P., et al. , 2012. Evidence of inbreeding depression on human height. PLoS Genet. 8: e1002655. [DOI] [PMC free article] [PubMed] [Google Scholar]
- Messer P. W., 2013. SLiM: simulating evolution with selection and linkage. Genetics 194: 1037–1039. [DOI] [PMC free article] [PubMed] [Google Scholar]
- Nadachowska-Brzyska K., Burri R., Olason P. I., Kawakami T., Smeds L., et al. , 2013. Demographic divergence history of pied flycatcher and collared flycatcher inferred from whole-genome re-sequencing data. PLoS Genet. 9: e1003942. [DOI] [PMC free article] [PubMed] [Google Scholar]
- Nadachowska-Brzyska K., Burri R., Smeds L., Ellegren H., 2016. PSMC analysis of effective population sizes in molecular ecology and its application to black-and-white Ficedula flycatchers. Mol. Ecol. 25: 1058–1072. [DOI] [PMC free article] [PubMed] [Google Scholar]
- Nalls M. A., Simon-Sanchez J., Gibbs J. R., Paisan-Ruiz C., Bras J. T., et al. , 2009. Measures of autozygosity in decline: globalization, urbanization, and its implications for medical genetics. PLoS Genet. 5: e1000415. [DOI] [PMC free article] [PubMed] [Google Scholar]
- Nater A., Burri R., Kawakami T., Smeds L., Ellegren H., 2015. Resolving evolutionary relationships in closely related species with whole-genome sequencing data. Syst. Biol. 64: 1000–1017. [DOI] [PMC free article] [PubMed] [Google Scholar]
- Nothnagel M., Lu T. T., Kayser M., Krawczak M., 2010. Genomic and geographic distribution of SNP-defined runs of homozygosity in Europeans. Hum. Mol. Genet. 19: 2927–2935. [DOI] [PubMed] [Google Scholar]
- Palkopoulou E., Mallick S., Skoglund P., Enk J., Rohland N., et al. , 2015. Complete genomes reveal signatures of demographic and genetic declines in the woolly mammoth. Curr. Biol. 25: 1395–1400. [DOI] [PMC free article] [PubMed] [Google Scholar]
- Pemberton T. J., Absher D., Feldman M. W., Myers R. M., Rosenberg N. A., et al. , 2012. Genomic patterns of homozygosity in worldwide human populations. Am. J. Hum. Genet. 91: 275–292. [DOI] [PMC free article] [PubMed] [Google Scholar]
- Pennings P. S., Hermisson J., 2006. Soft sweeps II – molecular population genetics of adaptation from recurrent mutation or migration. Mol. Biol. Evol. 23: 1076–1084. [DOI] [PubMed] [Google Scholar]
- Polašek O., Hayward C., Bellenguez C., Vitart V., Kolčić I., et al. , 2010. Comparative assessment of methods for estimating individual genome-wide homozygosity-by-descent from human genomic data. BMC Genomics 11: 139. [DOI] [PMC free article] [PubMed] [Google Scholar]
- Pollinger J. P., Earl D. A., Knowles J. C., Boyko A. R., Parker H., et al. , 2011. A genome-wide perspective on the evolutionary history of enigmatic wolf-like canids. Genome Res. 21: 1294–1305. [DOI] [PMC free article] [PubMed] [Google Scholar]
- Purfield D. C., Berry D. P., McParland S., Bradley D. G., 2012. Runs of homozygosity and population history in cattle. BMC Genet. 13: 70. [DOI] [PMC free article] [PubMed] [Google Scholar]
- Qvarnström A., Wiley C., Svedin N., Vallin N., 2009. Life-history divergence facilitates regional coexistence of competing Ficedula flycatchers. Ecology 90: 1948–1957. [DOI] [PubMed] [Google Scholar]
- Smeds L., Qvarnstrom A., Ellegren H., 2016. Direct estimate of the rate of germline mutation in a bird. Genome Res. 26: 1211–1218. [DOI] [PMC free article] [PubMed] [Google Scholar]
- Smith J. M., Haigh J., 1974. The hitch-hiking effect of a favourable gene. Genet. Res. 23: 23–35. [PubMed] [Google Scholar]
- Thompson E. A., 2013. Identity by descent: variation in meiosis, across genomes, and in populations. Genetics 194: 301–326. [DOI] [PMC free article] [PubMed] [Google Scholar]
- Wang H., Lin C.-H., Chen Y., Freimer N., Sabatti C., 2006. Linkage disequilibrium and haplotype homozygosity in population samples genotyped at a high marker density. Hum. Hered. 62: 175–189. [DOI] [PubMed] [Google Scholar]
- Wang S., Haynes C., Barany F., Ott J., 2009. Genome-wide autozygosity mapping in human populations. Genet. Epidemiol. 33: 172–180. [DOI] [PMC free article] [PubMed] [Google Scholar]
- Wright S., 1931. Evolution in Mendelian populations. Genetics 16: 97–159. [DOI] [PMC free article] [PubMed] [Google Scholar]
- Xue Y., Prado-Martinez J., Sudmant P. H., Narasimhan V., Ayub Q., et al. , 2015. Mountain gorilla genomes reveal the impact of long-term population decline and inbreeding. Science 348: 242–245. [DOI] [PMC free article] [PubMed] [Google Scholar]
Associated Data
This section collects any data citations, data availability statements, or supplementary materials included in this article.
Supplementary Materials
Data Availability Statement
The genome resequencing data used in this study are freely available in EMBL-EBI European Nucleotide Archive (http://www.ebi.ac.uk/ena) under accession numbers PRJEB7359 and PRJEB11502.


