

Abstract
The exosome is a key initiator of pre-metastatic niche in numerous cancers, where macrophages serve as primary inducers of tumor microenvironment. However, the proteome that can be exosomally transported from cancer cells to macrophages has not been sufficiently characterized so far. Here, we used colorectal cancer (CRC) exosomes to educate tumor-favorable macrophages. With a SILAC-based mass spectrometry strategy, we successfully traced the proteome transported from CRC exosomes to macrophages. Such a proteome primarily focused on promoting cytoskeleton rearrangement, which was biologically validated with multiple cell lines. We reproduced the exosomal transportation of functional vimentin as a proof-of-concept example. In addition, we found that some CRC exosomes could be recognized by macrophages via Fc receptors. Therefore, we revealed the active and necessary role of exosomes secreted from CRC cells to transform cancer-favorable macrophages, with the cytoskeleton-centric proteins serving as the top functional unit.
Keywords: exosomes, tumor-associated macrophages, proteome, transportation, cytoskeleton-centric
INTRODUCTION
Since the last decade, increasing evidence has suggested that extracellular vesicles (EVs) are critical for the malignant progression of solid tumors, and they represent one of the most competent information deliverers in tumor microenvironment (reviewed in ref. [1–3]). Such information is composed of protein, RNA, DNA, lipids and others, such as small molecules [4, 5]. EVs are now known to be highly heterogenic; for example, Hong et al have found that a single cancer cell line can release at least three subtypes of EVs based on deep sequencing analyses [6], which is consistent with their earlier proteomic analyses [7].
As one of the EV subsets, exosomes with the size of 30-150 nm in diameter have been recently found to induce cancer pre-metastatic niche for their integrin-dependent and organ-specific homing behaviors [8]. This niche is also characterized by the extracellular matrix modulation via tumor exosomes to facilitate cancer cell motility and invasion [9, 10]. In such a scenario, the exosome works like a “special agent” to light inflammatory and chemotactic signals, preparing for the rendezvous of circulating cancer cells. This expanded the current knowledge of the exosome's role in cell-cell communication between tumor and stroma cells in situ [11–16]. Such an exosome-relevant homing feature has now been linked to cancer-associated inflammation at the pre-metastatic site in the lymph node, lung, liver and brain [16–20].
Indeed, other than nucleic acids such as microRNAs, Peinado et al have unveiled an exosomally transported oncoprotein of melanoma cells, the receptor tyrosine kinase MET, which initiates long distance inflammation to chemotactically attract circulating cancer cells [21]. Along with numerous other evidence [12, 22–24], the exosome has been recognized to be a specialized group of EVs for the functional transportation of oncoproteins. This moves the field forward as early opinions have deemed the exosome a “garbage can”, merely functioning as a degradation compartment (reviewed in ref. [25, 26]). Although intensively important proteomics profiling studies have been published in the field of cancer exosomes [7, 27–34], what proteins can be ultimately and functionally transported from cancer cells to target cells via exosomes has not been investigated in the view of systems biology.
Tumor-associated macrophages (TAMs) in situ are known promoters for cancer progression in numerous cancers, including colorectal cancer (CRC) [35–37]. Indeed, acquiring sufficient TAMs should be a critical step for the circulating cancer cells to survive at the homing site. However, the systems mechanism of the exosomally transported proteome from cancer cells to macrophages for developing TAMs is unclear. In this regard, we established an in vitro model of CRC exosome-educated mouse bone marrow-derived macrophage (BMM) to acquire cancer-favorable differentiation of BMM. We developed a SILAC-based mass spectrometry (MS) strategy to trace the proteome that was functionally transported from CRC cells to BMMs via exosomes. By using multiple cell lines and various biological validations, we depicted the cancer cell-derived exosomal language and the possible mechanism of the exosome recognition by macrophages.
RESULTS
CT-26 cell-derived exosomes educate cancer cell-favorable macrophages
With analyses on multiple compartments as illustrated in Figure 1A, we validated a model of mouse CT-26 cell-derived exosomes (CT-26 exosomes) educated macrophages. First, we determined that ∼70% CT-26 exosomes had the size ranging from 30 to 150 nm in diameter (Figure 1B). The maximum size (∼300 nm) was similar to an exosome doublet (150 nm in diameter for each singlet) (Figure 1B). It has been found that NanoSight technology may tend to over-estimate the particle size [38]. With transmission electron microscopy (TEM), we visually confirmed that our CT-26 exosomes were largely with the expected size of 30-150 nm in diameter (Figure 1C). In addition, we confirmed the expression of known exosomal biomarkers of CD63, CD9 and Hsp90 (Figure 1D). Mouse bone marrow cells were allowed to differentiate for 3 days, followed by the addition of CT-26 exosomes and additional 3 days' culture to model the CRC cell exosome-educated macrophages (CEEMs). We observed that CEEMs were characterized by the up-regulation of macrophage maturation biomarkers of CD80 (Figure 1E) and CD86 (Figure 1F), as well as the increase of cathepsin B activity (Figure 1G) as compared with BMMs. Such activation was able to be amplified by adding more CT-26 exosomes (Figure 1E-1G).
Figure 1. CT-26 cell-derived exosomes are sufficient to transform cancer cell-favorable macrophages.
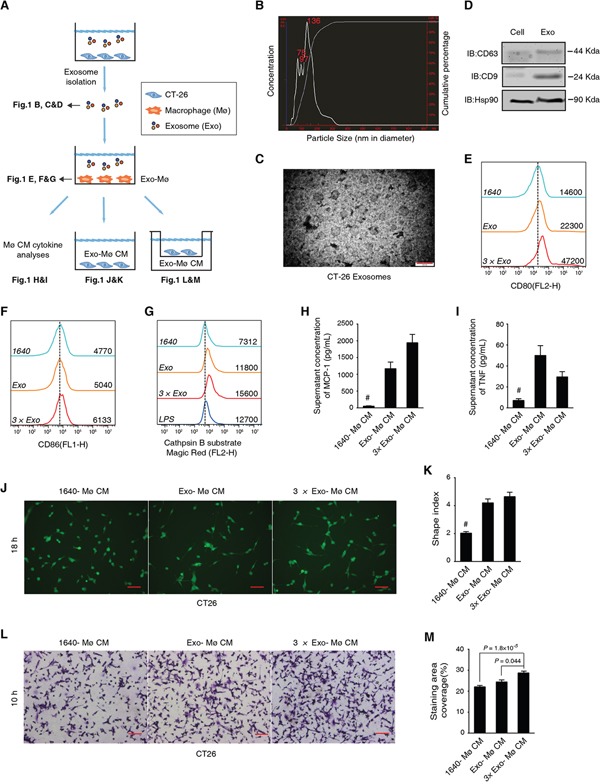
A. Schematic diagram of the experimental design and results shown in each panel. Mø stands for macrophages, Exo for exosomes, and CM for conditioned media. B. Size distribution of CT-26 exosomes determined by NanoSight. C. TEM observation of CT-26 exosomes. Scale bar = 200 nm. D. Immunoblotting analysis on the exosomal biomarkers CD63, CD9 and Hsp90. E, F. Maturation analysis of CT-26 exosome-educated BMMs. Different doses of exosomes, 1× (Exo; the exosome secreted from 3.5×10⁶ cells) or 3× Exo, were added into BMM cultures. FCM results on CD80 (E) and CD86 (F) are respectively shown with fresh RPMI 1640 (1640) cultured cells as the negative control. The mean fluorescent intensities (MFIs) of each group are shown on the right side of each curve. The dashed line indicates the peak value of the negative control group. G. FCM assay on cathepsin B activity in live cells. LPS-treated BMMs were used as a positive control. H, I. Cytometric bead array assays (CBA) analysis on the BMM cytokine secretion. Statistical results of MCP-1 (H) and TNF (I) are shown. #P < 0.01, n = 3, compared with any of the other groups, respectively. J, K. Representative CFSE staining image (J) and statistical analysis on the shape index of CT-26 cells (K). Scale bar = 20 μm; #P < 0.01, cell n = 80, compared with any of the other groups. L, M. Representative images (L) and statistical comparisons of the transmembrane cell staining area of CT-26 cells. Scale bar = 20 μm (M). CT-26 cells were induced to migrate toward different CM. Data are shown as mean ± s.e.m. and n = 3.
Through Cytometric Bead Array (CBA) cytokine array analyses, we found that CEEMs secreted significantly more MCP-1 (Figure 1H; >10 folds) and TNF (Figure 1I) than BMMs, while no statistical difference was observed regarding IL-6, IL-10, IFN-γ, and IL-12p70 (Supplemental Figure S1A). Similar to TNF, MCP-1 is known to promote CRC cell growth [37]. Such intensive MCP-1 secretion led us to posit that the aberrant CEEM activation was favorable to CRC cell migration, which was supported by the analysis of reciprocal effects of CEEM conditioned media (CM) on CT-26 cells (Figure 1J-1M). In general, the CM acquired from CEEM cultures could significantly increase the shape index (Figure 1J&1K), and significantly promote the transmembrane migration of CT-26 cells (Figure 1L&1M). We further found that the exosome could significantly promote the NFκB expression with NFκB-luciferase reporter gene incorporated RAW264.7 cells (Supplemental Figure S1B). Hence, the CT-26 exosome is a sufficient factor to induce tumor-associated inflammation with the aberrant macrophage activation.
Characterization of exosomally transported proteome
We used the strategy shown in Figure 2A to trace the exosomally transported proteins from CT-26 cells to BMMs. We emphasized that BMMs were pretreated with cycloheximide (CHX) to avoid the reuse of labeled amino acids from degraded peptides (Figure 2A); no significant CHX-induced cytotoxicity in BMMs was observed (Supplemental Figure S2A).
Figure 2. Endpoint tracing of CT-26 exosome transported proteome in macrophages.
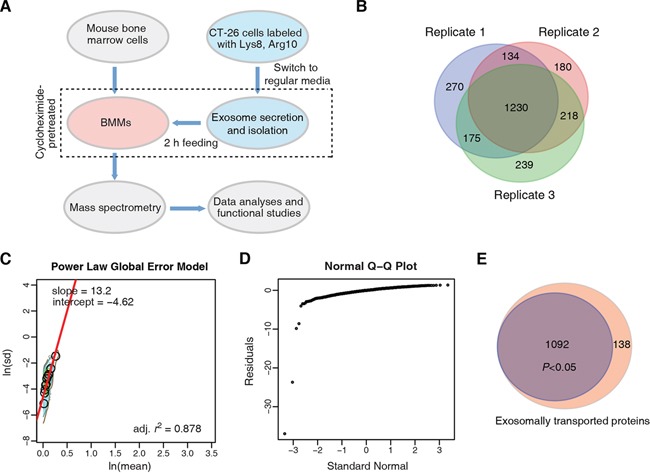
A. Strategy for the exosomally transported proteome study. B. Venn diagram comparison of exosomally transported proteins identified and quantified in macrophages, acquired from three independent biological replicates. C. PLGEM analysis for detecting transported proteins with statistically consistent relative abundance. The protein standard deviations (In(sd)) and means (In(mean)) were linearly fitted by PLGEM. D. Q-Q plot. E. Venn diagram that shows the fraction of DEPs.
With MS analyses, we identified 4143, 4233 and 4241 proteins (peptide and protein level FDR < 1%, with at least 2 exclusively unique peptides) in three independent experiments, respectively (Supplemental Figure S2B and Supplemental Table S1). Among them, 1809, 1762 and 1862 had quantification information in the same three biological replicates, respectively (Figure 2B); each quantified protein was based on the H/L ratios acquired from at least 2 quantified exclusively unique peptides. There were 1230 such quantified proteins that were consistently identified across the three MS analyses (Supplemental Table S2). We then used Power Law Global Error Model (PLGEM) algorithm [39, 40] to test whether a protein could be transported from CT-26 cells to BMMs via the exosome with statistically consistent relative abundance. We found that ln(mean) and ln(SD) of protein H/L ratios had strong linear correlation fitted by the PLGEM, with r2 = 0.878 (Figure 2C). The H/L ratio residuals showed normal distribution (Supplemental Figure S2C), and the deviation of residuals was independent from the protein relative abundance (Supplemental Figure S2D). Q-Q plot showed that the residuals of the quantified proteins obeyed normal distribution (Figure 2D). These results indicated that PLGEM worked properly to model the above MS quantification data to find differentially expressed proteins (DEPs). Here, we define the DEPs as the heavy proteins identified in BMMs with H/L values, which represent the relative amount of proteins transported from CT-26 cells to macrophages. Accordingly, 1092 out of the 1230 consistently quantified proteins were accepted as significant DEPs by the signal to noise (STN) analysis of PLGEM (P < 0.05) (Figure 2E and Supplemental Table S3).
Pathway analysis of the endpoint exosomally transported proteome
The ClueGO+CluePedia analysis enriched the 1092 significant DEPs into 36 GO terms (right-hypergeometric test with Bonferroni correction to P < 0.05), which were further clustered into 9 groups (Figure 3A and Supplemental Table S4). As a positive control, the vesicle-mediated transport (Group 8) was distinguished, justifying the exosomal involvement of the traced proteome (Figure 3A). Notably, 17 out of the 36 GO terms consisted of the greatest gene number were clustered into the actin filament-based process (Group 1; 76 genes) (Figure 3A). The cancer phenotype-relevant pathways included translational initiation (Group 0), phosphorus metabolic process (Group 4) and reactive oxygen species metabolic process (Group 5) (Figure 3A).
Figure 3. Exosomally transported proteome annotation and interaction network analysis.
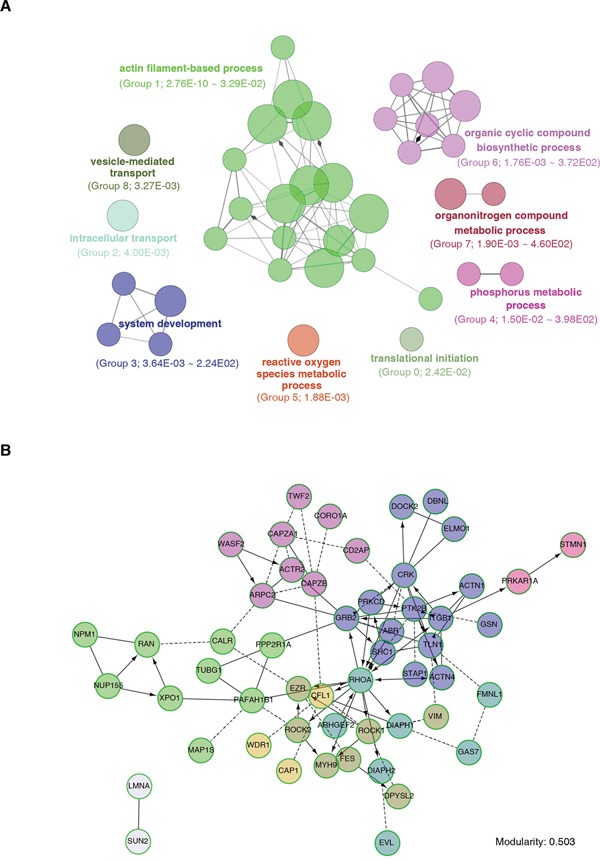
A. Functional enrichment analysis with ClueGO+CluePedia. DEPs were clustered based on biological processes, and functional units were clustered into groups with various colors. The circle area depicts the gene number under such a term. The ranked group number and the range of P values (Fischer's Exact test) are shown between parentheses. B. Protein interaction network and molecular function analyses with Reactome on the Group1 genes identified by (A).
To systematically discern how the exosomally transported cytoskeleton functional unit worked together, we used ReactomeFIPlugIn from Cytoscape to cluster and analyze the Group 1 genes, taking the protein-protein interaction into primary consideration. We found that 53 out of the 76 proteins (Supplemental Table S5A) were enriched to form an interaction network with the modularity of 0.503 (Figure 3B), indicating relatively dense connection between nodes and sparse connections between modules. Molecular function analyses also showed that the major functions of these proteins were significantly focusing on actin binding, Rho GTPase binding and structural constituent of cytoskeleton (P < 0.001, FDR < 0.01, Supplemental Table S5B).
CRC exosomes target at cytoskeleton rearrangement of macrophages
The above analyses suggested that exosomally transported proteins were primarily promoting the cytoskeleton rearrangement, which was biologically validated in this section (Figure 4).
Figure 4. Metastatic colorectal cancer-derived exosomes sufficiently mediate cytoskeleton rearrangement of macrophages.
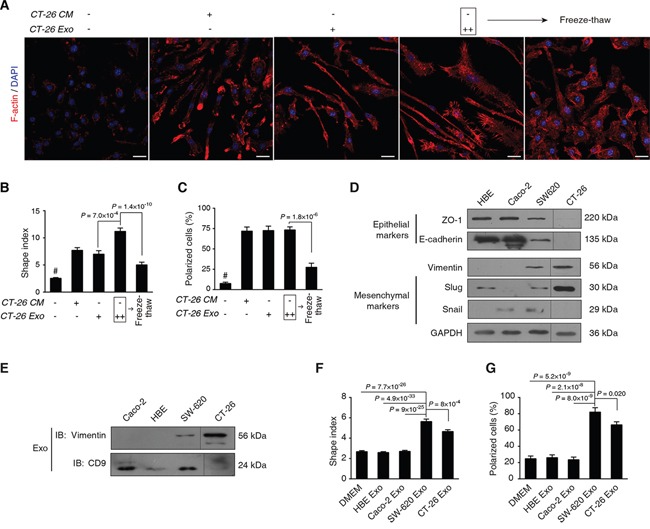
A. Morphological observation of F-actin rearrangement. Mouse bone marrow cells were differentiated for 3 d, followed by treatment with CT-26 CM or CT-26 exosomes (CT-26 Exo) for additional 3 d. As an interference, CT26 exosomes were disrupted in the freeze-thaw group by three quick free-thaw cycles. Images shown are F-actin (Red) and nuclei (Blue) staining by confocal microscopy. Scale bar = 20 μm. B, C. Statistical comparison of shape indices (B) and percentages of polarized cells (C). Image n = 20. D. Evaluation of EMT phenotypes of different cell types. E. Immunoblotting on the exosomal vimentin. Exosomes of the 4 cell lines were obtained by ExoQuick. Equal amounts of total exosome proteins (10 μg per cell line) were analyzed by IB on vimentin and CD9, respectively. F, G. Statistical analyses on shape indices (F) and percentage of polarized cells (G) exposed to exosomes acquired from different cell lines. Image n = 20. All statistical results shown in this Figure were obtained from 3 independent experiments. Data are shown as mean ± s.e.m. Statistical difference was tested by one-way ANOVA with Bonferroni post hoc multiple comparisons (two-tailed).
We found that CT-26 exosomes had similar ability to CT-26 CM in terms of mediating the elongation and F-actin polarization of macrophages, while adding more exosomes remarkably increased the protrusions (Figure 4A); however, if we disrupted the exosome by freeze-thaw, such morphological affects were largely diminished (Figure 4A). The statistics on the shape index (Figure 4B) and F-actin polarized cells (Figure 4C) were found to support such observations, showing that the CT-26 exosome was a sufficient factor to modulate macrophage F-actin cytoskeleton rearrangements.
We used additional 3 human cell lines with different epithelial-mesenchymal transition (EMT) statuses to validate such findings. We found that the epithelial-like CRC Caco-2 and lung HBE cells shared similar features with abundant E-cadherin and ZO-1 expression, as well as low/undetectable expression of vimentin, snail or slug (Figure 4D). In contrast, highly metastatic SW620 and CT-26 cells had typical EMT features with the expression of decreased E-cadherin and ZO-1, and increased vimentin, snail and slug (Figure 4D). Vimentin was detected in both SW620 and CT-26 exosomes, while it was undetectable in Caco-2 or HBE exosomes (Figure 4E). We observed that the exosome secreted by SW620 and CT-26 cells significantly enhanced the re-arrangement of F-actin cytoskeleton in macrophages in terms of shape indices (Figure 4F) and polarized cells (Figure 4G), as compared with the Caco-2 or the HBE groups. The representative images are included in Supplemental Figure S3.
Reproducibility of exosomally transportation of functional vimentin
We next tried to biologically verify whether the exosomally transported cytoskeleton proteins were functional, with an example to justify the proof-of-concept. We chose vimentin as such an example due to the following reasons. First, vimentin is a canonical biomarker of EMT and metastasis in numerous cancer types [41]. Second, vimentin intermediate filaments (IF) cooperate with actin and microtubules for the elongation of protrusions in invasive cancer cells [42, 43], which is useful to understand the morphological changes observed in CEEMs. Finally, the exosomally transported vimentin consisted of approximately 25% in abundance of total vimentin in CEEMs (Figure 3B, Supplemental Table S3).
We then endogenously expressed the fusion protein of vimentin-EGFP (VIM-EGFP) in CT-26 cells, and visualized its incorporation in the vimentin IFs (Figure 5A). The intracellular expression of VIM-EGFP was confirmed by the immunoblotting (IB) assays with anti-vimentin (Figure 5B) and anti-GFP (Figure 5C) Abs, respectively. We found that Vim-EGFP could be encapsulated in the CT-26 exosome as detected by the IB with anti-vimentin (Figure 5D) and anti-GFP (Figure 5E) Abs. In addition, we used flow cytometry (FCM) to quantify the fraction of Vim-EGFP containing exosomes (Figure 5F). The size of the ExoQuick particle is less than 30 nm in diameter (enquiry from the manufacturer). As the forward scatter (FSC) was proportional to sphere size, we gated the dots that had greater FSC than ExoQuick particles as exosomes. In addition, we used an exosome biomarker CD9 to confirm the exosome detection (Figure 5F). By using the same gating strategy, we detected that over 54% exosomes isolated from the pEGFP-Vim transfected CT-26 cells were EGFP-positive (Figure 5F).
Figure 5. Tracing the transportation of functional vimentin from CT-26 cells to macrophages via exosomes.
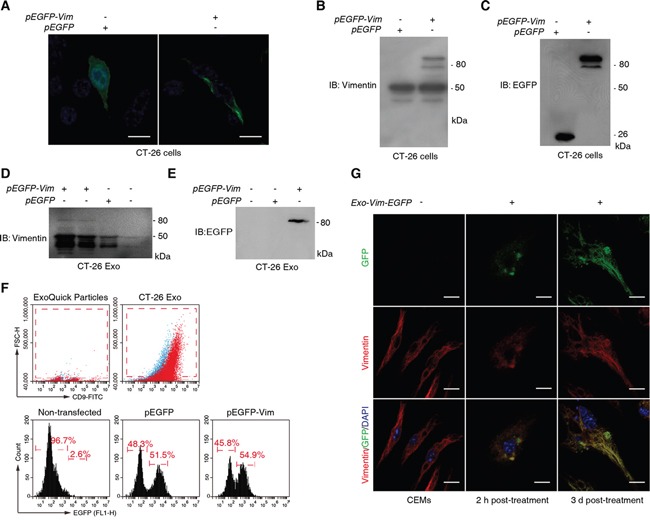
A. Observation of intracellular expression of vimentin-EGFP fusion protein in CT2-26 cells. Cells were transfected with either pEGFP or pEGFP-Vim and cultured for additional 24 h prior to confocal microscopy. Scale bar = 10 μm. B, C. Immunoblotting validation of vimentin-EGFP expression in CT-26 cells by using anti-vimentin (B) and anti-GFP Abs (C). D, E. Confirmation of vimentin-EGFP incorporation in CT-26 cell-derived exosomes with anti-vimentin (D) and anti-GFP Abs (E). F. FCM analysis on vimentin-EGFP containing CT-26 exosomes. Exosomes were captured by ExoQuick particles and stained with CD9-FITC for FCM. Both ExoQuick particles and isotype controls (blue dots) were used to determine gating strategy on exosomes (upper two diagrams). G. CT-26 exosome-derived vimentin-EGFP incorporates into the intermediate filament of macrophages. BMMs were exposed to the CT-26 vimentin-EGFP containing CT-26 exosomes and harvested at 2 h and 3 d post-treatment, followed by confocal microscopic observations. Scale bar = 10 μm.
We next treated CEEMs with Vim-EGFP containing CT-26 exosomes (Figure 5G). As a negative control for EGFP fluorescence, the CEEMs prepared with non-transfected CT-26 cells were used. At 2 h post-exosome treatment, the colocalization of vimentin and GFP was observed and the incorporation of Vim-EGFP into IFs had already be recognizable (Figure 5G). With prolonged culture until Day 3 post-exosome treatment, Vim-EGFP was observed to be remarkably incorporated in the CEEM IFs, accompanied by cellular elongation (Figure 5G).
Exosome-specific incorporation of cancer cell proteome
We then asked whether the CT-26 exosome proteome was a random subset of CT-26 cell proteome. With the criteria of unique peptide count ≥ 2 and FDR control, we identified 1669 and 3266 confident proteins from CT-26 exosomes and CT-26 cells, respectively (Supplemental Table S6A&S6B), with 1432 overlapped identifications (Figure 6A). The relative abundance ratio information of these overlapped proteins can be found in Supplemental Table S6C. We randomly tested 6 proteins with different MWs by IB, and consistent trends were observed between IB and label-free MS quantifications (Figure 6B). We found that the abundance distribution of the 1432 proteins were significantly different in exosomes from those in CT-26 cells (Figure 6C).
Figure 6. CT-26 exosome proteome is not a random incorporation of CT-26 cell proteome.
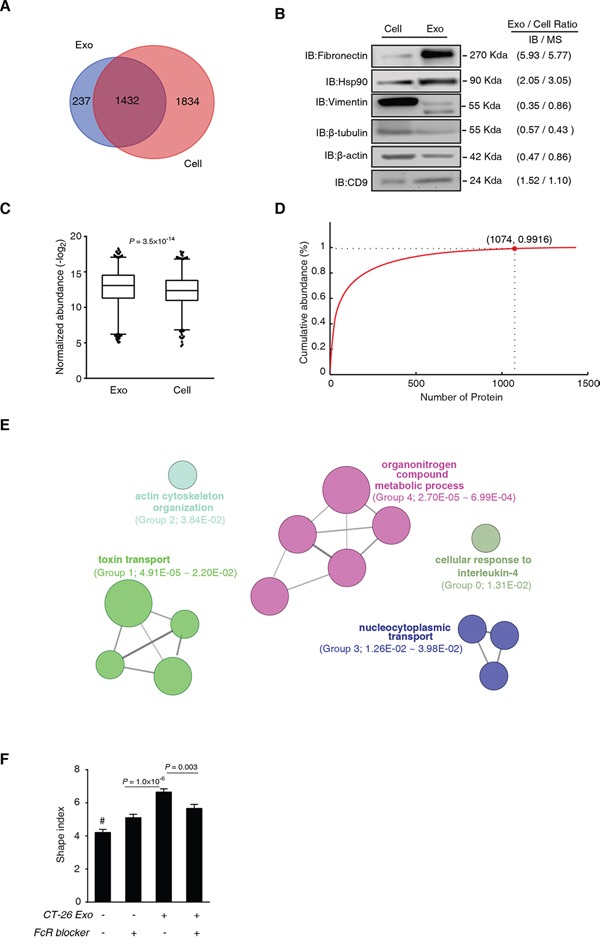
A. MS identification comparison of CT-26 cells and CT-26 exosomes. B. Immunoblotting validation of label-free MS quantification. The grey-scale comparison of protein expression ratio of exosome versus cell (Exo/Cell ratio) between IB and MS is shown on the right side of the IB images. C. Statistical comparison of the protein abundance distribution of the overlapped proteins identified in CT26 cells and CT-26 exosomes. Box-plot shows the median, quantiles and 5% outliers, respectively. KS test was used to test the significant difference in abundance distribution. D. Cumulative curve of CT-26 exosome proteins. Horizontal axis indicates proteins from the maximum to the minimum abundance in a ranking order. The red dot depicts the first three quartiles, and the cumulative protein abundance at this point. E. ClueGO+CluePedia analyses of the exosomally enriched proteins in the first 3 quartiles in (D). F. Effects of FcR blocking and CT-26 exosomes induced macrophage cytoskeleton rearrangement. Day 3 BMMs were treated by CT-26 exosomes with or without FcR-blocker (10 μg/mL) for additional 3 d. #P<0.0001, compared with any of the other groups. All the images were acquired from five random high power fields of the coverslips, and more than 200 cells were measured for each group. Data are shown as mean ± s.e.m. Statistical difference was tested by one-way ANOVA with Bonferroni post hoc multiple comparisons (two-tailed).
To discern the functional units selectively secreted by the exosome, we plotted cumulative abundance curve of the 1432 exosome proteins ranked from the maximum to the minimum in abundance (Figure 6D). We found that proteins in the upper three quartiles (1074 proteins) cumulated over 99% of the total exosomal protein abundance (Figure 6D). From these 1074 proteins, we acquired 477 exosomally enriched proteins, whose relative abundance ratio of exosome to cell was greater than 1. These proteins were enriched in 14 GO terms that were further clustered into 5 groups, including actin cytoskeleton organization (Group 2), cellular metabolic and biosynthetic associated process (Group 4) and intracellular transportation (Group 1 and Group 2) (Figure 6E and Supplemental Table S7). Thus, the exosomal incorporation of functional units, especially the cytoskeleton unit, is not a random event, but directionally secretion of cancer cells.
The specific transportation of cytoskeleton functional units implicated that there could be a mutual recognition mechanism between CT-26 exosomes and macrophages. Fc-receptor (FcR) is a known phagocytosis- and membrane fusion-relevant molecule, highly expressed in numerous immune cells, especially in macrophages. We thus posit that cytoskeleton-centric exosomes may be recognized by macrophages via FcR. We then used the CT-26 exosome-induced BMM cytoskeleton rearrangement model to test the FcR blocking effect (Figure 6F). We found that although the FcR blocking could cause significant increase of the BMM shape index, such blocking could significantly reduce the macrophage shape index that was significantly promoted by CT-26 exosomes (Figure 6F; Supplemental Figure S4).
DISCUSSION
We report here for the first time that the CRC cell-secreted exosome is a sufficient factor to transform cancer-favorable macrophages, in which cytoskeleton-centric proteome serves as one of the top functional units. By reaching the homing sites, such a mechanism represents a survival strategy of circulating CRC cells to swiftly amplify the in situ cancer-associated inflammation via existing and newly educated TAMs.
We demonstrated a feasibly new strategy to define the endpoint and exosomally transported proteome in target cells. This allowed us to identify and relatively quantify those proteins that were physically enter or attach to the target cells via exosomal transportation. This strategy took the advantage of the optimal labeling efficiency of SILAC [44, 45], and the deep proteome coverage of current shotgun MS analyzers [46, 47].
Although cytoskeleton proteins are readily detectable in exosomes from numerous cell types [28, 48], the role of these exosomal cytoskeleton units in the tumor microenvironment was largely unknown. The abundant transportation of cytoskeleton-centric proteins was not initially expected. For example, vimentin was found to take over ∼25% of its respective total proteins in the target macrophage. Here, we showed that being encapsulated in and delivered by exosomes were necessary for the functionality of these proteins. Indeed, cytoskeleton rearrangement is a primary phenotype of monocyte/macrophage activation and maturation [49, 50]. In agreement, we found that cancer exosomes promoted cancer-associated inflammation in terms of cathepsin B activity, pro-inflammatory cytokine secretion and proportion of polarized cells in CEEMs.
We statistically and experimentally showed that these cytoskeleton protein cargos of exosomes were not a random subset of cellular proteome, implicating the purposed secretion. Favorable to this rationale, we previously defined a specific preference of translation initiation on genes that regulate cellular movement and cytoskeleton, with over 4-fold greater translation ratios in cancer cells than those in normal epithelial cells [51–53]. Furthermore, active secretion behavior has been recognized as an important feature of CRC cells [54, 55]. These knowledges can be connected to picture the CRC cell behavior as: intensified protein production, purposed exosomal incorporation, active secretion, and functional endpoint transportation in macrophages.
Interestingly, we found that the exosomal education on macrophages were linked to the EMT status of metastatic CRC cells. Indeed, there are numerous comparable findings in the field regarding hypoxia, EMT and exosomes. As an example, hypoxia has been found to mediate the EMT of glioma cells, while the exosome serves as a critical promoter in this process [13]. A recent study has revealed that the proteome and mRNA composition profile of the exosome reflects the hypoxic status of glioma cells [56]. Comparably, EMT is also a determinant for CRC progression that can be regulated by the RhoA and Rac-1 signaling pathways [57].
Furthermore, FcR-mediated mutual recognition of CRC exosomes and macrophages potentially explains the amplified cytoskeleton units in the exosomally transported proteome identified in macrophages. By blocking FcR, we at least partially inhibited the exosome-induced F-actin cytoskeleton rearrangements. Favorably, Lesourne et al have reported the binding of FcR with cytoskeleton proteins, such as F-actin, filamin-1 and SHIP1 [58].
In conclusion, we revealed an active and necessary role of CRC cell-secreted exosomes in transforming cancer-favorable macrophages via endpoint transporting functional proteome, with cytoskeleton-centric proteins as the top functional units. This emphasizes an effort and survival strategy of cancer cells to produce excessive proteins encapsulated in exosomes to directionally and swiftly educate host cells such as macrophages to form an adaptive microenvironment at the homing site.
MATERIALS AND METHODS
Cell lines and animals
All animal care and experimental procedures were performed with the approval of the Institutional Animal Care & Use Committee (IACUC) of Jinan University. Specific pathogen free (SPF) male BALB/c mice, aged 6-8 w, were purchased from the Experimental Animal Center of Southern Medical University (Guangzhou, Guangdong, China). An undifferentiated and highly metastatic mouse colon carcinoma cell line [59], the CT-26 cell, was kindly provided by Dr. Xiaomin Lou, Beijing Institute of Genomics, Chinese Academy of Sciences. Human bronchial epithelial (HBE) cells, human CRC Caco-2 and SW620 cells were acquired from American Type Culture Collection. The NFκB luciferase reporter gene incorporated mouse macrophage RAW264.7 cell line was generously provided by Prof. Jiake Xu, School of Pathology and Laboratory Medicine, University of Western Australia [60]. CT-26 cells were maintained in complete RPMI 1640 media (Life Technologies, Carlsbad, CA, USA); SW620 cells were cultured in complete Leibovitz's L-15 media (Life Technologies), while HBE and Caco-2 cells were cultured in complete DMEM media (Life Technologies). All of the complete media were respectively supplemented with 10% FBS (Life Technologies) and 1% penicillin-streptomycin (Life Technologies).
Preparation of bone marrow - derived macrophages
BMMs were prepared as we described previously with minor modifications [50, 61]. In brief, BALB/c mice were anesthetized and sacrificed, followed by bone marrow acquisition from the femur and focil with DMEM medium flushing. Red blood cells were then depleted by ACK lysing buffer (Life Technologies) and cells were cultured in DMEM-differentiation media, complete DMEM media with recombinant monocyte colony-stimulating factor (MCSF; 15 ng/mL, R&D systems, Shanghai, China).
Isolation of exosomes
Exosomes were isolated by differential centrifugation as we previously described [34]. In brief, Cells were cultured to reach ∼80% confluence prior to serum-free medium switch for exosome secretion. Serial centrifugation at 300×g, 10 min and 16,500×g, 20 min was used to remove debris. Exosomes were enriched by a 100 kDa ultrafiltration device (Merck Millpore, Shanghai, China). The exosome size was measured by the NanoSight NS300 analyzer (Malvern Instruments Ltd, Malvern, UK) as we described previously [34]. These exosomes were used for the CEEM modeling and relevant biological experiments.
To examine the EGFP- or CD9- positive exosome with FCM, the ExoQuick-TCTM kit (System Biosciences, Mountain View, CA, USA) was used for exosome isolation, following the manufacturer's instructions. Briefly, supernatants were centrifuged at 3,000×g for 15 min to remove debris and mixed with ExoQuick reagent with a volume ratio of 5:1 (Supernatant : ExoQuick). Exosomes were then precipitated after overnight incubation prior to FCM analyses.
Transmission electron microscopy
We performed TEM according to Mariana et al. [62]. In brief, 20 μL of purified exosomes were layered and absorbed onto a 400-mesh copper grid, and stained with 2% Phosphotungstic acid. Samples were observed by using a transmission electron microscope (model Philips TECNAI 10) at 80 kV with the direct magnification of 65000 ×.
Flow cytometry
The FCM detection of cellular surface biomarkers was performed following our published procedures [63]. In brief, cells were subjected to CD16/CD32 blocker (10 μg/mL, Biolenged, San Diego, CA, USA) incubation for 5 min to avoid unspecific staining. The anti-mouse mAbs used for FCM on cell samples included CD11b-PE (0.7 μg/mL, eBioscience, Shanghai, China), F4/80-FITC (2.5 μg/mL, Biolenged), CD86-FITC (7.5 μg/mL, Biolenged), CD80-PE (4 μg/mL, Biolenged) and MHC-II molecule I-Ad-FITC (7.5 μg/mL, Biolenged). The gating strategies of all FCM analyses on surface biomarkers were determined by the corresponding isotype control of each Ab. Cells were analyzed by an Accuri C6 flow cytometer (Becton, Dickinson and Company, Franklin Lakes, New Jersey, USA). For the exosome FCM analysis, an anti-mouse CD9-FITC mAb (10 μg/mL, Biolenged) and its isotype control mAb were used. FCM data analyses were assisted by the FlowJo software version 7.6 (TreeStar, Hangzhou, China).
Cathepsin B activity assay
Cells were stained with the Magic Red Cathepsin B Detection reagent for 1.5 h at 37°C (Immunochemistry Technologies, Bloomington, MN, USA) as we previously described [64]. Theoretically, upon enzymatic cleavage with cathepsin B, the fluorophores will be released from the probing substrates. The enzymatic activity is positively relevant to the mean fluorescence intensities (MFIs) that are detectable by FCM or confocal microscopy.
Cytometric bead array (CBA) assay
Cytokine concentrations in supernatants were analyzed by a mouse inflammation CBA Kit (BD Pharmingen), with the procedure we previously described [63].
Luciferase reporter assay
NFκB luciferase reporter gene activation assay was performed with a Firefly Luciferase Reporter Gene Assay Kit (Beyotime, Shanghai, China). In brief, RAW264.7 cells were sufficiently lysed and centrifuged at 10,000×g for 5 min. The cell lysate (100 μL) was mixed gently with equal volume of detecting buffer and the fluorescence intensity was detected by a GloMax® 20/20 Luminometer (Promega, Beijing, China), with the parameter of 10 s detection and 2 s interval.
Shape index assay
Cells were stained with CFDA-SE (Life Technologies) [63] or rhodamine phalloidin (Life Technologies) [50, 61] as we previously described. If the macrophage was subjected to surface FcR blocking, a FcR-blocker (CD16/CD32 blocker, 10 μg/mL, Biolenged) was used. The cellular shape index (major axis/minor axis) was measured by the ImageJ software Version 1.47e [65] as we described previously [63].
Transwell migration assay
The CT-26 cell was plated in the upper chamber of a transwell (8 μm pore size, Corning, NY, USA) at 1.4×10⁵ cells/chamber, while the fresh or CM was loaded into the lower chamber. Cells were allowed to migrate across the membrane for 10 h prior to crystal violet staining and image acquisition with a light microscope (Olympus, Tokyo, Japan). Images were converted into binary mode and measured with the ImageJ software for the staining area coverage (area ratio of staining area to the whole area of a single view). All statistical measurements on the fluorescent and optical images were based on more than five random high power fields acquired from three independent experiments.
Endpoint tracing of exosomally transported proteome
We adopted the SILAC method to metabolically label cells by isotopic amino acids that were optimized by Matthias Mann's group [66]. In particular, CT-26 cells were cultured for at least 6 passages in SILAC DMEM media (Thermo Fisher Scientific, Shanghai, China), supplemented with 10% dialytic FBS (Life Technologies) and 1% pen/strep as we described previously with modifications [51]. The heavy isotope labeled amino acids [73 mg/L 13C615N2- L-lysine (Lys8) and 42 mg/L 13C615N4-L-arginine (Arg10)] (Cambridge Isotope Laboratories, Andover, MA, USA) were used. To acquire CT-26 cell-derived and heavy isotope labeled exosomes (heavy exosomes), the SILAC labeled cells were switched to serum-free DMEM media culture for exosome secretion. At 24 h post-secretion, the labeled exosomes were collected via ultra-speed centrifugation as described above. Day 6 BMMs were subsequently treated with heavy exosomes for 2 h to allow protein transportation, in which these BMMs had been pretreated with CHX (500 ng/mL) for 1 h to avoid the reuse of isotopic amino acids. Heavy exosome-exposed BMMs were harvested (300×g for 5 min, at 4°C), washed twice with PBS, and lysed for protein sample preparations.
Protein digestion and peptide fractionation
Proteins were extracted from cells or exosomes by SDS lysis buffer [1% SDS, 50 mM Tris (pH 8.1), 1 mM PMSF, protease inhibitor (Roche)] with sonication, followed by the concentration determination with a BCA kit (Thermo Fisher Scientific). We then employed the filter-aided sample preparation (FASP) [67] for the in-solution protein digestion and performed high pH RP-LC separation for the peptide fractionation as we previously described with minor modifications [47]. Specifically, peptides were loaded to a C18 high-pH RP-LC column (5 μm, 120 Å, 4.6×250 mm, Beijing TechMate Technology CO., LTD., Beijing, China) and eluted at 800 μL/min using a gradient from 20 mM NH4HCO2 and 2% (w/v) acetonitrile (ACN) to 4 mM NH4HCO2 and 80% (w/v) ACN over 65 min (pH = 10). The eluents were collected into 10 fractions assisted by UV absorption peak observations. Peptide samples were freeze-dried prior to MS analyses.
Mass spectrometry analysis
Each fractionated peptide sample was reconstituted with 0.1% formic acid and 2% ACN, and analyzed with an Eksigent nano-LC tandem Triple TOF 5600 MS (AB SCIEX, Framingham, CA, USA). The detailed instrumental setting could be found in our previously publications [34, 46, 47]. All of the MS raw data were deposited in the iProX database (http://www.iprox.org, accession number: IPX00029500).
Database search with MaxQuant
The wiff MS data files were analyzed with MaxQuant (version 1.5.2.8) by searching the Andromeda search engine against the Uniprot-Swiss mouse database (2015_02 Release, 16716 entries) as described previously [47]. In brief, the searching parameters included: enzyme, trypsin; 20 ppm for MS and 0.5 Da for MS/MS; Carbamidomethyl-Cys as a fixed modification; oxidation (M), Gln->pyro-Glu (N-terminus), and acetyl (N-terminus) as variable modifications; minimal peptide length was set to 7 residues and maximum 2 missed cleavages were allowed on tryptic peptides; decoy mode was used to evaluate the false discovery rate (FDR). Known contaminations were removed. The protein identification was considered confident only if: 1) FDR was less than 0.01 at both peptide and protein levels, and 2) at least 2 unique peptides were identified. In addition, only unique peptides were used for the SILAC quantification based on the H/L ratios (quantified unique peptide count ≥ 2).
Label-free data analysis
The wiff MS data files were converted to the MGF format and analyzed by the Progenesis QI software for proteomics 2.0 (Nonlinear Dynamics, Newcastle upon Tyne, UK) as we previously described [47]. In brief, the MGF files were searched by Mascot software (server version 2.5.1) against the same UniProt database mentioned above. The threshold of the expect values were determined by adjusting the peptide FDR to 0.01. The Mascot search results were exported as XML files and quantified with the Progenesis QI software [47].
Proteome bioinformatics analyses
DEPs were analyzed in the Cytoscape software (version 3.2.1) environment with various plug-ins for bioinformatics functional analysis. The ClueGO v2.2.2 + CluePedia v1.1.7 plug-in was employed to discern functionally grouped gene ontology (GO), and pathway networks to identify core functional units [68, 69]. Searches were against the GO Biological Process database (14310 terms/ Pathways, 54475 available unique gene) with the evidence from All_Experimental (EXP, IDA, IPI, IGI, IEP). The P value of pathway enrichment was calculated based on right-hypergeometric test and corrected with Bonferroni, and P < 0.05 was considered confident. Pathway clustering was calculated by using Kappa concordance test with the minimal threshold 0.4. Protein-protein interaction (PPI) and network analyses were performed by using the ReactomeFIPlugIn (Version 4.2.0. beta) for Cytoscape [70, 71]. The 2014 version of functional interactions (FIs) was used.
Confocal microscopy
Cyto-immunohistochemistry was performed as we described previously [50, 72]. In brief, 2×10⁵cells were grown on coverslips in 24-well plates. Cells were fixed with 4% formaldehyde in PBS for 10 min at room temperature, and permeabilized by 0.1% Triton X-100 in PBS for 5 min. The rabbit anti-mouse vimentin Ab (1:100; Cell Signaling Technology, Shanghai, China) and the goat anti-rabbit IgG-FITC secondary Ab (1:50; Origene, Beijing, China) were sequentially applied. Coverslips were then mounted onto glass slides with Prolong Gold Anti-fade Reagent containing DAPI (Life Technologies) and observed with a Zeiss LSM710 confocal microscope.
Molecular cloning and cell transfection
We cloned the mouse Vim gene that encoded vimentin with similar methods as described previously [72]. Total RNA was extracted from CT-26 cells by using TRIzol® RNA extraction reagent (Life Technologies), following the manufacturer's instructions. The Vim gene was amplified by reverse-transcription PCR and validated by Sanger sequencing. The primers were: Forward: 5′- ACGTGCTAGCATGTCTACCAGGTCTGTGTCC-3′ and Reverse: 5′- ACGTAAGCTTTTCAAGGTCATCGTGATGCTG-3′. The Vim gene was then cloned into the pEGFP-N1 plasmid (Life Technologies) to obtain the pEGFP-VIM plasmid. To perform cell transfection, CT-26 cells were seeded in six-well plates to reach 80% confluences, followed by the addition of plasmid DNA (2.5 μg/well) and Lipofectamine LTX reagents (8 μL/well; Life Technologies).
Immunoblotting
The IB procedure was identical to our previous reports [46, 47, 72]. The primary Abs included mouse anti- rabbit CD63 pAb (1:500; Abcam, Shanghai, China), rabbit anti- rabbit CD9 mAb (1:1000; Epitomics, Abcam), rabbit anti- rabbit HSP90 mAb (1:1000; Proteintech, Wuhan, Hubei, China), rabbit anti-fibronectin mAb, rabbit anti-vimentin mAb (1:1000; CST), rabbit anti-GFP mAb (1:1000; Epitomics), rabbit anti-E-Cadherin mAb (1:1000; CST), rabbit anti-ZO-1 mAb (1:1000; CST), rabbit anti-Snail mAb (1:1000; CST), rabbit anti-Slug mAb (1:1000; CST), rabbit anti-GAPDH pAb (1:3000; Bioworld, Nanjing, China). The secondary Ab was HRP-conjugated goat anti-rabbit Ab (1:2000; Proteintech).
Statistics
PLGEM [39, 40], a Bioconductor package run in the R software environment (version 3.2.1), was used to determine data distribution, statistical power and significantly up- and down- regulated DEPs (P < 0.05). The abundance distribution difference in the label-free MS analyses was evaluated by Kolmogorov-Smirnov test (KS-test). Other measures were statistically tested by either two-tailed Student's t-test or one-way ANOVA with Bonferroni post hoc multiple comparisons based on data acquired from at least 3 independently biological replicates, assisted by the GraphPad Prism software version 6.0 (GraphPad Inc., San Diego, CA, USA); P < 0.05 was accepted as significant difference.
SUPPLEMENTARY MATERIAL FIGURES AND TABLES
Footnotes
CONFLICTS OF INTEREST
No potential conflicts of interest were disclosed in this study.
GRANT SUPPORT
This work was supported by the National Basic Research Program “973” of China (2014CBA02000 to T.W. and 2011CB910700 to Q.Y.H.); the International Collaboration Program (2014DFB30010) to Q.Y.H.; the Guangdong Natural Science Foundation (32213027/32215077, to Q.Y. H. and 2014A030313369 to T.W.); Key Special Project on the Integration of Industry, Education and Research of Guangzhou (201604020002) and the Key Program of Applied Science and Technology of Guangdong Province to T.W.; as well as the Postdoctoral Science Foundation of China (2015M570752) to Z.C.
Author contributions
T.W. and Q.Y.H. conceived the idea, supervised the study, and wrote the paper. Z.C. and L.Y. performed most of the experiments, analyzed the data and contributed to the manuscript composition. Y.C. contributed to the exosome-relevant experiments and proteomic data analysis. Y.Z. participated in data analysis. X.Y. and J.G. took part in the mass spectrometry experiments. G.Z. contributed to the data analysis and critical consultations.
REFERENCES
- 1.Raposo G, Stoorvogel W. Extracellular vesicles: exosomes, microvesicles, and friends. J Cell Biol. 2013;200:373–383. doi: 10.1083/jcb.201211138. [DOI] [PMC free article] [PubMed] [Google Scholar]
- 2.Azmi AS, Bao B, Sarkar FH. Exosomes in cancer development, metastasis, and drug resistance: a comprehensive review. Cancer Metastasis Rev. 2013;32:623–642. doi: 10.1007/s10555-013-9441-9. [DOI] [PMC free article] [PubMed] [Google Scholar]
- 3.Colombo M, Raposo G, Thery C. Biogenesis, secretion, and intercellular interactions of exosomes and other extracellular vesicles. Annu Rev Cell Dev Biol. 2014;30:255–289. doi: 10.1146/annurev-cellbio-101512-122326. [DOI] [PubMed] [Google Scholar]
- 4.Joyce JA, Pollard JW. Microenvironmental regulation of metastasis. Nat Rev Cancer. 2009;9:239–252. doi: 10.1038/nrc2618. [DOI] [PMC free article] [PubMed] [Google Scholar]
- 5.Quail DF, Joyce JA. Microenvironmental regulation of tumor progression and metastasis. Nat Med. 2013;19:1423–1437. doi: 10.1038/nm.3394. [DOI] [PMC free article] [PubMed] [Google Scholar]
- 6.Ji H, Chen M, Greening DW, He W, Rai A, Zhang W, Simpson RJ. Deep sequencing of RNA from three different extracellular vesicle (EV) subtypes released from the human LIM1863 colon cancer cell line uncovers distinct miRNA-enrichment signatures. PLoS One. 2014;9:e110314. doi: 10.1371/journal.pone.0110314. [DOI] [PMC free article] [PubMed] [Google Scholar]
- 7.Mathivanan S, Lim JW, Tauro BJ, Ji H, Moritz RL, Simpson RJ. Proteomics analysis of A33 immunoaffinity-purified exosomes released from the human colon tumor cell line LIM1215 reveals a tissue-specific protein signature. Mol Cell Proteomics. 2010;9:197–208. doi: 10.1074/mcp.M900152-MCP200. [DOI] [PMC free article] [PubMed] [Google Scholar]
- 8.Hoshino A, Costa-Silva B, Shen TL, Rodrigues G, Hashimoto A, Tesic Mark M, Molina H, Kohsaka S, Di Giannatale A, Ceder S, Singh S, Williams C, Soplop N, et al. Tumour exosome integrins determine organotropic metastasis. Nature. 2015;527:329–335. doi: 10.1038/nature15756. [DOI] [PMC free article] [PubMed] [Google Scholar]
- 9.Jung T, Castellana D, Klingbeil P, Cuesta Hernandez I, Vitacolonna M, Orlicky DJ, Roffler SR, Brodt P, Zoller M. CD44v6 dependence of premetastatic niche preparation by exosomes. Neoplasia. 2009;11:1093–1105. doi: 10.1593/neo.09822. [DOI] [PMC free article] [PubMed] [Google Scholar]
- 10.Mu W, Rana S, Zoller M. Host matrix modulation by tumor exosomes promotes motility and invasiveness. Neoplasia. 2013;15:875–887. doi: 10.1593/neo.13786. [DOI] [PMC free article] [PubMed] [Google Scholar]
- 11.Al-Nedawi K, Meehan B, Micallef J, Lhotak V, May L, Guha A, Rak J. Intercellular transfer of the oncogenic receptor EGFRvIII by microvesicles derived from tumour cells. Nat Cell Biol. 2008;10:619–624. doi: 10.1038/ncb1725. [DOI] [PubMed] [Google Scholar]
- 12.Skog J, Wurdinger T, van Rijn S, Meijer DH, Gainche L, Sena-Esteves M, Curry WT, Jr, Carter BS, Krichevsky AM, Breakefield XO. Glioblastoma microvesicles transport RNA and proteins that promote tumour growth and provide diagnostic biomarkers. Nat Cell Biol. 2008;10:1470–1476. doi: 10.1038/ncb1800. [DOI] [PMC free article] [PubMed] [Google Scholar]
- 13.Park JE, Tan HS, Datta A, Lai RC, Zhang H, Meng W, Lim SK, Sze SK. Hypoxic tumor cell modulates its microenvironment to enhance angiogenic and metastatic potential by secretion of proteins and exosomes. Mol Cell Proteomics. 2010;9:1085–1099. doi: 10.1074/mcp.M900381-MCP200. [DOI] [PMC free article] [PubMed] [Google Scholar]
- 14.Suetsugu A, Honma K, Saji S, Moriwaki H, Ochiya T, Hoffman RM. Imaging exosome transfer from breast cancer cells to stroma at metastatic sites in orthotopic nude-mouse models. Adv Drug Deliv Rev. 2013;65:383–390. doi: 10.1016/j.addr.2012.08.007. [DOI] [PubMed] [Google Scholar]
- 15.Melo SA, Sugimoto H, O'Connell JT, Kato N, Villanueva A, Vidal A, Qiu L, Vitkin E, Perelman LT, Melo CA, Lucci A, Ivan C, Calin GA, et al. Cancer exosomes perform cell-independent microRNA biogenesis and promote tumorigenesis. Cancer Cell. 2014;26:707–721. doi: 10.1016/j.ccell.2014.09.005. [DOI] [PMC free article] [PubMed] [Google Scholar]
- 16.Zomer A, Maynard C, Verweij FJ, Kamermans A, Schafer R, Beerling E, Schiffelers RM, de Wit E, Berenguer J, Ellenbroek SI, Wurdinger T, Pegtel DM, van Rheenen J. In vivo imaging reveals extracellular vesicle-mediated phenocopying of metastatic behavior. Cell. 2015;161:1046–1057. doi: 10.1016/j.cell.2015.04.042. [DOI] [PMC free article] [PubMed] [Google Scholar]
- 17.Hood JL, San RS, Wickline SA. Exosomes released by melanoma cells prepare sentinel lymph nodes for tumor metastasis. Cancer Res. 2011;71:3792–3801. doi: 10.1158/0008-5472.CAN-10-4455. [DOI] [PubMed] [Google Scholar]
- 18.Rana S, Malinowska K, Zoller M. Exosomal tumor microRNA modulates premetastatic organ cells. Neoplasia. 2013;15:281–295. doi: 10.1593/neo.122010. [DOI] [PMC free article] [PubMed] [Google Scholar]
- 19.Costa-Silva B, Aiello NM, Ocean AJ, Singh S, Zhang H, Thakur BK, Becker A, Hoshino A, Mark MT, Molina H, Xiang J, Zhang T, Theilen TM, et al. Pancreatic cancer exosomes initiate pre-metastatic niche formation in the liver. Nat Cell Biol. 2015;17:816–826. doi: 10.1038/ncb3169. [DOI] [PMC free article] [PubMed] [Google Scholar]
- 20.Zhang L, Zhang S, Yao J, Lowery FJ, Zhang Q, Huang WC, Li P, Li M, Wang X, Zhang C, Wang H, Ellis K, Cheerathodi M, et al. Microenvironment-induced PTEN loss by exosomal microRNA primes brain metastasis outgrowth. Nature. 2015;527:100–104. doi: 10.1038/nature15376. [DOI] [PMC free article] [PubMed] [Google Scholar]
- 21.Peinado H, Aleckovic M, Lavotshkin S, Matei I, Costa-Silva B, Moreno-Bueno G, Hergueta-Redondo M, Williams C, Garcia-Santos G, Ghajar C, Nitadori-Hoshino A, Hoffman C, Badal K, et al. Melanoma exosomes educate bone marrow progenitor cells toward a pro-metastatic phenotype through MET. Nat Med. 2012;18:883–891. doi: 10.1038/nm.2753. [DOI] [PMC free article] [PubMed] [Google Scholar]
- 22.Hosseini-Beheshti E, Pham S, Adomat H, Li N, Tomlinson Guns ES. Exosomes as biomarker enriched microvesicles: characterization of exosomal proteins derived from a panel of prostate cell lines with distinct AR phenotypes. Mol Cell Proteomics. 2012;11:863–885. doi: 10.1074/mcp.M111.014845. [DOI] [PMC free article] [PubMed] [Google Scholar]
- 23.Bobrie A, Thery C. Exosomes and communication between tumours and the immune system: are all exosomes equal? Biochem Soc Trans. 2013;41:263–267. doi: 10.1042/BST20120245. [DOI] [PubMed] [Google Scholar]
- 24.Melo SA, Luecke LB, Kahlert C, Fernandez AF, Gammon ST, Kaye J, LeBleu VS, Mittendorf EA, Weitz J, Rahbari N, Reissfelder C, Pilarsky C, Fraga MF, et al. Glypican-1 identifies cancer exosomes and detects early pancreatic cancer. Nature. 2015;523:177–182. doi: 10.1038/nature14581. [DOI] [PMC free article] [PubMed] [Google Scholar]
- 25.Ludwig AK, Giebel B. Exosomes: small vesicles participating in intercellular communication. Int J Biochem Cell Biol. 2012;44:11–15. doi: 10.1016/j.biocel.2011.10.005. [DOI] [PubMed] [Google Scholar]
- 26.Thebaud B, Stewart DJ. Exosomes: cell garbage can, therapeutic carrier, or trojan horse? Circulation. 2012;126:2553–2555. doi: 10.1161/CIRCULATIONAHA.112.146738. [DOI] [PubMed] [Google Scholar]
- 27.Welton JL, Khanna S, Giles PJ, Brennan P, Brewis IA, Staffurth J, Mason MD, Clayton A. Proteomics analysis of bladder cancer exosomes. Mol Cell Proteomics. 2010;9:1324–1338. doi: 10.1074/mcp.M000063-MCP201. [DOI] [PMC free article] [PubMed] [Google Scholar]
- 28.Ji H, Greening DW, Barnes TW, Lim JW, Tauro BJ, Rai A, Xu R, Adda C, Mathivanan S, Zhao W, Xue Y, Xu T, Zhu HJ, et al. Proteome profiling of exosomes derived from human primary and metastatic colorectal cancer cells reveal differential expression of key metastatic factors and signal transduction components. Proteomics. 2013;13:1672–1686. doi: 10.1002/pmic.201200562. [DOI] [PubMed] [Google Scholar]
- 29.Meckes DG, Jr, Gunawardena HP, Dekroon RM, Heaton PR, Edwards RH, Ozgur S, Griffith JD, Damania B, Raab-Traub N. Modulation of B-cell exosome proteins by gamma herpesvirus infection. Proc Natl Acad Sci U S A. 2013;110:E2925–2933. doi: 10.1073/pnas.1303906110. [DOI] [PMC free article] [PubMed] [Google Scholar]
- 30.Zeng X, Yang P, Chen B, Jin X, Liu Y, Zhao X, Liang S. Quantitative secretome analysis reveals the interactions between epithelia and tumor cells by in vitro modulating colon cancer microenvironment. J Proteomics. 2013;89:51–70. doi: 10.1016/j.jprot.2013.05.032. [DOI] [PubMed] [Google Scholar]
- 31.Drake RR, Kislinger T. The proteomics of prostate cancer exosomes. Expert Rev Proteomics. 2014;11:167–177. doi: 10.1586/14789450.2014.890894. [DOI] [PubMed] [Google Scholar]
- 32.Dutta S, Reamtong O, Panvongsa W, Kitdumrongthum S, Janpipatkul K, Sangvanich P, Piyachaturawat P, Chairoungdua A. Proteomics profiling of cholangiocarcinoma exosomes: A potential role of oncogenic protein transferring in cancer progression. Biochim Biophys Acta. 2015;1852:1989–1999. doi: 10.1016/j.bbadis.2015.06.024. [DOI] [PubMed] [Google Scholar]
- 33.Zhu Y, Chen X, Pan Q, Wang Y, Su S, Jiang C, Li Y, Xu N, Wu L, Lou X, Liu S. A Comprehensive Proteomics Analysis Reveals a Secretory Path- and Status-Dependent Signature of Exosomes Released from Tumor-Associated Macrophages. J Proteome Res. 2015;14:4319–4331. doi: 10.1021/acs.jproteome.5b00770. [DOI] [PubMed] [Google Scholar]
- 34.Guo J, Cui Y, Yan Z, Luo Y, Zhang W, Deng S, Tang S, Zhang G, He QY, Wang T. Phosphoproteome Characterization of Human Colorectal Cancer SW620 Cell-Derived Exosomes and New Phosphosite Discovery for C-HPP. J Proteome Res. 2016 doi: 10.1021/acs.jproteome.6b00391. [DOI] [PubMed] [Google Scholar]
- 35.Steidl C, Lee T, Shah SP, Farinha P, Han G, Nayar T, Delaney A, Jones SJ, Iqbal J, Weisenburger DD, Bast MA, Rosenwald A, Muller-Hermelink HK, et al. Tumor-associated macrophages and survival in classic Hodgkin's lymphoma. N Engl J Med. 2010;362:875–885. doi: 10.1056/NEJMoa0905680. [DOI] [PMC free article] [PubMed] [Google Scholar]
- 36.Asgharzadeh S, Salo JA, Ji L, Oberthuer A, Fischer M, Berthold F, Hadjidaniel M, Liu CW, Metelitsa LS, Pique-Regi R, Wakamatsu P, Villablanca JG, Kreissman SG, et al. Clinical significance of tumor-associated inflammatory cells in metastatic neuroblastoma. J Clin Oncol. 2012;30:3525–3532. doi: 10.1200/JCO.2011.40.9169. [DOI] [PMC free article] [PubMed] [Google Scholar]
- 37.McClellan JL, Davis JM, Steiner JL, Enos RT, Jung SH, Carson JA, Pena MM, Carnevale KA, Berger FG, Murphy EA. Linking tumor-associated macrophages, inflammation, and intestinal tumorigenesis: role of MCP-1. Am J Physiol Gastrointest Liver Physiol. 2012;303:G1087–1095. doi: 10.1152/ajpgi.00252.2012. [DOI] [PMC free article] [PubMed] [Google Scholar]
- 38.Dragovic RA, Gardiner C, Brooks AS, Tannetta DS, Ferguson DJ, Hole P, Carr B, Redman CW, Harris AL, Dobson PJ, Harrison P, Sargent IL. Sizing and phenotyping of cellular vesicles using Nanoparticle Tracking Analysis. Nanomedicine. 2011;7:780–788. doi: 10.1016/j.nano.2011.04.003. [DOI] [PMC free article] [PubMed] [Google Scholar]
- 39.Pavelka N, Pelizzola M, Vizzardelli C, Capozzoli M, Splendiani A, Granucci F, Ricciardi-Castagnoli P. A power law global error model for the identification of differentially expressed genes in microarray data. BMC Bioinformatics. 2004;5:203. doi: 10.1186/1471-2105-5-203. [DOI] [PMC free article] [PubMed] [Google Scholar]
- 40.Pavelka N, Fournier ML, Swanson SK, Pelizzola M, Ricciardi-Castagnoli P, Florens L, Washburn MP. Statistical similarities between transcriptomics and quantitative shotgun proteomics data. Molecular & Cellular Proteomics. 2008;7:631–644. doi: 10.1074/mcp.M700240-MCP200. [DOI] [PubMed] [Google Scholar]
- 41.Kidd ME, Shumaker DK, Ridge KM. The role of vimentin intermediate filaments in the progression of lung cancer. Am J Respir Cell Mol Biol. 2014;50:1–6. doi: 10.1165/rcmb.2013-0314TR. [DOI] [PMC free article] [PubMed] [Google Scholar]
- 42.Correia I, Chu D, Chou YH, Goldman RD, Matsudaira P. Integrating the actin and vimentin cytoskeletons. adhesion-dependent formation of fimbrin-vimentin complexes in macrophages. J Cell Biol. 1999;146:831–842. doi: 10.1083/jcb.146.4.831. [DOI] [PMC free article] [PubMed] [Google Scholar]
- 43.Schoumacher M, Goldman RD, Louvard D, Vignjevic DM. Actin, microtubules, and vimentin intermediate filaments cooperate for elongation of invadopodia. J Cell Biol. 2010;189:541–556. doi: 10.1083/jcb.200909113. [DOI] [PMC free article] [PubMed] [Google Scholar]
- 44.Geiger T, Wisniewski JR, Cox J, Zanivan S, Kruger M, Ishihama Y, Mann M. Use of stable isotope labeling by amino acids in cell culture as a spike-in standard in quantitative proteomics. Nat Protoc. 2011;6:147–157. doi: 10.1038/nprot.2010.192. [DOI] [PubMed] [Google Scholar]
- 45.Walther DM, Kasturi P, Zheng M, Pinkert S, Vecchi G, Ciryam P, Morimoto RI, Dobson CM, Vendruscolo M, Mann M, Hartl FU. Widespread Proteome Remodeling and Aggregation in Aging C. elegans. Cell. 2015;161:919–932. doi: 10.1016/j.cell.2015.03.032. [DOI] [PMC free article] [PubMed] [Google Scholar]
- 46.Chen Y, Li Y, Zhong J, Zhang J, Chen Z, Yang L, Cao X, He QY, Zhang G, Wang T. Identification of Missing Proteins Defined by Chromosome-Centric Proteome Project in the Cytoplasmic Detergent-Insoluble Proteins. J Proteome Res. 2015;14:3693–3709. doi: 10.1021/pr501103r. [DOI] [PubMed] [Google Scholar]
- 47.Yang L, Lian X, Zhang W, Guo J, Wang Q, Li Y, Chen Y, Yin X, Yang P, Lan F, He QY, Zhang G, Wang T. Finding Missing Proteins from the Epigenetically Manipulated Human Cell with Stringent Quality Criteria. J Proteome Res. 2015;14:3645–3657. doi: 10.1021/acs.jproteome.5b00480. [DOI] [PubMed] [Google Scholar]
- 48.Ji H, Greening DW, Kapp EA, Moritz RL, Simpson RJ. Secretome-based proteomics reveals sulindac-modulated proteins released from colon cancer cells. Proteomics Clin Appl. 2009;3:433–451. doi: 10.1002/prca.200800077. [DOI] [PubMed] [Google Scholar]
- 49.Meconi S, Capo C, Remacle-Bonnet M, Pommier G, Raoult D, Mege JL. Activation of protein tyrosine kinases by Coxiella burnetii: role in actin cytoskeleton reorganization and bacterial phagocytosis. Infect Immun. 2001;69:2520–2526. doi: 10.1128/IAI.69.4.2520-2526.2001. [DOI] [PMC free article] [PubMed] [Google Scholar]
- 50.Wang T, Gong N, Liu J, Kadiu I, Kraft-Terry SD, Mosley RL, Volsky DJ, Ciborowski P, Gendelman HE. Proteomic modeling for HIV-1 infected microglia-astrocyte crosstalk. PLoS One. 2008;3:e2507. doi: 10.1371/journal.pone.0002507. [DOI] [PMC free article] [PubMed] [Google Scholar]
- 51.Wang T, Cui Y, Jin J, Guo J, Wang G, Yin X, He QY, Zhang G. Translating mRNAs strongly correlate to proteins in a multivariate manner and their translation ratios are phenotype specific. Nucleic Acids Res. 2013;41:4743–4754. doi: 10.1093/nar/gkt178. [DOI] [PMC free article] [PubMed] [Google Scholar]
- 52.Zhong J, Cui Y, Guo J, Chen Z, Yang L, He QY, Zhang G, Wang T. Resolving chromosome-centric human proteome with translating mRNA analysis: a strategic demonstration. J Proteome Res. 2014;13:50–59. doi: 10.1021/pr4007409. [DOI] [PubMed] [Google Scholar]
- 53.Chang C, Li L, Zhang C, Wu S, Guo K, Zi J, Chen Z, Jiang J, Ma J, Yu Q, Fan F, Qin P, Han M, et al. Systematic analyses of the transcriptome, translatome, and proteome provide a global view and potential strategy for the C-HPP. J Proteome Res. 2014;13:38–49. doi: 10.1021/pr4009018. [DOI] [PubMed] [Google Scholar]
- 54.Jimenez CR, Knol JC, Meijer GA, Fijneman RJ. Proteomics of colorectal cancer: overview of discovery studies and identification of commonly identified cancer-associated proteins and candidate CRC serum markers. J Proteomics. 2010;73:1873–1895. doi: 10.1016/j.jprot.2010.06.004. [DOI] [PubMed] [Google Scholar]
- 55.Demory Beckler M, Higginbotham JN, Franklin JL, Ham AJ, Halvey PJ, Imasuen IE, Whitwell C, Li M, Liebler DC, Coffey RJ. Proteomic analysis of exosomes from mutant KRAS colon cancer cells identifies intercellular transfer of mutant KRAS. Mol Cell Proteomics. 2013;12:343–355. doi: 10.1074/mcp.M112.022806. [DOI] [PMC free article] [PubMed] [Google Scholar]
- 56.Kucharzewska P, Christianson HC, Welch JE, Svensson KJ, Fredlund E, Ringner M, Morgelin M, Bourseau-Guilmain E, Bengzon J, Belting M. Exosomes reflect the hypoxic status of glioma cells and mediate hypoxia-dependent activation of vascular cells during tumor development. Proc Natl Acad Sci U S A. 2013;110:7312–7317. doi: 10.1073/pnas.1220998110. [DOI] [PMC free article] [PubMed] [Google Scholar]
- 57.Gulhati P, Bowen KA, Liu J, Stevens PD, Rychahou PG, Chen M, Lee EY, Weiss HL, O'Connor KL, Gao T, Evers BM. mTORC1 and mTORC2 Regulate EMT, Motility, and Metastasis of Colorectal Cancer via RhoA and Rac1 Signaling Pathways. Cancer Research. 2011;71:3246–3256. doi: 10.1158/0008-5472.CAN-10-4058. [DOI] [PMC free article] [PubMed] [Google Scholar]
- 58.Lesourne R, Fridman WH, Daeron M. Dynamic interactions of Fc gamma receptor IIB with filamin-bound SHIP1 amplify filamentous actin-dependent negative regulation of Fc epsilon receptor I signaling. J Immunol. 2005;174:1365–1373. doi: 10.4049/jimmunol.174.3.1365. [DOI] [PubMed] [Google Scholar]
- 59.Oft M, Heider KH, Beug H. TGFbeta signaling is necessary for carcinoma cell invasiveness and metastasis. Curr Biol. 1998;8:1243–1252. doi: 10.1016/s0960-9822(07)00533-7. [DOI] [PubMed] [Google Scholar]
- 60.Cheng T, Pavlos NJ, Wang C, Tan JW, Lin JM, Cornish J, Zheng MH, Xu J. Mutations within the TNF-like core domain of RANKL impair osteoclast differentiation and activation. Mol Endocrinol. 2009;23:35–46. doi: 10.1210/me.2007-0465. [DOI] [PMC free article] [PubMed] [Google Scholar]
- 61.Wang T, Gong N, Liu J, Kadiu I, Kraft-Terry SD, Schlautman JD, Ciborowski P, Volsky DJ, Gendelman HE. HIV-1-infected astrocytes and the microglial proteome. J Neuroimmune Pharmacol. 2008;3:173–186. doi: 10.1007/s11481-008-9110-x. [DOI] [PMC free article] [PubMed] [Google Scholar]
- 62.Regente M, Corti-Monzon G, Maldonado AM, Pinedo M, Jorrin J, de la Canal L. Vesicular fractions of sunflower apoplastic fluids are associated with potential exosome marker proteins. FEBS Lett. 2009;583:3363–3366. doi: 10.1016/j.febslet.2009.09.041. [DOI] [PubMed] [Google Scholar]
- 63.Zeng X, Wang T, Zhu C, Xing X, Ye Y, Lai X, Song B, Zeng Y. Topographical and biological evidence revealed FTY720-mediated anergy-polarization of mouse bone marrow-derived dendritic cells in vitro. PLoS One. 2012;7:e34830. doi: 10.1371/journal.pone.0034830. [DOI] [PMC free article] [PubMed] [Google Scholar]
- 64.Glanzer JG, Enose Y, Wang T, Kadiu I, Gong N, Rozek W, Liu J, Schlautman JD, Ciborowski PS, Thomas MP, Gendelman HE. Genomic and proteomic microglial profiling: pathways for neuroprotective inflammatory responses following nerve fragment clearance and activation. J Neurochem. 2007;102:627–645. doi: 10.1111/j.1471-4159.2007.04568.x. [DOI] [PubMed] [Google Scholar]
- 65.Schneider CA, Rasband WS, Eliceiri KW. NIH Image to ImageJ: 25 years of image analysis. Nat Methods. 2012;9:671–675. doi: 10.1038/nmeth.2089. [DOI] [PMC free article] [PubMed] [Google Scholar]
- 66.Cox J, Matic I, Hilger M, Nagaraj N, Selbach M, Olsen JV, Mann M. A practical guide to the MaxQuant computational platform for SILAC-based quantitative proteomics. Nat Protoc. 2009;4:698–705. doi: 10.1038/nprot.2009.36. [DOI] [PubMed] [Google Scholar]
- 67.Wisniewski JR, Zougman A, Mann M. Combination of FASP and StageTip-based fractionation allows in-depth analysis of the hippocampal membrane proteome. J Proteome Res. 2009;8:5674–5678. doi: 10.1021/pr900748n. [DOI] [PubMed] [Google Scholar]
- 68.Bindea G, Mlecnik B, Hackl H, Charoentong P, Tosolini M, Kirilovsky A, Fridman WH, Pages F, Trajanoski Z, Galon J. ClueGO: a Cytoscape plug-in to decipher functionally grouped gene ontology and pathway annotation networks. Bioinformatics. 2009;25:1091–1093. doi: 10.1093/bioinformatics/btp101. [DOI] [PMC free article] [PubMed] [Google Scholar]
- 69.Bindea G, Galon J, Mlecnik B. CluePedia Cytoscape plugin: pathway insights using integrated experimental and in silico data. Bioinformatics. 2013;29:661–663. doi: 10.1093/bioinformatics/btt019. [DOI] [PMC free article] [PubMed] [Google Scholar]
- 70.Wu G, Feng X, Stein L. A human functional protein interaction network and its application to cancer data analysis. Genome Biol. 2010;11:R53. doi: 10.1186/gb-2010-11-5-r53. [DOI] [PMC free article] [PubMed] [Google Scholar]
- 71.Croft D, Mundo AF, Haw R, Milacic M, Weiser J, Wu G, Caudy M, Garapati P, Gillespie M, Kamdar MR, Jassal B, Jupe S, Matthews L, et al. The Reactome pathway knowledgebase. Nucleic Acids Res. 2014;42(Database issue):D472–477. doi: 10.1093/nar/gkt1102. [DOI] [PMC free article] [PubMed] [Google Scholar]
- 72.Li LP, Lu CH, Chen ZP, Ge F, Wang T, Wang W, Xiao CL, Yin XF, Liu L, He JX, He QY. Subcellular proteomics revealed the epithelial-mesenchymal transition phenotype in lung cancer. Proteomics. 2011;11:429–439. doi: 10.1002/pmic.200900819. [DOI] [PubMed] [Google Scholar]
Associated Data
This section collects any data citations, data availability statements, or supplementary materials included in this article.