

Abstract
Objective:
To characterize in vivo MRI signatures of focal cortical dysplasia (FCD) type IIA and type IIB through combined analysis of morphology, intensity, microstructure, and function.
Methods:
We carried out a multimodal 3T MRI profiling of 33 histologically proven FCD type IIA (9) and IIB (24) lesions. A multisurface approach operating on manual consensus labels systematically sampled intracortical and subcortical lesional features. Geodesic distance mapping quantified the same features in the lesion perimeter. Logistic regression assessed the relationship between MRI and histology, while supervised pattern learning was used for individualized subtype prediction.
Results:
FCD type IIB was characterized by abnormal morphology, intensity, diffusivity, and function across all surfaces, while type IIA lesions presented only with increased fluid-attenuated inversion recovery signal and reduced diffusion anisotropy close to the gray–white matter interface. Similar to lesional patterns, perilesional anomalies were more marked in type IIB extending up to 16 mm. Structural MRI markers correlated with categorical histologic characteristics. A profile-based classifier predicted FCD subtypes with equal sensitivity of 85%, while maintaining a high specificity of 94% against healthy and disease controls.
Conclusions:
Image processing applied to widely available MRI contrasts has the ability to dissociate FCD subtypes at a mesoscopic level. Integrating in vivo staging of pathologic traits with automated lesion detection is likely to provide an objective definition of lesional boundary and assist emerging approaches, such as minimally invasive thermal ablation, which do not supply tissue specimen.
Focal cortical dysplasia (FCD) type II is a developmental malformation, primarily characterized by intracortical dyslamination and dysmorphic neurons, either in isolation (FCD type IIA) or together with balloon cells (FCD type IIB).1 Despite clear cytomorphologic differences, FCD subtypes cannot be reliably distinguished on conventional MRI,2 even though qualitative studies have reported a tendency for more subtle anomalies in type IIA.3 It has been suggested that identifying subtype-specific imaging signatures has potential clinical utility.1,2,4 Notably, this ability may become increasingly relevant with the emergence of minimally invasive surgical procedures,5 which do not supply specimens for histologic diagnosis.
The current study carried out a multimodal MRI analysis that combines morphometry with metrics interrogating tissue intensity, microstructure, and function in a cohort of patients with histopathologically validated FCD type II. We designed a multisurface approach to systematically assess intracortical and subcortical lesional features. Motivated by reports showing pathologic extension outside the lesional margin,6,7 we furthermore evaluated the integrity of brain tissue adjacent to the lesion using a novel geodesic distance mapping and feature sampling procedure. Univariate and multivariate statistics were used to identify structural and functional signatures of FCD subtypes, logistic regression assessed the relationship between MRI and histology, while supervised pattern learning was used for individualized subtype prediction.
METHODS
Patients.
From a database of patients with drug-resistant neocortical epilepsy admitted to our institution between 2009 and 2012, we selected 33 consecutive patients with histologically proven FCD type II (17 male; mean ± SD age 28 ± 10 years).1 The presurgical workup included seizure history, neurologic examination, neuroimaging, and video-EEG monitoring. EEG interictal activity and ictal onset were concordant with the location of FCD lesions in 31 (94%) and 24 (73%) patients, respectively. In 15, surgery was preceded by invasive monitoring using stereotactic depth electrodes; all displayed high interictal activity and focal changes at seizure onset in electrodes targeting the lesion. At a mean ± SD postoperative follow-up8 of 4.1 ± 1.4 years, 21 patients became seizure-free (Engel I), 8 had rare disabling seizures (Engel II), and 4 had worthwhile improvement (Engel III).
Serial 5-μm paraffin-embedded sections of lesional tissue were stained with hematoxylin & eosin or Bielschowsky, and others were immunostained using antibodies against glial fibrillary acid protein, phosphorylated neurofilaments (SMI-32 monoclonal), microtubule-associated protein–2, and neuronal specific nuclear protein. FCD type II was defined as disrupted cortical lamination with dysmorphic neurons seen in isolation (type IIA, n = 9) or together with balloon cells (type IIB, n = 24). We evaluated severity of cortical dyslamination, blurring of cortical interface, and gliosis using categorical scoring (1 = mild, 2 = moderate, 3 = severe).
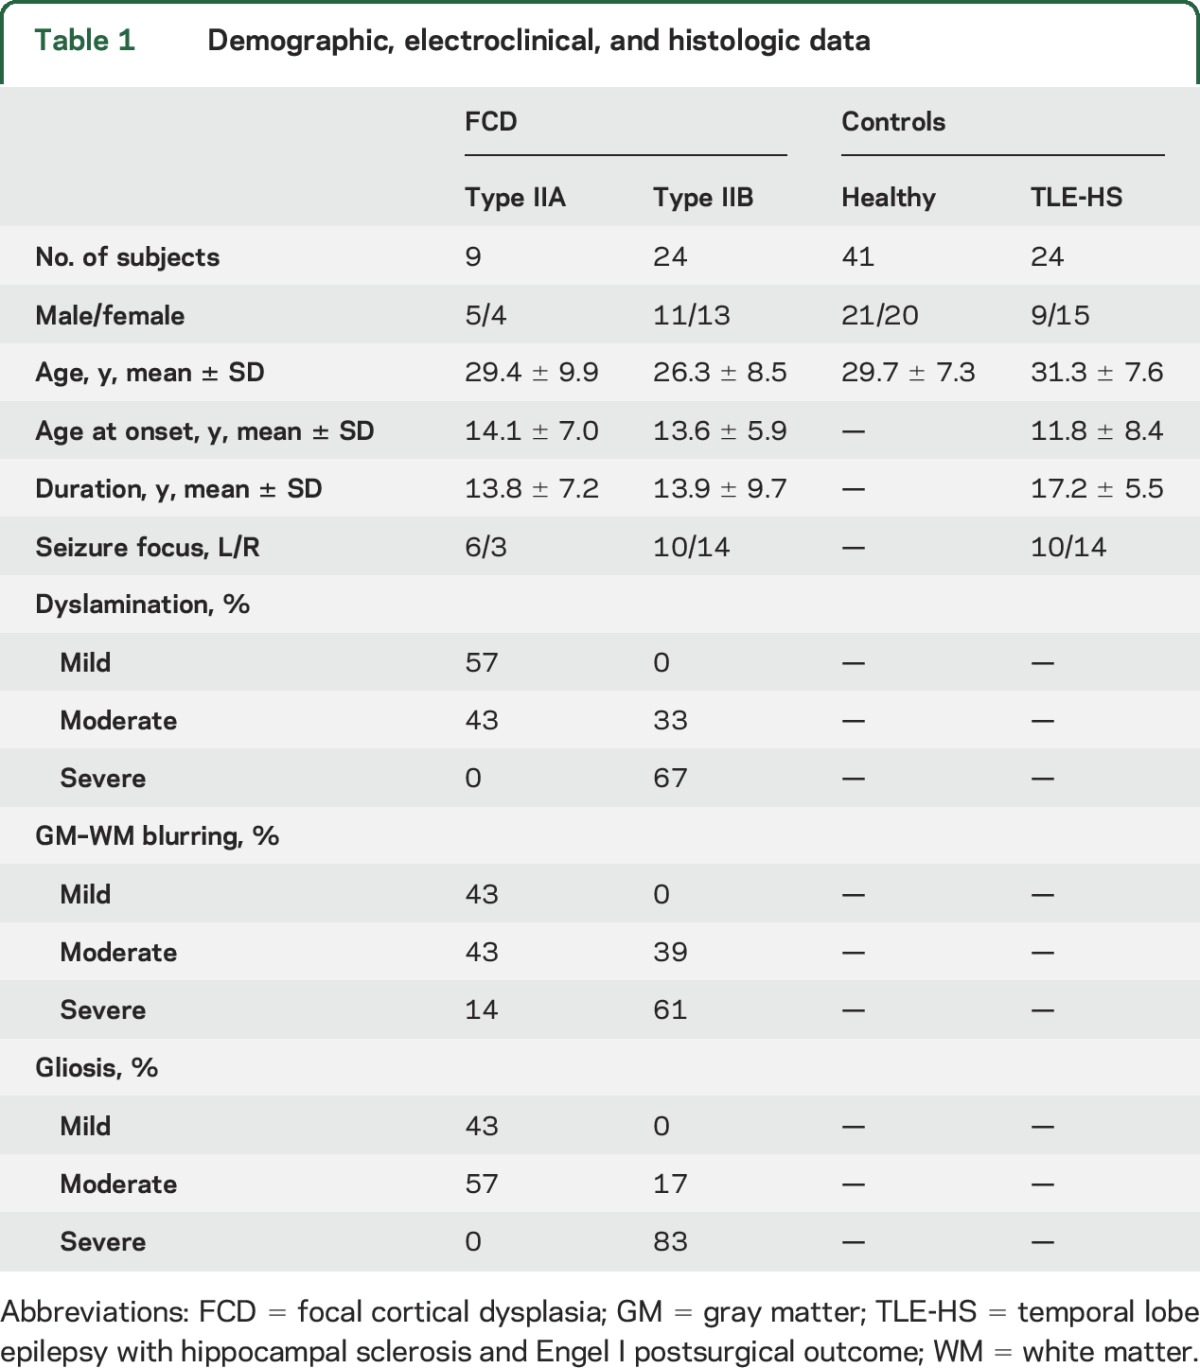
Our study included healthy controls (n = 41; 21 male, 30 ± 7 years) and disease controls consisting of patients with drug-resistant temporal lobe epilepsy (n = 24; 9 male, 31 ± 8 years) who had undergone a selective amygdalohippocampectomy, with histologically confirmed hippocampal sclerosis and who were seizure-free (Engel I, follow-up: 3.9 ± 1.7 years). Demographic, clinical, and histologic data are shown in table 1.
Table 1.
Demographic, electroclinical, and histologic data
Standard protocol approvals, registrations, and patient consents.
The ethics committee of the Montreal Neurological Institute and Hospital approved the study and written informed consent was obtained from all participants in accordance with the Declaration of Helsinki.
MRI acquisition.
Images were acquired on a 3T Siemens (Munich, Germany) scanner using a 32-channel head coil, including 3D T1-weighted magnetization-prepared rapid gradient echo (T1-weighted; repetition time [TR] 2,300 ms, echo time [TE] 2.98 ms, flip angle 9°, voxel size 1 × 1 × 1 mm3), 3D fluid-attenuated inversion recovery (FLAIR) (TR 5,000 ms, TE 389 ms, flip angle 120°, 0.9 × 0.9 × 0.9 mm3), 2D twice-refocused echoplanar diffusion-weighted images with axial slices (d-MRI; TR 8,400 ms, TE 90 ms, flip angle 90°, 2 × 2 × 2 mm3, 64 directions, b = 1,000 s/mm2), and resting-state functional MRI with oblique axial orientation (rs-fMRI; TR 2,020 ms, TE 30 ms, flip angle 90°, 34 slices, 4 × 4 × 4 mm3, 150 volumes).
Preprocessing and data fusion.
T1-weighted and FLAIR images underwent intensity nonuniformity correction9 and normalization (figure 1, A and B). T1-weighted images were linearly registered to the Montreal Neurological Institute (MNI) 152 symmetric template, followed by classification into white matter (WM), gray matter (GM), and CSF.10 The d-MRI, analyzed using FSL (fmrib.ox.ac.uk/fsl), underwent distortion correction based on a gradient echo field map acquired within the same imaging session, correction for motion and eddy currents. A tensor fitted at every voxel derived fractional anisotropy (FA) and mean diffusivity (MD). The rs-fMRI was analyzed using DPARSF (rfmri.org/DPARSF): after discarding the first 5 volumes, data underwent slice-time and motion correction, and realignment, followed by statistical correction for nuisance effects of WM and CSF signals and head motion. To correct for residual motion, we included timepoints with a framewise displacement >0.5 mm as covariates.11 FLAIR images were linearly mapped to T1-weighted images in MNI space. The rs-fMRI and d-MRI were registered to T1-weighted volumes using a boundary-based approach that maximizes alignment between intensity gradients of structural and echoplanar data.12 In addition to verifying accuracy of the intermodal registration visually, we calculated for each case mean mutual information, an index of intensity dependence between 2 images reflecting the registration quality, and did not observe group differences between patients and healthy (or disease) controls (p > 0.5; figure e-1 at Neurology.org).
Figure 1. Image processing.

(A) T1-weighted MRI undergoes intensity nonuniformity correction and intensity normalization. T1-weighted images are linearly registered to the Montreal Neurological Institute 152 symmetric template and classified into tissue types. (B) Multimodal coregistrations map each modality to native T1-weighted space. (C) Models of the GM-WM and GM–CSF interface are generated, followed by reconstruction of equidistant intracortical and subcortical WM surfaces. (D) Features describing cortical and subcortical morphology, intensity, diffusion (FA, MD), and function are represented in a unified surface-based frame of reference. ALFF = amplitude of local functional fluctuation; d-MRI = diffusion-weighted MRI; FA = fractional anisotropy; FLAIR = fluid-attenuated inversion recovery; GM = gray matter; MD = mean diffusivity; ReHo = regional homogeneity; rs-fMRI = resting-state functional MRI.
Surface construction.
The CLASP algorithm13 preprocessed T1-weighted images to generate models of the GM–WM and GM–CSF surfaces (figure 1C). CLASP iteratively warps a surface to fit the GM–WM boundary and estimates the outer surface by expanding the inner one along a Laplacian map. Surfaces were aligned based on cortical folding, improving interindividual correspondence. To examine intracortical GM, we positioned 3 surfaces between the inner and outer cortical surfaces at 25%, 50%, and 75% cortical thickness,14 guided by a straight line providing vertex correspondence across surfaces. To assess the WM immediately beneath the cortex, we generated surfaces guided by a Laplacian field running between the GM–WM interface and the ventricles, with between-surface intervals adapted to the resolution of each modality.
Surface-based feature extraction.
Two experts (D.S., N.B.), blinded to clinical information, segmented independently lesions on coregistered T1-weighted and FLAIR images (figure 1D). Interrater Dice agreement index (D = 2|M1∩M2|/[|M1|+|M2|]; M1: 1st label, M2: 2nd label; M1∩M2: intersection of M1 and M2) was 0.91 ± 0.11. This label was intersected with all surfaces, generating a surface-based lesion label on which profiling was performed. We calculated at each label vertex morphologic, intensity, diffusion, and functional features. To minimize interpolation during feature sampling, we mapped surfaces to the native space of each modality using the inverse transform of the initial coregistration.
Morphologic features.
Cortical thickness.
We measured thickness as the Euclidean distance between corresponding vertices on GM–WM and GM–CSF surfaces.13
Sulcal depth and curvature.
Small FCD lesions are located at the bottom of a deep sulcus.15 The depth of vertices within sulci was computed using the geodesic distance from gyral crown vertices.16 Dysplastic lesions may also cause curvature changes15; we measured absolute mean curvature along the 50% intracortical surface.17
Intensity-based features.
Normalized intensity.
We divided voxel-wise T1-weighted and FLAIR intensity by the average GM–WM boundary intensity; this value was normalized with respect to the mode of the T1-weighted and FLAIR intensity histogram18 and mapped on each intracortical/subcortical surface. We did not sample intensity on the GM–CSF surface to avoid CSF contamination14; at remaining surfaces, we corrected intensities for CSF partial volume effects.19
Gradient.
At a vertex v, vertical gradient was computed as the difference in normalized intensity between corresponding vertices above and below v on neighboring surfaces, divided by their distance. Horizontal gradient was computed as mean intensity difference between v and its immediate surface neighbors, divided by the mean distance between v and its neighbors. Values at the GM–CSF surface were not considered. Decreased vertical/horizontal gradients within cortical surfaces were interpreted as proxies for radial/tangential dyslamination. Decreased vertical gradient at the GM–WM interface modeled blurring.18
Diffusion parameters.
FA and MD are surrogate markers of fiber architecture and tissue microstructure.20 Given the lower resolution of d-MRI compared to FLAIR and T1-weighted MRI, parameters were interpolated at the 50% intracortical, GM–WM, and subcortical surfaces running at 2 and 4 mm depth.
Functional derivatives.
We calculated markers of local function: amplitude of low-frequency fluctuations (ALFF), a measure of bulk activation shown to relate to interictal spiking,21 and regional homogeneity (ReHo),22 which estimates time-series concordance between a voxel and its neighbors. Data were sampled on the 50% intracortical surface.
Statistical analysis.
We assessed group differences for continuous variables (age, age at seizure onset, disease duration) using 2-sample t tests and categorical variables (sex, focus laterality) using χ2. For surface-based analysis, we assigned at each vertex a unique vector of intracortical/subcortical structural, diffusion, and functional features smoothed using a surface-based 5 mm full width at half maximum (FWHM) Gaussian kernel and z normalized with respect to the distribution in healthy controls.
Multisurface and distance-based profiling.
MRI profiles were obtained by averaging features along cortical and subcortical surfaces within each patient's consensus label. For individual analysis, we calculated proportions of patients with abnormal features (absolute z scores ≥ 1.5) and feature combinations (multivariate Mahalanobis z scores ≥ 1.5) averaged across surfaces, and compared individual proportions between subtypes using 2-sample t tests.
To assess feature transitions between the lesion and adjacent cortex, we computed the surface-based geodesic distance between all cortical points outside the label to the lesional boundary.23 Compared to the Euclidian distance that measures the straight line distance, the geodesic distance, defined as the length of the shortest path between 2 vertices along the cortical surface, respects topology. The distance map was discretized into bins of 2 mm for T1-weighted, FLAIR, and d-MRI, and 4 mm for rs-fMRI and blurred using a minimal anisotropic smoothing (FWHM 2 mm) to maximize local specificity.24
After confirming normality of data distribution (Kolmogorov-Smirnov test), Student t tests compared patients to controls and contrasted FCD subtypes. Significance of between-group comparisons was also assessed using nonparametric Wilcoxon rank-sum tests. Correction for multiple comparisons was done using false discovery rate at q < 0.05.25
Correlation with histologic data.
We applied multinomial logistic regression between histology scores and structural MRI markers (T1-weighted, FLAIR, d-MRI): cortical dyslamination was modeled as decreased vertical gradients/intensity, blurring as decreased vertical gradient at the GM–WM interface and subcortical intensity, and gliosis as hyperintensity and increased MD. Model fits were compared to null models using χ2 tests.
Prediction of histologic subtypes.
A multiclass support vector machine (SVM)26 tested the ability of imaging profiles to discriminate FCD subtypes; inclusion of healthy and disease controls assessed specificity. SVM incorporates several advantageous properties to reduce overfitting and to provide good generalization performance despite a small sample size.26 The classifier was trained on imaging features derived from the consensus label in FCD cases; these labels were intersected with surfaces of healthy and disease controls to sample features in corresponding regions. The classifier integrated predictions of 3 base SVMs to discriminate between pairs (i.e., IIA vs IIB; IIA vs disease or healthy controls; IIB vs disease or healthy controls) through a max-wins voting scheme (i.e., the class with the most votes among the 3 binary classifications determined the final prediction). Performance was evaluated across combinations of (1) global features from single modalities (averaged across all surfaces); (2) global features from multiple modalities; (3) multimodal and multisurface features; and (4) multimodal, multisurface, and distance-based features. Feature selection, training, and performance evaluation were carried out using k-fold cross-validations (at k = 10 and 5) with 100 iterations. At each iteration, the dataset was randomly split in k subsets; the classifier was trained on k-1 subsets and tested on the remaining one. For the evaluation performance, we applied a bagging (i.e., bootstrap aggregation) procedure, which compensates for potential imbalances in the training dataset and further reduces the risk of overfitting by selecting a consistent classification result across subsamples. A feed-forward procedure selected features best separating groups. McNemar tests statistically compared the classifier performance across feature combinations, while permutation testing randomly shuffling class labels across 10,000 iterations assessed statistical significance of classification beyond chance level.
RESULTS
There was no difference in age or sex across cohorts (p > 0.2), nor were there differences in age at seizure onset, disease duration, or seizure focus laterality between patient cohorts (p > 0.1).
Multimodal lesion profiling.
Relative to controls, FCD type IIB presented with FLAIR intensity increases across all cortical and subcortical surfaces, while T1-weighted intensity was decreased only subcortically (figure 2). T1-weighted and FLAIR vertical gradients (modeling cortical radial dyslamination and blurring) were decreased at all intracortical surfaces and at the GM–WM junction. Lesions also displayed increased subcortical MD and altered function, indexed by decreased ALFF and ReHo. FCD type IIB also showed increased thickness and sulcal depth (figure e-2).
Figure 2. Multisurface lesion profiling.

For each MRI modality, individual patients (normalized with respect to corresponding regions in healthy controls) are plotted as a function of intracortical and subcortical level, separately for type IIA (red dots) and type IIB (black dots); zero reference line indicates the mean of controls; mean values and SDs in patients are shown as horizontal lines, color coded by patient group. Asterisks indicate significant differences with controls and between cohort contrasts after correction of multiple comparisons (false discovery rate [FDR] <0.05); small dots indicate uncorrected findings at p < 0.05. Profiling was based on a surface spacing that accommodated imaging resolution. An example case is shown in the upper left panel, with arrowheads pointing to the lesion. For abbreviations, see figure 1.
FCD IIA did not show significant morphologic, diffusion, or functional anomalies relative to controls after correction for multiple comparisons. At uncorrected thresholds (p < 0.05), we observed a marginal increase in cortical thickness and ReHo as well as decreased FA at the GM–WM interface and subcortical WM (power analysis at α = 0.025 and 1 − β = 0.8 revealed small effects; >125 patients would have been required to detect significant changes). On the other hand, intensity features showed significant changes in this subtype, which were characterized by decreased T1-weighted and FLAIR gradients close the GM–WM interface, and increased subcortical intensity.
Directly comparing patient cohorts revealed increased thickness, sulcal depth, FLAIR intensity, and decreased ALFF and ReHo in type IIB, while type IIA showed decreased FA at the GM–WM interface.
Univariate analysis of single features (table e-1) confirmed more prevalent abnormalities in type IIB compared to IIA (mean: 47% vs 23%, Wilcoxon signed-rank test: p < 0.01). Conversely, multivariate feature integration revealed comparable lesional load in both FCD subtypes (IIA: 78%; IIB: 88%). In controls, prevalence did not surpass 2%.
Distance-based analysis.
Structural neocortical features were abnormal until 6 mm away from the lesional boundary, while functional and subcortical diffusion alterations extended up to 16 mm (figure 3). Anomalies were more marked in type IIB, aside from FLAIR cortical vertical gradient and subcortical intensity, equally present in both subtypes. Conversely, reduced cortical FA, specific to type IIA, extended up to 6 mm outside the lesion. The extent of perilesional anomalies did not correlate with lesion volume.
Figure 3. Distance-based profiling of the lesion perimeter.

For each modality, features were normalized with respect to corresponding regions in healthy controls (HCs) and averaged across cortical and subcortical surfaces. Normalized data are plotted relative to the geodesic distance from the primary lesion (in steps of 2 mm for T1-weighted, FLAIR, and d-MRI and 4 mm for rs-fMRI). The binning scheme is exemplified in the right bottom panel. For abbreviations, see figure 1.
Histology–MRI correlations.
We observed more marked histologic anomalies in type IIB compared to type IIA (χ2 test; p < 0.005; table 1, figure e-3). Their severity correlated with the corresponding MRI profiles for dyslamination (R2 = 0.71; p < 0.005), GM–WM blurring (R2 = 0.73; p < 0.003), and gliosis (R2 = 0.55; p < 0.01).
FCD subtype prediction.
For both the 5- and 10-fold cross-validations (figure 4), maximal performance was obtained when combining multisurface with distance-based profiles with the multiclass SVM trained either on healthy controls (5-fold: 87% ± 4%, McNemar test: p = 0.03; 10-fold: 91% ± 4%, p = 0.02) or disease controls (86% ± 4%, p = 0.04; 89% ± 3%, p = 0.02). Permutation tests confirmed that accuracy surpassed chance level (p < 0.001). Main metrics chosen by feature selection procedures included T1-weighted vertical gradient, ReHo, FLAIR vertical gradient, T1-weighted cortical intensity, sulcal depth, FLAIR subcortical intensity, cortical thickness, perilesional cortical ReHo, and FA.
Figure 4. Automated classification.

(A) The plot shows the overall prediction accuracy across 100 iterations for classifiers operating on unimodal (i.e., lesional features derived from 1 modality) and multimodal feature combinations (multisurface and distance-based) based on the 10-fold cross-validation. Results are shown separately for classifiers including healthy controls (HC) (in black) and disease controls (DC) (in red). McNemar test compared accuracy across feature combinations. (B) Confusion matrix of median performance for learners operating on multimodal (multisurface and distance-based) features. The diagonal cells show correct predictions, while nondiagonal cells report incorrect predictions. Note that from the initial 53 MRI features per case (20 for T1-weighted, 17 for fluid-attenuated inversion recovery [FLAIR], 10 for diffusion-weighted MRI [d-MRI] and 6 for resting-state functional MRI [rs-fMRI]), only a subset was chosen by the feature selection to train the classifier. The average for the 5-/10-fold validation was 7 ± 2/7 ± 1 features, when training with healthy controls, and 7 ± 2/9 ± 1, when training with disease controls, respectively.
Across the 5- and 10-fold cross-validations, 84.3% of FCD type IIB, 86.3% of type IIA, 96% of healthy controls, and 92% of disease controls were correctly predicted. Among FCD cases, 6.1% were classified as healthy controls and 9.1% as disease controls, whereas histologic subtypes were switched in 7.6% of cases. A healthy or disease control was misclassified as FCD in 4.9% and 8.3% of cases, respectively.
DISCUSSION
Our multisurface analysis approach integrating structural and functional MRI in a unified framework allowed for dense sampling of FCD type II. While the absence of digitized tissue samples prevented a fully quantitative comparison between MRI and histology, our imaging markers reflecting categorical variations of main FCD features emphasize the ability of postprocessing to capture histopathology at mesoscopic scale. Pattern-learning paradigms validated between-group differences at the level of individual patients by accurately predicting subtypes while maintaining specificity against healthy and disease controls.
In line with histopathologic reports,27,28 abnormal morphology, intensity, and gradients across GM and WM compartments characterized FCD type IIB. Conversely, type IIA primarily displayed increased FLAIR and decreased FA close to the GM–WM interface, likely reflecting preferential occurrence of dysmorphic neurons in deep cortical layers,29 while decreased FA may speak to minimal demyelination and decreased fiber membrane circumference without apparent changes in density.20 Notably, increased subcortical FLAIR in both subtypes is highly suggestive of gliosis, which was equally prevalent in our cohorts.
Functional profiling provided independent support for between-subtype divergence. Increased ReHo in type IIA may reflect enhanced synchronization of local epileptogenic circuits.30 Such anomalies, reported in other focal syndromes31,32 and generalized epilepsies,33 suggest enhanced local connectivity as a common marker of chronic seizure activity. Conversely, decreased ReHo in type IIB may be specific to balloon cells, not necessarily a marker of epileptogenicity. Indeed, theoretical and experimental studies34,35 postulate that epileptogenicity in FCD type II may primarily relate to dysmorphic neurons. It is thus conceivable that aberrant neuronal activity may propagate more freely in type IIA than in IIB, where balloon cells would hinder local connectivity to surrounding networks or disrupt it, a hypothesis35–37 corroborated by the decrease in both ALFF and ReHo.
Our multimodal MRI profiling offers opportunities to optimize the diagnosis and treatment of cortical dysplasias. There is little consensus on whether type II dysplasias have distinct or gradual boundaries.6,27 Using distance-based feature profiling, we showed that normal-appearing cortex in the lesion perimeter presents with alterations resembling those found in the FCD core. At the scale of neuroimaging, our findings suggest a smooth transition from dysplastic to normal cortex that challenges visual appreciation. Lack of proper estimation of the lesional extent may lead to incomplete resection, potentially compromising seizure outcome, or a large resection that could encroach eloquent areas.
In light of recent data showing alterations in mTOR signaling pathway as a pathogenic substrate of FCD, and reduced seizure activity after administration of mTOR inhibitors,38 in vivo staging of pathologic traits may help guide the selection of novel molecules and monitor treatment response. Such approaches may also benefit minimally invasive thermal ablation, which does not supply tissue specimen for analysis.39 Notably, however, future studies are needed to assess generalizability and scalability of our algorithms across sites and imaging platforms. Moreover, subtype-specific multiparametric models of FCD are likely to increase the sensitivity of automatic lesion classification methods, particularly for detection of subtle dysplasias.
Supplementary Material
GLOSSARY
- ALFF
amplitude of low-frequency fluctuations
- d-MRI
diffusion-weighted MRI
- FA
fractional anisotropy
- FCD
focal cortical dysplasia
- FLAIR
fluid-attenuated inversion recovery
- FWHM
full width at half maximum
- GM
gray matter
- MD
mean diffusivity
- MNI
Montreal Neurological Institute
- ReHo
regional homogeneity
- rs-fMRI
resting-state functional MRI
- SVM
support vector machine
- TE
echo time
- TR
repetition time
- WM
white matter
Footnotes
Supplemental data at Neurology.org
AUTHOR CONTRIBUTIONS
S.-J. Hong: drafting manuscript for content, including medical writing; study concept and design; statistical analysis and interpretation of data. B.C. Bernhardt: drafting manuscript for content, including medical writing; study concept and design; statistical analysis, interpretation of data. B. Caldairou: image processing, interpretation of data. J.A. Hall: revising manuscript for content, interpretation of data. M.C. Guiot: analysis of resected tissue and interpretation of data. D. Schrader: expert lesion segmentation, revising manuscript for content. N. Bernasconi: revising manuscript for content, including medical writing; study concept and design; interpretation of data; study supervision; obtaining funding. A. Bernasconi: revising manuscript for content, including medical writing; study concept and design; interpretation of data; acquisition of data; study supervision; obtaining funding.
STUDY FUNDING
This work was supported by the Canadian Institutes of Health Research (CIHR, MOP-57840 and 123520). S.-J.H. and B.C.B. received Jeanne Timmins Costello and CIHR fellowships, respectively.
DISCLOSURE
The authors report no disclosures relevant to the manuscript. Go to Neurology.org for full disclosures.
REFERENCES
- 1.Blumcke I, Thom M, Aronica E, et al. The clinicopathologic spectrum of focal cortical dysplasias: a consensus classification proposed by an ad hoc Task Force of the ILAE Diagnostic Methods Commission. Epilepsia 2011;52:158–174. [DOI] [PMC free article] [PubMed] [Google Scholar]
- 2.Tassi L, Garbelli R, Colombo N, et al. Electroclinical, MRI and surgical outcomes in 100 epileptic patients with type II FCD. Epileptic Disord 2012;14:257–266. [DOI] [PubMed] [Google Scholar]
- 3.Colombo N, Tassi L, Deleo F, et al. Focal cortical dysplasia type IIa and IIb: MRI aspects in 118 cases proven by histopathology. Neuroradiology 2012;54:1065–1077. [DOI] [PubMed] [Google Scholar]
- 4.Lawson JA, Birchansky S, Pacheco E, et al. Distinct clinicopathologic subtypes of cortical dysplasia of Taylor. Neurology 2005;64:55–61. [DOI] [PubMed] [Google Scholar]
- 5.Gross RE, Mahmoudi B, Riley JP. Less is more: novel less-invasive surgical techniques for mesial temporal lobe epilepsy that minimize cognitive impairment. Curr Opin Neurol 2015;28:182–191. [DOI] [PubMed] [Google Scholar]
- 6.Cohen-Gadol AA, Ozduman K, Bronen RA, Kim JH, Spencer DD. Long-term outcome after epilepsy surgery for focal cortical dysplasia. J Neurosurg 2004;101:55–65. [DOI] [PubMed] [Google Scholar]
- 7.Wong M. Mechanisms of epileptogenesis in tuberous sclerosis complex and related malformations of cortical development with abnormal glioneuronal proliferation. Epilepsia 2008;49:8–21. [DOI] [PMC free article] [PubMed] [Google Scholar]
- 8.Engel J Jr. A proposed diagnostic scheme for people with epileptic seizures and with epilepsy: report of the ILAE Task Force on Classification and Terminology. Epilepsia 2001;42:796–803. [DOI] [PubMed] [Google Scholar]
- 9.Sled JG, Zijdenbos AP, Evans AC. A nonparametric method for automatic correction of intensity nonuniformity in MRI data. IEEE Trans Med Imaging 1998;17:87–97. [DOI] [PubMed] [Google Scholar]
- 10.Kim H, Caldairou B, Hwang JW, et al. Accurate cortical tissue classification on MRI by modeling cortical folding patterns. Hum Brain Mapp 2015;36:3563–3574. [DOI] [PMC free article] [PubMed] [Google Scholar]
- 11.Power JD, Barnes KA, Snyder AZ, Schlaggar BL, Petersen SE. Spurious but systematic correlations in functional connectivity MRI networks arise from subject motion. Neuroimage 2012;59:2142–2154. [DOI] [PMC free article] [PubMed] [Google Scholar]
- 12.Greve DN, Fischl B. Accurate and robust brain image alignment using boundary-based registration. Neuroimage 2009;48:63–72. [DOI] [PMC free article] [PubMed] [Google Scholar]
- 13.Kim JS, Singh V, Lee JK, et al. Automated 3-D extraction and evaluation of the inner and outer cortical surfaces using a Laplacian map and partial volume effect classification. Neuroimage 2005;27:210–221. [DOI] [PubMed] [Google Scholar]
- 14.Polimeni JR, Fischl B, Greve DN, Wald LL. Laminar analysis of 7 T BOLD using an imposed spatial activation pattern in human V1. Neuroimage 2010;52:1334–1346. [DOI] [PMC free article] [PubMed] [Google Scholar]
- 15.Besson P, Andermann F, Dubeau F, Bernasconi A. Small focal cortical dysplasia lesions are located at the bottom of a deep sulcus. Brain 2008;131:3246–3255. [DOI] [PubMed] [Google Scholar]
- 16.Engelhardt E, Inder TE, Alexopoulos D, et al. Regional impairments of cortical folding in premature infants. Ann Neurol 2015;77:154–162. [DOI] [PMC free article] [PubMed] [Google Scholar]
- 17.Im K, Lee JM, Lyttelton O, Kim SH, Evans AC, Kim SI. Brain size and cortical structure in the adult human brain. Cereb Cortex 2008;18:2181–2191. [DOI] [PubMed] [Google Scholar]
- 18.Hong SJ, Kim H, Schrader D, Bernasconi N, Bernhardt BC, Bernasconi A. Automated detection of cortical dysplasia type II in MRI-negative epilepsy. Neurology 2014;83:48–55. [DOI] [PMC free article] [PubMed] [Google Scholar]
- 19.Shafee R, Buckner RL, Fischl B. Gray matter myelination of 1555 human brains using partial volume corrected MRI images. Neuroimage 2015;105:473–485. [DOI] [PMC free article] [PubMed] [Google Scholar]
- 20.Beaulieu C. The basis of anisotropic water diffusion in the nervous system - a technical review. NMR Biomed 2002;15:435–455. [DOI] [PubMed] [Google Scholar]
- 21.Zhang ZQ, Lu GM, Zhong YA, et al. FMRI study of mesial temporal lobe epilepsy using amplitude of low-frequency fluctuation analysis. Hum Brain Mapp 2010;31:1851–1861. [DOI] [PMC free article] [PubMed] [Google Scholar]
- 22.Zang Y, Jiang T, Lu Y, He Y, Tian L. Regional homogeneity approach to fMRI data analysis. Neuroimage 2004;22:394–400. [DOI] [PubMed] [Google Scholar]
- 23.Dijkstra EW. A note on two problems in connexion with graphs. Numer Math 1959;1:269–271. [Google Scholar]
- 24.Studholme C, Cardenas V, Maudsley A, Weiner M. An intensity consistent filtering approach to the analysis of deformation tensor derived maps of brain shape. Neuroimage 2003;19:1638–1649. [DOI] [PubMed] [Google Scholar]
- 25.Benjamini Y, Hochberg Y. Controlling the false discovery rate: a practical and powerful approach to multiple testing. J R Stat Soc Ser B 1995:289–300. [Google Scholar]
- 26.Duda RO, Hart PE, Stork DG. Pattern Classification. Hoboken, NJ: Wiley; 2001. [Google Scholar]
- 27.Rossini L, Medici V, Tassi L, et al. Layer-specific gene expression in epileptogenic type II focal cortical dysplasia: normal-looking neurons reveal the presence of a hidden laminar organization. Acta Neuropathol Commun 2014;2:45. [DOI] [PMC free article] [PubMed] [Google Scholar]
- 28.Zucca I, Milesi G, Medici V, et al. Type II focal cortical dysplasia: ex vivo 7T magnetic resonance imaging abnormalities and histopathological comparisons. Ann Neurol 2016;79:42–58. [DOI] [PubMed] [Google Scholar]
- 29.Fauser S, Haussler U, Donkels C, et al. Disorganization of neocortical lamination in focal cortical dysplasia is brain-region dependent: evidence from layer-specific marker expression. Acta Neuropathol Commun 2013;1:47. [DOI] [PMC free article] [PubMed] [Google Scholar]
- 30.Zeng H, Pizarro R, Nair VA, La C, Prabhakaran V. Alterations in regional homogeneity of resting-state brain activity in mesial temporal lobe epilepsy. Epilepsia 2013;54:658–666. [DOI] [PMC free article] [PubMed] [Google Scholar]
- 31.Mankinen K, Long XY, Paakki JJ, et al. Alterations in regional homogeneity of baseline brain activity in pediatric temporal lobe epilepsy. Brain Res 2011;1373:221–229. [DOI] [PubMed] [Google Scholar]
- 32.Pedersen M, Curwood EK, Vaughan DN, Omidvarnia AH, Jackson GD. Abnormal brain areas common to the focal epilepsies: multivariate pattern analysis of fMRI. Brain Connectivity 2016;6:208–215. [DOI] [PubMed] [Google Scholar]
- 33.Jiang S, Luo C, Liu Z, et al. Altered local spontaneous brain activity in juvenile myoclonic epilepsy: a preliminary resting-state fMRI study. Neural Plast 2016;2016:3547203. [DOI] [PMC free article] [PubMed] [Google Scholar]
- 34.Cepeda C, Andre VM, Vinters HV, Levine MS, Mathern GW. Are cytomegalic neurons and balloon cells generators of epileptic activity in pediatric cortical dysplasia? Epilepsia 2005;46(suppl 5):82–88. [DOI] [PubMed] [Google Scholar]
- 35.Abdijadid S, Mathern GW, Levine MS, Cepeda C. Basic mechanisms of epileptogenesis in pediatric cortical dysplasia. CNS Neurosci Ther 2015;21:92–103. [DOI] [PMC free article] [PubMed] [Google Scholar]
- 36.Buccoliero AM, Barba C, Giordano F, et al. Expression of glutamine synthetase in balloon cells: a basis of their antiepileptic role? Clin Neuropathol 2015;34:83–88. [DOI] [PubMed] [Google Scholar]
- 37.Boonyapisit K, Najm I, Klem G, et al. Epileptogenicity of focal malformations due to abnormal cortical development: direct electrocorticographic histopathologic correlations. Epilepsia 2003;44:69–76. [DOI] [PubMed] [Google Scholar]
- 38.Citraro R, Leo A, Constanti A, Russo E, De Sarro G. mTOR pathway inhibition as a new therapeutic strategy in epilepsy and epileptogenesis. Pharmacol Res 2016;107:333–343. [DOI] [PubMed] [Google Scholar]
- 39.Crino PB. The mTOR signalling cascade: paving new roads to cure neurological disease. Nat Rev Neurol 2016;12:379–392. [DOI] [PubMed] [Google Scholar]
Associated Data
This section collects any data citations, data availability statements, or supplementary materials included in this article.