

Abstract
Diabetes mellitus is a complex metabolic disorder accompanied by alterations in cellular physiology, metabolism, and gene expression. These alterations can be primary (due to loss of direct insulin action) or secondary (due to the metabolic perturbations associated with the disease). To dissect and quantitate these two separate effects, we compared the skeletal muscle gene-expression profiles of muscle insulin receptor knockout (MIRKO) mice and their Lox controls in the basal, streptozotocin-induced diabetic, and insulin-treated diabetic states. Pure deficiency of insulin action as present in the MIRKO mouse results in regulation of 130 genes, with down-regulation of NSF (N-ethylmaleimide-sensitive fusion protein) and VAMP-2 (vesicle-associated membrane protein 2), stearoyl CoA desaturase 1, and cAMP-specific phosphodiesterase 4B, as well as up-regulation of some signaling-related genes, such as Akt2, and the fatty-acid transporter CD36. In diabetes, additional transcriptional mechanisms are activated, resulting in alterations in expression of ≈500 genes, including a highly coordinated down-regulation of genes of the mitochondrial electron-transport chain and one of the mammalian homologues of the histone deacetylase Sir2, which has been implicated in the link between nutrition and longevity. These distinct pathways of direct and indirect regulation of gene expression provide insights into the complex mechanisms of transcriptional control in diabetes and areas of potential therapeutic targeting.
Keywords: electron-transport chain, sirtuin
Diabetes mellitus, which is one of the most common causes of morbidity and mortality in westernized countries (1), results from a loss of insulin action on peripheral tissues. In type 1 diabetes, this loss of insulin action is due to absolute insulin deficiency, whereas there is a combination of insulin resistance and relative insulin deficiency in type 2 diabetes (2). Changes in gene expression are an important component of the pathogenesis of diabetes (3–5) and may be the result of the direct effects of decreased insulin action via receptor-mediated signaling, as well as indirect effects secondary to the metabolic and humoral changes associated with the disease. For example, recent studies (6, 7) have demonstrated a coordinated dysregulation of several of the genes encoding components of mitochondrial electron transport in muscle of individuals with impaired glucose tolerance or type 2 diabetes and their insulin-resistant relatives. However, it has been impossible to determine whether these alternations represent direct manifestations of the loss of insulin signaling due to insulin resistance, whether they are secondary to the abnormal metabolism in these conditions, or whether they are primary genetically determined defects.
The creation of targeted genetic models in mice, such as the muscle insulin receptor knockout (MIRKO) mice, in which there is a complete absence of the insulin-receptor signaling in skeletal muscle but normal insulin and glucose levels (8, 9), gives us the ability to use genetics to separate the direct and indirect effects of insulin action in higher organisms. By comparing skeletal muscle gene-expression profiles from MIRKO mice and their controls under three different metabolic conditions (namely, in the basal state, after streptozotocin (STZ)-induced diabetes, and after STZ-induced diabetes rendered euglycemic with insulin treatment), we can address the following three important questions. (i) What is the direct effect of the loss of insulin signaling on gene expression in skeletal muscle? (ii) What is the contribution of the metabolic and other changes that accompany diabetes to induce indirect changes in gene expression? (iii) How are these pathways regulated and implicated in the pathophysiology of diabetes? These studies should help to elucidate the genetic heterogeneity of diabetes and define targets for therapy.
Materials and Methods
Three groups of 6- to 8-week-old male MIRKO mice and their Lox controls were studied. One group of each genotype was given daily i.p. injections of sodium citrate (pH 4.3) for 3 days (controls). A second group of each genotype was treated with an i.p. injection of 100 μg of STZ (Sigma) in sodium citrate per g of body weight for 3 consecutive days. When these mice achieved fed glucose levels of >400 mg/dl for 3 consecutive days, they were separated into two groups. One-half of these mice were not treated, and the other one-half were treated with s.c. insulin pellets (LinShin, Toronto, ON, Canada), to obtain fed glucose levels of <200 mg/dl for at least 3 consecutive days (3). Thus, six experimental groups each consisting of at least six mice were created.
RNA was extracted from skeletal muscle, and two pools consisting of equal quantities of RNA from three mice within each group were created for each of the experimental groups. This pooled RNA and RNA from five or six individual mice in each group was used for hybridization to a total of seven or eight MG-U74A-v2 (Affymetrix, Santa Clara, CA) arrays per group (for details, see Supporting Materials and Methods, which is published as supporting information on the PNAS web site). Data analysis, using three filters of significance to identify differentially expressed genes, was performed as described (3) and is presented in Supporting Materials and Methods.
Results
Comparison of MIRKO with Lox Control Mice. By using MG-U74Av2 oligonucleotide arrays, we analyzed the expression of 12,488 genes and ESTs (hereafter referred to as genes) in skeletal muscle derived from the following six groups of mice: MIRKO and Lox control in the basal state, MIRKO and Lox control in the STZ-induced diabetes state, and MIRKO and Lox control in STZ-induced diabetes made euglycemic by insulin-treatment states (Fig. 1a). Of the 12,488 genes represented on the chip, 130 genes were differentially expressed in muscle between MIRKO and control mice, thus defining the subset of genes regulated by insulin by means of insulin receptor-mediated signaling (Fig. 1b and see Tables 3 and 4, which are published as supporting information on the PNAS web site), and they were further grouped based on functional ontology.
Fig. 1.

Experimental design. (a) MIRKO mice and their Lox control littermates were treated with either STZ or citrate buffer. The diabetic (blood sugar, >400 mg/dl) mice were either followed or treated with insulin (blood sugar, <200 mg/dl) (STZ–insulin group). (b) Genes that are altered significantly in expression in the MIRKO, Lox-STZ, and MIRKO-STZ groups are shown in a Venn diagram. See Results for a detailed explanation.
Signaling-Related Genes. cAMP-specific phosphodiesterase 4, which regulates many insulin- and glucagon-mediated pathways, including glycogen synthesis and glycogenolysis, was down-regulated by 39% in MIRKO muscle. This result indicates that in the basal state, insulin would up-regulate expression of this enzyme, resulting in a decrease in the level of cAMP (which normally opposes insulin action on carbohydrate metabolism). Expression of Akt2, which plays an important role in insulin-regulated metabolism and cell growth (10, 11), and SERCA2, which binds to IRS (insulin receptor substrate) proteins in an insulin-dependent manner (12), were increased in MIRKO (Table 4).
Membrane- and Metabolism-Related Genes. CD36, a cell-surface fatty-acid transporter, whose deficiency has been associated with both insulin resistance (13, 14) and atherosclerosis (15, 16) was up-regulated in MIRKO muscle, suggesting that insulin suppresses the expression of this protein. mRNA for ornithine decarboxylase and its antizyme inhibitor (which are both involved in synthesis of polyamines that have an important role in cell growth, replication, and the redox state) were up-regulated by 61% and 51%, respectively, in MIRKO muscle, indicating that insulin signaling has a tonic inhibitory influence on expression and activity of ornithine decarboxylase in muscle, leading to an increase in its activity. Stearoyl CoA desaturase 1 (SCD-1), which catalyzes an important step in the biosynthesis of mono-unsaturated fatty acids, was down-regulated in MIRKO muscle (Table 3). This down-regulation would be expected to decrease palmitoleate (16:1) and oleate (18:1) synthesis, which is a change that could contribute to changes in membrane fluidity (a feature of diabetes and insulin resistance) (17).
Transcription- and Translation-Related Genes. Histone acetyl transferase (HAT) type B was decreased by 41%. HAT activity, especially that associated with CBP/p300, is crucial in differentiation of skeletal muscle (18). Down-regulator of transcription DR-1 was up-regulated by 110% in MIRKO muscle. DR-1 is a phosphoprotein that interacts with the TATA box-binding protein (TBP), and represses both basal and activated levels of transcription (19, 20). DR-1 was further up-regulated in diabetes (see below).
Other Genes. Expression of NSF (N-ethylmaleimide-sensitive fusion) protein and VAMP-2 (vesicle-associated membrane protein 2), which have been implicated in Glut4 translocation (21, 22), was decreased significantly in MIRKO muscle. Interestingly, insulin-degrading enzyme (IDE) an extracellular thiol metalloprotease [which is capable of degrading insulin, insulin-like growth factors I and II, transforming growth factor type α, and β-amyloid (23, 24)] is down-regulated in the MIRKO muscle. IDE has been associated also with the diabetic phenotype in GK rats (25), and a deletion of this gene in mice resulted in hyperinsulinemia, glucose intolerance, and increased cerebral accumulation of endogenous β-amyloid, which is a hallmark of Alzheimer's disease (26).
Comparison of Lox-STZ and MIRKO and MIRKO-STZ. We compared data from Lox control mice, MIRKO mice, and MIRKO mice that were made diabetic with STZ to determine the direct effects of insulin, versus the effects of the diabetic state, on gene expression. In contrast with the modest number of changes (n = 130) in gene expression in the MIRKO mouse, the induction of diabetes by STZ led to many changes in gene expression in both the Lox control vs. Lox-STZ (n = 512) and MIRKO vs. MIRKO-STZ (n = 487) comparisons (Fig. 1b). By comparing the genes that were changed significantly in muscle of the diabetic groups (Lox-STZ and MIRKO-STZ) but not changed significantly in muscle of MIRKO mice, we identified genes that were regulated by the diabetic state (i.e., by altered metabolism, hormones, glycation, etc.) as opposed to the loss of insulin-receptor signaling.
Genes that were changed significantly in MIRKO versus Lox-STZ mice and the MIRKO versus MIRKO-STZ mice are shown in Fig. 2. In Fig. 2a, the ratio of expression for (MIRKO/Lox) (plotted on the ordinate) represents the effect of an isolated loss of insulin signaling on gene expression, whereas the ratio of expression for (Lox-STZ/Lox) (plotted on the abscissa) represents the combined effect of a loss of insulin signaling due to insulin deficiency and the diabetic state with all of its metabolic consequences. This analysis reveals both the concordance and discordance of the effects of diabetes and the effects of an isolated loss of insulin action.
Fig. 2.

Insulin-regulated versus diabetes-regulated gene expression. (a) Comparison of gene expression in Lox-STZ diabetic and MIRKO mice. The log of the ratios of the expression (experimental group/control) of genes that are changed significantly in either MIRKO or the Lox-STZ when compared with the Lox control are plotted on a log scale (every 0.3 units on the scale equals a 2-fold change). This comparison separated the genes into four quadrants, each reflecting either a concordant or discordant regulation of the genes by the loss of insulin-receptor-mediated signaling and the diabetic state. The genes labeled A and D, for example, were altered in diabetes, but they were not altered by a pure loss of insulin action in the MIRKO mouse; in contrast, the genes labeled B and C were altered in the MIRKO mouse but not in STZ diabetes. (b) The log of the ratios of the expression (experimental group/control) of genes that are changed significantly in either the MIRKO or the MIRKO-STZ when compared with the Lox control. The diagonal black line indicates the line of unity.
A similar comparison of MIRKO and MIRKO-STZ versus Lox controls is shown in Fig. 2b. In this case, by calculating the extent to which the points in the graph deviate from the line of identity (as shown by arrows for a representative gene in Fig. 2b), one can dissect out the respective contributions of insulin signaling and diabetes on gene expression (arrows in Fig. 2b). This analysis is presented in Table 5, and some examples are shown in Fig. 3. Expression of ornithine decarboxylase was up-regulated in the MIRKO mouse, but it was not changed further by induction of diabetes. However, the ATP-binding cassette B2 gene and insulin-like growth factor II were both up-regulated by diabetes but not changed in the MIRKO mouse. Platelet-derived growth factor receptor α was down-regulated in the MIRKO mouse, but diabetes had an almost equal effect to up-regulate the gene, such that in the MIRKO-STZ mouse, levels of this mRNA were essentially normal. Also, the loss of insulin action (MIRKO muscle) and diabetes both up-regulated DR1, such that the levels in the MIRKO-STZ mouse were even higher than in either STZ or MIRKO animals.
Fig. 3.

The “loss-of-insulin effect” and the calculated “diabetes effect” are shown for representative genes. The loss-of-insulin effect was calculated from the percentage of change in expression in the MIRKO as compared with the Lox controls. The diabetes effect was calculated as the difference between the percentage of change in the MIRKO-STZ and MIRKO when compared with the Lox controls (Table 5, which is published as supporting information on the PNAS web site).
Analysis of Diabetes-Regulated Genes. From the above data set, we could define 205 (118 down-regulated and 87 up-regulated) genes that were differentially expressed in both diabetes models but not regulated in the MIRKO mouse (Fig. 1b). By comparing the changes induced by diabetes in the MIRKO mice (MIRKO-STZ) with those in Lox-STZ mice and then studying which are correctable by insulin treatment, two striking patterns of insulin-regulated versus diabetes-regulated gene expression could be identified.
The first pattern is exemplified by genes that (i) were normal in the MIRKO mouse but were down-regulated in diabetes and (ii) responded to insulin treatment only in the Lox-STZ mice and not in the MIRKO-STZ (Fig. 4a and Table 1). Of these genes, 19 genes were metabolism-related, including 12 transcripts encoding the electron-transport chain. Although the decreases in expression were often modest (15–34%), they were highly reproducible, statistically significant, and coordinate in direction. This study reveals a mechanism for this coordinated transcriptional regulation (Fig. 4 and see Discussion) because all of these genes were down-regulated significantly in the diabetic Lox-STZ and MIRKO-STZ mice, and none were significantly changed in the MIRKO group (i.e., these are diabetes-regulated, not insulin-regulated, genes, but insulin action was required for return of the diabetic defect toward normal). A list of genes that were regulated in a similar way is presented in Tables 1 and 2.
Fig. 4.

Contrasting patterns of diabetes- and insulin-regulated genes. (a) The ratios of the expressions (experimental/lox control) of all of the genes of the electron-transport chain that were changed significantly in the diabetic groups are shown. All of these genes are changed significantly in the diabetic groups (Lox-STZ and MIRKO-STZ) but not in the MIRKO group. With insulin treatment, all of these genes corrected toward the Lox control by >50% in the Lox-STZ-INS but not in the MIRKO-STZ-INS group. The indicated genes are subunits of the electron-transport chain complexes I–V (C-I–C-V). (b) The ratios of the expression (experimental/lox-control) of the genes for carnitine palmitoyl CoA transferase1 (CPT1), δ3-δ2 enoyl CoA hydratase, cAMP-dependent protein kinase, and ubiquitin-specific protease 2 are shown. All of these genes are changed significantly in the diabetic groups (Lox-STZ and MIRKO-STZ) but not in the MIRKO group. With insulin treatment, all of these genes corrected toward the control by >50% in the Lox-STZ-INS but not in the MIRKO-STZ-INS group.
Table 1. Genes significantly down-regulated in diabetes with intact (third column) or without (fourth column) insulin-receptor-mediated signaling.
| GenBank accession no. | Gene/protein name | Fold change in Lox-STZ/Lox | Fold change in MIRKO-STZ/Lox |
|---|---|---|---|
| Metabolism-related | |||
| AI843232 | 3-Oxoacid CoA transferase | 0.55 | 0.60 |
| AW047743 | Isovaleryl coenzyme A dehydrogenase | 0.63 | 0.70 |
| AI853855 | Complex I | 0.66 | 0.70 |
| AF010499 | Guanidinoacetate methyltransferase (creatine synthesis) | 0.66 | 0.63 |
| AI181132 | Creatine kinase precursor, mitochondrial | 0.67 | 0.67 |
| AF080469 | Glucose-6-phosphatase, transport protein 1 | 0.68 | 0.60 |
| AI848871 | Complex I | 0.69 | 0.73 |
| U13841 | Complex V | 0.69 | 0.72 |
| AW123802 | Complex I | 0.71 | 0.77 |
| U15541 | Complex IV | 0.71 | 0.76 |
| AI849803 | Complex I | 0.74 | 0.77 |
| AI849767 | Complex V | 0.74 | 0.71 |
| AF029843 | Phosphoglycerate mutase muscle-specific subunit | 0.77 | 0.83 |
| AI853523 | Complex III | 0.78 | 0.70 |
| AF037371 | Complex IV | 0.79 | 0.80 |
| X53157 | Complex IV | 0.82 | 0.82 |
| AW061302 | Complex III | 0.84 | 0.73 |
| U77128 | Complex V | 0.88 | 0.80 |
| AI852862 | Fumarate hydratase 1 | 0.90 | 0.90 |
| Signaling-related | |||
| AI836322 | Similar to RhoGDI-1 | 0.66 | 0.68 |
| Transcription/translation-related | |||
| M98036 | Eukaryotic translation initiation factor 2B | 0.75 | 0.77 |
| AI854467 | SD23 homolog | 0.77 | 0.79 |
Table 2. Genes significantly up-regulated in diabetes with intact (third column) or without (fourth column) insulin-receptor-mediated signaling.
| GenBank accession no. | Gene/protein | Fold change in Lox-STZ/Lox | Fold change in MIRKO-STZ/Lox |
|---|---|---|---|
| Metabolism-related | |||
| AF017175 | Carnitine palmitoyltransferase 1, liver | 2.31 | 2.00 |
| AI840013 | Peroxisomal delta3, delta2-enoyl-coenzyme A isomerase | 1.78 | 1.64 |
| AW125884 | Acetyl-coenzyme A synthetase 2 | 1.49 | 1.50 |
| AI846600 | Monoglyceride lipase | 1.24 | 1.27 |
| Signaling-related | |||
| AI836322 | Protein tyrosine phosphatase, nonreceptor type 1 | 1.76 | 1.49 |
| AW049031 | Immediate-early response, erythropoietin 1 | 1.73 | 1.72 |
| M19381 | Calmodulin | 1.42 | 1.26 |
| J02626 | Similar to protein kinase, cAMP-dependent, catalytic, β | 1.37 | 1.27 |
| U22324 | Fibroblast growth-factor receptor 1 | 1.28 | 1.35 |
| Transcription/translation-related | |||
| AF038939 | Paternally expressed gene 3 | 1.89 | 1.88 |
| AA960603 | Butyrate response factor 2 | 1.52 | 1.54 |
| AI846060 | Zinc finger RNA binding protein | 1.47 | 1.47 |
| U00431 | High-mobility group protein 1 | 1.43 | 1.30 |
| AI835685 | Splicing factor pRP 8 | 1.40 | 1.30 |
| X98511 | Similar to splicing factor, arginine/serine-rich 2 (SC-35) | 1.39 | 1.43 |
| Transport/trafficking-related | |||
| AI839718 | Microsomal signal peptidase 23 kDa | 2.12 | 3.00 |
| AI843574 | Homolog to signal recognition particle α subunit (docking protein α) | 1.44 | 1.17 |
| AI835359 | Translocon-associated protein γ (TRAP-γ), signal sequence receptor γ | 1.39 | 1.33 |
A similar but inverse profile of gene expression [i.e., up-regulated in diabetes (Lox-STZ and MIRKO-STZ) but with no significant change in MIRKO, and responsive to insulin only in the Lox-STZ but not in the MIRKO-STZ] was observed for 33 genes (Fig. 4b and Table 2). This pattern of transcriptional regulation was operative for many genes involved in fatty-acid metabolism, including carnitine palmitoyl transferase 1, δ3- δ2 enoyl CoA isomerase, acetyl CoA synthetase 2, and monoglyceride lipase. The transcript of cAMP-specific protein kinase β catalytic subunit (which is up-regulated in Lox-STZ and MIRKO-STZ) has multiple metabolic actions, including in glycogen metabolism in which it opposes insulin action. Interestingly, decreased activity of this enzyme is associated with increased longevity in yeast (27).
Regulation of Transcription and Translation. Several components of the general transcription and translation machinery were altered in diabetes. In addition to the up-regulation of DR-1 and down-regulation of HAT type B that was described above, sirtuin3 [a mouse homolog of the yeast silent mating type information regulator 2 (Sir2)] was down-regulated significantly in the MIRKO-STZ. It also decreased in the Lox-STZ, although this change did not achieve statistical significance. Sir2 is a family of type III histone deacetylases that are involved in NAD-dependent transcriptional repression. Western blotting confirmed that protein levels of Sir2 homologues in the nuclear/mitochondrial and cytosolic extracts from skeletal muscle of STZ diabetic mice were decreased by 40–45% (Fig. 5).
Fig. 5.

Changes in Sirtuin3 and sir2 with diabetes. (a) The mean transcript levels of Sirtuin3 in skeletal muscle in the various metabolic groups, as detected by microarray analysis, are shown as a percentage of the level in the control group. (b) The bands for sir2 in the nuclear (N) and cytosolic (C) fractions from the hind-limb muscles of wild-type control and STZ-induced diabetic mice are shown on immunoblots (for detailed methods, see Supporting Materials and Methods). (c) The mean intensity of the nuclear and cytosolic fraction sir2 bands on immunoblotting from two control and two diabetic mice are shown. The total is the sum of the respective nuclear and cytosolic fractions. The levels are represented as a percentage of the mean total level in the control group.
mRNA for eukaryotic translation initiation factor (eIF) 2b δ subunit was also decreased in the two diabetic states (Lox-STZ and MIRKO-STZ), whereas that the translation inhibitor eIF4e-binding protein (eIF4e-bp) was increased in MIRKO muscle and increased even more when diabetes was superimposed on this model (Fig. 6, which is published as supporting information on the PNAS web site). The activity of eIF4e-bp has been shown to be regulated by insulin through a phosphorylation cascade (28) and is decreased in diabetes (29). In addition, eIF4e-bp has been linked to insulin resistance because deletion of this gene results in increased insulin sensitivity (30).
Discussion
Regulation of gene expression is a central element of normal physiology and disease pathophysiology. However, it is challenging to define the precise factors, such as hormones, that regulate gene expression in vivo because, by their very nature, they can produce a wide variety of metabolic effects that may secondarily regulate gene expression. More complex, although a change in transcript expression does not necessarily result in a protein change, small changes in gene expression can often lead to cascading and amplifying effects on protein expression and metabolic pathways. For example, in the case of insulin deficiency, there are changes in glucose, many lipid and protein metabolites, other hormones, ion flux, and additional factors, which can regulate gene expression beyond the direct effects of the hormone. In this study, we have used a previously uncharacterized paradigm for genetic analysis of insulin action in vivo, and we have shown how insulin-regulated genes can be distinguished from diabetes-regulated genes. We have also shown that these alternations define discernable clusters of coordinated regulation.
Comparison of MIRKO mice with STZ diabetes and control mice indicates that direct insulin action has a role in maintaining the basal expression levels of only a relatively modest subset (≈1%) of genes on the chip as compared with the large number (≈4%) of genes that are altered in diabetes. One of the most striking examples of diabetes-mediated, rather than insulin-mediated, regulation relates to the nuclear encoded subunits of the mitochondrial electron-transport chain. For these genes, expression in the basal state (even in the absence of insulin action) is normal, whereas there is a coordinated decrease in expression of 12 components of this complex system in diabetes. Also, whereas there is a lack of dependence on insulin action in the basal state, insulin receptor-mediated signaling is required to reverse the effects induced by diabetes. A converse pattern of regulation is seen for a number of genes involved in other biological processes. This pattern of regulation suggests a mechanism in which the metabolic derangements of diabetes induce a repressor of gene expression that may coordinately down-regulate a family of genes (or an activator that may coordinately up-regulate the expression of genes), which has its own expression suppressed by direct insulin action. Thus, there is no effect of an isolated loss of insulin action in the MIRKO mouse in the basal state; however, when diabetes occurs and the repressor or activator is expressed, the presence of an intact insulin-signaling system is needed to return its expression toward normal.
These findings are particularly relevant to the recent observations that there is coordinated down-regulation of genes (4, 6, 7) and decreased activity (31) of the electron-transport chain in muscle of insulin-resistant individuals with diabetes and aging, respectively. Based on the findings of this study (demonstrating no changes in these genes in the MIRKO mouse), we can infer that the alterations observed in these human studies are not likely to be a result of the insulin resistance but are either independent primary genetic alterations or are secondary to the processes of altered metabolism associated with diabetes and aging.
Although the precise regulators of these diabetes-related changes remain to be defined, three candidates for the coordinated down-regulation are DR1, HAT type B, and sirtuin3. DR1 is a 176-amino acid protein that interacts with the TATA box-binding protein (TBP) in a phosphorylation-dependent manner to repress both basal and activated levels of transcription (19). DR1 is up-regulated in the MIRKO mouse (indicating that it is under insulin control), and it is further up-regulated in the diabetic state. In addition, there is down-regulation of HAT type B and Sirtuin3, a homolog of the yeast Sir2, in STZ-induced diabetes. The Sir2 family of type III histone deacetylases is involved in NAD-dependent transcriptional repression and is thought to play an important role in the response to aging and caloric restriction (see below) (32). In the latter case, this function may be further modified by interactions at the biological level.
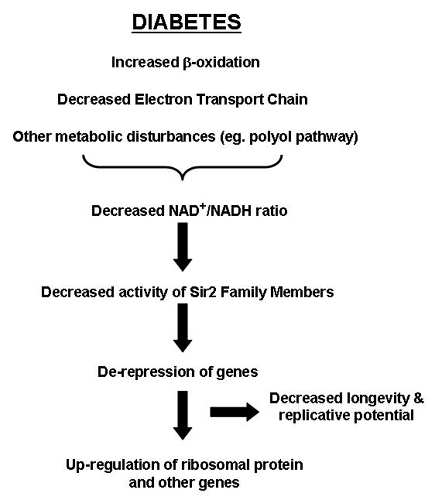
For example, a major portion of intracellular NADH, which is normally generated by the oxidative metabolism of glucose and fatty acids, is converted to NAD with a simultaneous generation of ATP by the electron-transport chain. Thus, a decrease in expression or activity of the electron-transport chain subunits as seen in diabetes (6, 7) or aging (31) could contribute to a decreased NAD+/NADH ratio. Indeed, studies have demonstrated reduced NAD+/NADH ratios in diabetes (33, 34). Decreases in NAD+ would be expected to lead to a decrease in the activity of NAD+-dependent processes, including the Sir2 NAD+-dependent histone deacetylases. We find that Sirtuin3, a member of this family, is also decreased at both the mRNA and protein level in diabetic mice. Changes in Sir2 related activities could act to regulate the genes for many ribosomal proteins (35, 36), and other proteins whose expression is altered in diabetes (3). Sir2 family members have also been shown to regulate muscle gene expression and differentiation by possibly functioning as a redox sensor in response to food intake and starvation (37), and an increase in Sir2 has been associated with increased longevity induced by calorie restriction in C. elegans (38, 39), yeast (40, 41), flies (42) and mammalian cells (43). A schematic model is shown in Fig. 7, which is published as supporting information on the PNAS web site.
The exact role of SIRT3 in mammals is unknown, but this Sir protein has been shown to be preferentially localized in mitochondria (44). Alterations in mitochondrial function (45) and especially in the mitochondrial electron-transport chain have been found in muscle of animal models of type 1 diabetes (3) and humans with type 2 diabetes (7). Whether the decrease in SIRT3 level in diabetes plays a role in control of metabolism remains to be determined.
In summary, by using mouse genetics we have defined in vivo those genes that are regulated directly by insulin versus those that are regulated by the diabetic metabolic milieu. Furthermore, we have identified transcriptional regulatory mechanisms by which diabetes may coordinately regulate the expression of electron-transport chain subunits and fatty-acid metabolism-related genes. These pathways provide insights into mechanisms by which insulin and key metabolites control transcription, identify possible targets for therapeutic intervention in the care of patients with diabetes, suggest mechanisms of the detrimental effect of diabetes on cellular longevity and replicative potential.
Supplementary Material
Acknowledgments
We thank Dod Michael Isaac Kohane and Atul Butte for discussion about design and data analysis, and Julie Marr and Martha Strom for their assistance in preparing the manuscript. This study was supported by the National Institutes of Health Grants DK36836–15, DK33201, and DK45935 (to C.R.K.).
Abbreviations: MIRKO, muscle insulin receptor knockout; STZ, streptozotocin; HAT, histone acetyl transferase.
References
- 1.Skyler, J. S. & Oddo, C. (2002) Diabetes Metab Res. Rev. 18 Suppl 3, S21–S26. [DOI] [PubMed] [Google Scholar]
- 2.Kahn, C. R. (1994) Diabetes 43, 1066–1084. [DOI] [PubMed] [Google Scholar]
- 3.Yechoor, V. K., Patti, M. E., Saccone, R. & Kahn, C. R. (2002) Proc. Natl. Acad. Sci. USA 99, 10587–10592. [DOI] [PMC free article] [PubMed] [Google Scholar]
- 4.Sreekumar, R., Halvatsiotis, P., Schimke, J. C. & Nair, K. S. (2002) Diabetes 51, 1913–1920. [DOI] [PubMed] [Google Scholar]
- 5.O'Brien, R. M. & Granner, D. K. (1996) Physiol. Rev. 76, 1109–1161. [DOI] [PubMed] [Google Scholar]
- 6.Mootha, V. K., Lindgren, C. M., Eriksson, K. F., Subramanian, A., Sihag, S., Lehar, J., Puigserver, P., Carlsson, E., Ridderstrale, M., Laurila, E., et al. (2003) Nat. Genet. 34, 267–273. [DOI] [PubMed] [Google Scholar]
- 7.Patti, M. E., Butte, A. J., Crunkhorn, S., Cusi, K., Berria, R., Kashyap, S., Miyazaki, Y., Kohane, I., Costello, M., Saccone, R., et al. (2003) Proc. Natl. Acad. Sci. USA 100, 8466–8471. [DOI] [PMC free article] [PubMed] [Google Scholar]
- 8.Bruning, J. C., Michael, M. D., Winnay, J. N., Hayashi, T., Horsch, D., Accili, D., Goodyear, L. J. & Kahn, C. R. (1998) Mol. Cell 2, 559–569. [DOI] [PubMed] [Google Scholar]
- 9.Wojtaszewski, J. F., Higaki, Y., Hirshman, M. F., Michael, M. D., Dufresne, S. D., Kahn, C. R. & Goodyear, L. J. (1999) J. Clin. Invest. 104, 1257–1264. [DOI] [PMC free article] [PubMed] [Google Scholar]
- 10.Saltiel, A. R. & Kahn, C. R. (2001) Nature 414, 799–806. [DOI] [PubMed] [Google Scholar]
- 11.Scheid, M. P. & Woodgett, J. R. (2001) Nat. Rev. Mol. Cell Biol. 2, 760–768. [DOI] [PubMed] [Google Scholar]
- 12.Algenstaedt, P., Antonetti, D. A., Yaffe, M. B. & Kahn, C. R. (1997) J. Biol. Chem. 272, 23696–23702. [DOI] [PubMed] [Google Scholar]
- 13.Aitman, T. J., Glazier, A. M., Wallace, C. A., Cooper, L. D., Norsworthy, P. J., Wahid, F. N., al-Majali, K. M., Trembling, P. M., Mann, C. J., Shoulders, C. C., et al. (1999) Nat. Genet. 21, 76–83. [DOI] [PubMed] [Google Scholar]
- 14.Pravenec, M., Landa, V., Zidek, V., Musilova, A., Kren, V., Kazdova, L., Aitman, T. J., Glazier, A. M., Ibrahimi, A., Abumrad, N. A., et al. (2001) Nat. Genet. 27, 156–158. [DOI] [PubMed] [Google Scholar]
- 15.Febbraio, M., Hajjar, D. P. & Silverstein, R. L. (2001) J. Clin. Invest. 108, 785–791. [DOI] [PMC free article] [PubMed] [Google Scholar]
- 16.Nicholson, A. C., Han, J., Febbraio, M., Silversterin, R. L. & Hajjar, D. P. (2001) Ann. N. Y. Acad. Sci. 947, 224–228. [DOI] [PubMed] [Google Scholar]
- 17.Vessby, B. (2000) Br. J. Nutr. 83, Suppl. 1, S91–S96. [DOI] [PubMed] [Google Scholar]
- 18.Polesskaya, A., Naguibneva, I., Fritsch, L., Duquet, A., it-Si-Ali, S., Robin, P., Vervisch, A., Pritchard, L. L., Cole, P. & Harel-Bellan, A. (2001) EMBO J. 20, 6816–6825. [DOI] [PMC free article] [PubMed] [Google Scholar]
- 19.Inostroza, J. A., Mermelstein, F. H., Ha, I., Lane, W. S. & Reinberg, D. (1992) Cell 70, 477–489. [DOI] [PubMed] [Google Scholar]
- 20.White, R. J., Khoo, B. C., Inostroza, J. A., Reinberg, D. & Jackson, S. P. (1994) Science 266, 448–450. [DOI] [PubMed] [Google Scholar]
- 21.St-Denis, J. F. & Cushman, S. W. (1998) J. Basic Clin. Physiol. Pharmacol. 9, 153–165. [DOI] [PubMed] [Google Scholar]
- 22.Bryant, N. J., Govers, R. & James, D. E. (2002) Nat. Rev. Mol. Cell Biol. 3, 267–277. [DOI] [PubMed] [Google Scholar]
- 23.Hamel, F. G., Gehm, B. D., Rosner, M. R. & Duckworth, W. C. (1997) Biochim. Biophys. Acta 1338, 207–214. [DOI] [PubMed] [Google Scholar]
- 24.Qiu, W. Q., Walsh, D. M., Ye, Z., Vekrellis, K., Zhang, J., Podlisny, M. B., Rosner, M. R., Safavi, A., Hersh, L. B. & Selkoe, D. J. (1998) J. Biol. Chem. 273, 32730–32738. [DOI] [PubMed] [Google Scholar]
- 25.Fakhrai-Rad, H., Nikoshkov, A., Kamel, A., Fernstrom, M., Zierath, J. R., Norgren, S., Luthman, H. & Galli, J. (2000) Hum. Mol. Genet. 9, 2149–2158. [DOI] [PubMed] [Google Scholar]
- 26.Farris, W., Mansourian, S., Chang, Y., Lindsley, L., Eckman, E. A., Frosch, M. P., Eckman, C. B., Tanzi, R. E., Selkoe, D. J. & Guenette, S. (2003) Proc. Natl. Acad. Sci. USA 100, 4162–4167. [DOI] [PMC free article] [PubMed] [Google Scholar]
- 27.Lin, S. J., Kaeberlein, M., Andalis, A. A., Sturtz, L. A., Defossez, P. A., Culotta, V. C., Fink, G. R. & Guarente, L. (2002) Nature 418, 344–348. [DOI] [PubMed] [Google Scholar]
- 28.Gingras, A. C., Kennedy, S. G., O'Leary, M. A., Sonenberg, N. & Hay, N. (1998) Genes Dev. 12, 502–513. [DOI] [PMC free article] [PubMed] [Google Scholar]
- 29.Kostyak, J. C., Kimball, S. R., Jefferson, L. S. & Farrell, P. A. (2001) J. Appl. Physiol. 91, 79–84. [DOI] [PubMed] [Google Scholar]
- 30.Tsukiyama-Kohara, K., Poulin, F., Kohara, M., DeMaria, C. T., Cheng, A., Wu, Z., Gingras, A. C., Katsume, A., Elchebly, M., Spiegelman, B. M., et al. (2001) Nat. Med. 7, 1128–1132. [DOI] [PubMed] [Google Scholar]
- 31.Petersen, K. F., Befroy, D., Dufour, S., Dziura, J., Ariyan, C., Rothman, D. L., DiPietro, L., Cline, G. W. & Shulman, G. I. (2003) Science 300, 1140–1142. [DOI] [PMC free article] [PubMed] [Google Scholar]
- 32.Blander, G. & Guarente, L. (2004) Annu. Rev. Biochem. 73, 417–435. [DOI] [PubMed] [Google Scholar]
- 33.Trueblood, N. & Ramasamy, R. (1998) Am. J. Physiol. 275, H75–H83. [DOI] [PubMed] [Google Scholar]
- 34.Salceda, R., Vilchis, C., Coffe, V. & Hernandez-Munoz, R. (1998) Neurochem. Res. 23, 893–897. [DOI] [PubMed] [Google Scholar]
- 35.Smith, J. S. & Boeke, J. D. (1997) Genes Dev. 11, 241–254. [DOI] [PubMed] [Google Scholar]
- 36.Straight, A. F., Shou, W., Dowd, G. J., Turck, C. W., Deshaies, R. J., Johnson, A. D. & Moazed, D. (1999) Cell 97, 245–256. [DOI] [PubMed] [Google Scholar]
- 37.Fulco, M., Schiltz, R. L., Iezzi, S., King, M. T., Zhao, P., Kashiwaya, Y., Hoffman, E., Veech, R. L. & Sartorelli, V. (2003) Mol. Cell 12, 51–62. [DOI] [PubMed] [Google Scholar]
- 38.Guarente, L. & Kenyon, C. (2000) Nature 408, 255–262. [DOI] [PubMed] [Google Scholar]
- 39.Tissenbaum, H. A. & Guarente, L. (2001) Nature 410, 227–230. [DOI] [PubMed] [Google Scholar]
- 40.Kaeberlein, M., McVey, M. & Guarente, L. (1999) Genes Dev. 13, 2570–2580. [DOI] [PMC free article] [PubMed] [Google Scholar]
- 41.Lin, S. J., Ford, E., Haigis, M., Liszt, G. & Guarente, L. (2004) Genes Dev. 18, 12–16. [DOI] [PMC free article] [PubMed] [Google Scholar]
- 42.Rogina, B., Helfand, S. L. & Frankel, S. (2002) Science 298, 1745. [DOI] [PubMed] [Google Scholar]
- 43.Cohen, H. Y., Miller, C., Bitterman, K. J., Wall, N. R., Hekking, B., Kessler, B., Howitz, K. T., Gorospe, M., de, C. R. & Sinclair, D. A. (2004) Science 305, 390–392. [DOI] [PubMed] [Google Scholar]
- 44.Onyango, P., Celic, I., McCaffery, J. M., Boeke, J. D. & Feinberg, A. P. (2002) Proc. Natl. Acad. Sci. USA 99, 13653–13658. [DOI] [PMC free article] [PubMed] [Google Scholar]
- 45.Kelley, D. E., He, J., Menshikova, E. V. & Ritov, V. B. (2002) Diabetes 51, 2944–2950. [DOI] [PubMed] [Google Scholar]
Associated Data
This section collects any data citations, data availability statements, or supplementary materials included in this article.