

Abstract
Background: Calorie restriction (CR) influences aging processes and extends average and maximal life spans. The CALERIE 2 (Comprehensive Assessment of Long-Term Effects of Reducing Intake of Energy Phase 2) study was the first randomized clinical trial to examine the metabolic and psychological effects of CR in nonobese humans.
Objective: We conducted a 2-y follow-up study of adults who underwent 2 y of CR or ad libitum (control) consumption and determined whether weight loss and acquired behaviors persisted after the study ended when participants determined their own lifestyle behaviors.
Design: In this prospective, longitudinal study, we assessed differences in weight, body composition, psychological function, and energy expenditure in 39 nonobese [body mass index (in kg/m2): 22–28] men and women (25% CR: n = 24; control: n = 15) 12 and 24 mo after they completed the CALERIE 2 study at Pennington Biomedical.
Results: Of 39 participants who were in the follow-up study, 29 subjects (CR: n = 18; control: n = 11) completed all visits at follow-up months 12 and 24. After the CR intervention, a mean ± SEM weight loss of 9.0 ± 0.6 kg was observed in the CR group, in which only 54% of the weight was regained 2 y later. Despite such a regain, weight, the percentage of body fat, and fat mass remained significantly reduced from baseline throughout follow-up and remained significantly less than in the control group (P < 0.05). At follow-up, the CR group retained higher degrees of dietary restraint and avoidance of certain foods.
Conclusion: After a 2-y intensive CR intervention, ∼50% of CR-induced weight loss was maintained 2 y later, which was probably the result of lasting effects on acquired behaviors and dietary restraint. This trial was registered at clinicaltrials.gov as NCT00943215.
Keywords: calorie restriction, CALERIE study, diet, energy expenditure, metabolic adaptation, mood, quality of life, weight loss
INTRODUCTION
Calorie restriction (CR),3 which is a dietary intervention that lowers calorie consumption, is the only intervention that has been known to delay both primary aging and secondary aging (1, 2) and to extend average and maximal life spans in many animal models. The list of potential mechanisms by which CR is thought to increase the life span is extensive, yet inconclusive. Of the many hypothesized primary mechanisms, a reduction in metabolic rate (rate of living) that is accompanied by a lower amount of free-radical production and less oxidative damage to DNA, proteins, and lipids has been favored as one of the leading hypotheses (3). Similarly, secondary aging or incidences of age-related diseases such as diabetes, cardiovascular diseases, and some forms of cancers are delayed by CR, probably through alterations in neuroendocrine activities (4, 5). Research in nonhuman primates has suggested that the mortality rate is lower in CR animals than in control animals (6–12). Naturally occurring episodes of CR exist in humans (4, 13–21) and provide important information on changes in biomarkers of aging.
The CALERIE (Comprehensive Assessment of Long-Term Effects of Reducing Intake of Energy) study presents the largest randomized controlled trials to date to have examined both the metabolic and behavioral effects of CR in nonobese humans. The CALERIE phase 1 trial first showed that CR at an amount of 15–25% is safe and feasible in nonobese humans and results in weight loss with improvements in body composition, energy expenditure (EE), hormone concentrations, the lipid profile, and insulin sensitivity (5, 22–27) without triggering eating-disorder symptoms, harmful psychological effects, a reduced quality of life (QOL), or decreased cognitive function (28, 29). The CALERIE Phase 2 (CALERIE 2) multicenter trial randomly assigned 218 nonobese, healthy men and women to a 25% CR diet or an ad libitum (control) diet for 2 y (30). Although the 2-y trial resulted in substantially less CR than the targeted 25% CR (∼12% CR), CR individuals lost on average >10% of weight from baseline to year 1 and basically maintained this weight loss over the second year period (31). The 2-y trial confirmed the presence of a CR-induced metabolic adaptation in total daily EE that was measured with the use of doubly labeled water (DLW); however, resting EE that was adjusted for losses of fat-free and fat masses was only significantly lower in the CR group than in the control group at 1 y (31).
To the best of our knowledge, there has been no follow-up of nonobese humans who were enrolled in CR interventions to test whether CR-induced weight loss and potentially acquired behaviors persist after such an intensive, structured intervention has ended. Therefore, we conducted a 2-y prospective follow-up of individuals who completed the CALERIE 2 trial at Pennington Biomedical. We evaluated whether weight loss, as well as changes in health-related QOL and eating attitudes and behaviors, were maintained over the 2 y after the intensive CR intervention. As a secondary endpoint, we also examined whether the effects of 2 y of CR on 24-h energy expenditure (24hEE) and sleep energy expenditure (SleepEE) (metabolic adaptation) persisted 2 y after the active intervention. We hypothesized that some of the weight loss would be maintained because of the persistence of behavioral changes and despite the maintenance of a metabolic adaptation.
METHODS
Study design
Participants who completed the CALERIE 2 study [clinicaltrials.gov; NCT00427193 (main study), NCT02695511 (ancillary study)] at Pennington Biomedical were invited to participate in a 2-y prospective follow-up study with no intervention (clinicaltrials.gov; NCT00943215). Outcome assessments were performed at 12 and 24 mo after completion of the study [i.e., follow-up at 12 mo (FU12) and follow-up at 24 mo (FU24)]. No intervention services were provided by the CALERIE team during follow-up; only postcard notifications and telephone calls were used to remind participants of their clinic appointments.
At FU12 and FU24, participants were asked to complete a single outpatient visit (that lasted ∼7 h) 14 d before a 26-h inpatient stay. DLW was administered at these visits. Outpatient assessments included body composition, fasting urine collection, and psychological questionnaires. During the inpatient stay, anthropometric measures, vital signs, a fasting blood draw (no data available), and dietary intake were assessed starting at 0630. A 24-h respiratory chamber was then conducted at 0800 to assess EE, and lasted until the following morning. Weight loss and behavioral adaptations were the primary endpoints, whereas 24hEE and SleepEE were secondary endpoints. The study protocol was approved by an institutional review board, and participants provided written informed consent.
Study participants
Of 80 eligible participants who were enrolled at Pennington Biomedical, 65 participants had complete weight measures throughout 2 y of CR and, therefore, were offered participation in the 2-y follow-up study. Of 65 completers, 39 subjects (60%) agreed to enroll in the follow-up study. An extensive presentation of the CALERIE 2 study design, methods, and main results has been previously reported (30–32). Only adherent participants were included within the current per protocol analyses. CR and control participants were considered nonadherent if they had <5% or >5% of weight loss at either month 12 of the 2-y intervention (M12) or month 24 of the 2-y intervention (M24), respectively. The Consolidated Standards of Reporting Trials diagram that summarizes the throughput of participants is provided in Figure 1. No differences in study characteristics existed between the 39 participants who were enrolled in the follow-up and the 26 participants who did not enroll in the follow-up before CR at baseline, M12, or M24.
FIGURE 1.

CALERIE 2 follow-up Consolidated Standards of Reporting Trial diagram. Participant throughput from enrollment (n = 39) to data analysis (n = 29). Analyses were performed on 29 men and women who on the basis of objective criterion (weight change) were determined to be adherent to their assigned treatment groups during the intervention. CALERIE 2, Comprehensive Assessment of Long-Term Effects of Reducing Intake of Energy Phase 2; CR, calorie restriction; FU12, follow-up at 12 mo; FU24, follow-up at 24 mo; M24, month 24 of the 2-y intervention.
Anthropometric measurements and body composition
Weight was measured in the morning after an overnight fast (Scale-Tronix 5200; Scale-Tronix Inc.) while the subject wore a surgical gown, which was subtracted from the total weight. Body composition was measured with the use of dual X-ray absorptiometry (Hologic QDR 4500A; Hologic) and an EchoMRI device (Echo Medical Systems). During follow-up, the Lunar iDXA scanner (Lunar iDXA; General Electric) was used as a backup scanner if we were unable to obtain measurements with the use of the Hologic QDR 4500A or EchoMRI device because of maintenance issues. All 3 body-composition instruments were located in the same temperature-controlled room (24.6°C ± 0.5°C). An effort was made to convert body-composition data to Hologic QDR 4500A data with the use of validated, sex-specific conversion equations when Hologic QDR 4500A data were not available. Specifically, sex-specific equations from the EchoMRI-AH to Hologic QDR 4500A devices were used (33) as well as sex-specific equations from the Lunar iDXA to Hologic QDR 4500A devices (S Heymsfield, W Johnson, unpublished data, 2012; Supplemental Materials). Although converted body-composition measures were reported, concerns related to interinstrument comparisons remained; therefore, the body surface area was further calculated to provide another method of adjusting EE data for body size (34).
Self-report questionnaires
Changes regarding the QOL and sexual function through month 24 have been previously reported in detail (35); the focus of the current analyses was to provide comprehensive data on changes in psychological status through FU24. The Food-Craving Inventory (36) was used as a measure of general food cravings (represented by the total score), and cravings for high fats, sweets, carbohydrates and starches, and fast-food fats. Higher scores reflected increased cravings. The Eating Inventory (37) was used to measure dietary restraint (the intent to restrict food intake), disinhibition (the tendency to overeat), and perceived hunger. Higher scores indicated greater levels of the construct being measured. The Multifactorial Assessment of Eating Disorders Symptoms (MAEDS) (38) was used to assess symptoms that were related to eating disorders with higher values representing greater levels of the construct. The MAEDS was used to assess 6 symptoms that are associated with eating disorders, including depression, the avoidance of forbidden foods, fear of fatness, binge eating, restrictive eating, and purgative behavior. QOL and emotional wellbeing were measured with the Rand Short Form 36 (SF-36) (39), which included 4 measures of mental aspects of QOL (role limitations that were due to emotional problems, vitality, social functioning, and mental health) and 4 measures that assessed physical aspects of QOL (physical functioning, role limitations that were due to physical problems, bodily pain, and general health); higher scores reflected better QOL. The Body Shape Questionnaire–Short Form was used to measure global appearance satisfaction and the perception of feeling fat; higher scores reflected greater body dissatisfaction (40). Mood was assessed with the use of the Beck Depression Inventory II, with higher scores indicating worse mood (41, 42). The Derogatis Interview for Sexual Function–Self-Report was used to assess sex-specific sexual function (43), with higher scores indicative of better sexual function. The ranges of scores on the Derogatis Interview for Sexual Function were as follows: 5–45 (sexual cognition and fantasy, sexual arousal, and sexual behavior and experience), 5–25 (orgasm), 4–28 (sexual drive and relation), and 24–188 (total score).
24hEE in the respiratory chamber
The change in the resting metabolic rate through the 2-y CALERIE intervention has been previously reported (31) with the focus of the current analyses on changes in EE through FU24 as a secondary endpoint. At FU12 and FU24, participants entered the chamber at ∼0800 after an overnight fast for measurements of 24hEE and SleepEE as previously described (44). SleepEE was assessed between 0200 and 0500 for minutes during which activity was <1%, and extrapolated to 24 h. Meals were prepared by the metabolic kitchen and served according to a fixed schedule with breakfast at 0900, lunch at 1330, and dinner at 1900. Chamber meals consisted of 20%, 30%, and 50% from protein, fat, and carbohydrate, respectively. Food intake was administered to ensure an energy balance with individual calorie amounts estimated at FU12 and FU24 visits according to weight with the use of a previously developed equation (45). Intake was adjusted during the day on the basis of the EE of the first 7 h of the chamber measurement (46).
Estimation of physical activity
Although not a primary or secondary endpoint, the physical activity level (PAL) was estimated from total daily energy expenditure (TDEE) with the use of 14-d DLW and the sleeping metabolic rate (SMR) according to 2 different calculations as follows: 1) the PAL (equal to the TDEE divided by the SMR), and 2) the activity-related energy expenditure (AREE) (i.e., the residual value of the regression between the measured TDEE and the measured SMR) (47). Briefly, participants provided 2 urine samples before DLW dosing with labeled water (2.0 g 10% enriched H218O and 0.12 g 99.9% enriched 2H2O/kg estimated total body water from dual X-ray absorptiometry) and 2 samples at 4.5 and 6 h after dosing. Urine samples that were collected at 1.5 and 3 h were discarded. On day 14 after dosing, participants provided 2 additional timed urine samples. Each sample was analyzed for 18O and 2H abundance with the use of isotope ratio mass spectrometry (47). The carbon dioxide production rate was calculated with the use of the equations of Schoeller (48) as modified by Racette et al. (49). Total energy expenditure was calculated by multiplying the carbon dioxide production rate by the energy equivalent of CO2 for a respiratory quotient of 0.86, which corresponded to a diet that was comprised of 30% fat, 55% carbohydrate, and 15% protein.
Statistical analysis
All analyses were performed with the use of SAS version 9.4 software (SAS Institute Inc.). All tests were performed with a significance level of α = 0.05, and P < α signified significance. Changes from baseline (month 0) to M12 and M24 as well as changes from baseline to FU12 and FU24 were assessed with the use of a linear mixed model for repeated measures that was fitted with the change from baseline at M12 through FU24 as the response and contained fixed effects for the treatment group, month, and interaction. All statistical values are reported as means ± SEMs, except for baseline characteristics (means ± SDs). A random-subject effect was included to account for within-subject correlations between measures over time. In the presence of a significant treatment-by-time interaction, 2-sample t tests that were constructed from least-squares means were used to compare overall mean changes for within-group and between-group differences. Four of the psychological variables had very limited variability because of a ceiling effect; thus, descriptive data are provided, and inferential statistics were not conducted (ceiling effects on these measures are common in a healthy population). Metabolic adaptations in 24hEE and SleepEE are expressed as changes in residual values (i.e., the change from baseline in the difference between the measured EE and predicted EE at each time point) (50). The predicted EE at follow-up was calculated via predictive equations that were derived from linear regression models with the use of CALERIE 2 baseline values. With the use of all baseline data from available participants (n = 71), EE was regressed against the body surface area (BSA) (34), age, and sex as model covariates as follows:
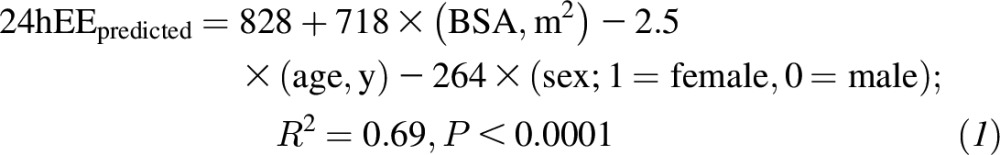 |
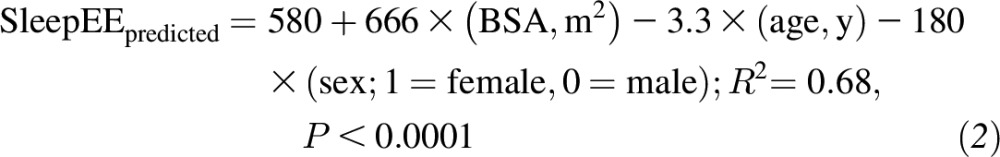 |
The difference in the residual value (follow-up minus baseline values) with adjustment for the baseline residual was used as a value of the extent at which EE was adapted to CR (i.e., a negative value indicated metabolic adaptation) (50).
RESULTS
Study participants
Thirty-nine participants who were adherent to the original intervention (CR: n = 24; control: n = 15 controls) were enrolled in this follow-up study. During follow-up, 6 participants dropped out from the CR group, and 4 participants dropped out from the control group. Twenty-nine subjects [CR: n = 18 (13 women); control: n = 11 (6 women)] of the total 39 enrolled and adherent participants completed assessments at both FU12 and FU24. Demographic characteristics of the 29 completers (Table 1) as well as all measures of body composition and EE were not different from those of the 39 enrolled participants. In addition, a similar ratio of women to men (∼70:30) was reported in the CALERIE 2 study (of 218 subjects who were randomly assigned to the CR and control groups, 153 participants were women) (30).
TABLE 1.
Changes in body composition and EE from baseline in participants who completed the follow-up study1
| Control (n = 11) |
CR (n = 18) |
P-between-group difference |
||||||||||||
| Baseline2 | ΔM12 | ΔM24 | ΔFU12 | ΔFU24 | Baseline2 | ΔM12 | ΔM24 | ΔFU12 | ΔFU24 | ΔM12 | ΔM24 | ΔFU12 | ΔFU24 | |
| Weight, kg | 73.4 ± 7.7 | 0.03 ± 0.7 | 0.4 ± 0.8 | 0.8 ± 1.1 | 1.2 ± 1.2 | 72.4 ± 10.7 | −9.7 ± 0.5* | −9.0 ± 0.6* | −5.1 ± 0.9* | −4.1 ± 1.0* | <0.0001 | <0.0001 | <0.001 | <0.01 |
| BMI, kg/m2 | 25.7 ± 1.1 | 0.03 ± 0.2 | 0.2 ± 0.2 | 0.2 ± 0.4 | 0.4 ± 0.4 | 25.7 ± 1.6 | −3.4 ± 0.2* | −3.2 ± 0.2* | −1.9 ± 0.3* | −1.6 ± 0.3* | <0.0001 | <0.0001 | <0.001 | <0.01 |
| WC, cm | 82.4 ± 6.3 | 1.7 ± 1.2 | 2.4 ± 1.1 | 2.2 ± 1.4 | 2.8 ± 1.6 | 81.2 ± 9.1 | −6.2 ± 0.9 | −6.3 ± 0.9 | −3.6 ± 1.1 | −1.7 ± 1.2 | — | — | — | — |
| Body fat, % | 31.5 ± 7.6 | −0.03 ± 0.5 | 0.6 ± 0.6 | −2.4 ± 0.8* | −1.7 ± 0.9 | 34.1 ± 6.0 | −6.2 ± 0.4* | −5.2 ± 0.4* | −4.9 ± 0.6* | −4.3 ± 0.7* | <0.0001 | <0.0001 | 0.02 | 0.03 |
| FM, kg | 22.8 ± 4.8 | 0.1 ± 0.5 | 0.6 ± 0.5 | −1.7 ± 0.8* | −1.1 ± 0.9 | 24.5 ± 4.8 | −7.1 ± 0.4* | −6.3 ± 0.4* | −4.9 ± 0.6* | −4.2 ± 0.7* | <0.0001 | <0.0001 | <0.01 | 0.01 |
| FFM, kg | 50.6 ± 10.2 | −0.2 ± 0.4 | −0.4 ± 0.4 | 2.4 ± 0.6 | 2.1 ± 0.7 | 47.9 ± 9.6 | −2.6 ± 0.3 | −2.7 ± 0.3 | −0.2 ± 0.5 | 0.1 ± 0.5 | — | — | — | — |
| 24hEE, kcal/d | 1902 ± 228 | −70 ± 28 | −80 ± 26 | −44 ± 36 | −39 ± 46 | 1847 ± 279 | −227 ± 21 | −194 ± 20 | −115 ± 28 | −135 ± 36 | — | — | — | — |
| SleepEE, kcal/d | 1540 ± 195 | 31 ± 32 | −32 ± 29 | −58 ± 31 | −53 ± 39 | 1539 ± 227 | −177 ± 24* | −161 ± 22* | −127 ± 24* | −141 ± 30* | <0.0001 | <0.01 | NS | NS |
Estimates of least-squares means ± SEM changes from baseline are listed for all subsequent study visits. Data are from participants who completed the 24-mo follow-up study. Subjects in the CR group were randomly assigned at baseline (month 0) to receive a 25% CR intervention. *Significant within-group changes from baseline are noted when a significant treatment-by-time interaction was present, P < 0.05. CR, calorie restriction; EE, energy expenditure; FFM, fat-free mass; FM, fat mass; FU12, follow-up at 12 mo; FU24, follow-up at 24 mo; M12, month 12 of the 2-y intervention; M24, month 24 of the 2-y intervention; SleepEE, sleep energy expenditure; WC, waist circumference; 24hEE, 24-h energy expenditure.
Values are raw means ± SDs.
Changes in weight and body composition
The mean weight change from baseline for all CR and control participants who completed the follow-up study are listed in Table 1 and graphed in Figure 2. The CR group achieved a significant weight reduction from baseline at M12, M24, FU12 (all P < 0.0001), and FU24 (P < 0.001). The control group had no significant change in weight throughout the 4-y period (i.e., intervention and follow-up). Between-group differences in weight changes were significant at M12 (−9.7 ± 0.9 kg) and M24 (−9.4 ± 0.9 kg) (both P < 0.0001) and remained significant between treatment groups during follow-up [FU12: −5.9 ± 1.4 kg (P < 0.001); FU24: −5.3 ± 1.5 kg (P < 0.01)]. Of the 9.0 kg of CR-induced weight loss at M24, 54% of the weight was regained but remained significantly reduced from baseline at FU24 (P < 0.001). A significant loss of 6.3 kg in fat mass from baseline was observed in the CR group at M24, 36% of which was regained during follow-up, but there remained a significant reduction from baseline at FU24 (P < 0.0001). Although not significant, a loss of 2.7 kg in fat-free mass from baseline was also observed in the CR group at M24, which returned to the baseline value by FU12. By the end of follow-up (FU24), 27% of fat-free mass that was lost during the intervention was regained.
FIGURE 2.

Mean ± SEM weight achieved throughout the intervention and follow-up of control participants (n = 11) and CR participants (n = 18) who were determined to be adherent during the intervention and completed the follow-up study in full. Two-sample t tests of least-squares means ± SEMs were used from mixed-model repeated measures. A significant weight change from baseline existed between groups at all visits (P < 0.05). *Significant within-group weight change from baseline, P < 0.05. CR, calorie restriction; FU12, follow-up at 12 mo; FU24, follow-up at 24 mo; M0, month 0 of the 2-y intervention (baseline); M12, month 12 of the 2-y intervention; M24, month 24 of the 2-y intervention.
Of 18 participants in the CR group, 11 participants were overweight and 7 participants were normal weight at the start of the original 2-y CR intervention (baseline). At the end of the CR intervention (M24), 8 of the overweight participants achieved normal-weight status, and 4 of these 8 participants still maintained their normal-weight status at the end of follow-up (FU24). All 7 normal-weight participants in the CR group at baseline maintained normal-weight status throughout M24 and FU24.
Psychological functioning
Mean assessments of QOL, eating attitudes and behaviors, and body perception for CR and control participants who completed the follow-up study are listed in Supplemental Table 1.
Eating behavior (Eating Inventory) and food cravings (Food-Craving Inventory)
Cognitive restraint was significantly increased from baseline within the CR group throughout the intervention and follow-up, and differences between CR and control groups existed at M12, M24, and FU24. No difference at FU12 was observed (Figure 3). No differences in disinhibition or hunger changes were observed during follow-up. There were also no changes in any food-craving traits during follow-up.
FIGURE 3.

Mean ± SEM behavioral changes throughout the intervention and follow-up. A comparison is shown of behavioral changes in cognitive restraint (via the EI) and avoidance of forbidden foods (via the MAEDS) between the control group (n = 11) and CR group (n = 18) after M12 and M24 of CR followed by 12 and 24 mo of a self-selected diet. Data presented represent adjusted changes from baseline. Two-sample t tests of least-squares means ± SEMs from mixed-model repeated measures were used. *Significant within-group difference, P < 0.05. *Significant between-group difference, P < 0.05. ‡Significant treatment main effect for the MAEDS indicating that the mean change from baseline across the intervention and follow-up periods was higher in the CR group (CR group: 5.44 ± 1.13; control: −0.72 ± 1.45), P = 0.002. CR, calorie restriction; EI, Eating Inventory; FU12, follow-up at 12 mo; FU24, follow-up at 24 mo; MAEDS, Multifactorial Assessment of Eating Disorders Symptoms; M12, month 12 of the 2-y intervention; M24, month 24 of the 2-y intervention.
Eating disorder symptoms (MAEDS)
Although the binge eating score in the CR group was decreased from baseline at M24 (a significant between-group difference), there were no additional differences in changes in feelings of depression, binge eating, purging, fear of fatness, or restrictive eating that existed within or between CR and control groups during follow-up. No treatment-by-time interaction was present for the change in the avoidance of forbidden food, but a noteworthy significant treatment main effect existed (CR group: 5.44 ± 1.13; control group: −0.72 ± 1.45; P = 0.002) (Figure 3), which indicated that the mean change from baseline across the intervention and follow-up periods was higher in the CR group.
QOL (Rand Short Form 36) and mood (Beck Depression Inventory II)
No differences in changes in physical or mental aspects of QOL were observed within or between CR and control groups during follow-up. Despite a significant improvement in mood in the CR group compared with the control group at M12, there was no within-group or between-group difference in mood during follow-up.
Body Shape Questionnaire–Short Form
Despite a significant improvement in body satisfaction at M12 and M24 in the CR group, which resulted in a significant interaction effect, no within-group or between-group difference was observed during follow-up.
Derogatis Interview for Sexual Function–Self-Report
There was a significant increase in sexual cognition and fantasy in the control group at FU24, but no between-group difference was observed.
Changes in 24hEE and SleepEE
As shown in Table 1, no significant (absolute) changes in 24hEE were observed. Although the (absolute) decrease in SleepEE at M12 and M24 was significantly different between treatment groups, this effect was lost during follow-up. Although not significantly different from controls, SleepEE remained significantly reduced from baseline only in the CR group during follow-up. In addition, no significant treatment-by-time effect was observed for 24hEE or SleepEE for metabolic adaptation. However, there was a significant treatment main effect for SleepEE metabolic adaptation across the 4-y intervention and follow-up (CR group: −91 ± 18 kcal/d; control group: −23 ± 23 kcal/d; P = 0.03).
Estimation of physical activity
An estimate of physical activity was calculated as the PAL (i.e., TDEE divided by the SMR). No difference in the PAL change from baseline was observed between CR and control groups during the active intervention; however, physical activity (via the PAL) significantly increased from M24 to FU12 (0.13 ± 0.06; P = 0.04) and trended toward a significant increase from M24 to FU24 (0.13 ± 0.07; P = 0.08) within the CR group, whereas the PAL trended to increase in the control group only from M24 to FU12 (0.14 ± 0.08; P = 0.07). For a more refined estimation of physical activity, the AREE was calculated via the residual method (47). There was a significant change from baseline in the CR group at FU12 (195 ± 83 kcal/d; P = 0.03) and FU24 (195 ± 84 kcal/d; P = 0.03) and in the control group at FU12 (254 ± 108 kcal/d; P = 0.03). However, a significant increase from M24 was observed at FU12 in the CR group (192 ± 81 kcal/d; P = 0.03). There were no between-group differences in the change in AREE.
DISCUSSION
The current study was a controlled trial that investigated whether nonobese participants would continue to follow dietary and behavioral techniques to sustain some level of CR in the absence of a support team and tested if CR-induced weight loss and acquired behaviors would be maintained after discharge from the study intervention. Indeed, participants in our original study were in energy balance at 12 and 24 mo at reduced dietary intake. Therefore, this follow-up study provides a better understanding of whether CR-induced weight loss can be maintained despite a lower energy demand in the presence of lower body weight (therefore, lower energy intake to maintain the new weight) and in the presence of metabolic adaptation. Our results show, for the first time to our knowledge, that the effect of sustained CR was maintained in the form of weight loss and improved body composition in normal weight and overweight (nonobese) humans who were subjected to 2 y of CR. Also, to our knowledge, the study is the first to show that the expected effects on eating attitudes and behaviors remained for 2 y after the intervention without compromising the QOL. Namely, dietary restraint remained elevated at M24 of follow-up, and the CR group had a higher avoidance of forbidden-food scores throughout the intervention and follow-up period. The relevance of these findings extend previous knowledge on the benefits of self-imposed CR. Specifically, individuals of the Calorie Restriction Society, who are called CRONies (Calorie Restriction with Optimal Nutrition), practice CR as a lifestyle to prolong the life span. Studies on the CRONies have shown the effects of long-term CR (4, 20, 51) and have further showcased the possibility that individuals can successfully practice self-imposed CR for extended periods of time; 7 y to several decades of CR have been reported.
The finding that the CR group retained an increase in restraint over 2 y of follow-up was noteworthy, particularly because hunger did not change differently between the groups during follow-up despite the CR group having suppressed body mass compared with that of the control group. Body satisfaction also improved in the CR group during the 2-y CR regimen but did not differ between groups during follow-up. Furthermore, no differential changes between groups were detected in reported sexual function during follow-up. These eating attitudes and behaviors likely contributed to the CR-induced weight loss and fat loss maintenance over the 24 mo after the CR intervention because cognitive and behavioral efforts (e.g., restraint and avoidance of forbidden foods) are needed to maintain some CR and to avoid a return to baseline weight. Specifically, of the 9.0 kg of CR-induced weight loss observed, only 54% of the weight was regained and remained significantly reduced from the weight at baseline. For comparison, the Diabetes Prevention Program, which was a randomized clinical trial that compared the effect of a lifestyle intervention, metformin, or placebo treatment on the incidence of diabetes, reported that lifestyle group participants lost 7 kg in ≤1 y, which was followed by a gradual weight regain that amounted to ∼70% after 10 y of follow-up (52).
Absolute changes in 24hEE and SleepEE, although decreased to a greater extent in CR individuals throughout the intervention, were not different from control values during follow-up. Nonetheless, SleepEE was still decreased from baseline at both 12 and 24 mo of follow-up in the CR group. Contrary to our hypothesis, a treatment-group difference in the change over time in metabolic adaptation (i.e., a reduction in EE larger than expected for the loss of metabolic mass after weight reduction) was not observed for 24hEE or SleepEE. However, there was a group difference in the overall mean metabolic adaptation that was observed for SleepEE across the 4-y intervention and follow-up.
An important objective during weight loss is the reduction of body fat while minimizing the loss of fat-free mass to maintain optimal metabolic and physical functioning. Within the current study, fat-free mass was somewhat reduced in calorie-restricted individuals during the intervention but returned to baseline values during the follow-up period. The increase in the estimated physical activity from the end of the intervention throughout M12 (as showcased via both the PAL and AREE) may have assisted in the retention or a return of fat-free mass to baseline values.
In conclusion, future research in a larger sample size with a more comprehensive assessment is needed to fully elucidate the maintenance of weight loss and its duration in normal-weight individuals who are engaged in CR. Indeed, a cautious interpretation of our findings that is due to the small sample size and multiple comparisons is important because of risk of false-positive results. However, our results indicate that, 2 y after a 2-y intensive CR intervention, ∼50% of CR-induced weight loss is maintained, probably because of lasting effects on behavior and dietary restraint despite persistent effects on metabolic adaptation.
Acknowledgments
The authors’ responsibilities were as follows—KLM: interpreted the data and wrote the manuscript; LMR: designed the study, conducted the research, interpreted the data, and wrote the manuscript; JHB: analyzed the data and performed the statistical analysis; CKM: conducted the research and wrote the manuscript; ER: designed the study, conducted the research, wrote the manuscript, and had primary responsibility for the final content; and all authors: read and approved the final manuscript before submission. None of the authors reported a conflict of interest related to the study.
Footnotes
Abbreviations used: AREE, activity-related energy expenditure; BSA, body surface area; CALERIE, Comprehensive Assessment of Long-Term Effects of Reducing Intake of Energy; CALERIE 2, Comprehensive Assessment of Long-Term Effects of Reducing Intake of Energy Phase 2; CR, calorie restriction; DLW, doubly labeled water; EE, energy expenditure; FU12, follow-up at 12 mo; FU24, follow-up at 24 mo; MAEDS, Multifactorial Assessment of Eating Disorders Symptoms; M12, month 12 of the 2-y intervention; M24, month 24 of the 2-y intervention; PAL, physical activity level; QOL, quality of life; SleepEE, sleep energy expenditure; SMR, sleeping metabolic rate; TDEE, total daily energy expenditure; 24hEE, 24-h energy expenditure.
REFERENCES
- 1.Holloszy JO, Fontana L. Caloric restriction in humans. Exp Gerontol 2007;42:709–12. [DOI] [PMC free article] [PubMed] [Google Scholar]
- 2.Speakman JR, Mitchell SE. Caloric restriction. Mol Aspects Med 2011;32:159–221. [DOI] [PubMed] [Google Scholar]
- 3.Sacher GA, Duffy PH. Genetic relation of life span to metabolic rate for inbred mouse strains and their hybrids. Fed Proc 1979;238:184–8. [PubMed] [Google Scholar]
- 4.Fontana L, Meyer TE, Klein S, Holloszy JO. Long-term calorie restriction is highly effective in reducing the risk for atherosclerosis in humans. Proc Natl Acad Sci USA 2004;101:6659–63. [DOI] [PMC free article] [PubMed] [Google Scholar]
- 5.Heilbronn LK, de Jonge L, Frisard MI, DeLany JP, Larson-Meyer DE, Rood J, Nguyen T, Martin CK, Volaufova J, Most MM, et al. Effect of 6-month calorie restriction on biomarkers of longevity, metabolic adaptation, and oxidative stress in overweight individuals: a randomized controlled trial. JAMA 2006;295:1539–48. [DOI] [PMC free article] [PubMed] [Google Scholar]
- 6.Bodkin NL, Ortmeyer HK, Hansen BC. Long-term dietary restriction in older-aged rhesus monkeys: effects on insulin resistance. J Gerontol A Biol Sci Med Sci 1995;50:B142–7. [DOI] [PubMed] [Google Scholar]
- 7.Colman RJ, Beasley TM, Kemnitz JW, Johnson SC, Weindruch R, Anderson RM. Caloric restriction reduces age-related and all-cause mortality in rhesus monkeys. Nat Commun 2014;5:3557. [DOI] [PMC free article] [PubMed] [Google Scholar]
- 8.Kemnitz JW, Weindruch R, Roecker EB, Crawford K, Kaufman PL, Ershler WB. Dietary restriction of adult male rhesus monkeys: design, methodology, and preliminary findings from the first year of study. J Gerontol 1993;48:B17–26. [DOI] [PubMed] [Google Scholar]
- 9.Lane MA, Ingram DK, Roth GS. Calorie restriction in nonhuman primates: effects on diabetes and cardiovascular disease risk. Toxicol Sci 1999;52(2 Suppl):41–8. [DOI] [PubMed] [Google Scholar]
- 10.Roth GS, Lane MA, Ingram DK, Mattison JA, Elahi D, Tobin JD, Muller D, Metter EJ. Biomarkers of caloric restriction may predict longevity in humans. Science 2002;297:811. [DOI] [PubMed] [Google Scholar]
- 11.Roth GS, Mattison JA, Ottinger MA, Chachich ME, Lane MA, Ingram DK. Aging in rhesus monkeys: relevance to human health interventions. Science 2004;305:1423–6. [DOI] [PubMed] [Google Scholar]
- 12.Mattison JA, Colman RJ, Beasley TM, Allison DB, Kemnitz JW, Roth GS, Ingram DK, Weindruch R, de Cabo R, Anderson RM. Calorie restriction improves health and survival of rhesus monkeys. Nat Commun 2017;8: 14063. [DOI] [PMC free article] [PubMed] [Google Scholar]
- 13.Kagawa Y. Impact of Westernization on the nutrition of Japanese: changes in physique, cancer, longevity and centenarians. Prev Med 1978;7:205–17. [DOI] [PubMed] [Google Scholar]
- 14.Suzuki M, Wilcox BJ, Wilcox CD. Implications from and for food cultures for cardiovascular disease: longevity. Asia Pac J Clin Nutr 2001;10:165–71. [DOI] [PubMed] [Google Scholar]
- 15.Willcox BJ, Willcox DC, Todoriki H, Fujiyoshi A, Yano K, He Q, Curb JD, Suzuki M. Caloric restriction, the traditional Okinawan diet, and healthy aging: the diet of the world’s longest-lived people and its potential impact on morbidity and life span. Ann N Y Acad Sci 2007;1114:434–55. [DOI] [PubMed] [Google Scholar]
- 16.Vallejo EA. Hunger diet on alternate days in the nutrition of the aged. Prensa Med Argent 1957;44:119–20. [PubMed] [Google Scholar]
- 17.Stunkard AJ. Nutrition, aging and obesity: a critical review of a complex relationship. Int J Obes 1983;7:201–20. [PubMed] [Google Scholar]
- 18.Weyer C, Walford RL, Harper IT, Milner M, MacCallum T, Tataranni PA, Ravussin E. Energy metabolism after 2 y of energy restriction: the biosphere 2 experiment. Am J Clin Nutr 2000;72:946–53. [DOI] [PubMed] [Google Scholar]
- 19.Walford RL, Mock D, Verdery R, MacCallum T. Calorie restriction in biosphere 2: alterations in physiologic, hematologic, hormonal, and biochemical parameters in humans restricted for a 2-year period. J Gerontol A Biol Sci Med Sci 2002;57:B211–24. [DOI] [PubMed] [Google Scholar]
- 20.Fontana L, Klein S, Holloszy JO, Premachandra BN. Effect of long-term calorie restriction with adequate protein and micronutrients on thyroid hormones. J Clin Endocrinol Metab 2006;91:3232–5. [DOI] [PubMed] [Google Scholar]
- 21.Fontana L, Weiss EP, Villareal DT, Klein S, Holloszy JO. Long-term effects of calorie or protein restriction on serum IGF-1 and IGFBP-3 concentration in humans. Aging Cell 2008;7:681–7. [DOI] [PMC free article] [PubMed] [Google Scholar]
- 22.Das SK, Gilhooly CH, Golden JK, Pittas AG, Fuss PJ, Cheatham RA, Tyler S, Tsay M, McCrory MA, Lichtenstein AH, et al. Long-term effects of 2 energy-restricted diets differing in glycemic load on dietary adherence, body composition, and metabolism in CALERIE: a 1-y randomized controlled trial. Am J Clin Nutr 2007;85:1023–30. [DOI] [PubMed] [Google Scholar]
- 23.Larson-Meyer DE, Heilbronn LK, Redman LM, Newcomer BR, Frisard MI, Anton S, Smith SR, Alfonso A, Ravussin E. Effect of calorie restriction with or without exercise on insulin sensitivity, beta-cell function, fat cell size, and ectopic lipid in overweight subjects. Diabetes Care 2006;29:1337–44. [DOI] [PMC free article] [PubMed] [Google Scholar]
- 24.Lefevre M, Redman LM, Heilbronn LK, Smith JV, Martin CK, Rood JC, Greenway FL, Williamson DA, Smith SR, Ravussin E, et al. Caloric restriction alone and with exercise improves CVD risk in healthy non-obese individuals. Atherosclerosis 2009;203:206–13. [DOI] [PMC free article] [PubMed] [Google Scholar]
- 25.Racette SB, Weiss EP, Villareal DT, Arif H, Steger-May K, Schechtman KB, Fontana L, Klein S, Holloszy JO, Washington University School of Medicine CALERIE Group. One year of caloric restriction in humans: feasibility and effects on body composition and abdominal adipose tissue. J Gerontol A Biol Sci Med Sci 2006;61:943–50. [DOI] [PMC free article] [PubMed] [Google Scholar]
- 26.Redman LM, Heilbronn LK, Martin CK, Alfonso A, Smith SR, Ravussin E, Pennington CT. Effect of calorie restriction with or without exercise on body composition and fat distribution. J Clin Endocrinol Metab 2007;92:865–72. [DOI] [PMC free article] [PubMed] [Google Scholar]
- 27.Weiss EP, Racette SB, Villareal DT, Fontana L, Steger-May K, Schechtman KB, Klein S, Holloszy JO, Washington University School of Medicine CALERIE Group. Improvements in glucose tolerance and insulin action induced by increasing energy expenditure or decreasing energy intake: a randomized controlled trial. Am J Clin Nutr 2006;84:1033–42. [DOI] [PMC free article] [PubMed] [Google Scholar]
- 28.Martin CK, Anton SD, Han H, York-Crowe E, Redman LM, Ravussin E, Williamson DA. Examination of cognitive function during six months of calorie restriction: results of a randomized controlled trial. Rejuvenation Res 2007;10:179–90. [DOI] [PMC free article] [PubMed] [Google Scholar]
- 29.Williamson DA, Martin CK, Anton SD, York-Crowe E, Han H, Redman L, Ravussin E, Pennington CT. Is caloric restriction associated with development of eating-disorder symptoms? Results from the CALERIE trial. Health Psychol 2008;27(1 Suppl):S32–42. [DOI] [PubMed] [Google Scholar]
- 30.Stewart TM, Bhapkar M, Das S, Galan K, Martin CK, McAdams L, Pieper C, Redman L, Roberts S, Stein RI, et al. Comprehensive assessment of long-term effects of reducing intake of energy phase 2 (CALERIE phase 2) screening and recruitment: methods and results. Contemp Clin Trials 2013;34:10–20. [DOI] [PMC free article] [PubMed] [Google Scholar]
- 31.Ravussin E, Redman LM, Rochon J, Das SK, Fontana L, Kraus WE, Romashkan S, Williamson DA, Meydani SN, Villareal DT, et al. A 2-year randomized controlled trial of human caloric restriction: feasibility and effects on predictors of health span and longevity. J Gerontol A Biol Sci Med Sci 2015;70:1097–104. [DOI] [PMC free article] [PubMed] [Google Scholar]
- 32.Rochon J, Bales CW, Ravussin E, Redman LM, Holloszy JO, Racette SB, Roberts SB, Das SK, Romashkan S, Galan KM, et al. Design and conduct of the CALERIE study: comprehensive assessment of the long-term effects of reducing intake of energy. J Gerontol A Biol Sci Med Sci 2011;66:97–108. [DOI] [PMC free article] [PubMed] [Google Scholar]
- 33.Galgani JE, Smith SR, Ravussin E. Assessment of EchoMRI-AH versus dual-energy X-ray absorptiometry to measure human body composition. Int J Obes 2011;35:1241–6. [DOI] [PMC free article] [PubMed] [Google Scholar]
- 34.DuBois D, DuBois EF. A formula to estimate the approximate surface area if height and weight be known. Arch Intern Med (Chic) 1916;17:863–71. [Google Scholar]
- 35.Martin CK, Bhapkar M, Pittas AG, Pieper CF, Das SK, Williamson DA, Scott T, Redman LM, Stein R, Gilhooly CH, et al. Effect of calorie restriction on mood, quality of life, sleep, and sexual function in healthy nonobese adults: the CALERIE 2 randomized clinical trial. JAMA Intern Med 2016;176:743–52. [DOI] [PMC free article] [PubMed] [Google Scholar]
- 36.White MA, Whisenhunt BL, Williamson DA, Greenway FL, Netemeyer RG. Development and validation of the food-craving inventory. Obes Res 2002;10:107–14. [DOI] [PubMed] [Google Scholar]
- 37.Stunkard AJ, Messick S. The eating inventory. San Antonio (TX): Psychological Corp.; 1988. [Google Scholar]
- 38.Anderson DA, Williamson DA, Duchmann EG, Gleaves DH, Barbin JM. Development and validation of a multifactorial treatment outcome measure for eating disorders. Assessment 1999;6:7–20. [DOI] [PubMed] [Google Scholar]
- 39.Ware JEKM, Gandek B. SF-36 health survey: manual and interpretation guide. Lincoln (RI): Quality Metric Inc.; 1993, 2002. [Google Scholar]
- 40.Cooper PJ, Taylor MJ, Cooper Z, Fairburn CG. The development and validation of the body shape questionnaire. Int J Eat Disord 1987;6:485–94. [Google Scholar]
- 41.Beck ATBG, Steer RA. Beck Depression Inventory-II. San Antonio (TX): Psychological Corporation; 1996. [Google Scholar]
- 42.McNair DMHJ. Profile of mood states: technical update. North Tonawanda (NY): Multi-Health Systems; 2003. [Google Scholar]
- 43.Derogatis LR. The Derogatis Interview for Sexual Functioning (DISF/DISF-SR): an introductory report. J Sex Marital Ther 1997;23:291–304. [DOI] [PubMed] [Google Scholar]
- 44.Lam YY, Redman LM, Smith SR, Bray GA, Greenway FL, Johannsen D, Ravussin E. Determinants of sedentary 24-h energy expenditure: equations for energy prescription and adjustment in a respiratory chamber. Am J Clin Nutr 2014;99:834–42. [DOI] [PMC free article] [PubMed] [Google Scholar]
- 45.Rising R, Harper IT, Fontvielle AM, Ferraro RT, Spraul M, Ravussin E. Determinants of total daily energy expenditure: variability in physical activity. Am J Clin Nutr 1994;59:800–4. [DOI] [PubMed] [Google Scholar]
- 46.de Jonge L, Nguyen T, Smith SR, Zachwieja JJ, Roy HJ, Bray GA. Prediction of energy expenditure in a whole body indirect calorimeter at both low and high levels of physical activity. Int J Obes Relat Metab Disord 2001;25:929–34. [DOI] [PubMed] [Google Scholar]
- 47.Redman LM, Heilbronn LK, Martin CK, Jonge L, Williamson DA, Delany JP, Ravussin E. Metabolic and behavioral compensations in response to caloric restriction: implications for the maintenance of weight loss. PLoS One 2009;4:e4377. [DOI] [PMC free article] [PubMed] [Google Scholar]
- 48.Schoeller DA. Measurement of energy expenditure in free-living humans by using doubly labeled water. J Nutr 1988;118:1278–89. [DOI] [PubMed] [Google Scholar]
- 49.Racette SB, Schoeller DA, Luke AH, Shay K, Hnilicka J, Kushner RF. Relative dilution spaces of 2H- and 18O-labeled water in humans. Am J Physiol 1994;267:E585–90. [DOI] [PubMed] [Google Scholar]
- 50.Galgani JE, Santos JL. Insights about weight loss-induced metabolic adaptation. Obesity (Silver Spring) 2016;24:277–8. [DOI] [PubMed] [Google Scholar]
- 51.Cangemi R, Friedmann AJ, Holloszy JO, Fontana L. Long-term effects of calorie restriction on serum sex-hormone concentrations in men. Aging Cell 2010;9:236–42. [DOI] [PMC free article] [PubMed] [Google Scholar]
- 52.Knowler WC, Fowler SE, Hamman RF, Christophi CA, Hoffman HJ, Brenneman AT, Brown-Friday JO, Goldberg R, Venditti E, Nathan DM. 10-year follow-up of diabetes incidence and weight loss in the Diabetes Prevention Program Outcomes Study. Lancet 2009;374:1677–86. [DOI] [PMC free article] [PubMed] [Google Scholar]