Summary
Background
Reduction of premature mortality is a UN Sustainable Development Goal. Unlike other high-income countries, age-adjusted mortality in the USA plateaued in 2010 and increased slightly in 2015, possibly because of rising premature mortality. We aimed to analyse trends in mortality in the USA between 1999 and 2014 in people aged 25–64 years by age group, sex, and race and ethnicity, and to identify specific causes of death underlying the temporal trends.
Methods
For this analysis, we used cause-of-death and demographic data from death certificates from the US National Center for Health Statistics, and population estimates from the US Census Bureau. We estimated annual percentage changes in mortality using age-period-cohort models. Age-standardised excess deaths were estimated for 2000 to 2014 as observed deaths minus expected deaths (estimated from 1999 mortality rates).
Findings
Between 1999 and 2014, premature mortality increased in white individuals and in American Indians and Alaska Natives. Increases were highest in women and those aged 25–30 years. Among 30-year-olds, annual mortality increases were 2·3% (95% CI 2·1–2·4) for white women, 0·6% (0·5–0·7) for white men, and 4·3% (3·5–5·0) and 1·9% (1·3–2·5), respectively, for American Indian and Alaska Native women and men. These increases were mainly attributable to accidental deaths (primarily drug poisonings), chronic liver disease and cirrhosis, and suicide. Among individuals aged 25–49 years, an estimated 111 000 excess premature deaths occurred in white individuals and 6600 in American Indians and Alaska Natives during 2000–14. By contrast, premature mortality decreased substantially across all age groups in Hispanic individuals (up to 3·2% per year), black individuals (up to 3·9% per year), and Asians and Pacific Islanders (up to 2·6% per year), mainly because of declines in HIV, cancer, and heart disease deaths, resulting in an estimated 112 000 fewer deaths in Hispanic individuals, 311 000 fewer deaths in black individuals, and 34 000 fewer deaths in Asians and Pacific Islanders aged 25–64 years. During 2011–14, American Indians and Alaska Natives had the highest premature mortality, followed by black individuals.
Interpretation
Important public health successes, including HIV treatment and smoking cessation, have contributed to declining premature mortality in Hispanic individuals, black individuals, and Asians and Pacific Islanders. However, this progress has largely been negated in young and middle-aged (25–49 years) white individuals, and American Indians and Alaska Natives, primarily because of potentially avoidable causes such as drug poisonings, suicide, and chronic liver disease and cirrhosis. The magnitude of annual mortality increases in the USA is extremely unusual in high-income countries, and a rapid public health response is needed to avert further premature deaths.
Funding
US National Cancer Institute Intramural Research Program.
Introduction
Reduction of premature mortality, a major public health focus, is one of the UN Sustainable Development Goals.1 Indeed, tobacco control and prevention and treatment of cardiovascular and other chronic diseases have substantially and consistently reduced premature mortality,2 and increased lifespan in the USA and many other countries over the past 40 years.1
However, a 2015 report3 highlighted a surprising increase (0·5% per year) in premature mortality in middle-aged white individuals (45–54 years old) between 1999 and 2013 in the USA, which is in stark contrast with sustained declines in other developed countries and in the US black and Hispanic population. This increase was primarily attributed to deaths from drug and alcohol poisonings and suicide.3 Furthermore, age-adjusted mortality for the total US population plateaued in 2010 and increased slightly in 2015,2,4 and mortality in black individuals and American Indians and Alaska Natives remain higher than that in white individuals.5
In this study, we aimed to comprehensively analyse trends in premature mortality in the USA from 1999 to 2014 by age, sex, and race and ethnicity, and to identify the causes of death responsible for increases and declines in premature mortality to highlight health disparities and priorities for intervention.
Research in context.
Evidence before this study
Declines in overall age-adjusted mortality have been reported in the past several decades in the USA. However, premature mortality was noted to have increased in non-Hispanic white individuals aged 45–54 years between 1999 and 2013 (0·5% per year), which contrasts with sustained declines in other developed countries. These increases were largely driven by increasing mortality due to accidental poisonings, suicide, and chronic liver disease and cirrhosis, and reports from the US Centers for Disease Control and Prevention have also shown increasing mortality caused by opioid overdoses in 2000–14.
Added value of this study
In this study, we systematically assessed and compared premature mortality for major causes of death by sex, and race and ethnicity to identify reasons for increases and declines in mortality, as well as to set priorities for intervention. By contrast with previous studies of mortality in the USA, we used age-period-cohort models, highlighted both increases and decreases in mortality, and included analyses specific to American Indians and Alaska Natives and to Asians and Pacific Islanders, two important racial groups with divergent mortality trends that are often excluded from studies of mortality in the USA.
Implications of all the available evidence
Premature mortality trends in the USA are divergent, with substantial disparities by race and ethnicity. Although considerable success has been achieved in the prevention of deaths caused by most chronic and infectious diseases, and in the reduction of premature mortality in Hispanic individuals, black individuals, and Asians and Pacific Islanders, notable increases in mortality have occurred in young and middle-aged white individuals, and American Indians and Alaska Natives. Aggressive efforts to prevent premature deaths in the USA are urgently needed, by targeting emerging causes of death— primarily drug poisonings, suicide, and chronic liver disease and cirrhosis—in addition to continued efforts in prevention and treatment of cancer and heart disease.
Methods
Data source
For this analysis, we obtained US mortality data for 1999–2014 using cause-of-death and demographic data from death certificates from the US National Center for Health Statistics, Centers for Disease Control and Prevention (CDC). Cause of death was assigned according to International Classification of Diseases, Tenth Revision (ICD-10), and categorised by the Surveillance, Epidemiology, and End Results (SEER) Cause of Death Recode (appendix p 4). Population estimates were provided by the US Census Bureau. For comparison, we abstracted mortality data for Canada from Statistics Canada6 and for England and Wales from the UK’s Office for National Statistics.7 All analyses were restricted to individuals aged 25–64 years to focus on premature death and to expand on previous analyses of mid-life mortality.3 Estimates for American Indians and Alaska Natives were restricted to counties in Contract Health Services Delivery Areas to reduce racial misclassification.8
Data analysis
We estimated age-adjusted mortality (standardised to the US population in 2000) by calendar period (1999–2002, 2003–06, 2007–10, and 2011–14), age group (25–39 years, 40–49 years, and 50–64 years), sex, and race and ethnicity (non-Hispanic white individuals [63·7% of 2010 population], Hispanic individuals [16·3%], non-Hispanic black individuals [12·2%], Asians and Pacific Islanders [4·8%], and American Indians and Alaska Natives [0·7%]). To identify causes of death contributing to changes in all-cause mortality, we estimated the absolute difference in age-adjusted cause-specific mortality between 2011–14 and 1999–2002 by age group, sex, and race and ethnicity. We also estimated age-adjusted rate ratios comparing mortality in 2011–14 with that in 1999–2002. Excess age-standardised deaths in 2000–14 were estimated as sum of the observed number of deaths minus the expected number of deaths in each year. Expected deaths were estimated by applying mortality in 1999 to the population of each subsequent year in 5 year age groups. Thus, absolute changes in death rates for 2000–14 are relative to what would have been expected if death rates in 1999 had persisted. For American Indians and Alaska Natives, observed and expected deaths were estimated by applying death rates from Contract Health Services Delivery Areas to the full US American Indian and Alaska Native population.
Among individuals aged 25–49 years, we further stratified accidental deaths into the following subgroups: motor vehicle accidents, other transport accidents, accidental poisoning or exposure to noxious substances, and other non-transport accidents (see appendix p 29 for ICD-10 codes). Additionally, to examine the influence of accidental deaths on geographical heterogeneity in mortality, we calculated age-adjusted all-cause and accidental mortality for the time periods 2011–14 and 1999–2002 by state in white individuals aged 25–49 years (data too sparse for other racial and ethnic groups). SEER*Stat, version 8.3.2, was used for analysis.
We estimated annual percentage changes in mortality and cohort relative risks using age-period-cohort models (appendix p 2) to separate the overall trend into age effects, reflecting natural history; period effects, representing environmental effects on all age groups; and cohort effects, capturing differential risk across birth cohorts.9 We examined 1 year age intervals (25–64 years) and calendar period intervals (1999–2014), which included 55 partially overlapping birth cohorts from 1935–89. Analyses were done with the R program, version 3.1.2 (R Core, 2014).10
Role of the funding source
The funder of the study reviewed the final version of the manuscript but had no role in study design, data collection, data analysis, data interpretation, or writing of the report. MSS and PC had full access to the data. MSS was responsible for the decision to submit for publication.
Results
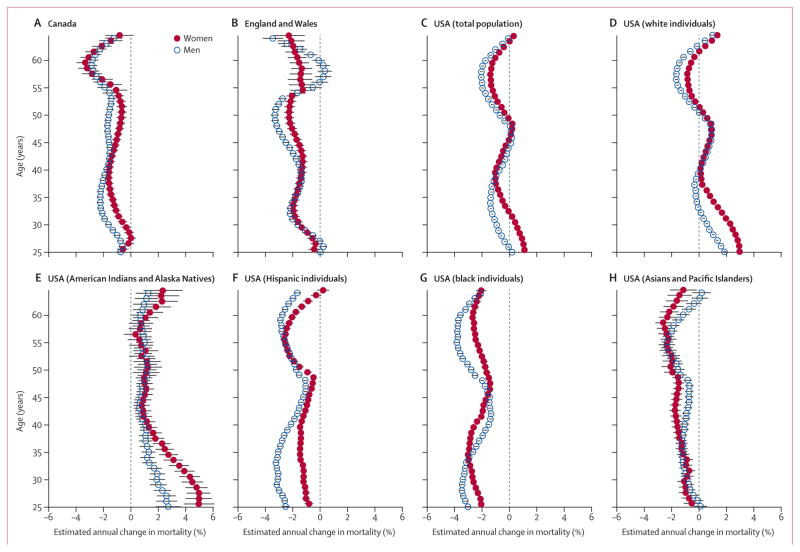
Between 1999 and 2014, premature mortality in Canada and in England and Wales declined by up to 3% per year in both men and women across nearly all age groups (figure 1A, B; appendix p 2). By contrast, in the USA, premature mortality decreased for some age groups but increased for others—notably, women aged 25–31 years (figure 1C). Among white individuals, mortality increased in men aged 25–32 years, 40–49 years, and 63–64 years and in women aged 25–38 years, 40–50 years, and 62–64 years (figure 1D). Premature mortality also increased significantly for American Indians and Alaska Natives across most ages (figure 1E). The largest increases in white individuals and in American Indians and Alaska Natives were seen in those aged 25–30 years, particularly in women. For example, among 25-year-olds, annual mortality increases were 3·0% (95% CI 2·8–3·1) for white women, 1·9% (1·7–2·0) for white men, and 5·0% (3·9–6·1) for women and 2·7% (1·8–3·6) for men among American Indians and Alaska Natives. Among 30-year-olds, annual mortality increases were 2·3% (2·1–2·4) for white women, 0·6% (0·5–0·7) for white men, and 4·3% (3·5–5·0) for women and 1·9% (1·3–2·5) for men among American Indians and Alaska Natives. By contrast, premature mortality declined substantially across all age groups in Hispanic individuals (up to 3·2% per year), black individuals (up to 3·9% per year), and Asians and Pacific Islanders (up to 2·6% per year; figure 1F–H). Mortality also declined with each subsequent birth cohort since the late 1930s for these groups, consistent with trends in Canada and in England and Wales. However, mortality increased for each subsequent birth cohort since 1948 in American Indian and Alaska Native men and women, for each post-1970 birth cohort in white women and men, and for the 1950–62 birth cohorts for white women (appendix pp 31, 32).
Figure 1. Estimated annual percentage change in all-cause mortality by age and sex in (A) Canada, (B) England and Wales, (C) the USA, and (D–H) various racial and ethnic groups in the USA, 1999–2014.
Error bars represent 95% CIs.
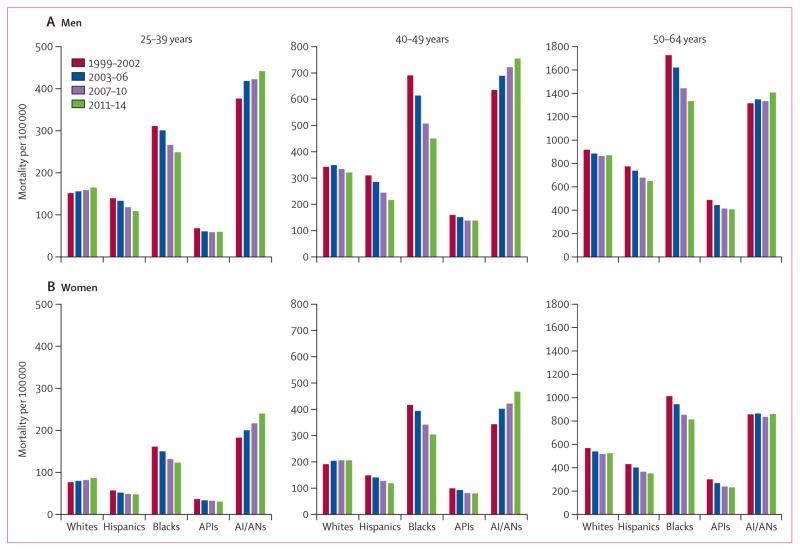
In 2011–14, American Indians and Alaska Natives had the highest mortality across age groups, followed by black individuals (figure 2). Asians and Pacific Islanders had the lowest premature mortality across all age groups (figure 2; appendix pp 10–11).
Figure 2. Age-standardised mortality by calendar period, stratified by age group and race and ethnicity in (A) men and (B) women, 1999–2014.
AI/ANs=American Indians and Alaska Natives. APIs=Asians and Pacific Islanders.
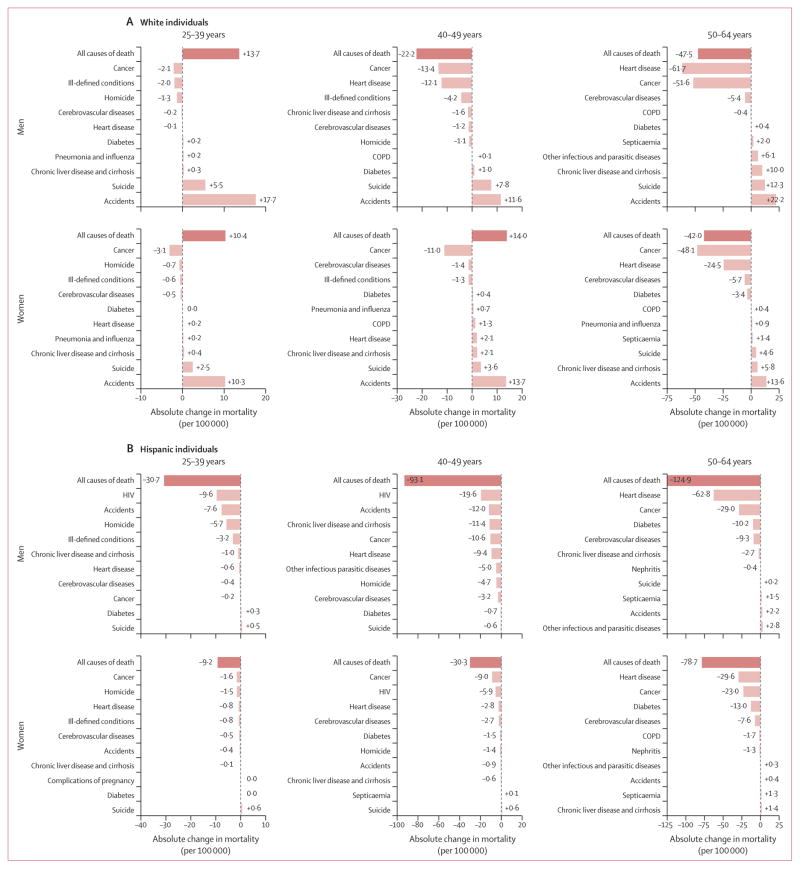
Figures 3–5 show absolute changes in mortality from 1999–2002 to 2011–14 for the ten most common causes of death in 2011–14 in each subgroup (full data in appendix pp 13–28). Among white individuals, mortality increased in 25–39-year-old men and women and in 40–49-year-old women from 1999–2002 to 2011–14 (figure 3A; appendix pp 13–16). In those aged 25–49 years, these increases resulted in an estimated 47 000 excess deaths in men and 64 000 excess deaths in women during 2000–14. Mortality due to accidental deaths and suicide increased in all age groups and both sexes, and contributed strongly to the increases in excess premature deaths. Decreases in all-cause mortality for 50–64-year-old men and women were largely driven by declines in mortality caused by cancer and heart disease (figure 3A), resulting in a reduction of 175 000 deaths in white men and 135 000 deaths in women during 2000–14.
Figure 3. Absolute change in all-cause and cause-specific age-standardised mortality in (A) white individuals and (B) Hispanic individuals, by sex and age group, 2011–14 vs 1999–2002.
Absolute changes in mortality for the ten most common causes of death in 2011–14 are shown for each subgroup. COPD=chronic obstructive pulmonary disease.
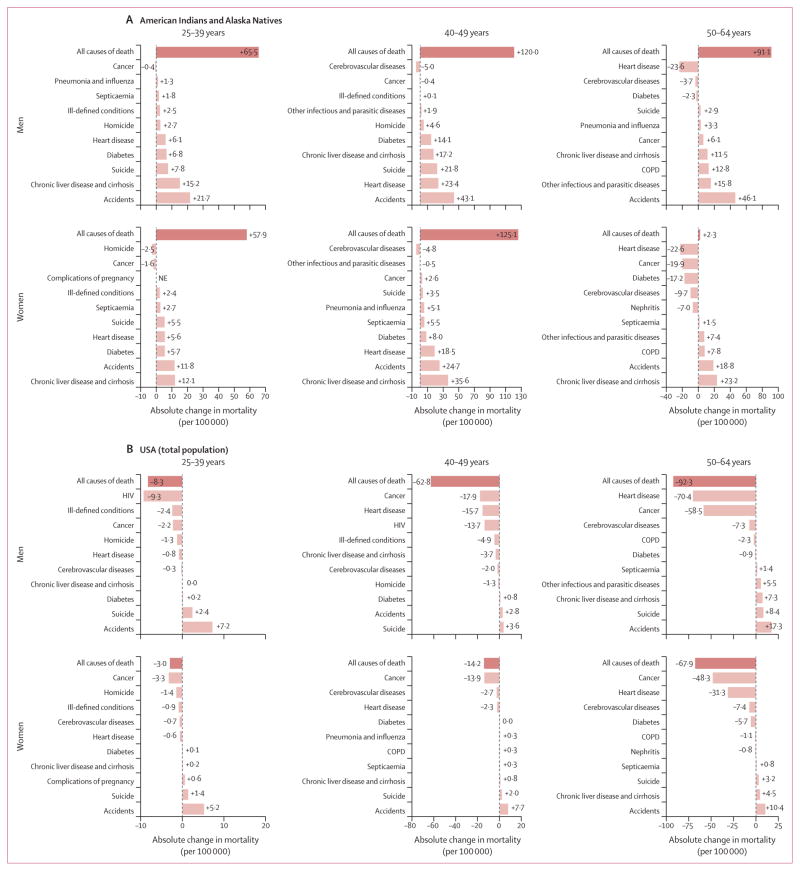
Figure 5. Absolute change in all-cause and cause-specific age-standardised mortality in (A) American Indians and Alaska Natives and (B) the total US population, by sex and age group, 2011–14 vs 1999–2002.
Absolute changes in mortality for the ten most common causes of death in 2011–14 are shown for each subgroup. COPD=chronic obstructive pulmonary disease. NE=not estimable.
For Hispanic individuals, the largest declines in premature mortality for both men and women in all age groups were for HIV deaths in 25–39-year-old and 40–49-year-old men, reductions in cancer deaths in 25–39-year-old and 40–49-year-old women, and decreases in heart disease deaths in 50–64-year-old men and women (figure 3B; appendix pp 16–18). Mortality declines in Hispanic individuals aged 25–64 years translated to a substantial reduction in deaths (76 000 fewer deaths in men and 36 000 fewer deaths in women) during 2000–14.
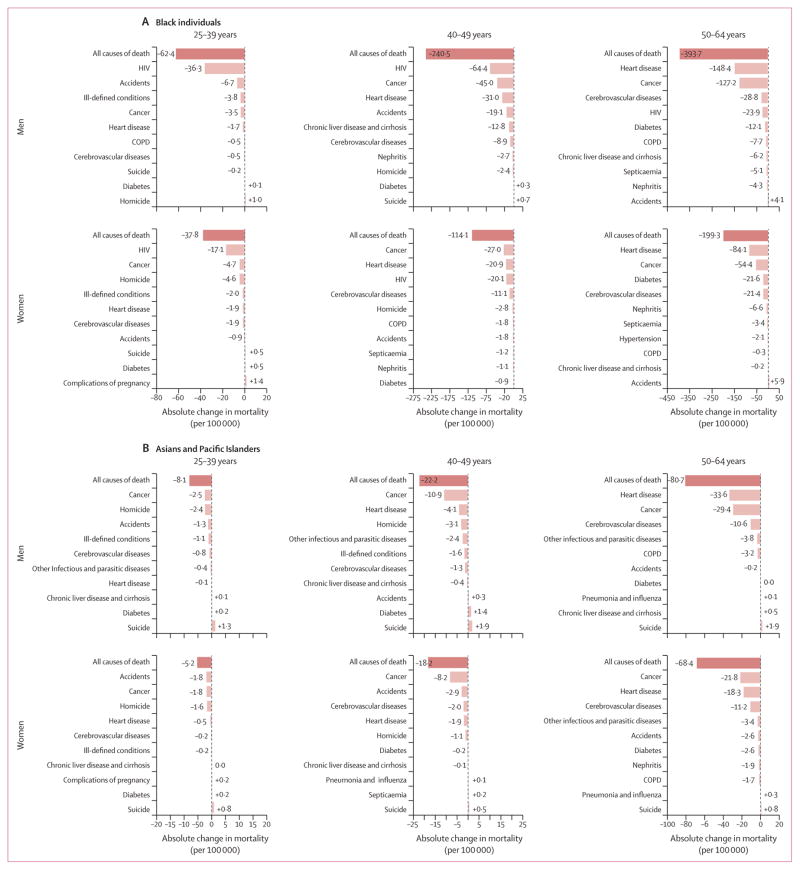
Black individuals had the largest absolute declines in premature mortality, with the largest reductions observed for HIV deaths in 25–39-year-old and 40–49-year-old men and in 25–39-year-old women, declines in cancer deaths in 40–49-year-old women, and decreases in heart disease deaths in 50–64-year-old men and women (figure 4A; appendix pp 18–22). In those aged 25–64 years, 202 000 deaths in men and 108 000 deaths in women were averted during 2000–14. However, mortality in both black men and women remains 1·5 times higher than that in white individuals in 2011–14 (figure 2).
Figure 4. Absolute change in all-cause and cause-specific age-standardised mortality in (A) black individuals and (B) Asians and Pacific Islanders, by sex and age group, 2011–14 vs 1999–2002.
Absolute changes in mortality for the ten most common causes of death in 2011–14 are shown for each subgroup. COPD=chronic obstructive pulmonary disease.
In Asians and Pacific Islanders, mortality decreased in both sexes, all three age groups, and most causes of death (figure 4B; appendix pp 22–25). The largest declines were in cancer deaths in 25–39-year-old and 40–49-year-old men and in 40–49-year-old and 50–64-year-old women, accidental deaths in 25–39-year-old women, and heart disease deaths in 50–64-year-old men. Among those aged 25–64 years, mortality reductions during 2000–14 resulted in 17 000 fewer deaths in men and 17 000 fewer deaths in women.
For American Indians and Alaska Natives, large increases in mortality were seen in all age groups, except for 50–64-year-old women (figure 5A; appendix pp 25–28). Death rates in individuals aged 25–49 years increased for most major causes of death, resulting in an estimated 3000 excess premature deaths in men and 3600 such deaths in women during 2000–14. In individuals aged 50–64 years, 2200 excess deaths occurred in men, whereas 700 fewer deaths than expected occurred in women. The greatest absolute increases in mortality were due to accidents in men and chronic liver disease and cirrhosis in women across all age groups. By contrast with most other racial and ethnic groups, decreases in heart disease mortality were not observed in American Indians and Alaska Natives aged 25–49 years.
Across all racial and ethnic groups combined, overall premature mortality in the USA was lower in 2011–14 (326·3 per 100 000) than in 1999–2002 (362·5 per 100 000) in all three age groups and both sexes (figure 5B), mainly because of declines in cancer, heart disease, and HIV deaths. However, mortality due to suicide and accidents increased across all age groups for men and women.
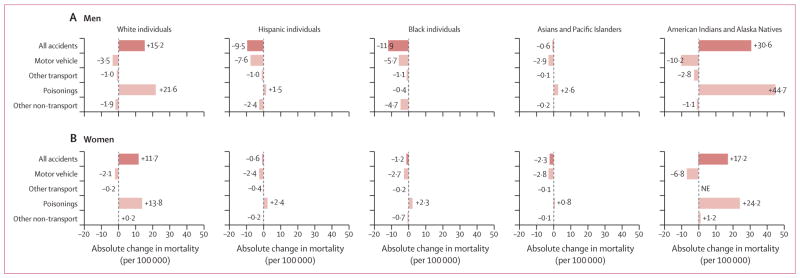
Unintentional poisoning deaths were the main factor contributing to increases in accidental death rates in white individuals and in American Indians and Alaska Natives (figure 6). From 1999–2002 to 2011–14, age-adjusted mortality for accidental poisoning deaths for 25–49-year-olds rose among men and women in these two racial and ethnic groups. Smaller increases also occurred in Hispanic and Asian and Pacific Islander men, and in Hispanic, black, and Asian and Pacific Islander women. Absolute accidental poisoning mortality was highest in American Indian and Alaska Native men (64·1 deaths per 100 000) and women (35·8 per 100 000), and in white men (35·6 per 100 000) and women (19·4 per 100 000; appendix p 33). Most poisoning deaths across racial and ethnic groups were caused specifically by drug poisonings (ie, overdoses), ranging from 68% in American Indians and Alaska Natives to 95% in white individuals in 2011–14. By contrast, mortality due to motor vehicle accidents declined in all groups.
Figure 6. Absolute change in age-standardised mortality for accidental deaths in individuals aged 25–49 years, by cause of death, sex, and race and ethnicity, 2011–14 vs 1999–2002.
NE=not estimable.
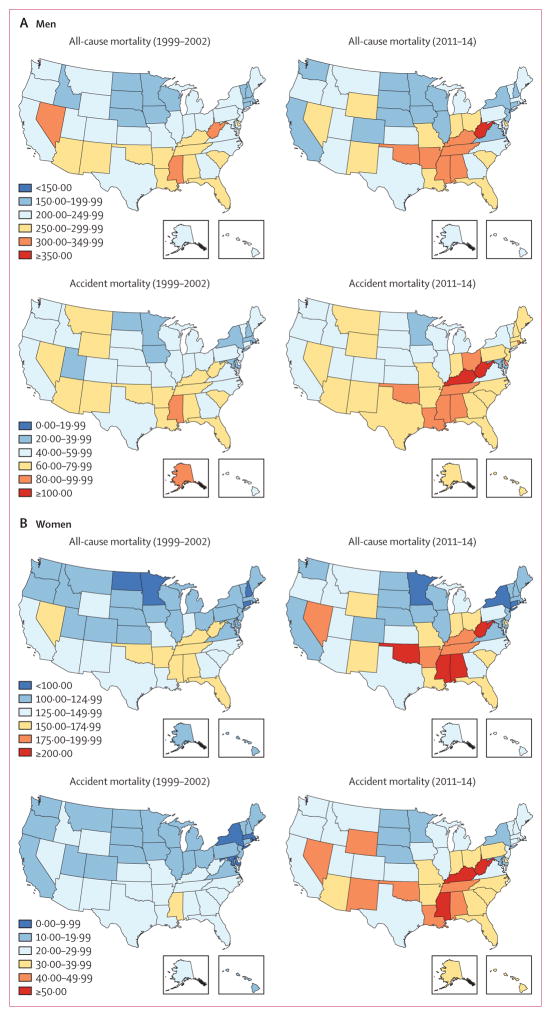
In white individuals aged 25–49 years, state-specific rates of all-cause and accidental death varied considerably across the USA. In 2011–14, West Virginia had the highest all-cause mortality (380·8 per 100 000 in men and 229·7 per 100 000 in women) and accidental mortality (137·9 per 100 000 in men and 64·3 per 100 000 in women; figure 7). Kentucky had the second highest accidental mortality in men (107·0 per 100 000) and women (53·0 per 100 000), and all-cause mortality in men (338·2 per 100 000), and Alabama had the second highest all-cause mortality in women (209·2 per 100 000). In 2011–14, Washington, DC, had the lowest all-cause mortality (72·2 per 100 000 in men and 48·9 per 100 000 in women) and accidental mortality (16·9 per 100 000 in men and 6·9 per 100 000 in women). Compared with 1999–2002, all-cause mortality increased in 43 states among women and 30 states among men, and accidental death rates increased in 50 states among women and 48 states among men.
Figure 7. Age-standardised all-cause and accidental mortality in white men and women aged 25–49 years, by US state, 1999–2002 and 2011–14.
Mortality scales are different by sex and between all-cause and accidental deaths.
Discussion
Widespread medical and public health advances have reduced premature mortality in the USA and worldwide. Indeed, our findings show that mortality due to major chronic diseases has decreased in the USA since 1999, and overall premature mortality has declined for Hispanic individuals, black individuals, and Asians and Pacific Islanders, similar to overall trends in Canada and England and Wales. By contrast, increases in premature mortality in the early 21st century occurred in multiple age groups in white men and women and in all age groups examined in American Indians and Alaska Natives. Increasing rates of accidental deaths, primarily resulting from drug poisonings, and suicide have largely negated the substantial progress achieved in prevention of premature death from heart disease, cancer, and HIV.
In 2015, Norheim and colleagues1 concluded that a 40% reduction of premature mortality before age 70 years—a UN Sustainable Development Goal for 2016–30—will be feasible with a primary focus on prevention of non-communicable diseases. In the USA, major progress has been made in reducing chronic disease mortality in most racial and ethnic groups and age groups. Declines in deaths caused by cancer and heart disease, which accounted for nearly half of all premature deaths in the USA in 2014, have been particularly striking. The decrease in cigarette smoking (from 25·5% in 199011 to 16·8% in 201412) has contributed to these declines, since nearly one-third of all cancer deaths and 25% of coronary heart disease deaths are attributable to smoking.13,14 Other contributing factors include improvements in cancer treatment and early detection,15 blood pressure and cholesterol control, and heart disease treatment.16,17 However, heart disease mortality actually increased in 20–49-year-old white women and American Indian and Alaska Native men and women, indicating the need for additional prevention efforts in these populations. Decreases in HIV deaths have had a large impact on mortality in younger age groups, particularly in black and Hispanic individuals, because of modern HIV therapies improving survival.18
Unfortunately, substantial increases in accidental deaths, primarily resulting from drug poisonings, in the USA have completely negated the progress made in the prevention of chronic disease death in some groups; in Canada and England mortality from accidental deaths continue to decline. Worldwide, the USA has the highest per-capita use of prescription opioids.19 In 2013, the USA also had the fourth highest opioid-related mortality in the world among individuals aged 15–49 years, with rates more than twice those in Canada and England,20 although increasing rates of drug poisoning deaths have also been reported in these countries in recent years.6,21 Mortality due to drug poisonings in the USA more than doubled between 2000 and 2014; an average of 129 drug poisoning deaths per day were reported in 2014, with 61% of these deaths involving opioids.22 Mortality increased across opioid types from 2013 to 2014, including natural and semisynthetic opioid pain relievers (eg, morphine, oxycodone, and hydrocodone; 9% increase), heroin (26% increase), and synthetic opioids other than methadone (eg, fentanyl; 90% increase).22 In this study, we showed that increasing accidental deaths were the largest contributor to increasing mortality in white individuals and American Indians and Alaska Natives. For white individuals, this increase is consistent with data showing a high prevalence of past-year heroin use or dependence and prescription opioid use disorders, and more rapid increases in opioid-analgesic poisoning deaths compared with non-white populations.23–25 Increases in accidental deaths are seen across the USA, but trends in several states (eg, West Virginia and Kentucky) are particularly concerning. These results are consistent with geographical heterogeneity in opioid prescription patterns and substantial increases in county-level drug poisoning mortality.26,27 Although not examined here, results from a 2016 study28 have also shown notable geographical differences in life expectancy by income. We also found that suicide mortality has increased in white, American Indian and Alaska Native, and Asian and Pacific Islander populations across both sexes, and suicide is the only major cause of death that is increasing across sex and age groups in Asian and Pacific Islanders.
In our study, mortality in middle-aged American Indians and Alaska Natives has increased for every birth cohort since 1948, consistent with a report29 showing increasing overall mortality since the mid-1980s following declines for most of the 20th century. Our analysis showed that the largest absolute increases were attributable to accidental deaths and deaths due to chronic liver disease and cirrhosis. Increases in accidental deaths parallel the increases in heroin overdose deaths and sustained high rates of death due to use of opioid pain relievers in 2010–12 among American Indians and Alaska Natives.30 The high mortality in these ethnic groups have been attributed to several factors—high levels of poverty and unemployment, low education attainment, and low prevalence of health-care coverage, as well as the history of tribal devastation.31,32 Inadequate funding of Indian Health Services between the expiration of the Indian Health Care Improvement Act in 2000 and its permanent reauthorisation under the Affordable Care Act in 2013 might have contributed to increasing mortality.33 Furthermore, although 82% of Indian Health Services and tribal facilities provide some mental health care, none provide inpatient psychiatric services, leaving an enormous care gap for those needing inpatient drug and alcohol rehabilitation and suicide prevention services.34,35 Additionally, during 2000–10, the prevalence of smoking and obesity was high in American Indians and Alaska Natives, although these rates varied greatly by region.32
Mortality was consistently lowest in Asians and Pacific Islanders, and Hispanic individuals, although substantial heterogeneity by country of origin has been reported.36,37 The largest declines in mortality were seen in black individuals, consistent with a narrowing of the life expectancy gap between black and white individuals from 5·9 years in 1999 to 3·6 years in 2013.38 These declines in premature mortality in the black population resulted in roughly 300 000 fewer deaths in 2000–14 than would have been expected based on 1999 death rates. In spite of these declines, mortality remains high, and further effort is needed to address health disparities.
The main strengths of this study are the comprehensive analysis of premature mortality across age groups, sex, race and ethnicity, and cause of death, as well as the use of age-period-cohort modelling to estimate changes in mortality over calendar period and birth cohort. Strong birth cohort effects showed alarming increases in mortality with each subsequent generation of American Indians and Alaska Natives born since 1948 and white individuals born since 1970, with accidental deaths having the most profound impact on recent birth cohorts. The main limitation of this study is the reliance on race and ethnicity data typically recorded by funeral directors on death certificates, as opposed to US Census data that estimate population size of each racial and ethnic group from self-report.39 However, racial misclassification on death certificates has been reported to be negligible in white and black individuals, and very minor (3%) in Hispanic individuals and in Asians and Pacific Islanders;39 thus, the possibility that the strong mortality trends reported here are driven by changes in racial misclassification over time is implausible. By contrast, misclassification is more pronounced for American Indians and Alaska Natives;8,40 thus, we restricted our analysis to counties in Contract Health Services Delivery Areas where identification on death certificates is more accurate, although this approach excluded 35% of people in these populations.8 Improvement in classification of American Indians and Alaska Natives on death certificates over time could have contributed to increasing mortality trends. However, mortality increases are unlikely to be solely attributable to changes in classification, in view of the magnitude of the increase and the disparate trends for different causes of death. Differential misclassification for specific causes of death by racial and ethnic groups have been documented and might contribute to absolute mortality, but it would have to have become more pronounced over time to have driven the trends observed in our study.41
Mortality increases of 2–5% per year are rarely observed in developed countries. The magnitude of such increases is as large as those in two public health emergencies in the past: the substantial mortality increases in Russia during the 1990s42 and increases in mortality in individuals aged 20–40 years at the height of the AIDS epidemic (mid-1980s to mid-1990s) in the USA.43 The increases noted here are largely from potentially preventable causes of death—most notably, drug poisoning, and this epidemic is being addressed by several federal agencies. In 2013, the CDC released new opioid prescription guidelines to encourage more conservative prescribing and decrease the risk of overdose and addiction.44 Additionally, the US Department of Health and Human Services has identified priorities to combat opioid abuse, including increased safe prescribing practices, expanded use of naloxone to reverse opioid overdoses, and expansion of Medication-Assisted Treatment.45 Although in 2014 the Affordable Care Act made substance use disorder services an essential health insurance benefit, integration of mental health care and treatment for substance use disorders into traditional medical services is needed to reduce deaths from drug poisoning and suicide.46 However, the effectiveness of these policy initiatives remains to be determined.
Our findings show that premature mortality trends in the USA are divergent. Although substantial success has been achieved in the prevention of deaths caused by chronic and infectious diseases, and in the reduction of premature mortality in Hispanic individuals, black individuals, and Asians and Pacific Islanders, large increases in mortality have occurred in young and middle-aged white individuals and American Indians and Alaska Natives. These findings lead to a sobering conclusion: the goal of reducing premature mortality by 40% before 2030 is unlikely to be achieved in the USA if present trajectories continue. Aggressive efforts are urgently needed to reduce premature deaths by targeting emerging, but potentially preventable, causes of death—primarily drug poisonings, suicide, and chronic liver disease and cirrhosis—in addition to continued efforts against cancer and heart disease, and through expanded access to quality medical care for prevention and treatment of chronic disease, mental illness, and substance use disorders.
Supplementary Material
Acknowledgments
This work was funded by the Intramural Research Program of the US National Cancer Institute. We thank Brian Moroz, Michael Curry, and Jeremy Lyman for statistical support, and Stella Yi for feedback on the manuscript.
Footnotes
Contributors
MSS, NDF, and ABdG designed the study. MSS and PC analysed the data and generated the figures. MSS, PC, EAH, NDF, and ABdG wrote the manuscript. All authors interpreted the data and provided feedback on the manuscript.
Declaration of interests
We declare no competing interests.
Contributor Information
Meredith S Shiels, Division of Cancer Epidemiology and Genetics, National Cancer Institute, Rockville, MD, USA.
Pavel Chernyavskiy, Division of Cancer Epidemiology and Genetics, National Cancer Institute, Rockville, MD, USA.
William F Anderson, Division of Cancer Epidemiology and Genetics, National Cancer Institute, Rockville, MD, USA.
Ana F Best, Division of Cancer Epidemiology and Genetics, National Cancer Institute, Rockville, MD, USA.
Emily A Haozous, College of Nursing, University of New Mexico, Albuquerque, NM, USA.
Patricia Hartge, Division of Cancer Epidemiology and Genetics, National Cancer Institute, Rockville, MD, USA.
Philip S Rosenberg, Division of Cancer Epidemiology and Genetics, National Cancer Institute, Rockville, MD, USA.
David Thomas, Division of Epidemiology, Services and Prevention Research, National Institute on Drug Abuse, Bethesda, MD, USA.
Neal D Freedman, Division of Cancer Epidemiology and Genetics, National Cancer Institute, Rockville, MD, USA.
Amy Berrington de Gonzalez, Division of Cancer Epidemiology and Genetics, National Cancer Institute, Rockville, MD, USA.
References
- 1.Norheim OF, Jha P, Admasu K, et al. Avoiding 40% of the premature deaths in each country, 2010–30: review of national mortality trends to help quantify the UN sustainable development goal for health. Lancet. 2015;385:239–52. doi: 10.1016/S0140-6736(14)61591-9. [DOI] [PubMed] [Google Scholar]
- 2.Ma J, Ward EM, Siegel RL, Jemal A. Temporal trends in mortality in the United States, 1969–2013. JAMA. 2015;314:1731–39. doi: 10.1001/jama.2015.12319. [DOI] [PubMed] [Google Scholar]
- 3.Case A, Deaton A. Rising morbidity and mortality in midlife among white non-Hispanic Americans in the 21st century. Proc Natl Acad Sci USA. 2015;112:15078–83. doi: 10.1073/pnas.1518393112. [DOI] [PMC free article] [PubMed] [Google Scholar]
- 4.Ahmad FB. National Vital Statistics System, Vital Statistics Rapid Release Program 2016. Atlanta, GA: National Center for Health Statistics; 2016. Quarterly provisional estimates for selected indicators of mortality, 2014-Quarter 1, 2016. [Google Scholar]
- 5.Kochanek KD, Murphy SL, Xu J, Tejada-Vera B. Deaths: final data for 2014. Natl Vital Stat Rep. 2016;65:1–122. [PubMed] [Google Scholar]
- 6.Deaths and mortality rate, by selected group causes, age group and sex. Ottawa, ON: Statistics Canada; 2015. [accessed June 2, 2016]. http://www5.statcan.gc.ca/cansim/a34?lang=eng&id=1020551&searchTypeByValue=1&mode=tableSummary&p2=35. [Google Scholar]
- 7.Death registrations summary tables—England and Wales. London: Office for National Statistics; 2015. [accessed June 6, 2016]. https://www.ons.gov.uk/peoplepopulationandcommunity/birthsdeathsandmarriages/deaths/datasets/deathregistrationssummarytablesenglandandwalesreferencetables. [Google Scholar]
- 8.Jim MA, Arias E, Seneca DS, et al. Racial misclassification of American Indians and Alaska Natives by Indian Health Service Contract Health Service Delivery Area. Am J Public Health. 2014;104(suppl 3):S295–302. doi: 10.2105/AJPH.2014.301933. [DOI] [PMC free article] [PubMed] [Google Scholar]
- 9.Holford TR. Understanding the effects of age, period, and cohort on incidence and mortality rates. Annu Rev Public Health. 1991;12:425–57. doi: 10.1146/annurev.pu.12.050191.002233. [DOI] [PubMed] [Google Scholar]
- 10.Rosenberg PS, Check DP, Anderson WF. A web tool for age-period-cohort analysis of cancer incidence and mortality rates. Cancer Epidemiol Biomarkers Prev. 2014;23:2296–302. doi: 10.1158/1055-9965.EPI-14-0300. [DOI] [PMC free article] [PubMed] [Google Scholar]
- 11.US Centers for Disease Control and Prevention. Cigarette smoking among adults—United States, 1990. Morb Mortal Wkly Rep. 1992;41:354–55. [PubMed] [Google Scholar]
- 12.Jamal A, Homa DM, O’Connor E, et al. Current cigarette smoking among adults—United States, 2005–2014. Morb Mortal Wkly Rep. 2015;64:1233–40. doi: 10.15585/mmwr.mm6444a2. [DOI] [PubMed] [Google Scholar]
- 13.2014 Surgeon General’s Report: the health consequences of smoking—50 years of progress. Atlanta, GA: US Department of Health and Human Services; 2014. [accessed Dec 29, 2016]. http://www.surgeongeneral.gov/library/reports/50-years-of-progress/full-report.pdf. [Google Scholar]
- 14.Jacobs EJ, Newton CC, Carter BD, et al. What proportion of cancer deaths in the contemporary United States is attributable to cigarette smoking? Ann Epidemiol. 2015;25:179–82. doi: 10.1016/j.annepidem.2014.11.008. [DOI] [PubMed] [Google Scholar]
- 15.Byers T, Wender RC, Jemal A, Baskies AM, Ward EE, Brawley OW. The American Cancer Society challenge goal to reduce US cancer mortality by 50% between 1990 and 2015: results and reflections. CA Cancer J Clin. 2016;66:359–69. doi: 10.3322/caac.21348. [DOI] [PubMed] [Google Scholar]
- 16.Ford ES, Ajani UA, Croft JB, et al. Explaining the decrease in U.S. deaths from coronary disease, 1980–2000. N Engl J Med. 2007;356:2388–98. doi: 10.1056/NEJMsa053935. [DOI] [PubMed] [Google Scholar]
- 17.Johnson NB, Hayes LD, Brown K, Hoo EC, Ethlier KA. CDC national health report: leading causes of mobidity and mortality and associated behavioral risk and protective factors—United States, 2005–2013. Morb Mortal Wkly Rep. 2014;63(suppl):3–27. [PubMed] [Google Scholar]
- 18.HIV-CAUSAL Collaboration. Ray M, Logan R, et al. The effect of combined antiretroviral therapy on the overall mortality of HIV-infected individuals. AIDS. 2010;24:123–37. doi: 10.1097/QAD.0b013e3283324283. [DOI] [PMC free article] [PubMed] [Google Scholar]
- 19.Berterame S, Erthal J, Thomas J, et al. Use of and barriers to access to opioid analgesics: a worldwide, regional, and national study. Lancet. 2016;387:1644–56. doi: 10.1016/S0140-6736(16)00161-6. [DOI] [PubMed] [Google Scholar]
- 20.GBD compare. 2015. Seattle, WA: Institute for Health Metrics and Evaluation; 2015. [Google Scholar]
- 21.Deaths related to drug poisoning in England and Wales: 2015 registrations. London: Office for National Statistics; 2016. [Google Scholar]
- 22.Rudd RA, Aleshire N, Zibbell JE, Gladden RM. Increases in drug and opioid overdose deaths—United States, 2000–2014. Morb Mortal Wkly Rep. 2016;64:1378–82. doi: 10.15585/mmwr.mm6450a3. [DOI] [PubMed] [Google Scholar]
- 23.Han B, Compton WM, Jones CM, Cai R. Nonmedical prescription opioid use and use disorders among adults aged 18 through 64 years in the United States, 2003–2013. JAMA. 2015;314:1468–78. doi: 10.1001/jama.2015.11859. [DOI] [PubMed] [Google Scholar]
- 24.Jones CM, Logan J, Gladden RM, Bohm MK. Vital signs: demographic and substance use trends among heroin users— United States, 2002–2013. Morb Mortal Wkly Rep. 2015;64:719–25. [PMC free article] [PubMed] [Google Scholar]
- 25.Chen LH, Hedegaard H, Warner M. Drug-poisoning deaths involving opioid analgesics: United States, 1999–2011. NCHS Data Brief. 2014;166:1–8. [PubMed] [Google Scholar]
- 26.Opioid painkiller prescribing. Atlanta, GA: US Centers for Disease Control and Prevention; Jul, 2014. [accessed Jan 12, 2017]. http://www.cdc.gov/vitalsigns/opioid-prescribing. [Google Scholar]
- 27.Buchanich JM, Balmert LC, Pringle JL, Williams KE, Burke DS, Marsh GM. Patterns and trends in accidental poisoning death rates in the US, 1979–2014. Prev Med. 2016;89:317–23. doi: 10.1016/j.ypmed.2016.04.007. [DOI] [PubMed] [Google Scholar]
- 28.Chetty R, Stepner M, Abraham S, et al. The association between income and life expectancy in the United States, 2001–2014. JAMA. 2016;315:1750–66. doi: 10.1001/jama.2016.4226. [DOI] [PMC free article] [PubMed] [Google Scholar]
- 29.Kunitz SJ. Ethics in public health research: changing patterns of mortality among American Indians. Am J Public Health. 2008;98:404–11. doi: 10.2105/AJPH.2007.114538. [DOI] [PMC free article] [PubMed] [Google Scholar]
- 30.Rudd RA, Paulozzi LJ, Bauer MJ, et al. Increases in heroin overdose deaths—28 states, 2010 to 2012. Morb Mortal Wkly Rep. 2014;63:849–54. [PMC free article] [PubMed] [Google Scholar]
- 31.Jacobs-Wingo JL, Espey DK, Groom AV, Phillips LE, Haverkamp DS. Causes and disparities in death rates among urban American Indian and Alaska Native populations, 1999–2009. Am J Public Health. 2016;106:906–14. doi: 10.2105/AJPH.2015.303033. [DOI] [PMC free article] [PubMed] [Google Scholar]
- 32.Cobb N, Espey D, King J. Health behaviors and risk factors among American Indians and Alaska Natives, 2000–2010. Am J Public Health. 2014;104(suppl 3):S481–89. doi: 10.2105/AJPH.2014.301879. [DOI] [PMC free article] [PubMed] [Google Scholar]
- 33.Ross RE, Garfield LD, Brown DS, Raghavan R. The Affordable Care Act and implications for health care services for American Indian and Alaska Native individuals. J Health Care Poor Underserved. 2015;26:1081–88. doi: 10.1353/hpu.2015.0129. [DOI] [PMC free article] [PubMed] [Google Scholar]
- 34.Urban Indian Health Institute. Addressing depression among American Indians and Alaska Natives: a literature review. Seattle, WA: Urban Indian Health Institute; 2012. [Google Scholar]
- 35.Department of Health and Human Services, Indian Health Service. Inpatient Mental Health Assessment. Rockville, MD: Indian Health Service; 2011. [accessed Dec 29, 2016]. https://www.ihs.gov/newsroom/includes/themes/newihstheme/display_objects/documents/FINAL_IHCIA_InpatientMH_Assessment_Final.pdf. [Google Scholar]
- 36.Hastings KG, Jose PO, Kapphahn KI, et al. Leading causes of death among Asian American subgroups (2003–2011) PLoS One. 2015;10:e0124341. doi: 10.1371/journal.pone.0124341. [DOI] [PMC free article] [PubMed] [Google Scholar]
- 37.Dominguez K, Penman-Aguilar A, Chang MH, et al. Vital signs: leading causes of death, prevalence of diseases and risk factors, and use of health services among Hispanics in the United States—2009–2013. Morb Mortal Wkly Rep. 2015;64:469–78. [PMC free article] [PubMed] [Google Scholar]
- 38.Kochanek KD, Anderson RN, Arias E. Leading causes of death contributing to decrease in life expectancy gap between black and white populations: United States, 1999–2013. NCHS Data Brief. 2015;218:1–8. [PubMed] [Google Scholar]
- 39.Arias EH, Heron M, Hakes JK. The validity of race and Hispanic-origin reporting on death certificates in the United States: an update. Hyattsville, MD: National Center for Health Statistics; 2016. [accessed Dec 29, 2016]. https://www.cdc.gov/nchs/data/series/sr_02/sr02_172.pdf. [PubMed] [Google Scholar]
- 40.Arias E, Schauman WS, Eschbach K, Sorlie PD, Backlund E. The validity of race and Hispanic origin reporting on death certificates in the United States. Vital Health Stat 2. 2008;148:1–23. [PubMed] [Google Scholar]
- 41.Noymer A, Penner AM, Saperstein A. Cause of death affects racial classification on death certificates. PLoS One. 2011;6:e15812. doi: 10.1371/journal.pone.0015812. [DOI] [PMC free article] [PubMed] [Google Scholar]
- 42.Men T, Brennan P, Boffetta P, Zaridze D. Russian mortality trends for 1991–2001: analysis by cause and region. BMJ. 2003;327:964. doi: 10.1136/bmj.327.7421.964. [DOI] [PMC free article] [PubMed] [Google Scholar]
- 43.Centers for Disease Control and Prevention, National Center for Health Statistics. Death rates for 282 selected causes by 5-year age groups, race, and sex: United States, 1979–98. [accessed Jan 12, 2017];National Vital Statistics System. https://www.cdc.gov/nchs/data/statab/gm290-98.pdf.
- 44.Dowell D, Haegerich TM, Chou R. CDC guideline for prescribing opioids for chronic pain—United States, 2016. MMWR Recomm Rep. 2016;65:1–49. doi: 10.15585/mmwr.rr6501e1. [DOI] [PubMed] [Google Scholar]
- 45.Assistant Secretary for Planning and Evaluation Issue Brief. Washington, DC: Department of Health and Human Services; 2015. [accessed Dec 29, 2016]. Opioid abuse in the U.S. and HHS actions to address opioid-drug related overdoses and deaths. https://aspe.hhs.gov/sites/default/files/pdf/107956/ib_OpioidInitiative.pdf. [DOI] [PubMed] [Google Scholar]
- 46.Murthy VH. Surgeon General’s report on alcohol, drugs, and health. JAMA. 2017;317:133–34. doi: 10.1001/jama.2016.18215. [DOI] [PubMed] [Google Scholar]
Associated Data
This section collects any data citations, data availability statements, or supplementary materials included in this article.


