

Abstract
Accurate and contiguous genome assembly is key to a comprehensive understanding of the processes shaping genomic diversity and evolution. Yet, it is frequently constrained by constitutive heterochromatin, usually characterized by highly repetitive DNA. As a key feature of genome architecture associated with centromeric and subtelomeric regions, it locally influences meiotic recombination. In this study, we assess the impact of large tandem repeat arrays on the recombination rate landscape in an avian speciation model, the Eurasian crow. We assembled two high-quality genome references using single-molecule real-time sequencing (long-read assembly [LR]) and single-molecule optical maps (optical map assembly [OM]). A three-way comparison including the published short-read assembly (SR) constructed for the same individual allowed assessing assembly properties and pinpointing misassemblies. By combining information from all three assemblies, we characterized 36 previously unidentified large repetitive regions in the proximity of sequence assembly breakpoints, the majority of which contained complex arrays of a 14-kb satellite repeat or its 1.2-kb subunit. Using whole-genome population resequencing data, we estimated the population-scaled recombination rate (ρ) and found it to be significantly reduced in these regions. These findings are consistent with an effect of low recombination in regions adjacent to centromeric or subtelomeric heterochromatin and add to our understanding of the processes generating widespread heterogeneity in genetic diversity and differentiation along the genome. By combining three different technologies, our results highlight the importance of adding a layer of information on genome structure that is inaccessible to each approach independently.
De novo genome assembly lies at the core of any genome-wide investigation. Initiatives such as the Genome 10K Project (Koepfli et al. 2015) illustrate that the generation of gigabase-sized genome drafts is no longer limited to the biomedical sciences. Genome assembly has become commonplace for essentially any organism of choice (Ekblom and Wolf 2014; Koepfli et al. 2015). Although being assembled in the thousands, current drafts generally represent an incomplete account of an organism's genome (Chaisson et al. 2015) and are typically highly fragmented, e.g., for birds (contig N50 <1 Mb and scaffold N50 <10 Mb, in most cases) (Kapusta and Suh 2016) and for vertebrates (contig N50 <0.1 Mb, scaffold N50 4.4–16.8 Mb) (Wolf and Ellegren 2017). Moreover, they are biased against long stretches of repetitive sequence, especially tandem repeats (Eichler et al. 2004; Rudd and Willard 2004). Using conventional short-read sequencing technologies, individual repeat elements longer than sequencing reads may be collapsed or entirely missing in the assembly, and the exact structure of large tandem repeat arrays remains intractable (Phillippy et al. 2008; Chaisson et al. 2015; Miga 2015). The introduction of long-read sequencing, such as single-molecule real-time sequencing with >10-kb reads (Eid et al. 2009), promises better long-range contiguity and resolution of repetitive regions. A recent example for the benefits of long-read sequence data is illustrated by the Susie3 gorilla genome assembly (Gordon et al. 2016). The reported 819-fold increase in contig N50 corresponds to >164 Mb additional euchromatic sequence with thousands of newly discovered exons and a substantially improved gene annotation with fewer transcript errors. Sequence contiguity was achieved by spanning repetitive elements (positive correlation between gap size and repeat content), facilitating a comprehensive assessment of structural variation. Of the more than 118,000 structural variants detected, 87% were previously unidentified. Thus, major gains can be expected from improved genome assemblies, including superior gene models, refined detection of structural variation, and increased resolution of genetic diversity via repetitive element characterization (for review, see Thomma et al. 2016). Complementary approaches such as optical mapping of single >150-kb molecules via nanochannel arrays (Lam et al. 2012) or chromatin interaction mapping (Lieberman-Aiden et al. 2009) likewise facilitate genome assemblies of ever-increasing contiguity and completeness. Apart from intensely studied model organisms, e.g., human and mouse (Church et al. 2009; Pendleton et al. 2015), chromosome(arm)-sized scaffolds are still the exception among genome assemblies. Promising examples of approaches using long-range information (Bickhart et al. 2016; Steinberg et al. 2016) and a combination of comparative genomics and universal probes (Damas et al. 2017) illustrate the rapid development of high-quality genome assemblies for nonmodel organisms.
Constitutive heterochromatin generally refers to large repetitive DNA domains associated with centromeric and subtelomeric regions (Peng and Karpen 2008). Blocks of heterochromatic repeats, however, need not be restricted to these regions (Smith et al. 2007; Saksouk et al. 2015), posing a major challenge to assembly in various regions of the genome. Although heterochromatin is generally lacking in genome assemblies, it constitutes a key feature of chromosomal architecture with important biological functions. These range from centromere-mediated segregation of chromosomes to regulation of DNA transcription (Grewal and Jia 2007; Fedorova and Zink 2008) and suppressed recombination (Smith et al. 2007; George and Alani 2012), features with important evolutionary consequences. For example, centromere drive—a form of meiotic segregation distortion (Lindholm et al. 2016)—can lead to the formation of hybrid incompatibilities and promote reproductive isolation and speciation (Henikoff et al. 2001). Constitutive heterochromatin can also regionally suppress recombination (George and Alani 2012), providing the substrate for linked selection. This form of selection has, either as hitchhiking or background selection, important implications for the distribution of genetic variation across the genome. By locally reducing effective population size Ne, it accelerates lineage sorting and thus significantly contributes to heterogeneity in genetic diversity (Cutter and Payseur 2013; Ellegren and Galtier 2016). As a consequence, regions with elevated genetic differentiation often coincide with recombination coldspots (Roesti et al. 2013; Burri et al. 2015), and statistical evidence for selection has been found in regions putatively adjacent to centromeres and telomeres (Roesti et al. 2012; Zanders et al. 2014). However, direct information on the location of DNA sequence associated with heterochromatin is generally absent from genome assemblies due to its highly repetitive structure. Investigations of the strength and mode of selection shaping genetic variation across genomes will therefore benefit from detailed information on genome structure currently inaccessible in standard short-read assemblies.
In this study, we address this gap by characterizing hitherto unidentified repetitive regions in the genome of a model system for incipient speciation, the Eurasian crow, and assess their impact on evolutionary processes shaping genetic variation during population divergence. Previous work in the European hybrid zone between all-black carrion crows (Corvus [corone] corone) and gray-coated hooded crows (Corvus [corone] cornix) has shown that only few genomic regions are highly differentiated, with the most extreme peak of differentiation located on chromosome 18 on either side of an assembly gap of unknown size (Poelstra et al. 2014). Moreover, in several systems including crows (Burri et al. 2015; Vijay et al. 2016), genetic diversity is reduced in regions of low recombination. It has been suggested that structural chromosomal features often located in recombination deserts contribute via the effect of diversity-reducing linked selection (Carneiro et al. 2008; Roesti et al. 2012).
Here, we compiled a comprehensive data set composed of a high-coverage single-molecule real-time sequencing assembly (LR assembly, Pacific Biosystems, PacBio platform), an independently assembled optical map (OM assembly, BioNano platform), and a previously generated high-coverage short-read sequence assembly (SR assembly, Illumina platform) for the same hooded crow individual (Poelstra et al. 2014). The three-way comparison allowed the identification of misassemblies and greatly improved completeness and contiguity of the assembly. We then characterized and anchored putatively heterochromatic repetitive regions and assessed their impact on recombination rate estimated from extensive population resequencing data. We highlight the potential of our approach to add a layer of information on genome structure inaccessible to single-platform genome assemblies and discuss the implications for studies investigating evolutionary processes acting during population divergence.
Results
Long-read single-molecule and optical mapping assemblies
We sequenced 102 single-molecule real-time (SMRT) cells on a PacBio RSII platform and obtained a total of 63.2 Gb long-read sequence data distributed over 9 million single reads with a mean subread length of 6.8 kb (subread N50 = 9.49 kb). This corresponds to a 52-fold genome coverage assuming a genome size of approximately 1.2 Gb based on the C-value obtained from DNA fluorometry (Venturini et al. 1986). The long-read sequence assembly using FALCON (https://github.com/PacificBiosciences/FALCON), for which only subreads >8 kb were considered, yielded a cumulative length of 1.093 Gb assembled in 3100 contigs. This provided an 89.1-fold improvement in contiguity metrics compared to the existing SR assembly from Poelstra et al. (2014) (Table 1, 0.1 vs. 8.58 Mb contig N50). The LR assembly resolved an additional 70.8 Mb of sequence when compared to the SR assembly, 15.8 of which were repetitive elements, and 27.5 Mb previously constituted SR assembly gaps (Supplemental Table S1).
Table 1.
Comparison of short-read, long-read, and optical mapping assemblies of the hooded crow
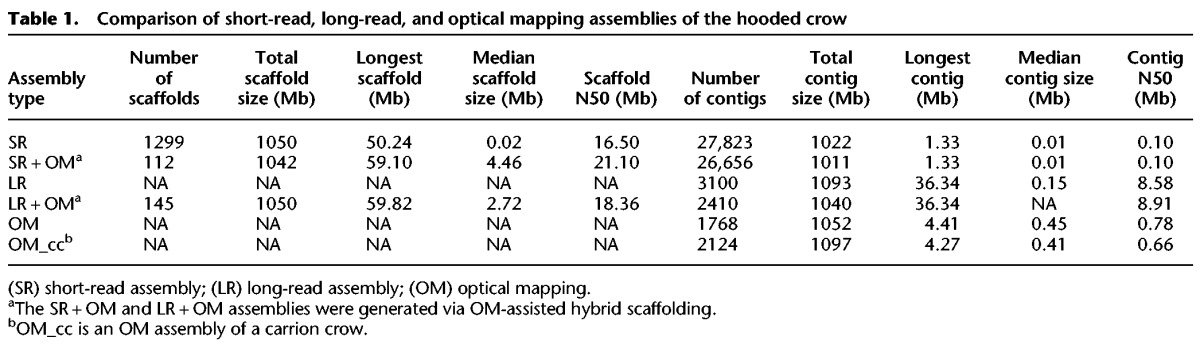
We further generated single-molecule optical mapping data from the BioNano platform (using the nicking endonuclease or “nickase” Nt.BspQI) for the hooded crow genome individual and a carrion crow individual. In brief, long (>150 kb) DNA molecules are digested with a nicking endonuclease, which inserts a fluorescently labeled nick strand at the recognition motif. The processed DNA is then stretched out uniformly in nanochannels, where the positions of the fluorescent labels are recorded. The recorded image of one labeled molecule containing ordered information on the distance among fluorescent labels constitutes a single-molecule map (Lam et al. 2012). The imaging on the Irys instrument of two flow cells each yielded 461,649 labeled molecules for the hooded crow and 720,762 molecules for the carrion crow individual. This corresponded to a 73.7-fold and 101.9-fold genome coverage, respectively. We then assembled the single-molecule maps de novo into consensus maps, resulting in 1768 OM contigs for the hooded crow map and 2124 OM contigs for the carrion crow map. OM contig N50 and total map length were 0.78 Mb and 1.052 Gb for the hooded crow and 0.66 Mb and 1.097 Gb for the carrion crow (Table 1).
Next, we used the hooded crow OM contigs to perform hybrid scaffolding on the SR and LR assemblies. Whenever an OM contig aligned confidently (P-value <1 × 10⁻¹¹, equivalent to ∼11 nickase labels and >80 kb overlap) to two different SR scaffolds or LR contigs, these were joined according to the linkage information of the OM contig (Fig. 1). Hybrid scaffolding greatly improved long-range information in both assemblies (as measured by the scaffold N50) (Table 1; Yandell and Ence 2012). Eighty-five and 202 scaffolds were joined via OM in the SR and LR assembly, respectively (Table 1). The OM hybrid scaffolding approach yielded the highest scaffold N50 (21.1 Mb) in combination with the SR assembly, which had been scaffolded with mate-pair sequences of varying size (insert sizes 2–20 kb) (Poelstra et al. 2014).
Figure 1.
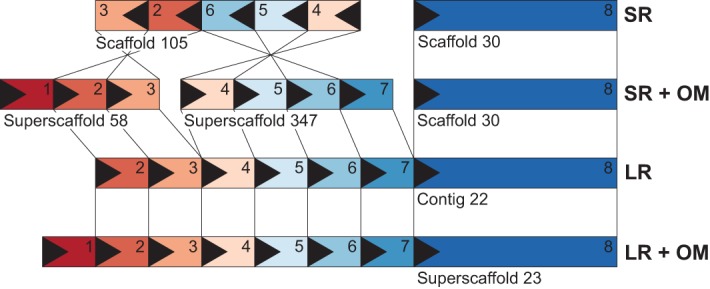
Assembly comparisons. Schematic colored and numbered boxes with arrows correspond to arbitrarily sized homologous regions aligned between the different sequence assemblies based on short reads (SR), long reads (LR), and hybrid scaffolding via optical mapping (SR + OM and LR + OM). Note that boxes 1 and 7 are not present on the SR scaffolds, because they align to another scaffold not shown.
Utilizing the three independent sources of information (SR, LR, and OM), we identified misassemblies in all three approaches by examining conflicting alignments and inspecting alignments of single-molecule OMs, so-called single-molecule pileups. When comparing the OM versus SR assembly, we found 54 assembly conflicts, 11 due to errors in the OM contigs and 43 due to misassemblies in the SR assembly. In the OM versus LR assembly comparison, we identified fewer than half as many conflicts—five due to misjoins in the OM and 20 due to erroneous assembly in the LR. Apart from simple misjoins of scaffolds or contigs, we identified four large “artificial inversions” in the SR assembly (e.g., see Supplemental Fig. S1). In these cases, OM assemblies of both the hooded and carrion crow were consistent, and the SR scaffolds lacked single-molecule OM support; hence these likely represent SR assembly errors.
Hybrid scaffolding also introduced nine putatively inter-chromosomal scaffold joins in the SR assembly and 17 in the LR assembly. Visual inspection of OM contigs used for these joins revealed that the majority (eight of nine in SR; seven of 17 in LR) featured OM contigs with a large repetitive part with closely spaced nickase motifs (also identified by our methods for automated repeat detection in OM data, see below). Although the repeat regions themselves were reliably anchored into nonrepetitive contigs, the length of these repetitive regions exceeded that of single-molecule OMs. Concatenation of two scaffolds into a super-scaffold is therefore not reliable (Supplemental Fig. S2).
Characterization of large tandem repeat arrays in ‘repetitive anchored maps’ (RAMs)
Next, we constructed an in silico Nt.BspQI reference map from both SR and LR sequence assemblies, to which we aligned the hooded crow and the carrion crow OM assemblies, respectively. Visual inspection of these alignments revealed several cases in which an OM contig exceeded an SR scaffold or LR contig with a highly repetitive overhang (as indicated by many nickase motifs occurring in regular distance of <3 kb from each other) (Fig. 2A). We refer to such repeat-bearing OM contigs that partially align to a sequence reference as “repetitive anchored maps” (RAMs). Using automated repeat detection in OM data (Methods), we identified a total of 55 OM contigs containing repetitive regions (Supplemental Table S2). Of these, 36 and 31 could be anchored to the SR and LR references and thus classified as RAMs, respectively. Except for a single case, RAM alignments to the SR reference occurred at scaffold ends, whereas six RAMs aligned >500 kb away from an LR contig end (for a RAM alignment away from a scaffold end, see Supplemental Fig. S3). Repetitive OM contigs that did not align to any sequence reference consisted almost entirely of tandem repeat arrays with motif sizes ranging between 3 and 50 kb, all of which are expected to be largely collapsed in sequence assemblies (Chaisson et al. 2015). One LR reference contig was removed from the analysis, because its ∼70-kb sequence consisted exclusively of tandemly repeated subunits of a large satellite (see “crowSat1” described below) (Supplemental Fig. S4).
Figure 2.

Identification of putatively heterochromatic tandem repeat arrays. (A) Shown are the alignments of independent OM assemblies from a carrion and hooded crow individual (light blue) to the SR (dark green) and LR (light green) of the same hooded crow individual. Vertical bars in boxes correspond to nickase motifs of the enzyme Nt.BspQI, and gray vertical bars between boxes indicate orthologous nicks. The nickase motif pattern in both OM contigs matched the end of the SR scaffold or LR contig, and the part beyond is characterized by dense occurrence of nickase motifs every ∼3 kb, indicating a tandem repeat array. We termed such OM contigs “repetitive anchored maps” (RAMs). (B,C) Sequence similarity plots of the 14-kb crowSat1 consensus sequence aligned against assembled contigs/scaffolds of the SR (B) and LR (C) assembly (the same region as shown in A), and self-alignment of the crowSat1 consensus sequence (D). The latter suggests that crowSat1 is an >14-kb tandem repeat with an internal palindrome (blue) of tandemly repeated subunits (red). The most contiguous assembly of crowSat1 units is at the end of contig_000233F of the LR assembly (C) (but see also contig_000396 which entirely consists of crowSat1) (Supplemental Fig. S4), containing the palindrome and 13 tandem repeat units. This region is orthologous to the end of scaffold_100 of the SR assembly, where it exhibits fewer assembled crowSat1 units (B). Note that the flank of the crowSat1-bearing RAM is highly enriched for RepeatMasker-annotated repeats (green; mostly TEs) and many short remnants of crowSat1 (red and blue dots).
We expected large repetitive sequences such as transposable elements (TEs), satellites, or both, as the source for the regular nick motifs in OM contigs and thus characterized the primary sequence adjacent to RAM alignments. Repeat annotation of both sequence assemblies using the existing crow repeat library (Vijay et al. 2016) provided no evidence for the presence of specific TEs near RAM alignments. However, we detected a novel satellite repeat in RAM-adjacent regions through multiple rounds of iterative BLAST searching and manual curation of multiple sequence alignments (Methods). The ∼14-kb consensus sequence (which we termed “crowSat1”) suggests that it is a complex satellite with a tandemly and palindromically arranged subunit of ∼1.2 kb (Fig. 2D). Notably, the distribution of Nt.BspQI nickase motifs in the crowSat1 consensus sequence is consistent with the repetitive patterns seen in RAMs (cf. Fig. 2A,D). Fragments of crowSat1 are present on 29 SR scaffolds and 312 LR contigs and appear to be predominantly located near ends of scaffolds/contigs in both sequence assemblies (Supplemental Tables S3, S4). Notably, more tandem repeat units of crowSat1 are captured by the LR assembly than the SR assembly (a difference of 4.0 Mb) (Supplemental Table S1) and are enriched at the boundary of RAMs (e.g., Fig. 2B,C). We thus hypothesize that crowSat1 or complex arrangements of its subunits are the main repetitive component of RAMs. This suggests that OM permits the effective localization and anchoring of such hard-to-assemble regions into sequence assemblies.
Population genetic parameters in proximity to large tandem repeat arrays
Large tandem arrays of satellite repeats are generally associated with constitutive heterochromatin and thus often characterized by suppressed recombination (Smith et al. 2007; George and Alani 2012). To test whether the potentially heterochromatic regions pinpointed by RAMs and crowSat1 are indeed associated with regions of low recombination, we estimated the population-scaled recombination rate (ρ) using phased genotypes of single-nucleotide polymorphisms (SNPs) in 50-kb windows across the hooded crow SR genome assembly. For the estimation of ρ, we used 15 short-read resequenced individuals from a Swedish hooded crow population (including the genome individual) and a German carrion crow population (Poelstra et al. 2014; Vijay et al. 2016). The genome-wide median recombination rate was ρ = 6.1 per kb in hooded crow and ρ = 5.6 per kb in carrion crow. For subsequent analyses, 50-kb windows were parsimoniously oriented and ordered into chromosomes by pairwise whole-genome alignment with three chromosomal assemblies of passerines based on independent linkage maps: zebra finch, flycatcher, and great tit (Warren et al. 2010; Kawakami et al. 2014; Laine et al. 2016).
Next, we compared genome-wide estimates of ρ with values stemming from windows next to scaffold ends and the location of presumably heterochromatic tandem repeat arrays as indicated by the occurrence of RAMs and crowSat1 (Fig. 3). The overall per-chromosome pattern was striking, with a pronounced ρ trough in the vicinity of RAM and crowSat1, flanked by a peak on either side. Considering ρ across the entire genome, ρ was significantly reduced in the vicinity of RAM and crowSat1 in both crow populations (RAM: χ2df=1, p-value = 2.024 × 10⁻¹⁶ and 2.2 × 10⁻¹⁶; crowSat1: χ2df=1, p-value = 2.87 × 10⁻¹⁶ and 2.09 × 10⁻¹⁴). Since both RAM and crowSat1 are preferentially found at scaffold ends, the reduction in ρ may reflect a positional effect rather than a genuine association with these specific repetitive features. To test for a general, RAM-independent effect of scaffold ends on the population recombination rate parameter, we compared RAMs to windows exclusively adjacent to scaffold ends. This confirmed that the reduction in ρ was not associated with scaffold ends in general, but specifically with RAMs in both hooded and carrion crow populations (Fig. 4) χ2df=1, p-value = 0.01755 and 0.01242). The occurrence of crowSat1 at scaffold ends had a significant influence on ρ only in hooded crow χ2df=1, p-value = 0.01995; carrion crow: not significant). RAMs and crowSat1 were not associated with a systematically lowered average genotype quality or mappability (gem-mappability, k-mer = 200) (Derrien et al. 2012) for the windows used to calculate ρ (Supplemental Figs. S6, S7; Supplemental Table S6).
Figure 3.

Chromosome-level distribution of population-scaled recombination rate ρ and structural genome features show, for example, chromosomes of varying size: (Black dots) the weighted mean of ρ/bp in 50-kb windows estimated from a Swedish hooded crow population; (gray lines) SR scaffold ends; (red squares) repetitive anchored map (RAM) with the possible co-occurrence of the crowSat1 satellite. Data are shown for representative synteny- and collinearity-based chromosomes (for the remaining chromosomes, see Supplemental Fig. S5).
Figure 4.
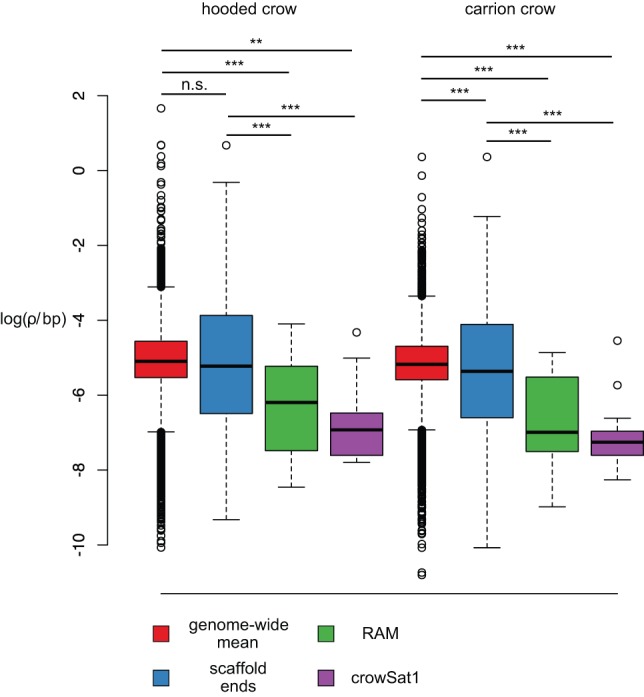
Population-scaled recombination rate ρ as a function of RAMs and crowSat1 satellites. Box plots show loge(ρ) in units of 4Ner/bp as estimated in 50-kb windows for Swedish hooded crow and German carrion crow populations. Values are broken down by category of windows representing the genome (red), windows adjacent to scaffold ends (blue), windows adjacent to RAMs (green), and windows including crowSat1 (violet). Straight horizontal lines depict the median, box margins indicate the interquartile range between 25% and 75% quantiles, and whiskers extend to 1.5-times the interquartile range with values beyond shown as points. Asterisks denote the significance level based on t-tests corrected for multiple comparisons.
Local reduction in population-scaled recombination rate (ρ = 4Ner) (Stumpf and McVean 2003) could exclusively be due to a reduction in recombination rate r or exhibit a contribution from linked selection (simultaneous reduction in Ne). Assuming no mutagenic effects of recombination other than for localized recombination hotspots (Arbeithuber et al. 2015) linked selection reducing the effective population size is a main predictor for reduction of broad-scale genetic variation (θ = 4Neµ) (Cutter and Payseur 2013). We therefore also calculated the population mutation rate θW (Watterson's estimator) (Fig. 5). Similar to ρ, θW exhibited a pronounced reduction in proximity to RAMs and crowSat1 (e.g., Fig. 5), significant in both crow populations when considering genome-wide values, for example, hooded crow: genome-wide median = 0.0019, RAMs: χ2df=1, p-value = 1.727 × 10⁻⁸, and carrion crow: genome-wide median = 0.0019, χ2df=1, p-value = 8.704 × 10⁻¹⁰, crowSat1: χ2df=1, p-value = 0.005561, χ2df=1, p-value = 0.009562. Moreover, FST as a relative measure of genetic differentiation exhibited clear peaks close to RAMs and crowSat1 (e.g., Fig. 5), an association which was significant when considering genome-wide values and values next to scaffold ends only—genome-wide RAMs: χ2df=1, p-value = 2.024 × 10⁻¹⁰ and crowSat1: χ2df=1, p-value = 2.870 × 10⁻¹⁶; ends only RAMs: χ2df=1, p-value = 0.01755 and crowSat1: χ2df=1, p-value = 0.01995. Overall, this suggests that the occurrence of repetitive genomic features (as detected via RAMs and crowSat1) is associated not only with reduced recombination, but also with a change in population genetic parameters indicative of selection.
Figure 5.

Structural genome features and population genetic summary statistics surrounding a peak of extreme genetic differentiation between hooded and carrion crows on Chromosome 18. Comparison of population genetic summary statistics ρ/bp, θW, and FST in 50-kb windows: (horizontal green bars) SR assembly with crowSat1 locations in dark red; (horizontal blue bars) OM contigs with RAMs schematically shown with densely spaced nickase motifs; (vertical gray bars) SR scaffold ends.
Discussion
We used long-read sequencing and optical mapping to generate new draft genome assemblies for the hooded crow providing the following insights: (1) the long-read sequence assembly based on single-molecule real-time sequencing substantially improved completeness and contiguity; (2) hybrid scaffolding with OM assisted in joining contigs/scaffolds and resolved misassemblies; (3) using a combination of long-range-information technologies and population-based measures of recombination rate, we could anchor large, presumably heterochromatic tandem repeat arrays of satellites into genome assemblies; and (4) these complex genomic structures contributed to explaining genome-wide variance in population genetic summary statistics.
High-quality genome assembly achieved by LR sequencing and OM
Novel technologies providing long-range information of DNA molecules promise to improve completeness and contiguity measures of draft genome assemblies (e.g., Berlin et al. 2015; Bickhart et al. 2016; Gordon et al. 2016). The existing SR genome assembly of the hooded crow (Poelstra et al. 2014) represents a high standard in terms of scaffold-level linkage information (scaffold N50 = 16.38 Mb) compared to other vertebrate nonmodel organisms (Ellegren 2014). Sequence contiguity, however, is relatively low (contig N50 = 0.1 Mb) with many gaps and incomplete gene models (Poelstra et al. 2015). The LR assembly provided a major improvement in that respect with an 89.1-fold increase in contig N50. The >8-kb long reads used in the assembly spanned longer stretches of repetitive elements accounting for 15.8 Mb of the 70.8 Mb additional sequence present in the LR assembly (Supplemental Table S1). This includes 4.0 Mb of the crowSat1 satellite. We further utilized the long-range information of optical mapping data in a hybrid scaffolding approach with the SR and LR assemblies. In each case, we achieved a significant increase in scaffold N50 of 1.3-fold in the SR to a final of 21.10 Mb, and 2.02-fold to a final of 18.36 Mb with respect to contig N50 in the LR assembly. The slightly higher scaffold N50 when using the SR assembly is explained by the higher number of short (<100 kb) sequence contigs in the LR assembly containing too few nick sites to be informative for hybrid scaffolding. Comparable improvement has been reported for two other nonmodel vertebrate assemblies—Asian seabass and goat—where a combination of LR sequencing and long-range mapping technologies have been applied (Bickhart et al. 2016; Vij et al. 2016). This clearly illustrates that genome assembly can benefit from adding data from independent long-read sequencing and mapping technologies.
A promising aspect of the OM-assisted hybrid scaffolding is the ability to resolve assembly errors in sequence assemblies. We identified fewer misassemblies in the LR assembly than in the SR assembly (20 vs. 43). Although this is expected due to the more informative long reads, it also highlights the need of independent technologies for accurate genome assembly even for LR assemblies (Nagarajan and Pop 2013). Identification of misassemblies using OM-assisted hybrid scaffolding relies on both OM contigs and single-molecule maps with lengths >100 kb and can be assessed (and if necessary rejected) on a case-by-case basis. Careful analysis of OM data thus complements LR sequencing and, depending on the study organism, can facilitate near-chromosome-level genome assemblies.
Yet, on a cautious note, combining information from several sources may also introduce errors. We identified several cases in which scaffolds or contigs, anchored to different chromosomes by synteny with other bird genomes, were joined by hybrid scaffolding. Although there is the possibility of inter-chromosomal rearrangements, it is not expected to be common in songbirds due to their relatively high chromosomal integrity (Ellegren 2013). Visual scrutiny of these OM contigs revealed that the repetitive part (as seen in RAMs) was rarely bridged by single-molecule optical maps (Supplemental Fig. S2), pointing at likely misjoins. It also suggests that the high signal density in these repetitive regions tends to provoke a high rate of confident, yet erroneous alignments of single-molecule maps consisting entirely of repeats. Consequently, despite our observation that ends of repetitive single-molecule maps can be reliably anchored to nonrepetitive sequence (our definition of RAMs), OM contigs spanning tandem repeat arrays longer than the average molecule length need to be treated with caution (Staňková et al. 2016). Similarly, scaffold N50 statistics from hybrid scaffolding via OM might be incorrectly inflated by such errors. Algorithms specifically addressing properties of repetitive DNA in OM assemblies need to be implemented into assembly and alignment software for optical mapping data.
Candidate heterochromatic regions revealed by optical mapping
Constitutive heterochromatin is characterized by long stretches of tandemly repeated DNA (Peng and Karpen 2008) and is mostly confined to subtelomeric and centromeric regions of the genome (Grewal and Jia 2007; Smith et al. 2007). Several OM contigs of the data examined here exhibited a highly repetitive nicking pattern (more than eight nick sites per 20 kb, compared to about three on average), some of which could also be aligned to the SR and LR references, and were thus classified as RAMs. The repetitive motifs of these OM contigs were absent in the SR assembly and, to a large degree, also in the LR assembly. Only in three cases did contig ends of the LR assembly capture short (<25 kb) parts of the tandem repeat arrays predicted by the OM data. These contig ends consisted entirely of complex arrangements of the crowSat1 satellite subunit as tandems and palindromes. Thus, it seems possible that LR technologies and assembly algorithms are capable of at least partly resolving such complex regions. Recent bioinformatic advances which specifically address the problem of repeat assembly using long reads might push the boundaries even further (Kamath et al. 2016; Sevim et al. 2016). Similar to our observations, Bickhart et al. (2016) found repetitive OM contigs that did not align to the high-quality goat genome assembly, highlighting the strength of OM in capturing information on complex genome structures inaccessible to both SR and LR sequencing.
The repetitive regions we identified in RAMs exhibited a nickase motif at roughly every 2.5 kb and were often associated with the presence of the crowSat1 satellite in nearby primary sequence. Hence, the sequence is likely not composed of short tandem repeats as, for example, human centromeric alpha satellites with repeat units of ∼170 bp (Willard 1991). Few examples of centromeric, heterochromatic repeats exhibit motif sizes >1 kb. Miga et al. (2014) found a 2.5-kb centromeric satellite repeat in the human X Chromosome, and Shang et al. (2010) found several centromeric satellite repeats >1 kb on chicken macrochromosomes. This raises the question as to how often tandem repeat arrays in heterochromatic regions, most of which are so far absent from genome assemblies, consist of repeats with units and subunits as large as those of crowSat1 (∼14 kb and ∼1.2 kb, respectively). As long as the sequencing and assembly of ultra-long reads (>100 kb) is still in its infancy (Miga 2015), hybrid OM approaches as suggested here are a useful tool to indirectly characterize putatively heterochromatic regions and directly anchor them into genome assemblies. This may broaden our perspective on genome structure not even achievable by current LR sequencing and enable a first glimpse into the most complex genomic regions that have been hidden from nonmodel genome assemblies thus far.
Recombination rate troughs coincide with RAMs and crowSat1
The centromere is a central structural feature of the chromosome governing meiotic recombination events across the chromosome (Dernburg et al. 1996; Grewal and Jia 2007; George and Alani 2012). Recombination is constrained both physically by the proximity to centromeric regions, where kinetochores attach during meiosis, and via histone modifications in centromeric regions (Grewal and Jia 2007). As a result, the broad-scale “recombination rate landscape” of a chromosome is expected to be highly heterogeneous (de Massy 2013), as has been demonstrated in a large variety of taxa (Myers 2005; Kulathinal et al. 2008; Baudat et al. 2010), including birds (Backström et al. 2010; Kawakami et al. 2014; Singhal et al. 2015). By estimating the population-scaled recombination rate ρ, we corroborate this notion in the Eurasian crow system and find values vastly differing within and across chromosomes, whereas the genome-wide median was similar between populations (1.09-fold difference). Note, however, that variation in the population-scaled recombination rate is not only governed by recombination rate r, but may partially reflect changes in the effective populations size Ne as well (ρ = 4Ner).
Both RAMs and the occurrence of crowSat1 were strongly associated with regions of reduced ρ (Fig. 3). In contrast, ρ next to scaffold ends in general was not significantly different from the genome-wide average (Fig. 4), indicating that smaller repetitive regions disrupting genome assembly are not necessarily associated with a drop in population-scaled recombination rate. Large tandem repeat arrays identified by RAM alignments might therefore serve as indicators for key features of chromosomal architecture influencing regional recombination rate. Crows of the genus Corvus usually exhibit a haploid chromosome number of 36–40 (Belterman and De Boer 1984; Roslik and Kryukov 2001), thus our result of 36 and 31 RAMs aligned to the SR and LR assembly, respectively, is within a range that could indeed suggest the presence of a structural feature. However, not every ρ trough was accompanied by a RAM alignment or associated with a crowSat1 sequence. In fact, in eight of 20 chromosomes exhibiting ρ troughs, RAMs or crowSat1 were absent (Supplemental Fig. S5). Recombination hotspots have been shown to be enriched in genomic regions associated with functional genomic elements (Singhal et al. 2015), and troughs may thus coincide with regions poor in functional elements. However, given the broad-scale resolution considered here, an alternative explanation may be more likely. Due to variation in the composition of centromeric heterochromatin differing in sequence motif and extent of repeats, many RAMs may simply have gone undetected (Plohl et al. 2014). In chicken, for example, the DNA content of centromeres is highly variable with chromosome-specific tandem repeat arrays and even tandem-repeat-free centromeres (Shang et al. 2010). We therefore expect that we detected many, but not all, putatively heterochromatic regions via RAMs, because the nickase recognition motif is unlikely to be present in all heterochromatic repeats. Our analysis of the few avian satellite repeats present in Repbase suggests that most lack the Nt.BspQI motif (most of these satellites are <2 kb) (Supplemental Table S5). A promising way forward to characterize additional tandem repeats will be the application of nickases with different recognition motifs (other nickases supported by the Irys system are Nb.BssSI, Nb.BbvCI, Nb.BsmI, and Nb.BsrDI). Furthermore, there is a current technical limit of visually separating two nickase motifs <2 kb apart on the Irys Instrument (Lam et al. 2012). Therefore, despite the recognition motif being present in the repeat sequence, it may not be visible in OM data as a tandem repeat if its size is <2 kb. Additionally, we note that other tandem repeats (simple repeats and low-complexity repeats) and TEs are likely undetectable with OM data due to their size and interspersed distribution, respectively. These appear to be well-resolved in the LR assembly, however (Supplemental Table S1). An exhaustive characterization of repetitive elements using all available data is necessary to improve our understanding of structural chromosomal features influencing recombination.
Our data overlap with previously noted peculiarities of the Eurasian crow speciation model (Poelstra et al. 2014). Both RAMs and crowSat1 were present at a previously uncharacterized assembly breakpoint on Chromosome 18 (Fig. 5), indicating a role of a structural genomic feature in the emergence of the most extreme peak of genetic differentiation between Eurasian carrion and hooded crows. The general association of RAMs and crowSat1 with genome-wide measures of nucleotide diversity and genetic differentiation further suggest that linked selection in proximity to candidate heterochromatic regions may contribute to heterogeneity in genetic diversity across the genome. This has been previously considered to be important (Roesti et al. 2012), and direct incorporation of genome architecture into nonmodel genome assemblies may now be finally feasible for other speciation genomic systems. We anticipate that this will shed light on the role of genome structure in shaping genome-wide variation both within and among populations.
Conclusions
Our results demonstrate the potential of combining independent technologies to discover previously inaccessible genomic features. By harnessing the power of long-range information of OM and LR sequencing, combined with recombination rate measures based on population SR resequencing, we were able to anchor complex structural features into the hooded crow genome assembly. With an emerging picture of genome architecture affecting the distribution of genetic diversity across genomes, the integration of large tandem repeat arrays into genome assemblies constitutes an important improvement.
Methods
As starting material, we used heparin-coated or EDTA-coated, cryopreserved blood samples of the hooded crow genome individual and a carrion crow individual. The hooded crow individual was sampled in Sweden (for sampling details, see Poelstra et al. 2014), the carrion crow individual originated from Southern Germany (sampling permission: Regierungspräsidium Freiburg [Aktenzeichen: 55-8852.15]).
OM assembly: DNA extraction, mapping experiment, and de novo assembly
Avian erythrocytes are nucleated and well suited to obtain high-quality DNA. In a first step, we isolated nuclei from approximately 50 million cells, estimated with the help of a hemocytometer, yielding a final target concentration of approximately 6 µg DNA per 75 µL cell suspension buffer. The nuclei solution was then suspended with PBS buffer, cell lysis buffer, and centrifuged twice for 15 min at 1300g. The nuclei were then embedded in low-melting point agarose plugs. After digestion with proteinase K, the agarose plugs containing high-molecular weight DNA were sent to a BioNano Genomics service provider to perform the mapping experiment (for description of the mapping experiment, see below).
After purifying the high-molecular weight DNA with drop dialysis, it was labeled following the IrysPrep Reagent Kit protocol (BioNano Genomics). In brief, the DNA was treated with a nicking endonuclease (Nt.BspQI) that inserts a fluorescent-labeled nick strand at a specific nucleotide recognition motif (5′-GCTCTTCN-3′). After counterstaining the DNA backbone with YOYO-1 dye, the sample was loaded onto an IrysChip, which consists of an array of nanochannels and linearizes the DNA. Fluorescent label detection was performed on the Irys instrument. Label locations of an individual DNA molecule constitute a single-molecule map. Two chips (four flow cells) were used for each sample. Owing to variation in the quality of starting material, single molecules of length >150 kb and >120 kb were chosen in a prefiltering step done by the service provider, for hooded and carrion crows, respectively.
De novo assembly of single-molecule maps was done using BioNano's Assembler (version 4687) based on an Overlap-Layout-Consensus paradigm (Anantharaman and Mishra 2001; Valouev et al. 2006; Xiao et al. 2007; Nguyen 2010). First, using BioNano's alignment program RefAligner (version 4687), we started with a pairwise comparison of all molecule maps longer than >120 kb and eight labels to find all overlaps with a probability of occurring by chance of P < 1 × 10⁻¹⁰, and we then constructed draft consensus OM contigs based on these overlaps. The draft OM contigs were refined by mapping single-molecule maps to them for recalculation of more accurate label positions. Next, the maps were extended by aligning overhanging single-molecule maps to the contigs and calculating a consensus in the extended regions. Finally, the consensus OM contigs were compared and merged where patterns matched with a probability of occurring by chance of P < 1 × 10⁻¹⁵ and with an aligned length of >80 kb. The process of extension and merge was repeated five times before reaching a final set of high-confidence OM contigs.
We used the OM assembly to perform hybrid scaffolding on both the SR and LR assemblies. First, the sequence assembly contigs or scaffolds were converted into sequence maps by running an “in silico digestion” based on the known Nt.BspQI recognition motif using the IrysView software (BioNano Genomics). Then, the in silico maps were aligned against OM contigs to identify conflicts in either data set. Conflicts are defined as five consecutive nickase labels outside the aligned portion between the two assemblies. These conflicts might indicate genuine allelic variants or assembly errors. After identification of conflicts, the hybrid scaffold pipeline examined single-molecule map coverage and chimeric quality scores around the conflict label on the OM contig for evidence of misassembly. We required a minimum coverage of 10 single-molecule maps and a minimum mapping score of 35. The reason we chose a coverage of 10 is that, for an assembly with a genome-wide coverage of 100×, we defined a (necessarily) arbitrary minimum of 10 supporting molecules; any lower value may be due to spurious alignments. As for a chimeric cutoff score of 35, we rationalize that at a homozygous region, nearly 100% of molecules should align fully (±55 kb) across the conflict junction, whereas at a heterozygous region, ∼50% of the molecules should align fully; hence, after accounting for any potential local fluctuation in coverage, a cutoff of 35% should be a reasonable minimum requirement. High coverage and high score would indicate that the OM contig was assembled correctly, and the sequence contig/scaffold was misassembled due to a chimeric join. Therefore, if the coverage and score around the conflicting label of the OM contig were lower than the cutoffs specified, the OM contig would be cut into halves at the conflict nickase label; however, if the coverage and score were higher than the cutoffs, the corresponding sequence contig/scaffold would be cut at its conflicting locus. The effect of the cut was to remove the chimeric joint. After all identified conflicts were resolved, the pipeline merged the sequence contigs/scaffolds and OM contigs to generate hybrid scaffolds; the merge process was performed using RefAligner with a P-value of 1 × 10⁻¹¹. We then aligned the sequence maps and the hybrid scaffolds, and generated AGP and FASTA files for the scaffolds.
LR assembly: DNA extraction, SMRT-sequencing, and de novo assembly
To acquire high-molecular weight DNA for SMRT-sequencing, we extracted DNA from the same cryopreserved blood sample of the hooded crow genome individual (for sampling details, see Poelstra et al. 2014) using a modified phenol-chloroform extraction protocol (Supplemental Methods). DNA was eluted in 10 mM Tris-Buffer and stored at 4°C. DNA concentration was measured with a Nanodrop spectrophotometer (ThermoFisherScientific) and visualized on a 0.5% agarose gel (run time >8 h with 25 V) to confirm high molecular weight.
Three DNA libraries were produced using the SMRTbell Template Prep Kit 1.0 (Pacific Biosciences) according to the manufacturer's instructions. In brief, 10 µg of genomic DNA per library was sheared into 20-kb fragments using the Hydroshear (ThermoFisherScientific) system, followed by an Exo VII treatment, DNA damage repair, and end-repair before ligation of hairpin adaptors to generate SMRTbell libraries for circular consensus sequencing. Libraries were then subjected to exonuclease treatment and PB AMPure bead wash procedures for cleanup before they were size-selected with the BluePippin system with a minimum cutoff value of 8500 bp. The libraries were sequenced on the PacBio RSII instrument using C4 chemistry and P6 polymerase and 240-min movie time in a total of 102 SMRTcells.
Of the resulting long-read sequencing data, we performed de novo assemblies using DALIGNER (Myers 2014) and FALCON (https://github.com/PacificBiosciences/FALCON) for local read alignment and string graph layout. In the first filtering step, reads <500 bp and a quality score below 0.75 were excluded using the SMRT Analysis 2.3.0 software. In the first step of the assembly, reads >8 kb were subject to error correction using DALIGNER. This resulted in 26 Gb of error corrected reads which is ∼10× coverage per haplotype. Then overlaps between the longer reads were used to generate a string graph with FALCON 0.4.2 software (https://github.com/PacificBiosciences/FALCON). A detailed description and all scripts are freely available at https://github.com/genomicrocosm/crowSat1_RAM and under Supplemental Scripts.
Repeat annotation
The two sequence assemblies were automatically annotated by RepeatMasker (version 4.0.6) (Smit et al. 1996) using a repeat library containing Repbase repeats (Bao et al. 2015); from chicken and zebra finch (Hillier et al. 2004; Warren et al. 2010), and curated hooded crow repeats (Vijay et al. 2016). The crowSat1 satellite repeat was initially identified in a sequence alignment of the end of scaffold_78 and the start of scaffold_60 from the SR assembly. The short repetitive sequence present in both scaffolds was used as a seed for a series of iterative BLASTN searches (Altschul et al. 1990) against the SR and LR assemblies. Each of the repetitions consisted of aligning the 20 best BLASTN hits with 2-kb flanks against the query sequence in MAFFT (version 7) (Katoh and Standley 2013) and manually generating a majority-rule consensus sequence (for review, see Platt et al. 2016). The resulting ∼14-kb crowSat1 consensus contains an internal palindrome of tandemly repeated ∼1.2-kb subunits at its 5′ end (Fig. 2D). These sequence similarity plots were generated using LAST (Kielbasa et al. 2011), implemented in the MAFFT web server (http://mafft.cbrc.jp/alignment/server/; threshold score = 39). We note that the crowSat1 consensus is putatively incomplete at its 3′ end owing to limitations in reconstructing such large and complex tandem repeats from available SR and LR assemblies.
Scaffold ordering
In the absence of a linkage map for the hooded crow, we made use of multiway synteny and collinearity to existing linkage map-based chromosome-level assemblies from closely related songbird species including zebra finch (Warren et al. 2010), collared flycatcher (Kawakami et al. 2014), and great tit (Laine et al. 2016). Multiple independent outgroups obviate biased syntenies and scaffold ordering arising from sole reliance on the zebra finch (as done in Poelstra et al. 2014), a bird species with many lineage-specific inversions (Kawakami et al. 2014; Romanov et al. 2014; Hooper and Price 2015). Single chromosomes of each genome were queried against the SR hooded crow genome assembly using LASTZ (parameters M=254 K=4500 L=3000 Y=15000 C=2 T=2 –matchcount=10000 –format=general:name1,start1,end1,length1,name2,start2,end2,strand2) (Harris 2007), and thereby SR scaffolds were assigned to chromosomes in each of the songbird outgroups. SR scaffolds were then ordered into crow in silico chromosomes. By principle of parsimony, we considered shared synteny and collinearity between two songbird outgroups as ancestral and therefore appropriate for inferring chromosomal synteny and scaffold ordering in the hooded crow. Overall, zebra finch had by far the most derived inversions. If ancestral synteny and collinearity remained inconclusive due to differences in each of the three songbird outgroups, we consulted our LASTZ results of the linkage map-based chromosome-level assembly of chicken (Hillier et al. 2004).
Localization of presumably heterochromatic regions in the optical map alignments
To isolate long, repetitive regions in OM contigs sensitive to restriction digest with the Nt.BspQI nickase, we screened for a pattern of short distance between nick sites repeated over a large distance. Regions were classified as repetitive if the density of nick sites in 20-kb windows exceeded the 5% percentile of the genome-wide distribution (8 nicks per 20-kb window or 0.004 nicks/bp) in at least five consecutive windows (100 kb). This corresponds to the minimum size of single-molecule maps (150 kb) used for the OM assembly and is also supported by visual inspection of molecule pileups—the alignment of single-molecule maps to assembled OM contigs. Repetitive regions larger than this are rarely spanned by single-molecule maps and therefore are unreliable. In addition to nick density, we identified repetitive regions in OM contigs via distance between nick sites. Whenever the distance between two nick sites was below a threshold of 5 kb (below the average of 6.3 kb in the in silico SR reference) across a cumulative distance of >100 kb, the respective OM contig was also reported as partially repetitive. The custom R and awk scripts used to implement the preceding approaches are freely available at https://github.com/genomicrocosm/crowSat1_RAM.
Estimation of population-scaled recombination rate
We estimated the population-scaled recombination rate ρ in 50-kb windows across the SR genome using the progam LDhelmet (Chan et al. 2012) for a hooded crow population from Sweden (15 individuals), which includes the genome individual (for details on population sampling, see Poelstra et al. 2014). Phased genotypes were taken from Vijay et al. (2016) and converted to the LDhelmet format using VCFtools (Danecek et al. 2011) and PLINK (Purcell et al. 2007). In the first step of the LDhelmet pipeline (“find_confs”), we generated a haplotype configuration file using all concatenated input files and computed the likelihood lookup tables using the haplotype configuration file and the population-scaled mutation rate θ estimates from Vijay et al. (2016). Following this, we computed the Padé coefficients from the haplotype configuration file, as recommended by LDhelmet. Then we computed mean ρ for every full 50 kb weighted by distance using default parameters (burn-in 100,000 iterations, MCMC chain: 1,000,000 iterations, block penalty: 50). The required mutation rate matrix was approximated from zebra finch substitution rates from Singhal et al. (2015). Windows <50 kb were excluded. To show that ρ troughs are not characterized by low genotype quality or mappability, we calculated the mean genotype quality and mappability (gem-mappability with k-mers = 200) (Derrien et al. 2012) per 50-kb window. To illustrate that the overall representation of the recombination rate landscape is largely independent of window size, we calculated the weighted mean of ρ per bp for Chromosome 18 for 5-kb and 50-kb windows using the carrion crow population (same chromosome and scale as in Fig. 5; Supplemental Fig. S8).
Statistical analyses
For statistical analyses investigating the relationship of structural genomic features with the population genetic parameters ρ, θW, and FST (the latter two estimates were obtained from Vijay et al. 2016), we log-transformed the data to obtain normally distributed residuals. For windows for which no value was available, we used values from an adjacent window in either direction. We took a mixed linear model approach with ρ, θW, and FST as dependent variables, presence or absence of RAMs and crowSat1 as fixed effect, and chromosome identity as random effect using the “car” and “lme4” packages in R (Fox and Weisberg 2011; Bates et al. 2015). First, we ran the analysis on the entire data set. Then, we reduced the data set to only windows next to scaffold ends and performed a type III ANOVA to test whether ρ, θW, and FST were influenced by the presence of RAMs or crowSat1. A detailed description of the pipeline and the analysis including all scripts are freely available at https://github.com/genomicrocosm/crowSat1_RAM.
Data access
The PacBio raw reads from this study have been submitted to the NCBI Sequence Read Archive (https://www.ncbi.nlm.nih.gov/sra/) under accession number SRP100076, different versions of assembled genomes to GenBank (https://www.ncbi.nlm.nih.gov/genbank/) under accession numbers JPSR00000000 (SR-based assemblies) and MVNZ00000000 (LR-based assemblies), and BioNano molecule files and BioNano maps to NCBI BioProject (https://www.ncbi.nlm.nih.gov/bioproject/) under accession number PRJNA358092. We uploaded all scripts to the GitHub repository (https://github.com/genomicrocosm/crowSat1_RAM) and the Supplemental Scripts. We submitted the consensus sequence of crowSat1 to Repbase (http://www.girinst.org/repbase/) under the Repbase ID “crowSat1” and included the Repbase entry as Supplemental File S1 and the sequence in FASTA format as Supplemental File S2.
Competing interest statement
Andy W.C. Pang is an employee of BioNano Genomics (San Diego, CA).
Supplementary Material
Acknowledgments
We thank Kicki Holmberg (SciLife Laboratory Solna) for an optical mapping wetlab tutorial, Homa Papoli Yazdi for helpful comments on the manuscript, Carina Mugal and Karl Grieshop for helpful discussions regarding the statistical analysis, Frida Oliv for discussing OM methodology, Kees-Jan Francois for helping out with the hybrid scaffolding, Takeshi Kawakami for his great support in the ρ estimation, and Susan Brown and Michelle Coleman for performing the mapping experiment. Douglas G. Scofield helped with between-nickase motif distance calculation, and Saurabh Dilip Pophaly helped with the mappability calculation. We are grateful for the access to the computational infrastructure provided by the UPPMAX Next-Generation Sequencing Cluster and Storage (UPPNEX) project, funded by the Knut and Alice Wallenberg Foundation and the Swedish National Infrastructure for Computing. This work was supported by the Swedish Research Council (grant number 621-2010-5553 to J.B.W.W.) and the European Research Council (grant number ERCStG-336536 to J.B.W.W.).
Author contributions: M.H.W., A.S., and J.B.W.W. designed the study; M.H.W., I.H., and O.V.-P. generated the data; M.H.W., A.S., I.B., and A.W.C.P. analyzed the data; and M.H.W., A.S., and J.B.W.W. wrote the paper with input from all other authors.
Footnotes
[Supplemental material is available for this article.]
Article published online before print. Article, supplemental material, and publication date are at http://www.genome.org/cgi/doi/10.1101/gr.215095.116.
References
- Altschul SF, Gish W, Miller W, Myers EW, Lipman DJ. 1990. Basic local alignment search tool. J Mol Biol 215: 403–410. [DOI] [PubMed] [Google Scholar]
- Anantharaman T, Mishra B. 2001. False positives in genomic map assembly and sequence validation. In Algorithms in bioinformatics first international workshop, WABI 2001, Århus, Denmark. [Google Scholar]
- Arbeithuber B, Betancourt AJ, Ebner T, Tiemann-Boege I. 2015. Crossovers are associated with mutation and biased gene conversion at recombination hotspots. Proc Natl Acad Sci 112: 2109–2114. [DOI] [PMC free article] [PubMed] [Google Scholar]
- Backström N, Forstmeier W, Schielzeth H, Mellenius H, Nam K, Bolund E, Webster MT, Öst T, Schneider M, Kempenaers B, et al. 2010. The recombination landscape of the zebra finch Taeniopygia guttata genome. Genome Res 20: 485–495. [DOI] [PMC free article] [PubMed] [Google Scholar]
- Bao W, Kojima KK, Kohany O. 2015. Repbase update, a database of repetitive elements in eukaryotic genomes. Mob DNA 6: 11. [DOI] [PMC free article] [PubMed] [Google Scholar]
- Bates D, Mächler M, Bolker B, Walker S. 2015. Fitting linear mixed-effects models using lme4. J Stat Softw 10.18637/jss.v067.i01. [DOI] [Google Scholar]
- Baudat F, Buard J, Grey C, Fledel-Alon A, Ober C, Przeworski M, Coop G, de Massy B. 2010. PRDM9 is a major determinant of meiotic recombination hotspots in humans and mice. Science 327: 836–840. [DOI] [PMC free article] [PubMed] [Google Scholar]
- Belterman RH, De Boer LE. 1984. A karyological study of 55 species of birds, including karyotypes of 39 species new to cytology. Genetica 65: 39–82. [Google Scholar]
- Berlin K, Koren S, Chin CS, Drake JP, Landolin JM, Phillippy AM. 2015. Assembling large genomes with single-molecule sequencing and locality-sensitive hashing. Nat Biotechnol 33: 623–630. [DOI] [PubMed] [Google Scholar]
- Bickhart DM, Rosen BD, Koren S, Sayre BL, Hastie AR, Chan S, Lee J, Lam ET, Liachko I, Sullivan ST, et al. 2016. Single-molecule sequencing and conformational capture enable de novo mammalian reference genomes. bioRxiv 10.1101/064352. [DOI] [Google Scholar]
- Burri R, Nater A, Kawakami T, Mugal CF, Olason PI, Smeds L, Suh A, Dutoit L, Bureš S, Garamszegi LZ, et al. 2015. Linked selection and recombination rate variation drive the evolution of the genomic landscape of differentiation across the speciation continuum of Ficedula flycatchers. Genome Res 25: 1656–1665. [DOI] [PMC free article] [PubMed] [Google Scholar]
- Carneiro M, Ferrand N, Nachman MW. 2008. Recombination and speciation: loci near centromeres are more differentiated than loci near telomeres between subspecies of the European rabbit (Oryctolagus cuniculus). Genetics 181: 593–606. [DOI] [PMC free article] [PubMed] [Google Scholar]
- Chaisson MJP, Wilson RK, Eichler EE. 2015. Genetic variation and the de novo assembly of human genomes. Nat Rev Genet 16: 627–640. [DOI] [PMC free article] [PubMed] [Google Scholar]
- Chan AH, Jenkins PA, Song YS. 2012. Genome-wide fine-scale recombination rate variation in Drosophila melanogaster. PLoS Genet 8: e1003090. [DOI] [PMC free article] [PubMed] [Google Scholar]
- Church DM, Goodstadt L, Hillier LW, Zody MC, Goldstein S, She X, Bult CJ, Agarwala R, Cherry JL, DiCuccio M, et al. 2009. Lineage-specific biology revealed by a finished genome assembly of the mouse. PLoS Biol 7: e1000112. [DOI] [PMC free article] [PubMed] [Google Scholar]
- Cutter AD, Payseur BA. 2013. Genomic signatures of selection at linked sites: unifying the disparity among species. Nat Rev Genet 14: 262–274. [DOI] [PMC free article] [PubMed] [Google Scholar]
- Damas J, O'Connor R, Farré M, Lenis VP, Martell HJ, Mandawala A, Fowler K, Joseph S, Swain MT, Griffin DK, et al. 2017. Upgrading short-read animal genome assemblies to chromosome level using comparative genomics and a universal probe set. Genome Res (this issue). 10.1101/gr.213660.116. [DOI] [PMC free article] [PubMed] [Google Scholar]
- Danecek P, Auton A, Abecasis G, Albers CA, Banks E, DePristo MA, Handsaker RE, Lunter G, Marth GT, Sherry ST, et al. 2011. The variant call format and VCFtools. Bioinformatics 27: 2156–2158. [DOI] [PMC free article] [PubMed] [Google Scholar]
- de Massy B. 2013. Initiation of meiotic recombination: how and where? Conservation and specificities among eukaryotes. Annu Rev Genet 47: 563–599. [DOI] [PubMed] [Google Scholar]
- Dernburg AF, Sedat JW, Hawley RS. 1996. Direct evidence of a role for heterochromatin in meiotic chromosome segregation. Cell 86: 135–146. [DOI] [PubMed] [Google Scholar]
- Derrien T, Estellé J, Marco Sola S, Knowles DG, Raineri E, Guigó R, Ribeca P. 2012. Fast computation and applications of genome mappability. PLoS One 7: e30377. [DOI] [PMC free article] [PubMed] [Google Scholar]
- Eichler EE, Clark RA, She X. 2004. An assessment of the sequence gaps: unfinished business in a finished human genome. Nat Rev Genet 5: 345–354. [DOI] [PubMed] [Google Scholar]
- Eid J, Fehr A, Gray J, Luong K, Lyle J, Otto G, Peluso P, Rank D, Baybayan P, Bettman B, et al. 2009. Real-time DNA sequencing from single polymerase molecules. Science 323: 133–138. [DOI] [PubMed] [Google Scholar]
- Ekblom R, Wolf JB. 2014. A field guide to whole-genome sequencing, assembly and annotation. Evol Appl 7: 1026–1042. [DOI] [PMC free article] [PubMed] [Google Scholar]
- Ellegren H. 2013. The evolutionary genomics of birds. Annu Rev Ecol Evol Syst 44: 239–259. [Google Scholar]
- Ellegren H. 2014. Genome sequencing and population genomics in non-model organisms. Trends Ecol Evol 29: 51–63. [DOI] [PubMed] [Google Scholar]
- Ellegren H, Galtier N. 2016. Determinants of genetic diversity. Nat Rev Genet 17: 422–433. [DOI] [PubMed] [Google Scholar]
- Fedorova E, Zink D. 2008. Nuclear architecture and gene regulation. Biochim Biophys Acta 1783: 2174–2184. [DOI] [PubMed] [Google Scholar]
- Fox J, Weisberg S. 2011. An R companion to applied regression, 2nd ed Sage, Los Angeles. [Google Scholar]
- George CM, Alani E. 2012. Multiple cellular mechanisms prevent chromosomal rearrangements involving repetitive DNA. Crit Rev Biochem Mol Biol 47: 297–313. [DOI] [PMC free article] [PubMed] [Google Scholar]
- Gordon D, Huddleston J, Chaisson MJ, Hill CM, Kronenberg ZN, Munson KM, Malig M, Raja A, Fiddes I, Hillier LW, et al. 2016. Long-read sequence assembly of the gorilla genome. Science 352: aae0344. [DOI] [PMC free article] [PubMed] [Google Scholar]
- Grewal SIS, Jia S. 2007. Heterochromatin revisited. Nat Rev Genet 8: 35–46. [DOI] [PubMed] [Google Scholar]
- Harris RS. 2007. “Improved pairwise alignment of genomic DNA.” PhD thesis, Pennsylvania State University, State College, PA. [Google Scholar]
- Henikoff S, Ahmad K, Malik HS. 2001. The centromere paradox: stable inheritance with rapidly evolving DNA. Science 293: 1098–1102. [DOI] [PubMed] [Google Scholar]
- Hillier LW, Miller W, Birney E, Warren W, Hardison RC, Ponting CP, Bork P, Burt DW, Groenen MA, Delany ME, et al. 2004. Sequence and comparative analysis of the chicken genome provide unique perspectives on vertebrate evolution. Nature 432: 695–716. [DOI] [PubMed] [Google Scholar]
- Hooper DM, Price TD. 2015. Rates of karyotypic evolution in Estrildid finches differ between island and continental clades: chromosome inversions in finches. Evolution 69: 890–903. [DOI] [PubMed] [Google Scholar]
- Kamath GM, Shomorony I, Xia F, Courtade TA, Tse DN. 2016. HINGE: long-read assembly achieves optimal repeat resolution. Genome Res (this issue). 10.1101/gr.216465.116. [DOI] [PMC free article] [PubMed] [Google Scholar]
- Kapusta A, Suh A. 2016. Evolution of bird genomes—a transposon's-eye view. Ann N Y Acad Sci 1389: 164–185. [DOI] [PubMed] [Google Scholar]
- Katoh K, Standley DM. 2013. MAFFT multiple sequence alignment software version 7: improvements in performance and usability. Mol Biol Evol 30: 772–780. [DOI] [PMC free article] [PubMed] [Google Scholar]
- Kawakami T, Smeds L, Backström N, Husby A, Qvarnström A, Mugal CF, Olason P, Ellegren H. 2014. A high-density linkage map enables a second-generation collared flycatcher genome assembly and reveals the patterns of avian recombination rate variation and chromosomal evolution. Mol Ecol 23: 4035–4058. [DOI] [PMC free article] [PubMed] [Google Scholar]
- Kielbasa SM, Wan R, Sato K, Horton P, Frith MC. 2011. Adaptive seeds tame genomic sequence comparison. Genome Res 21: 487–493. [DOI] [PMC free article] [PubMed] [Google Scholar]
- Koepfli KP, Paten B; Genome 10K Community of Scientists, O'Brien SJ. 2015. The Genome 10K Project: a way forward. Annu Rev Anim Biosci 3: 57–111. [DOI] [PMC free article] [PubMed] [Google Scholar]
- Kulathinal RJ, Bennett SM, Fitzpatrick CL, Noor MA. 2008. Fine-scale mapping of recombination rate in Drosophila refines its correlation to diversity and divergence. Proc Natl Acad Sci 105: 10051–10056. [DOI] [PMC free article] [PubMed] [Google Scholar]
- Laine VN, Gossmann TI, Schachtschneider KM, Garroway CJ, Madsen O, Verhoeven KJ, de Jager V, Megens HJ, Warren WC, Minx P, et al. 2016. Evolutionary signals of selection on cognition from the great tit genome and methylome. Nat Commun 7: 10474. [DOI] [PMC free article] [PubMed] [Google Scholar]
- Lam ET, Hastie A, Lin C, Ehrlich D, Das SK, Austin MD, Deshpande P, Cao H, Nagarajan N, Xiao M, et al. 2012. Genome mapping on nanochannel arrays for structural variation analysis and sequence assembly. Nat Biotechnol 30: 771–776. [DOI] [PMC free article] [PubMed] [Google Scholar]
- Lieberman-Aiden E, van Berkum NL, Williams L, Imakaev M, Ragoczy T, Telling A, Amit I, Lajoie BR, Sabo PJ, Dorschner MO, et al. 2009. Comprehensive mapping of long-range interactions reveals folding principles of the human genome. Science 326: 289–293. [DOI] [PMC free article] [PubMed] [Google Scholar]
- Lindholm AK, Dyer KA, Firman RC, Fishman L, Forstmeier W, Holman L, Johannesson H, Knief U, Kokko H, Larracuente AM, et al. 2016. The ecology and evolutionary dynamics of meiotic drive. Trends Ecol Evol 31: 315–326. [DOI] [PubMed] [Google Scholar]
- Miga KH. 2015. Completing the human genome: the progress and challenge of satellite DNA assembly. Chromosome Res 23: 421–426. [DOI] [PubMed] [Google Scholar]
- Miga KH, Newton Y, Jain M, Altemose N, Willard HF, Kent WJ. 2014. Centromere reference models for human chromosomes X and Y satellite arrays. Genome Res 24: 697–707. [DOI] [PMC free article] [PubMed] [Google Scholar]
- Myers S. 2005. A fine-scale map of recombination rates and hotspots across the human genome. Science 310: 321–324. [DOI] [PubMed] [Google Scholar]
- Myers G. 2014. Efficient local alignment discovery amongst noisy long reads. In Algorithms in bioinformatics (ed. Brown D, Morgenstern B), pp. 52–67. Springer, Berlin Heidelberg, Germany. [Google Scholar]
- Nagarajan N, Pop M. 2013. Sequence assembly demystified. Nat Rev Genet 14: 157–167. [DOI] [PubMed] [Google Scholar]
- Nguyen JV. 2010. “Genomic mapping: a statistical and algorithmic analysis of the optical mapping system.” Doctoral dissertation, University of Southern California, Los Angeles. [Google Scholar]
- Pendleton M, Sebra R, Pang AW, Ummat A, Franzen O, Rausch T, Stütz AM, Stedman W, Anantharaman T, Hastie A, et al. 2015. Assembly and diploid architecture of an individual human genome via single-molecule technologies. Nat Methods 12: 780–786. [DOI] [PMC free article] [PubMed] [Google Scholar]
- Peng JC, Karpen GH. 2008. Epigenetic regulation of heterochromatic DNA stability. Curr Opin Genet Dev 18: 204–211. [DOI] [PMC free article] [PubMed] [Google Scholar]
- Phillippy AM, Schatz MC, Pop M. 2008. Genome assembly forensics: finding the elusive mis-assembly. Genome Biol 9: R55. [DOI] [PMC free article] [PubMed] [Google Scholar]
- Platt RN, Blanco-Berdugo L, Ray DA. 2016. Accurate transposable element annotation is vital when analyzing new genome assemblies. Genome Biol Evol 8: 403–410. [DOI] [PMC free article] [PubMed] [Google Scholar]
- Plohl M, Meštrović N, Mravinac B. 2014. Centromere identity from the DNA point of view. Chromosoma 123: 313–325. [DOI] [PMC free article] [PubMed] [Google Scholar]
- Poelstra JW, Vijay N, Bossu CM, Lantz H, Ryll B, Müller I, Baglione V, Unneberg P, Wikelski M, Grabherr MG, et al. 2014. The genomic landscape underlying phenotypic integrity in the face of gene flow in crows. Science 344: 1410–1414. [DOI] [PubMed] [Google Scholar]
- Poelstra JW, Vijay N, Hoeppner MP, Wolf JB. 2015. Transcriptomics of colour patterning and coloration shifts in crows. Mol Ecol 24: 4617–4628. [DOI] [PubMed] [Google Scholar]
- Purcell S, Neale B, Todd-Brown K, Thomas L, Ferreira MA, Bender D, Maller J, Sklar P, de Bakker PI, Daly MJ, et al. 2007. PLINK: a tool set for whole-genome association and population-based linkage analyses. Am J Hum Genet 81: 559–575. [DOI] [PMC free article] [PubMed] [Google Scholar]
- Roesti M, Hendry AP, Salzburger W, Berner D. 2012. Genome divergence during evolutionary diversification as revealed in replicate lake–stream stickleback population pairs. Mol Ecol 21: 2852–2862. [DOI] [PubMed] [Google Scholar]
- Roesti M, Moser D, Berner D. 2013. Recombination in the threespine stickleback genome—patterns and consequences. Mol Ecol 22: 3014–3027. [DOI] [PubMed] [Google Scholar]
- Romanov MN, Farré M, Lithgow PE, Fowler KE, Skinner BM, O'Connor R, Fonseka G, Backström N, Matsuda Y, Nishida C, et al. 2014. Reconstruction of gross avian genome structure, organization and evolution suggests that the chicken lineage most closely resembles the dinosaur avian ancestor. BMC Genomics 15: 1060. [DOI] [PMC free article] [PubMed] [Google Scholar]
- Roslik GV, Kryukov AP. 2001. A karyological study of some corvine birds (Corvidae, Aves). Russ J Genet 37: 796–806. [PubMed] [Google Scholar]
- Rudd MK, Willard HF. 2004. Analysis of the centromeric regions of the human genome assembly. Trends Genet 20: 529–533. [DOI] [PubMed] [Google Scholar]
- Saksouk N, Simboeck E, Déjardin J. 2015. Constitutive heterochromatin formation and transcription in mammals. Epigenetics Chromatin 8: 3. [DOI] [PMC free article] [PubMed] [Google Scholar]
- Sevim V, Bashir A, Chin CS, Miga KH. 2016. Alpha-CENTAURI: assessing novel centromeric repeat sequence variation with long read sequencing. Bioinformatics 32: 1921–1924. [DOI] [PMC free article] [PubMed] [Google Scholar]
- Shang WH, Hori T, Toyoda A, Kato J, Popendorf K, Sakakibara Y, Fujiyama A, Fukagawa T. 2010. Chickens possess centromeres with both extended tandem repeats and short non-tandem-repetitive sequences. Genome Res 20: 1219–1228. [DOI] [PMC free article] [PubMed] [Google Scholar]
- Singhal S, Leffler EM, Sannareddy K, Turner I, Venn O, Hooper DM, Strand AI, Li Q, Raney B, Balakrishnan CN, et al. 2015. Stable recombination hotspots in birds. Science 350: 928–932. [DOI] [PMC free article] [PubMed] [Google Scholar]
- Smit AF, Hubley R, Green P. 1996. RepeatMasker Open-3.0. http://www.repeatmasker.org/.
- Smith CD, Shu S, Mungall CJ, Karpen GH. 2007. The release 5.1 annotation of Drosophila melanogaster heterochromatin. Science 316: 1586–1591. [DOI] [PMC free article] [PubMed] [Google Scholar]
- Staňková H, Hastie AR, Chan S, Vrána J, Tulpová Z, Kubaláková M, Visendi P, Hayashi S, Luo M, Batley J, et al. 2016. BioNano genome mapping of individual chromosomes supports physical mapping and sequence assembly in complex plant genomes. Plant Biotechnol J 14: 1523–1531. [DOI] [PMC free article] [PubMed] [Google Scholar]
- Steinberg KM, Graves-Lindsay T, Schneider VA, Chaisson MJP, Tomlinson C, Huddleston JL, Minx P, Kremitzki M, Albrecht D, Magrini V, et al. 2016. High-quality assembly of an individual of Yoruban descent. bioRxiv 10.1101/067447. [DOI] [Google Scholar]
- Stumpf MP, McVean GA. 2003. Estimating recombination rates from population-genetic data. Nat Rev Genet 4: 959–968. [DOI] [PubMed] [Google Scholar]
- Thomma BP, Seidl MF, Shi-Kunne X, Cook DE, Bolton MD, van Kan JA, Faino L. 2016. Mind the gap; seven reasons to close fragmented genome assemblies. Fungal Genet Biol 90: 24–30. [DOI] [PubMed] [Google Scholar]
- Valouev A, Schwartz DC, Zhou S, Waterman MS. 2006. An algorithm for assembly of ordered restriction maps from single DNA molecules. Proc Natl Acad Sci 103: 15770–15775. [DOI] [PMC free article] [PubMed] [Google Scholar]
- Venturini G, D'Ambrogi R, Capanna E. 1986. Size and structure of the bird genome—I. DNA content of 48 species of neognathae. Comp Biochem Physiol Part B Comp Biochem 85: 61–65. [DOI] [PubMed] [Google Scholar]
- Vij S, Kuhl H, Kuznetsova IS, Komissarov A, Yurchenko AA, Heusden PV, Singh S, Thevasagayam NM, Prakki SR, Purushothaman K, et al. 2016. Chromosomal-level assembly of the Asian seabass genome using long sequence reads and multi-layered scaffolding. PLoS Genet 12: e1005954. [DOI] [PMC free article] [PubMed] [Google Scholar]
- Vijay N, Bossu CM, Poelstra JW, Weissensteiner MH, Suh A, Kryukov AP, Wolf JB. 2016. Evolution of heterogeneous genome differentiation across multiple contact zones in a crow species complex. Nat Commun 7: 13195. [DOI] [PMC free article] [PubMed] [Google Scholar]
- Warren WC, Clayton DF, Ellegren H, Arnold AP, Hillier LW, Künstner A, Searle S, White S, Vilella AJ, Fairley S, et al. 2010. The genome of a songbird. Nature 464: 757–762. [DOI] [PMC free article] [PubMed] [Google Scholar]
- Willard HF. 1991. Evolution of alpha satellite. Curr Opin Genet Dev 1: 509–514. [DOI] [PubMed] [Google Scholar]
- Wolf JB, Ellegren H. 2017. Making sense of genomic islands of differentiation in light of speciation. Nat Rev Genet 18: 87–100. [DOI] [PubMed] [Google Scholar]
- Xiao M, Phong A, Ha C, Chan TF, Cai D, Leung L, Wan E, Kistler AL, DeRisi JL, Selvin PR, et al. 2007. Rapid DNA mapping by fluorescent single molecule detection. Nucleic Acids Res 35: e16. [DOI] [PMC free article] [PubMed] [Google Scholar]
- Yandell M, Ence D. 2012. A beginner's guide to eukaryotic genome annotation. Nat Rev Genet 13: 329–342. [DOI] [PubMed] [Google Scholar]
- Zanders SE, Eickbush MT, Yu JS, Kang JW, Fowler KR, Smith GR, Malik HS. 2014. Genome rearrangements and pervasive meiotic drive cause hybrid infertility in fission yeast. eLife 3: e02630. [DOI] [PMC free article] [PubMed] [Google Scholar]
Associated Data
This section collects any data citations, data availability statements, or supplementary materials included in this article.