Significance
In response to chronic pressure overload, the heart undergoes pathological hypertrophy associated with adverse remodeling, fibrosis, and cardiac dysfunction. Caveolae, membrane invaginations that organize protective signaling pathways and provide a reservoir to buffer membrane tension, can ameliorate maladaptive hypertrophy. However, the factors that govern caveolae assembly in the heart are not fully understood. Here, we report that the fibroblast growth factor (FGF) homologous factor FGF13 is a negative regulator of caveolae density in cardiomyocytes. Adult mice lacking FGF13 in the heart have increased caveolae abundance in cardiomyocytes and are thereby protected from the pathological effects of chronic pressure overload. Our findings, identifying an unexpected role for FGF13, provide insight into the mechanisms underlying caveolae-mediated adaptation to cardiac stress.
Keywords: FGF13, caveolae, cavin, cardiac hypertrophy, mechanoprotection
Abstract
The fibroblast growth factor (FGF) homologous factor FGF13, a noncanonical FGF, has been best characterized as a voltage-gated Na+ channel auxiliary subunit. Other cellular functions have been suggested, but not explored. In inducible, cardiac-specific Fgf13 knockout mice, we found—even in the context of the expected reduction in Na+ channel current—an unanticipated protection from the maladaptive hypertrophic response to pressure overload. To uncover the underlying mechanisms, we searched for components of the FGF13 interactome in cardiomyocytes and discovered the complete set of the cavin family of caveolar coat proteins. Detailed biochemical investigations showed that FGF13 acts as a negative regulator of caveolae abundance in cardiomyocytes by controlling the relative distribution of cavin 1 between the sarcolemma and cytosol. In cardiac-specific Fgf13 knockout mice, cavin 1 redistribution to the sarcolemma stabilized the caveolar structural protein caveolin 3. The consequent increase in caveolae density afforded protection against pressure overload-induced cardiac dysfunction by two mechanisms: (i) enhancing cardioprotective signaling pathways enriched in caveolae, and (ii) increasing the caveolar membrane reserve available to buffer membrane tension. Thus, our results uncover unexpected roles for a FGF homologous factor and establish FGF13 as a regulator of caveolae-mediated mechanoprotection and adaptive hypertrophic signaling.
Fibroblast growth factor (FGF) homologous factors (FHFs), encoded by four genes in the FGF superfamily (FGF11–14) (1), share a core domain with homology to canonical FGFs, but FHFs are not secreted, do not bind or activate FGF receptors, and do not function as growth factors (2). Instead, FHFs bind directly to voltage-gated Na+ channels, modulating channel gating and trafficking (3, 4). Widely expressed in the brain (1), FHFs have been implicated in neurologic diseases such as spinocerebellar ataxia 27, caused by missense mutations in FGF14 that diminish Na+ channel current, disrupt channel localization, and impair neuronal excitability (5–7).
In addition to their broad distribution in the central nervous system, FHFs are expressed in the mammalian heart (1). Their roles in regulating cardiac function, however, have only been recently investigated. We showed that FGF13, the predominant FHF in rodent heart and a common transcript in human heart (8), directly binds to the C terminus of cardiac NaV1.5 Na+ channels, and thereby regulates current density and conduction velocity by affecting channel gating and surface expression (9). Similarly, mutations that disrupt interaction between NaV1.5 and FGF12, the major human cardiac FHF, have been linked to life-threatening arrhythmia syndromes (8, 10). In addition to regulating Na+ channels, FHFs can modulate voltage-gated Ca2+ channels (11, 12). Fgf13 knockdown in adult rodent ventricular cardiomyocytes decreased CaV1.2 current density, perturbed CaV1.2 localization at the dyad, and thereby affected Ca2+-induced Ca2+ release (11). Because previous studies were conducted in cultured cardiomyocytes, however, the in vivo roles for FHFs in the heart have yet to be fully elucidated. We recently generated an inducible, cardiac-specific Fgf13 knockout (KO) mouse and characterized the consequences of Fgf13 ablation on cardiac electrical activity. Consistent with our previous findings, Fgf13 KO in adult mouse heart reduced NaV1.5 current and increased susceptibility to flecainide-induced ventricular arrhythmias (13). In contrast, CaV1.2 current density was unaffected, suggesting compensatory changes in vivo not apparent after acute knockdown.
Based on our findings confirming Na+ channel dysfunction after inducible Fgf13 ablation in adult heart and the established connection between dilated cardiomyopathy and loss-of-function mutations in the cardiac Na+ channel SCN5A (14), we hypothesized that Fgf13 KO mice would exhibit impaired cardiac function and pathological cardiac hypertrophy under stress. Here, we investigated the role of FGF13 in cardiac hypertrophy using a model of pressure overload induced by transverse aortic constriction (TAC). Unexpectedly, we found that, despite developing hypertrophy, Fgf13 KO hearts maintained preserved cardiac function associated with reduced fibrosis and up-regulation of adaptive hypertrophic signaling pathways. To determine the molecular mechanism for this unexpected phenotype, we performed an unbiased proteomic screen for additional FHF interactors in heart and discovered that FGF13 interacts with cavins, a family of secondary caveolae structural proteins. Extensive analyses revealed an unexpected FGF13 function as a negative regulator of cardiomyocyte caveolae density. Caveolae, flask-shaped cholesterol-rich invaginations of the sarcolemmal membrane, play important roles in cardiac hypertrophy and mechanoprotection by serving as membrane reservoirs to buffer increases in membrane tension (15, 16). Using biochemical, electron microscopy, and functional assays, we demonstrate that Fgf13 KO in adult hearts not only increased caveolae density but also enhanced mechanoprotection of cardiomyocytes in the setting of increased ventricular loading. These effects, independent of Na+ channel regulation, reveal unexpected functions for an FHF. Importantly, our results also establish FGF13 as a regulator of cardiac hypertrophy and suggest a cardioprotective benefit to inhibition of FHFs in the adult heart in the setting of maladaptive hypertrophy.
Results
Fgf13 KO Hearts Maintain Cardiac Function in Response to Chronic Pressure Overload.
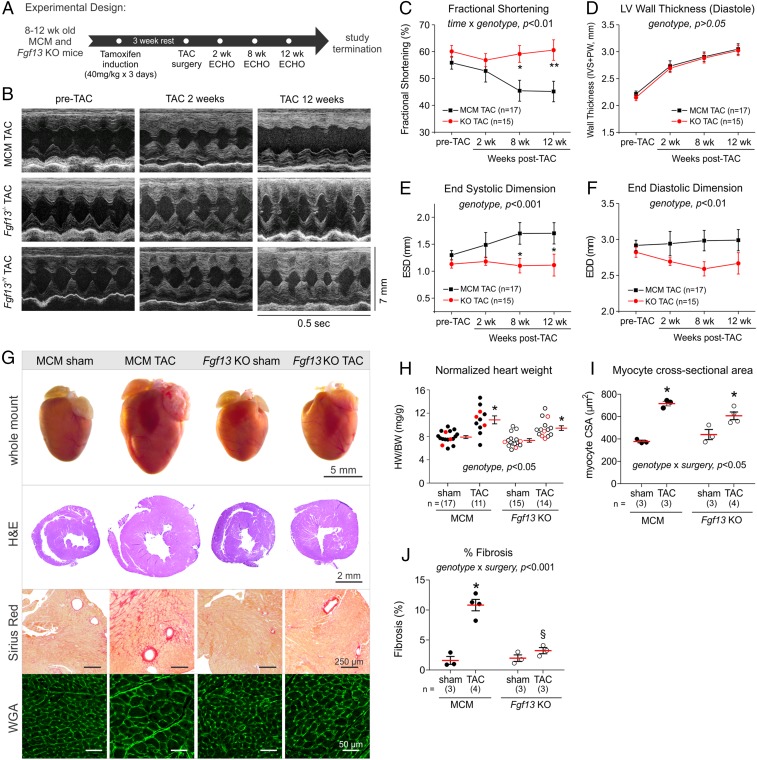
To generate inducible cardiac-specific Fgf13 KO mice, we crossed mice with floxed Fgf13 alleles to Myh6-MerCreMer (MCM) mice (17), which have an α-myosin heavy-chain (Myh6) promoter directing expression of a tamoxifen-inducible Cre recombinase (13). Male hemizygous (Fgf13−/Y) or female homozygous (Fgf13−/−) KO mice and MCM controls (8–12 wk old) were induced with tamoxifen and allowed 3 wk to recover (Fig. 1A). Measurement of FGF13 protein by Western blot and Fgf13 transcript level by quantitative PCR (qPCR) demonstrated efficient inducible deletion of FGF13 (∼95% ablation) from cardiomyocytes (Fig. S1). Because the Fgf13 gene is on the X chromosome, we first assessed whether sex contributed to baseline functional differences. Echocardiography showed no differences in fractional shortening in Fgf13−/Y compared with Fgf13−/− mice (Fig. 1B and Fig. S2A). Moreover, compared with tamoxifen-treated MCM, KO hearts showed no significant differences in fractional shortening or left ventricular wall thickness at baseline (Fig. 1 B–D and Table S1). Considering the observed reduction in Na+ channel current density (13), the absence of a baseline detrimental effect on ventricular function was unanticipated.
Fig. 1.
Fgf13 KO preserves cardiac function, attenuates cardiac dilation, and reduces fibrosis in response to chronic pressure overload. (A) Experimental design timeline for tamoxifen induction, TAC surgery, and serial echocardiograms. (B) Representative M-mode echocardiograms from tamoxifen-induced Myh6-MerCreMer (MCM), female homozygous KO (Fgf13−/−), and male hemizygous KO (Fgf13−/Y) mice pre-TAC (Left), 2 wk post-TAC (Middle), and 12 wk post-TAC (Right). (C–F) Summarized echocardiographic measurements of (C) fractional shortening; (D) diastolic wall thickness [interventricular septum (IVS) + posterior wall (PW)]; (E) end-systolic dimension (ESD); and (F) end-diastolic dimension (EDD) from pre-TAC to 12 wk post-TAC. Plots show means and SEM. Two-way repeated-measures ANOVA was used to assess effects of genotype, time, and genotype by time interaction. Comparisons between genotypes at each time point were made using Holm–Sidak’s test for multiple comparisons; *P < 0.05, **P < 0.01 for MCM TAC vs. Fgf13 KO TAC at each time point. See Tables S1–S3 for complete echocardiographic measurements. (G) Whole mount of representative hearts from sham and TAC MCM and Fgf13 KO mice 12 wk post-TAC. Histological sections were stained with hematoxylin/eosin, Sirius red, and wheat germ agglutinin (WGA). (H) Heart weight/body weight ratios; (I) myocyte cross-sectional area (CSA); and (J) percentage fibrosis for MCM and Fgf13 KO mice 12 wk post-TAC or sham surgery. Hearts from mice labeled by the red points in H were used for CSA analysis in I. Two-way ANOVA with Sidak’s test for multiple comparisons was used to assess effects of genotype, surgery, and genotype by surgery interaction. *P < 0.05 vs. sham for respective genotype; §P < 0.05 vs. MCM TAC.
Fig. S1.
Fgf13 KO efficacy. (A) Representative Western blots for FGF13 in left ventricular whole-cell lysates from MCM and Fgf13 KO (Fgf13−/− or Fgf13−/Y) mice 12 wk post-TAC or sham. (B) Densitometry of FGF13 protein from blots in Left of A. (C) Fgf13 gene expression. *P < 0.01 vs. MCM sham, two-way ANOVA with Sidak’s multiple-comparison test.
Fig. S2.
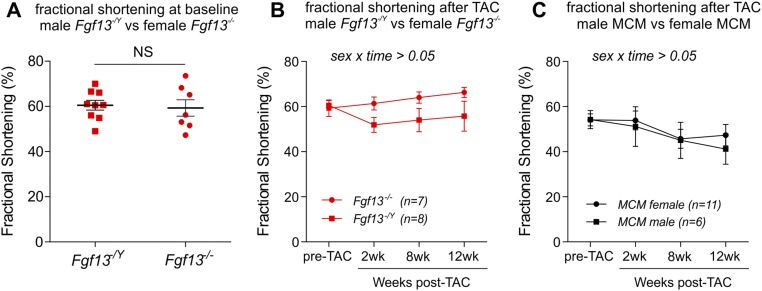
Effect of sex on fractional shortening. (A) Fractional shortening at baseline (pre-TAC) in male hemizygous KO (Fgf13−/Y) vs. female homozygous KO (Fgf13−/−) mice, 3 wk after tamoxifen induction. Unpaired Student’s t test showed no significant effect of sex on baseline cardiac function in Fgf13 KO mice. (B) Fractional shortening at 2, 8, and 12 wk post-TAC in male Fgf13−/Y vs. female Fgf13−/− mice. (C) Fractional shortening at 2, 8, and 12 wk post-TAC in male MCM vs. female MCM mice. Two-way ANOVA showed no significant effect of sex on the response to TAC (sex by time interaction) in Fgf13 KO or MCM.
Table S1.
Echocardiographic measurements
| ECHO parameters | pre-TAC | TAC 2w | TAC 8w | TAC 12w |
| MCM | ||||
| LVDd, mm | 2.92 ± 0.07 | 2.94 ± 0.17 | 2.98 ± 0.14 | 2.99 ± 0.15 |
| LVDs, mm | 1.35 ± 0.09 | 1.49 ± 0.23 | 1.70 ± 0.20 | 1.70 ± 0.20 |
| IVSW, mm | 1.12 ± 0.03 | 1.40 ± 0.04 | 1.49 ± 0.04 | 1.56 ± 0.04 |
| PW, mm | 1.04 ± 0.03 | 1.33 ± 0.07 | 1.41 ± 0.06 | 1.49 ± 0.06 |
| HR, bpm | 647 ± 21 | 640 ± 23 | 663 ± 17 | 688 ± 12 |
| FS, % | 54.3 ± 2.1 | 52.8 ± 4.1 | 45.4 ± 3.9 | 45.1 ± 3.8 |
| n | 18 | 18 | 18 | 17 |
| Fgf13 KO | ||||
| LVDd, mm | 2.84 ± 0.05 | 2.68 ± 0.05 | 2.57 ± 0.10 | 2.65 ± 0.15 |
| LVDs, mm | 1.14 ± 0.07 | 1.16 ± 0.07 | 1.08 ± 0.13* | 1.10 ± 0.20* |
| IVSW, mm | 1.14 ± 0.03 | 1.38 ± 0.04 | 1.49 ± 0.04 | 1.57 ± 0.06 |
| PW, mm | 1.03 ± 0.03 | 1.32 ± 0.05 | 1.40 ± 0.06 | 1.46 ± 0.05 |
| HR, bpm | 700 ± 11 | 679 ± 17 | 701 ± 10 | 713 ± 11 |
| FS, % | 60.0 ± 2.0 | 56.8 ± 2.4 | 59.1 ± 3.1* | 60.6 ± 3.8** |
| n | 16 | 16 | 16 | 15 |
FS, fractional shortening; HR, heart rate; IVSW, interventricular septal wall thickness; LVDd, left ventricular dimension at diastole; LVDs, left ventricular dimension at systole; PW, posterior wall thickness. Values are expressed as mean ± SEM. *P < 0.05, **P < 0.01 vs. MCM at corresponding time point after TAC. Comparisons were made using two-way repeated-measures ANOVA with Holm–Sidak’s test for multiple comparisons.
We therefore attempted to elicit a phenotype in the Fgf13 KO animals in response to stress by performing TAC (18). Serial echocardiographic measurements of left ventricular wall thicknesses revealed that Fgf13 KO and MCM mice developed a similar degree of ventricular wall thickening in response to pressure overload (Fig. 1D and Table S1). As anticipated, MCM mice demonstrated a progressive decline in fractional shortening and chamber enlargement after 8 wk of TAC (Fig. 1 B–F), consistent with decompensated hypertrophy. Unexpectedly, Fgf13 KO mice exhibited preserved contractile function and attenuation of cardiac dilation at 12 wk post-TAC (Fig. 1 B–F). This protective response was present in both Fgf13−/Y and Fgf13−/− mice subjected to the same range of systolic pressure gradients as MCM controls (Fig. S2B and Table S2); we therefore combined Fgf13−/Y and Fgf13−/− mice for further analyses.
Table S2.
Hemodynamic measurements
| Hemodynamics | MCM TAC 12w | KO TAC 12w |
| SP (proximal), mmHg | 165 ± 18 | 174 ± 16 |
| SP (distal), mmHg | 119 ± 16 | 129 ± 11 |
| SP gradient, mmHg | 45.4 ± 5.4 | 44.5 ± 8.8 |
| n | 7 | 6 |
SP, systolic pressure.
Fgf13 KO Attenuates Cardiac Enlargement and Reduces Fibrosis.
Histological analyses in the Fgf13 KO animals were consistent with the observed preservation of cardiac function in the face of increased cardiac stress. MCM TAC hearts were markedly enlarged compared with sham hearts by gross inspection, hematoxylin and eosin staining, and measurements of heart weight-to-body weight ratio and myocyte cross-sectional area (Fig. 1 G–I and Table S3). In contrast, although Fgf13 KO heart mass increased after TAC, the degree of hypertrophic growth was more modest, as reflected by an attenuated increase in myocyte cross-sectional area (Fig. 1 G–I). Furthermore, Sirius red staining revealed significantly less interstitial and perivascular fibrosis in KO TAC compared with MCM TAC hearts (Fig. 1J).
Table S3.
Organ morphometry measurements
| MCM | Fgf13 KO | |||
| Organ morphometry | Sham 12w | TAC 12w | Sham 12w | TAC 12w |
| BW, g | 27.9 ± 0.8 | 27.8 ± 1.0 | 25.2 ± 1.2 | 25.2 ± 0.7 |
| HW, mg | 218 ± 6 | 298 ± 18* | 182 ± 8 | 239 ± 12* |
| HW/BW, mg/g | 7.9 ± 0.3 | 10.9 ± 0.7* | 7.3 ± 0.3 | 9.4 ± 0.4* |
| n | 17 | 11 | 15 | 14 |
BW, body weight; HW, heart weight. *P < 0.05 vs. sham mice of same genotype. Comparisons were made using two-way ANOVA with Sidak’s test for multiple comparisons.
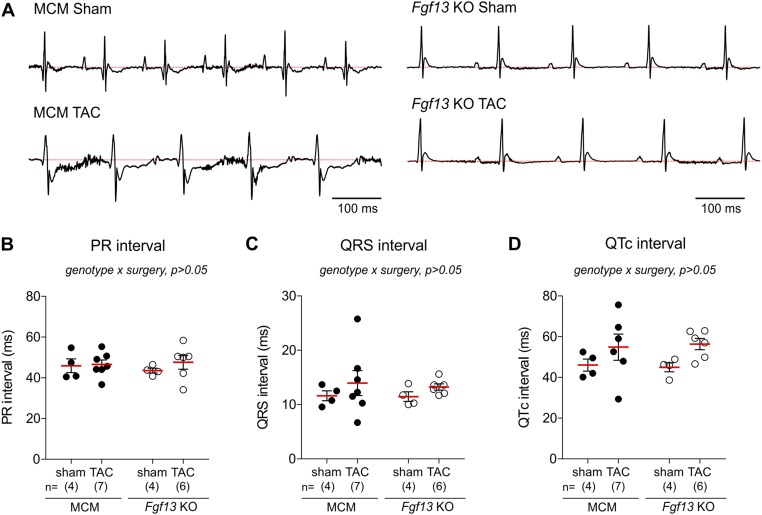
Consistent with these histological signatures and the reduced ventricular function, ECGs recorded from MCM mice after 12 wk of TAC showed evidence of pathological electrical remodeling—notably, ST-segment depression with entirely negative and inseparable J and T waves (19) (Fig. S3A)—whereas ECGs from Fgf13 KO TAC mice showed normal J–T wave transition (Fig. S3A). Pressure overload did not affect PR, QRS, or QT intervals, and no arrhythmic events were detected in either MCM or Fgf13 KO mice after TAC (Fig. S3 B–D). The normal ECGs in the Fgf13 KO mice at baseline are consistent with our independent analysis of ECGs in a separate cohort of Fgf13 KO mice (13). However, the absence of observed arrhythmias after TAC in Fgf13 KO mice was unexpected because we had observed flecainide-induced ventricular arrhythmias in Fgf13 KO mice (13)—consistent with FGF13's well-characterized role as a positive Na+ channel regulator in heart (8, 9). Recent analyses of the consequences of FHF KO in brain suggested that FHFs may have roles beyond ion channel regulation, such as regulation of synaptic vesicle release (20) and stabilization of microtubules (21). Thus, we interpreted our unexpected ECG and histological findings, together with the functional preservation observed by echocardiography, to indicate that Fgf13 KO protects against TAC-induced structural remodeling through an unanticipated mechanism independent of NaV1.5 channel regulation.
Fig. S3.
Fgf13 KO mice are protected from adverse electrical remodeling after TAC. (A) Representative lead I EKG traces from MCM and Fgf13 KO mice after 12 wk of sham or TAC surgery. MCM TAC EKGs showed entirely negative and inseparable J and T waves below the isoelectric line (dotted red line) indicating pathological electrical remodeling. Fgf13 KO TAC EKGs showed normal J–T wave transition. (B–D) Summarized data for PR interval (B), QRS interval (C), and QTc interval (D). Two-way ANOVA showed no significant genotype by surgery interaction for all EKG parameters.
FGF13 Forms a Complex with Cavin Proteins in Adult Ventricular Cardiomyocytes.
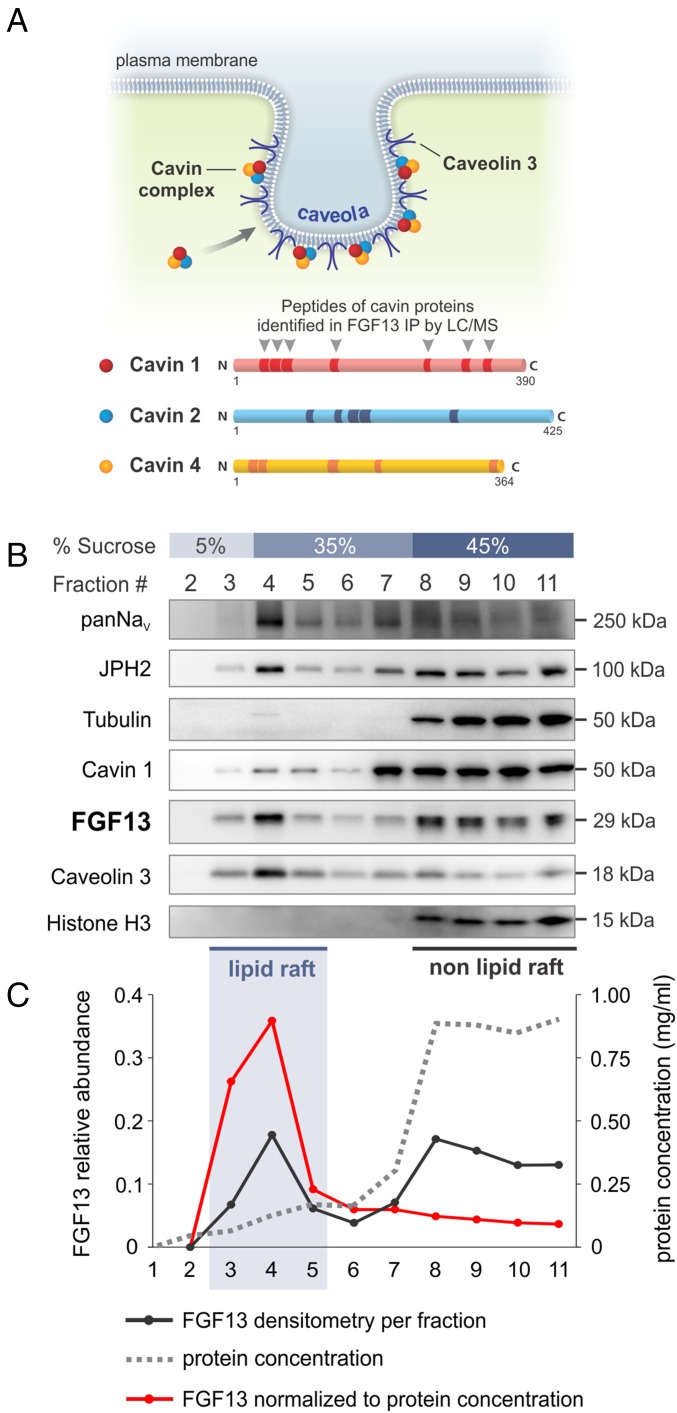
We therefore looked for alternative FGF13 functions in the heart by undertaking a search for unexpected components of the FGF13 interactome with an unbiased proteomic screen. We performed immunoprecipitation from adult mouse ventricular tissue using a previously validated FGF13 antibody or a control IgG followed by mass spectrometry analysis of the immunoprecipitated FGF13 complex. As expected, we identified multiple peptides from FGF13 and NaV1.5, its best validated interactor (9), that were absent in the control IgG immunoprecipitation. Among the list of unexpected coimmunoprecipitated proteins in the FGF13 interactome were the three cavin proteins present in cardiac muscle (22)—cavin 1 (also known as PTRF), cavin 2 (SDRP), and cavin 4 (MURC) (Fig. 2A and Table S4), suggesting that FGF13 associates with a complex of cavin proteins in cardiomyocytes. These cavin proteins were of particular interest because they regulate the formation and morphology of caveolae, membrane invaginations that serve as organizers for adaptive hypertrophic signaling effectors and provide a membrane reservoir for mechanoprotection (16).
Fig. 2.
FGF13 associates with cavin protein complexes in caveolin-rich lipid rafts of cardiomyocytes. (A) Schematic of the cavin–caveolin complex at a sarcolemmal caveola. Cavin complexes are assembled in the cytoplasm before being recruited to caveolae. Mass spectrometry analysis of immunoprecipitated FGF13 complex identified 17 unique peptides across cavin 1, cavin 2, and cavin 4 (detailed peptide information in Table S4). (B) Western blots of sucrose density fractions 2–11 from adult ventricular myocytes showed FGF13 cofractionating with cavin 1, caveolin 3, sodium channel (NaV), and junctophilin-2 (JPH2) in lipid raft fractions (3–5). Fraction 1 is not shown because no protein is present in the first fraction. (C) FGF13 densitometry normalized to protein concentration emphasizes its lipid raft enrichment.
Table S4.
Peptides of cavin 1, cavin 2, and cavin 4 identified by mass spectrometry
| Protein name/accession no. | FGF13 IP peptide sequences | IgG IP peptide sequences |
| Cavin 1/PTRF_MOUSE | ATEEPSGTGSDELIK (33–47) | KLEVNEAELLR (139–149) |
| SDQVNGVLVLSLLDK (48–62) | ||
| IIGAVDQIQLTQAQLEER (63–80) | ||
| KLEVNEAELLRR (139–150) | ||
| LKTKENLEK (259–267) | ||
| KSFTPDHVVYAR (301–312) | ||
| EGEVEVLK (332–339) | ||
| Cavin 2/SDPR_MOUSE | YQASTSNTVSK (103–113) | None detected |
| RLENNHAQLLR (141–151) | ||
| VLIFQEESEIPASVFVK (157–173) | ||
| EPVPSAAEGKEELADENK (174–191) | ||
| VSPLSFGR (292–299) | ||
| Cavin 4/MURC_MOUSE | LSSVTEDEDQDAALTIVTVLDR (18–39) | None detected |
| VASVVDSVQASQKR (40–53) | ||
| VVIFQEDIPCPASLSVVKDR (132–151) | ||
| SGKEHIDHIKK (189–199) | ||
| VEDDESLLLELK (348–359) |
Numbers in parentheses following peptide sequences indicate the amino acid positions. Accession numbers from SwissProt 2011 database.
A Subset of FGF13 Cofractionates with Cavins in Caveolin-Rich Lipid Rafts in Cardiomyocytes.
Cavins regulate caveolae biogenesis and morphology in concert with caveolins, integral membrane proteins that bind cholesterol and form oligomers to stabilize caveolae (16). Caveolin 3 (Cav3) is the major caveolin isoform in smooth, skeletal, and cardiac muscle, and its presence in fractions isolated from detergent-free sucrose density centrifugation is a biochemical marker of caveolae. Because of its interaction with the cavin complex, we tested whether FGF13 cofractionates with cavins in Cav3-rich lipid rafts after sucrose density centrifugation of lysates from acutely dissociated adult ventricular cardiomyocytes. As anticipated, Fig. 2B shows that the greatest Cav3 enrichment was in low-density lipid raft fractions (fractions 3–5), whereas markers for cytoplasmic and nuclear proteins (tubulin and histone H3) appeared almost exclusively in heavy nonraft fractions (fractions 8–11). We detected a subset of FGF13 and cavin 1 in the Cav3-rich fractions, along with subpopulations of sodium channels (NaV), and junctophilin-2 (JPH2)—proteins that localize to Cav3-rich membranes (23, 24). FGF13 was also present in higher density, non-lipid raft fractions (fractions 8–11), consistent with its role in regulating voltage-gated ion channels in extracaveolar domains (9, 11). Because protein content in caveolin-rich lipid rafts accounts for <10% of total protein, normalization of FGF13 densitometry by protein concentration emphasized its relative enrichment in the lipid rafts (Fig. 2C) and suggested previously unexplored roles for FGF13 in heart.
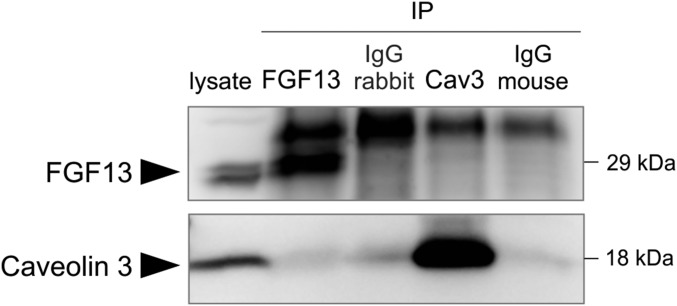
One such role suggested by the cofractionation of FGF13 with Cav3 and its interaction with the cavin complex is that FGF13 is a member of the Cav3 macromolecular complex in ventricular myocytes. However, no Cav3 peptides were detected by mass spectrometry in the FGF13 immunoprecipitation. The converse immunoprecipitation using a Cav3 antibody from myocyte lysate also showed no interaction between Cav3 and FGF13 (Fig. S4). These results indicate that FGF13’s interaction with the cavin complex and cofractionation in lipid rafts are not dependent on Cav3. Because cavins regulate caveolae formation through indirect interactions with caveolins (25, 26), we interpreted these results to indicate that FGF13 may also participate in the regulation and organization of caveolae independently of a direct Cav3 interaction.
Fig. S4.
FGF13 and caveolin 3 do not coimmunoprecipitate from ventricular cardiomyocyte lysate. FGF13 and caveolin 3 did not coimmunoprecipitate from myocyte lysate using rabbit anti-FGF13 or mouse anti-Cav3 antibodies. Seventy micrograms of protein lysate was loaded as input; 500 µg of lysate was used for immunoprecipitation.
Fgf13 KO Increases Sarcolemmal Caveolae Density in Cardiac Myocytes.
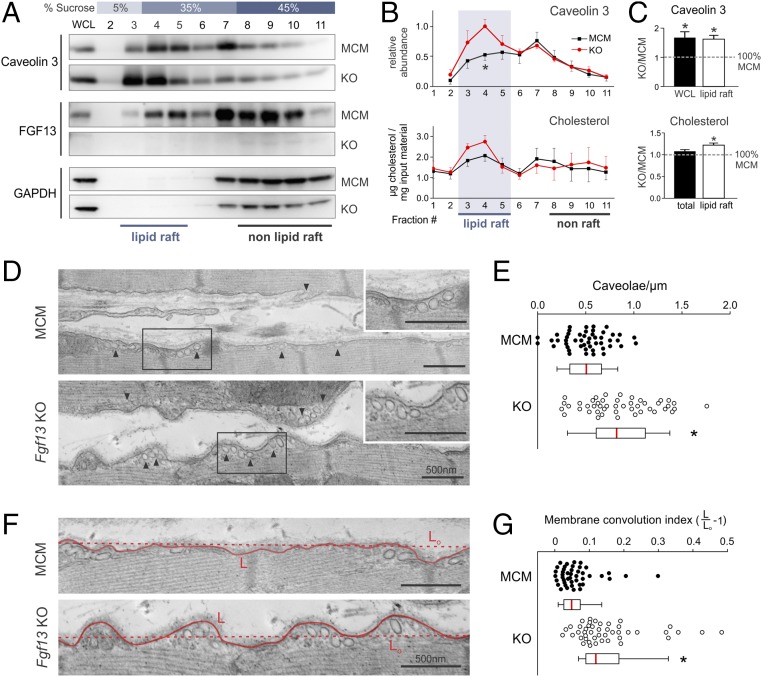
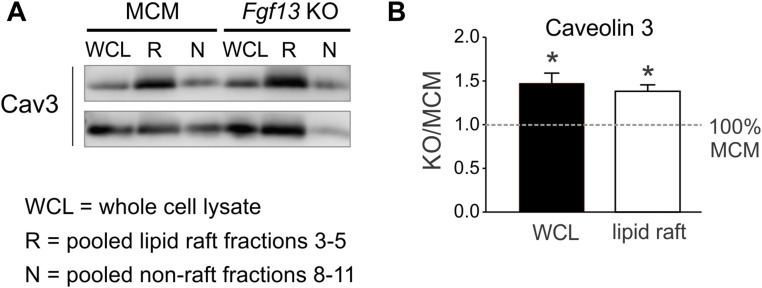
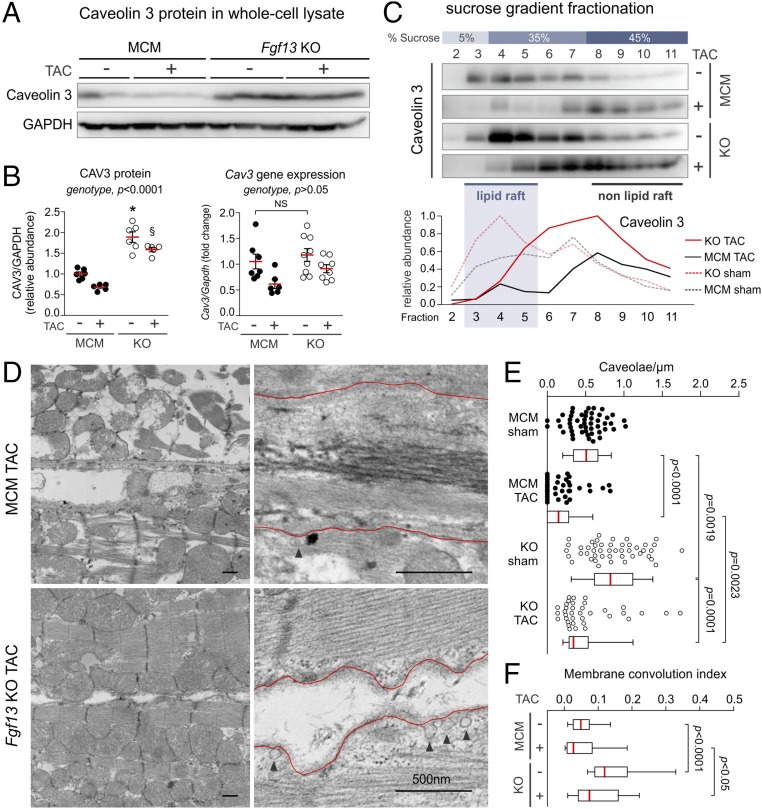
To determine whether FGF13 affects caveolae organization, we first examined the consequences of Fgf13 KO on the sucrose density fractionation of Cav3. We found that the total amount of Cav3 in whole-cell lysate was increased in Fgf13 KO by 67 ± 20% relative to MCM control (P < 0.05, one-sample t test; Fig. 3 A and C). Moreover, this increase in Cav3 was concentrated within sucrose fractions 3–5 (62 ± 13%; P < 0.05, one-sample t test; Fig. 3 A–C), indicating a selective enrichment of Cav3 within lipid rafts. To confirm the accuracy of our quantification, we performed an additional control by immunoblotting pooled lipid raft fractions from MCM and Fgf13 KO hearts run on the same gel. This showed a similar increase in Cav3 lipid raft partitioning after Fgf13 ablation (Fig. S5 A and B). As caveolins bind cholesterol (27), we tested for a correlative redistribution of cholesterol to more buoyant fractions as an independent indicator of Cav3 enrichment within lipid rafts. Total cholesterol was unchanged, but lipid rafts in Fgf13 KO hearts were indeed marked by significantly higher cholesterol content (Fig. 3 B and C).
Fig. 3.
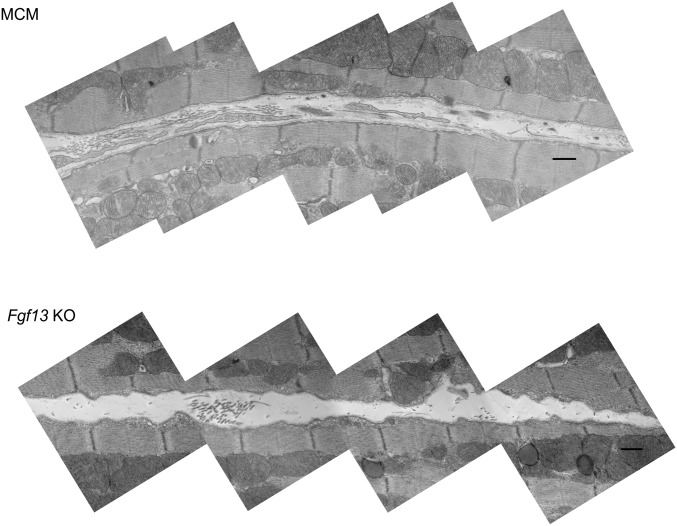
Fgf13 KO enhances the lipid raft partitioning of caveolin 3 and increases caveolae density and membrane convolution at the lateral sarcolemma. (A) Western blots of sucrose density fractions from acutely isolated MCM and Fgf13 KO myocytes. Equal total protein (∼2 mg) was loaded onto each sucrose column; blots from both genotypes were exposed simultaneously. (B) Densitometry of caveolin 3 from Western blot in A (normalized to peak signal) and measurement of cholesterol content per fraction (normalized to total input protein). (C) Quantification of caveolin 3 protein in whole-cell lysate (WCL) and lipid raft fractions 3–5 (WCL values were normalized to GAPDH and MCM) and summarized data for total and lipid raft cholesterol content. Plots in B and C show means ± SEM from three to five mice/genotype; *P < 0.05, unpaired t test or one-sample t test comparing KO to 100% MCM. (D) Representative composite electron micrographs showing the lateral sarcolemmal membranes of adjacent cardiomyocytes from MCM and Fgf13 KO hearts (arrowheads denote caveolae connected to plasma membrane). (Scale bars, 500 nm; uncropped images in Fig. S7.) (E) Quantification of caveolae density, normalized to membrane length. Mean densities were 0.51 ± 0.03 and 0.86 ± 0.05 caveolae per µm in MCM and KO, respectively; n = 46–49 micrographs from three mice per genotype. (F) Representative electron micrographs showing increased membrane convolutions in Fgf13 KO hearts (uncropped images in Fig. S7); L, length of membrane contour; Lo, shortest length connecting end points of membrane segment. (G) Quantification of membrane convolution index (L/Lo − 1). Mean indices were 0.15 ± 0.02 vs. 0.06 ± 0.01 in KO and MCM, respectively; n = 45 micrographs from three mice per genotype. Box plots show medians with interquartile range; whiskers represent 10th to 90th percentile; each point represents one micrograph. *P < 0.0001, Mann–Whitney U test.
Fig. S5.
Caveolin 3 protein in whole-cell lysate (WCL) and pooled lipid raft and nonraft sucrose density fractions. (A) Representative immunoblots for Cav3 protein in WCL, pooled lipid raft fractions (R), and pooled nonraft fractions (N) from two MCM and two Fgf13 KO hearts. (B) Summarized data for Cav3 densitometry within WCL and lipid raft fractions (n = 3 mice/genotype). *P < 0.05, one-sample t test against 100% MCM.
Fig. S7.
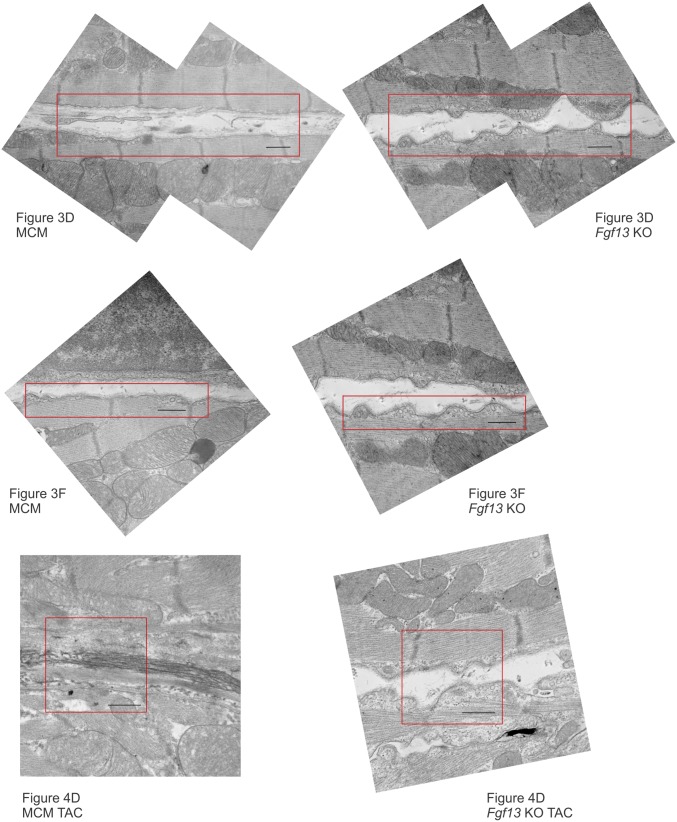
Uncropped composite electron micrographs from MCM and Fgf13 KO hearts. Cropped regions shown in Figs. 3 and 4 are outlined in red. (Scale bar, 500 nm.)
The Cav3 enrichment in lipid rafts from Fgf13 KO hearts prompted us to examine whether caveolar abundance was increased. We quantified caveolae density along the lateral sarcolemma in electron micrographs (by two experimenters blinded to genotype) from sham KO and MCM hearts, and observed a significant increase in the number of caveolae normalized to membrane length in KO vs. MCM hearts (Fig. 3 D and E). Furthermore, KO myocytes also exhibited changes in the lateral sarcolemma ultrastructure that were previously observed in other models of increased caveolae density (15). Whereas MCM myocytes had a relatively straight sarcolemma, KO myocytes displayed a more convoluted surface, with caveolae clustering within outcroppings of membrane (Fig. 3F; see Fig. S6 for additional composite micrographs). We quantified the degree of membrane contour by defining a “convolution index” (L/Lo − 1) in which the length of the membrane contour (L) was normalized to the length of a straight path connecting the end points of the membrane segment (Lo) (exemplar in Fig. 3F). KO myocytes showed a significantly greater membrane convolution index compared with MCM myocytes (Fig. 3G).
Fig. S6.
Composite electron micrographs showing increased membrane convolutions in Fgf13 KO (Bottom) compared with MCM (Top) hearts. (Scale bar, 500 nm.)
Not only did Fgf13 KO hearts show increased Cav3 protein and caveolar abundance at baseline compared with MCM controls, but the differences persisted 12 wk after TAC. As demonstrated in Fig. 4 A and B, Cav3 protein was significantly elevated in whole-cell lysates from Fgf13 KO hearts compared with MCM control hearts with or without TAC. Moreover, using sucrose density fractionation, we observed that a redistribution of Cav3 from lipid raft fractions to nonraft fractions (Fig. 4C) in MCM hearts after TAC was markedly attenuated in Fgf13 KO hearts. To determine the mechanism by which Cav3 protein was increased in Fgf13 KO hearts, we measured expression by qPCR and found that the increase in Cav3 protein, with or without TAC, was not associated with up-regulation of Cav3 expression (Fig. 4B), suggesting that Fgf13 ablation enhanced the stability of Cav3 protein.
Fig. 4.
Fgf13 KO attenuates TAC-induced loss of caveolae. (A) Representative Western blots for caveolin 3 in left ventricular whole-cell lysates from MCM and Fgf13 KO hearts 12 wk post-TAC or sham. (B) Densitometry of CAV3 protein from blots in A (Left); gene expression of Cav3 (Right). P values from two-way ANOVA with Sidak’s multiple-comparison test. *P < 0.0001 vs. MCM sham; §P < 0.0001 vs. MCM TAC. (C) Representative Western blots and densitometry showing caveolin 3 distribution in sucrose density fractions from MCM and Fgf13 KO hearts 12 wk post-TAC or sham. (D) Representative electron micrographs from MCM and Fgf13 KO hearts 12 wk post-TAC. (Scale bars, 500 nm; arrowheads denote caveolae connected to plasma membrane; uncropped images in Fig. S7.) (E) Quantification of caveolae density, normalized to membrane length. (F) Quantification of membrane convolution index. Baseline (sham) caveolae densities and membrane convolution indices from Fig. 3 E and G are replotted for comparison with TAC groups. Box plots show medians with interquartile range; whiskers represent 10th to 90th percentile; each point represents one micrograph. n = 37–49 micrographs from three mice per genotype. P values from Kruskal–Wallis test with Dunn’s multiple-comparison test.
We then examined caveolar abundance in KO and MCM TAC hearts by electron microscopy. Consistent with the redistribution of Cav3 to nonraft fractions in MCM TAC hearts, electron micrographs of MCM TAC hearts revealed a significant reduction in sarcolemmal caveolae density relative to sham hearts (Fig. 4 D and E). In contrast, Fgf13 KO TAC hearts maintained higher caveolae density and membrane convolution index compared with MCM TAC hearts (Fig. 4 D–F). Additionally, whereas MCM TAC hearts exhibited ultrastructural features consistent with pathological remodeling—including myofibrillar disarray, ruptured mitochondria, and increased interstitial collagen deposition (Fig. 4D)—KO TAC hearts showed intact sarcomeres and mitochondria, reflecting the protective structural and functional phenotypes observed by histology and echocardiography.
The increased abundance of caveolae in cardiomyocytes of Fgf13 KO mice suggests that FGF13 functions as a negative regulator of caveolae density, thus offering at least two mechanistic explanations for the cardioprotection after TAC in the Fgf13 KO animals. First, we hypothesized that Fgf13 KO would phenocopy Cav3 overexpression, which was shown to mitigate TAC-induced pathological remodeling in part by preventing disruption of caveolae-associated macromolecular signaling complexes otherwise seen after TAC (28). Second, based on recent studies in skeletal muscle and endothelial cells highlighting that caveolae can serve as mechanoprotective membrane reservoirs that buffer increases in membrane tension (29, 30), we hypothesized that increased caveolae abundance in Fgf13 KO myocytes ameliorated membrane damage caused by TAC-induced mechanical stretch.
Fgf13 KO Is Associated with Adaptive Hypertrophic Signaling in Caveolae-Localized Signaling Pathways in Response to Pressure Overload.
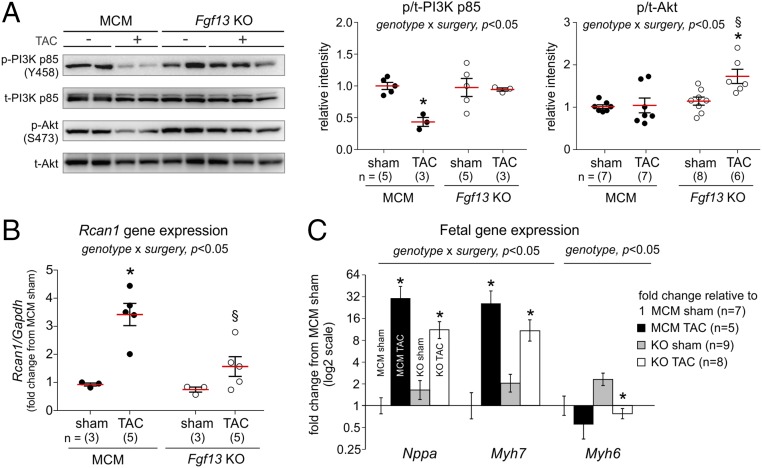
We therefore first examined whether the increased caveolar density in the Fgf13 KO hearts provided cardioprotection by enhancing adaptive hypertrophic signaling pathways enriched in caveolae, focusing initially on the consequences of Fgf13 KO on insulin-like growth factor-1 signaling through the phosphoinositide 3-kinase (PI3K) and Akt pathway (31). Measuring phosphorylation of the PI3K p85 regulatory subunit at Tyr458, which indicates activation of the kinase (32, 33), we observed decreased phospho-Tyr458 in MCM TAC hearts compared with sham controls (Fig. 5A). In contrast, Fgf13 KO TAC hearts showed no decrease in PI3K phosphorylation compared with sham hearts (Fig. 5A), suggesting preservation of PI3K activity in Fgf13 KO mice during pressure overload. Moreover, consistent with enhanced signaling through the downstream PI3K target Akt, Fgf13 KO TAC hearts showed a significantly higher ratio of phospho-Akt (Ser473) to total Akt compared with KO sham hearts (Fig. 5A). In contrast, MCM TAC hearts showed no increase in Akt phosphorylation compared with MCM sham.
Fig. 5.
Fgf13 KO promotes adaptive hypertrophic signaling in response to pressure overload. (A) Representative Western blots for phosphorylated (p) and total (t) proteins for PI3K p85 and Akt from 12 wk post-TAC hearts. Plots show summarized data for p/t-PI3K and p/t-Akt. (B) Gene expression of regulator of calcineurin (Rcan1) normalized to Gapdh and MCM sham. (C) Gene expression of atrial natriuretic peptide (Nppa), β-myosin heavy chain (Myh7), and α-myosin heavy chain (Myh6) normalized to Gapdh and MCM sham. Fold change on y axis is plotted on a log2 scale. Two-way ANOVA with Sidak’s test for multiple comparisons was used to assess effects of genotype, surgery, and genotype by surgery interaction. *P < 0.05 vs. sham for respective genotype; §P < 0.05 vs. MCM TAC.
Not only did we observe enhancement of adaptive hypertrophic signaling pathways, but we also found suppression of pathways associated with pathophysiological remodeling (34). Specifically, we examined calcineurin-NFAT activity and the fetal gene program. In Fgf13 KO mice subjected to TAC, we assessed calcineurin activity by measuring the expression of regulator of calcineurin 1 (Rcan1), a gene target of calcineurin (35). Fgf13 KO significantly attenuated the TAC-induced increase in Rcan1 expression observed in MCM mice (Fig. 5B). In addition, induction of the fetal gene program in Fgf13 KO TAC hearts was significantly diminished compared with levels observed in MCM TAC hearts (Fig. 5C). Together, these data suggest that the increased caveolae density after Fgf13 ablation afforded cardioprotection by enhancing PI3K/Akt signaling and concomitantly attenuating pathological cardiac remodeling as indicated by the fetal gene program.
KO of Fgf13 Enhances Mechanoprotection in Response to Ventricular Pressure Overload and Hypoosmotic Stress.
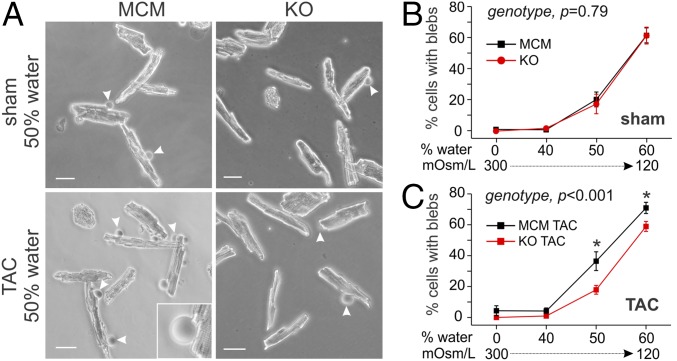
Having shown that the increased caveolar density in Fgf13 KO myocytes enhanced cardioprotective signaling, we next tested whether the increased caveolar abundance also enhanced mechanoprotection by increasing the membrane reservoir available to buffer membrane tension. We used a hypoosmotic stress assay, which was previously shown to induce membrane rupture when caveolae were depleted (29). We observed that myocytes isolated from MCM and Fgf13 KO sham-operated mice displayed a similar degree of membrane blebbing (areas of rounded membrane protrusion) (Fig. 6 A and B). However, in myocytes isolated from TAC hearts, those with Fgf13 KO displayed significantly less blebbing than MCM myocytes (Fig. 6 A and C). Thus, by increasing caveolae density and consequently the reservoir of membrane available to buffer membrane tension, Fgf13 KO preserved sarcolemmal integrity and enhanced mechanoprotection from membrane rupture.
Fig. 6.
Fgf13 KO protects against membrane rupture in response to pressure overload and acute hypoosmotic stress. (A) Representative bright-field images of nonoperated and TAC MCM and KO myocytes 30 min after switch from isoosmotic to hypoosmotic media (50% water). The frequency of membrane rupture was quantified by counting cells containing one or more blebs (membrane protrusions indicated by arrowheads; magnified in Inset) and normalizing by the total cells per field of view (excluding lysed cells). (Scale bar, 50 µm.) (B and C) Summarized data for hypoosmotic stress assay conducted across four media conditions (0%, 40%, 50%, 60% water) on (B) nonoperated myocytes and (C) TAC myocytes. Two-way ANOVA showed significant surgery by genotype interaction, P < 0.05. Comparisons between genotypes at each solution were made using Holm–Sidak’s test for multiple comparisons, *P < 0.05. Plots show means ± SEM; n = 9 wells of cells from three mice per genotype and surgery condition; cell counts from six fields of view were summed per well.
FGF13 Regulates the Distribution of Cavin 1 Between the Plasma Membrane and Cytosol.
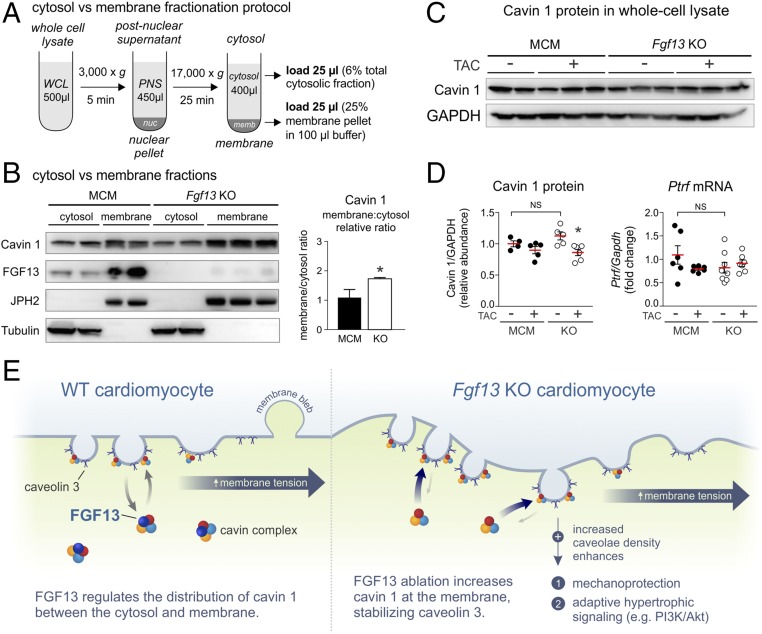
We next turned to defining the mechanism by which FGF13 interaction with cavins affected caveolar density. After caveolins have trafficked to the plasma membrane, multimeric cavin complexes in the cytosol are recruited to the cytoplasmic surface of caveolae, where they stabilize caveolins (22, 36). Among the cavins, cavin 1 is most critical for stabilization of caveolins and caveolae biogenesis (25, 26, 37). We therefore hypothesized that ablation of Fgf13 affected the relative distribution of cavin 1 and led to stabilization of caveolae. To test this hypothesis, we used a subcellular fractionation protocol to separate cytosolic and membrane fractions (Fig. 7A). Demonstrating clear separation of subcellular fractions, Western blots for junctophilin-2 and tubulin showed signal exclusively in membrane and cytosolic fractions, respectively (Fig. 7B). We observed that the relative ratio of cavin 1 in the membrane to cytosol was significantly increased in Fgf13 KO mice compared with MCM controls (Fig. 7B). This increase was not associated with changes in total cavin 1 protein or gene expression after Fgf13 KO (Fig. 7 C and D), suggesting that FGF13 loss leads to redistribution of cavin 1 between the cytosol and the membrane. These data support a model in which the elevated level of membrane-associated cavin 1 stabilizes Cav3 in Fgf13 KO hearts and consequently increases caveolar density to enhance mechanoprotection and promote adaptive hypertrophic signaling (Fig. 7E).
Fig. 7.
KO of Fgf13 in adult cardiomyocytes redistributes cavin 1 from the cytosol to membrane. (A) Schematic of subcellular fractionation workflow (PNS, postnuclear supernatant; WCL, whole-cell lysate). Equal concentrations of lysate were used as input. (B, Left) Western blots for cavin 1 and FGF13 from cytosolic and membrane fractions prepared from MCM and Fgf13 KO ventricular tissue; tubulin and junctophilin-2 (JPH2) serve as markers for cytosolic and membrane proteins, respectively. (Right) Quantification of membrane:cytosol relative ratio for cavin 1. *P < 0.05, unpaired t test. (C) Representative Western blots for cavin 1 in left ventricular whole-cell lysates from MCM and Fgf13 KO hearts 12 wk post-TAC or sham surgery. (D, Left) Densitometry of cavin 1 protein from blots in C. (Right) Gene expression of cavin 1 (Ptrf). *P < 0.05 vs. KO sham, two-way ANOVA with Sidak’s multiple-comparison test. (E) Model showing FGF13 regulation of cavin 1 distribution between cytosolic and membrane fractions. Fgf13 KO increases cavin 1 at the membrane, stabilizing caveolin 3 and thereby increasing caveolae density to enhance mechanoprotection and adaptive hypertrophic signaling.
Discussion
Since their initial identification in the retina two decades ago (1), FHFs have been most extensively studied as modulators of voltage-gated Na+ channels. Nevertheless, there have been persistent suggestions that FHFs have broader roles, such as regulation of limb (38) and craniofacial development (39), neural differentiation (40), presynaptic neurotransmitter vesicle number (20), and hair growth (41). Although we recently confirmed the role of FGF13 as a regulator of cardiac Na+ channels in vivo (13), the complete consequences of Fgf13 ablation on cardiac function have not been investigated. Here, motivated by an unexpected cardioprotective phenotype in Fgf13 KO mice after TAC, we discovered through an unbiased proteomic screen that FGF13 associates with the cavin complex in heart, and functions as a negative regulator of cardiomyocyte caveolae. We further established the mechanistic basis for the cardioprotection in Fgf13 KO mice, demonstrating that an increase in sarcolemmal caveolae density enhanced mechanoprotection, and augmented adaptive hypertrophic signaling through caveolae-associated signaling pathways during pressure overload. Importantly, our results further extend the repertoire of known FHF modulatory effects beyond ion channel regulation and suggest that inhibition of cardiac FHFs may be cardioprotective during increased cardiac stress.
Although caveolae were initially observed by electron microscopy more than 60 y ago (42, 43), the molecular components regulating their formation and function are still incompletely understood. To date, two families of structural proteins—caveolins and cavins—have been shown to regulate caveolae biogenesis and morphology (16). Disruption of cavin–caveolin complexes can alter caveolae abundance and contribute to multisystemic disease, including cardiac arrhythmias and hypertrophy, lipodystrophy, and muscular dystrophy (44–47). However, the precise mechanisms by which cavins assemble with caveolins, especially in cardiac muscle, remain unclear. Moreover, the differing molecular composition of cavin complexes across cell types [e.g., cardiomyocytes express all cavin isoforms except for cavin 3 (22, 48)] suggests that additional proteins contribute to caveolae formation and confer tissue-specific functions (49). For instance, EHD2, a member of the EHD family of endosomal recycling proteins (50) recently reported to regulate cardiac membrane protein targeting (51, 52), has been shown to interact with cavin 1 and control the stability and turnover of caveolae (53). Our data contribute to the expanding list of caveolae regulators and establish FGF13 as a noncavin protein in heart that regulates caveolae density by tuning the balance of cavin 1 between membrane and cytosol.
Our results showing increased mechanoprotection of Fgf13 KO cardiomyocytes fit well with the growing literature that caveolae in diverse cell types act as membrane convolutions that can flatten in response to increased membrane tension, thereby serving as a buffer to prevent membrane rupture (54). For instance, caveolae have been shown to protect against sarcolemmal damage in skeletal muscle during vigorous activity (29), and to mitigate endothelial cell membrane rupture during increased cardiac output (30). In cardiomyocytes, mechanical stretch was shown to increase cell membrane capacitance by recruiting subsarcolemmal caveolae to the plasma membrane (55). However, whether incorporation of caveolae into the sarcolemmal membrane confers protection against membrane stress has not been tested. Consistent with previous reports showing increased susceptibility to acute membrane damage in the absence of caveolae (29, 30), we showed that pressure overload-induced loss of caveolae compromises cardiomyocyte membrane integrity. Reminiscent of the effects seen with cardiac-specific Cav3 overexpression in mice (15), Fgf13 KO increased sarcolemmal caveolae density and membrane convolutions, thereby enhancing the reservoir of membrane available for mechanoprotection.
Our results showing enhanced caveolae-mediated signaling provide a second cardioprotective mechanism for the Fgf13 KO mice. An elaborate network of nodal signaling integrators is activated in response to cardiac stress to promote cardiac hypertrophy as a compensatory response to maintain cardiac output. The signaling pathways associated with caveolae, which compartmentalize receptors, ion channels, and signaling effectors (56, 57), have generally been characterized as cardioprotective. The link between caveolae and cardiac hypertrophy was first established in Cav3 KO mice, which display significant hypertrophy, dilation, and reduced fractional shortening associated with hyperactivation of the maladaptive p42/44 MAPK pathway (44). In contrast, adenoviral-mediated overexpression of Cav3 in isolated cardiomyocytes conferred protection from phenylephrine-induced hypertrophy (58), and transgenic mice with cardiomyocyte-specific overexpression of Cav3 demonstrated attenuation of cardiac hypertrophy and preservation of function following TAC (15). This cardioprotection was attributed to increased natriuretic peptide expression, increased phosphorylation of Akt, and decreased NFAT nuclear translocation as a result of increased caveolae abundance (15, 28). Similar to the protective signaling in Cav3 overexpression, we observed that Fgf13 KO up-regulated PI3K/Akt signaling and attenuated calcineurin/NFAT-mediated fetal gene reexpression after TAC (Fig. 5 A–C). Thus, the cardioprotective phenotype in Fgf13 KO mice after TAC (i.e., preserved function, diminished fibrosis, and attenuation of cardiac dilation) may reflect an integrated response between multiple nodal regulators as well as the mechanoprotection afforded by increased caveolar abundance.
Methods
Animals.
Animals were handled according to NIH Guide for the Care and Use of Laboratory Animals (59). The study was approved by Duke University Animal Care and Welfare Committee (protocol no. A292-13-11). All genetically modified mice were maintained on a C57BL/6J (000664; The Jackson Laboratory) genetic background and backcrossed for at least 10 generations. Fgf13fl/fl mice, generated by flanking exon 3 of the mouse Fgf13 gene with loxP sites, were obtained from Hebei Medical University (13). To generate cardiac-specific, inducible KO mice, Fgf13fl/fl mice were crossed with Myh6-MCM (MerCreMer; 005657; The Jackson Laboratory) mice, which have an α-myosin heavy-chain (Myh6) promoter directing expression of a tamoxifen-inducible Cre recombinase. Eight- to 12-wk-old male hemizygous (Fgf13fl/Y;Myh6-MCMtg/+) or female homozygous (Fgf13fl/fl;Myh6-MCMtg/+) KO mice and controls (MCM) with the MCM but lacking the floxed Fgf13 allele (Myh6-MCMtg/+) were injected with 40 mg/kg tamoxifen (Sigma-Aldrich) intraperitoneally for 3 consecutive days to induce Fgf13 deletion. Mice were used for experimentation at least 3 wk after recovery from tamoxifen induction.
Antibodies.
Rabbit anti-phospho-PI3K p85 (Tyr458)/p55(Tyr199), anti-PI3K p85, and anti-pan-Akt antibodies were purchased from Cell Signaling Technology. Mouse anti-phospho-Akt1/2/3(Ser473), mouse anti-caveolin 3, goat anti-junctophilin2, and goat anti-histone H3 antibodies were purchased from Santa Cruz Biotechnology. Mouse anti-panNaV and mouse anti-tubulin antibodies were purchased from Sigma-Aldrich. Rabbit anti-PTRF/Cavin 1 antibody was purchased from Proteintech Group. Mouse anti-GAPDH antibody was purchased from Thermo Fisher Scientific. Rabbit anti-FGF13 antibody was generated as previously described (9).
Generation of Pressure Overload and Serial Echocardiography.
Pressure overload was produced by constricting the transverse aorta as previously described (18). Surgery was performed on MCM and KO mice at least 3 wk after tamoxifen induction. Mice were anesthetized with a mixture of ketamine (100 mg/kg) and xylazine (2.5 mg/kg). The transverse aorta was isolated between the carotid arteries, and aortic constriction was performed by tying a 7-0 silk suture ligature against a 27-gauge needle to yield a constriction of 0.4 mm in diameter. This degree of constriction allows for an adequate stimulus for hypertrophy without producing heart failure or cardiac arrest. At termination of the study, the efficacy of the pressure overload was tested by measuring the arterial pressures in the right carotid artery (proximal to the suture) and the left axillary artery (distal to the suture); mean pressure gradients were 45.4 ± 5.4 and 44.5 ± 8.8 mmHg for MCM TAC and Fgf13 KO TAC mice, respectively (P > 0.05, n = 6–7 mice per genotype; Table S2).
Serial echocardiography was performed on conscious mice by a technician blinded to animal genotype using a VEVO 2000 high-resolution imaging system (VisualSonics). Transthoracic 2D M-mode and power Doppler images were used for data analysis. Heart rate, interventricular septal wall (IVS) and posterior wall (PW) thicknesses, left-ventricular end-diastolic diameter (LVEDD), and left-ventricular end-systolic diameter (LVESD) were measured from at least three consecutive cardiac cycles by two experimenters blinded to genotype. Fractional shortening (FS) was calculated with the formula: FS = (LVEDD − LVESD)/LVEDD.
Electrocardiograms.
Subcutaneously, two lead ECG recordings were captured from mice anesthetized with 2.5% Avertin [tribromoethanol (Sigma-Aldrich) dissolved 1:1 (wt/vol) in tert-amyl alcohol, and then 1:40 (vol/vol) in PBS]. Signals were amplified and recorded with an Octal Bio Amp amplifier connected to a Powerlab 16/30 DAQ system (ADInstruments). Heart rate, RR, and QT intervals were analyzed using LabChart, version 8.0, software (ADInstruments). Rate-corrected QT intervals (QTc) were calculated using the formula by Mitchell et al. (60): .
Histological Analysis.
Excised hearts were rinsed in PBS, fixed in 4% paraformaldehyde for 16 h at 4 °C, and dehydrated in a series of ethanol washes. Samples were subsequently cleared in xylene and mounted in paraffin. Sections of 10 µm in thickness were cut and stained with hematoxylin and eosin to analyze tissue morphology, Sirius red to analyze collagen content and fibrosis, and wheat germ agglutinin (WGA) (Alexa Fluor 488 conjugate; ThermoFisher Scientific) to measure myocyte size. Images were captured with a Leica DMIL inverted fluorescence microscope. To analyze cardiomyocyte size, the cross-sectional areas of 150–250 randomly chosen cells from three to four hearts per group were measured using ImageJ software (NIH). Fibrosis was quantified as the percentage of Sirius red-stained collagen area using ImageJ. Samples from different groups were processed in parallel, and histological analyses were performed by an experimenter blinded to genotype.
Proteomic Screen for FGF13-Interacting Proteins.
Fresh lysate from five adult wild-type C57BL/6J mice ventricles was prepared by homogenizing tissue on ice in lysis buffer containing 150 mM NaCl, 50 mM Tris, 1% Triton X, and protease inhibitor mixture (Roche). The crude heart lysate was centrifuged at 1,150 × g in a Fisher Scientific accuSpin Micro17 tabletop centrifuge for 15 min, and the supernatant was retained. Protein concentration was determined using a BCA assay. Antibody (20 µg of anti-FGF13 or control rabbit IgG) was irreversibly cross-linked to protein A/G agarose beads (Santa Cruz Biotechnology), and mouse ventricular tissue lysate (∼23 mg of total protein) was added to crosslinked beads. The bound proteins were eluted in 400 μL of 0.2% Rapigest SF Surfactant (Waters) in 50 mmol/L ammonium bicarbonate and subjected to an in-solution tryptic digestion at the Duke Proteomics Core. Peptide identifications were determined using liquid chromatography/tandem mass spectrometry; after data acquisition, all spectra were searched against the SwissProt database with the mouse taxonomy selected.
Cardiomyocyte Isolation.
Animals were anesthetized with 2.5% tribromoethanol and anticoagulated with heparin. The heart was excised, and the aorta was retrogradely perfused using a Langendorff system for 15 min with solution containing the following (all Sigma-Aldrich; in mM): 112 NaCl, 5.4 KCl, 1.7 NaH2PO4-H2O, 4.2 NaHCO3, 1.63 MgCl2-6H2O, 20 Hepes, 5.4 glucose, 30 taurine, 2 l-carnitine, 2.3 creatine, 10 2,3-butanedione monoxime (BDM), and 150 U/mL collagenase type II (Worthington). Next, the heart was minced and triturated in collagenase solution until all cell clumps were broken. Calcium tolerance was performed by gradually adding CaCl2 to a final concentration of 1 mM. Cells were plated in culture media containing MEM with Earle’s salts and l-glutamine, 0.5 mg/mL BSA, 10 mM BDM, 1× insulin–selenium–transferrin supplement (Life Technologies), 5 mM creatine, 5 mM taurine, 2 mM l-carnitine, and 1% penicillin/streptomycin.
Isolation and Purification of Caveolin-Rich Lipid Rafts.
Caveolin-rich fractions from ventricular myocytes were prepared using a nondetergent method (61). Freshly isolated myocytes were washed twice with PBS and scraped into 0.5 M sodium carbonate (pH 11). Cells were homogenized by a Dounce homogenizer (20 strokes), followed by sonication (6 × 10-s bursts; 50% power) using a Fisher Scientific Model 120 Sonic Dismembrator. Protein concentration was determined using a BCA assay. Equivalent amounts of protein from each homogenate (∼2 mg of total protein in 2 mL of lysis buffer) were adjusted to 45% sucrose by mixing with 2 mL of 90% sucrose in MBS [25 mM 2-(N-morpholino)ethanesulfonic acid, 150 mM NaCl, pH 6], and loaded to the bottom of an ultracentrifuge tube (Thermo Scientific; 03699). A 5–35% discontinuous sucrose gradient in MBS containing 250 mM Na2CO3 was formed above. The tube was centrifuged for 18 h at 260,000 × g, 4 °C in a TH-641 rotor (Sorvall/Thermo Scientific). After centrifugation, 1-mL fractions were collected from the top down to yield 11 fractions, and proteins were precipitated using 1 mL of 20% (wt/vol) trichloroacetic acid. Samples were resuspended in 50 µL of 1× LDS sample buffer (Invitrogen) and subjected to SDS/PAGE and Western blot analysis. Immunoblots of the same protein from different genotypes were exposed together. Densitometry was performed using ImageJ (NIH). To quantify lipid raft protein content, the band intensities from fractions 3–5 were combined. Cholesterol levels from each fraction were measured using the Amplex Red Cholesterol Kit (Invitrogen) according to the manufacturer’s protocol. Protein concentration in each fraction was measured by micro-BCA assay (Thermo Fisher Scientific) according to the manufacturer’s protocol.
Caveolin 3 Immunoprecipitation.
Isolated ventricular myocytes were lysed in buffer containing 1% Triton, 150 mM NaCl, and 50 mM Tris⋅HCl (pH 7.5) with protease inhibitor mixture (Roche) using a 26-gauge needle (25 strokes). Lysates were centrifuged at 17,000 × g for 10 min at 4 °C, and precleared with 20 μL of protein A/G-agarose beads (Santa Cruz) for 30 min. Immunoprecipitation was performed with anti-Cav3 (2 μg) or anti-FGF13 (2 μg) antibodies added to 500 μg of precleared lysates. Samples were rocked overnight, and subsequently incubated with 25 μL of protein A/G beads for 3 h and washed with lysis buffer three times, and protein was eluted from the beads by heating in LDS sample buffer (Invitrogen) at 70 °C for 20 min. Samples were subjected to SDS/PAGE, and coimmunoprecipitation was verified by Western blot.
Electron Microscopy and Image Analysis.
Acutely dissected left ventricles from MCM or FGF13 KO mice hearts were washed in PBS and fixed in 4% glutaraldehyde with 0.1 M phosphate buffer (pH 7.4) overnight at 4 °C. Tissue for electron-microscopic examination were postfixed for 1 h in 2% osmium tetroxide in 0.1 M phosphate buffer, dehydrated through successive acetones, and embedded in Epon (EM bed 812; Electron Microscopy Sciences) and polymerized at 70 °C overnight. Ultrathin (70-nm) sections were cut from tissue blocks with a Riechert-Jung Ultracut E Ultramicrotome and collected on copper 200-mesh grids. Grids were counterstained with uranyl acetate and lead citrate and examined in a Philips CM-12 transmission electron microscope (FEI) equipped with an AMT XR-60 digital camera with AMT V600 image acquisition software (AMT Imaging). For quantification of membrane caveolae density, images were acquired at 19,500× from the lateral sarcolemma of cardiomyocytes sectioned in the longitudinal axis (showing striated sarcomeric units). Twenty to 30 images were captured from each preparation; at least three mice hearts were used for each genotype. All images were acquired by a technician blinded to genotype.
Following EM image acquisition, images were imported into ImageJ (NIH) in TIFF format, and caveolae density and membrane curvature were measured by two independent experimenters blinded to genotype. Caveolae were identified by their characteristic morphology as 50- to 100-nm-wide invaginations clearly connected to the plasma membrane; caveolae not open at the plasma membrane were not counted. Caveolae density was calculated from each image by counting the number of caveolae and normalizing to the membrane length. To quantify the degree of membrane convolution, we defined a membrane convolution index = (L/Lo − 1), where L is the length of membrane contour, and Lo is the length of a straight path connecting the end points of the membrane segment.
Quantitative Real-Time PCR.
During heart isolation, left ventricular tissue was snap-frozen in liquid nitrogen and stored at −80 °C. mRNA was prepared using the RNeasy Plus Mini Kit (Qiagen) according to the manufacturer’s instructions. Reverse transcription was performed using iScript cDNA synthesis kit (Bio-Rad). Real-time PCR was performed in triplicate for each sample with a Bio-Rad CFX96 machine using SYBR Green or TaqMan-based detection chemistries (Thermo Fisher Scientific). Relative quantification was performed using the comparative threshold (CT) method (ΔΔCT) after determining the CT values for the reference (GAPDH) and target genes. See Table S5 for list of primers.
Table S5.
Primers for real-time quantitative PCR assays
| Species/gene | Sequences | Accession no. |
| SYBR Green primers | ||
| Mouse Fgf13 | 5′-CAGCCGACAAGGCTACCAC-3′ (forward) | |
| 5′-GTTCCGAGGTGTACAAGTATCC-3′ (reverse) | ||
| Mouse Ptrf | 5′-CAGCGTCAACGTGAAGACC-3′ (forward) | |
| 5′-CCTCCGACTCTTTCAGCGAC-3′ (reverse) | ||
| Mouse Cav3 | 5′-CAGTCTGGAGACCCTAAGCT-3′ (forward) | |
| 5′-AAATCTACCTTCACAATGTCCTCA-3′ (reverse) | ||
| Mouse Nppa | 5′-GCTTCCAGGCCATATTGGAG-3′ (forward) | |
| 5′-GGGGGCATGACCTCATCTT-3′ (reverse) | ||
| Mouse Myh6 | 5′-GCCCAGTACCTCCGAAAGTC-3′ (forward) | |
| 5′-GCCTTAACATACTCCTCCTTGTC-3′ (reverse) | ||
| Mouse Myh7 | 5′-ACTGTCAACACTAAGAGGGTCA-3′ (forward) | |
| 5′-TTGGATGATTTGATCTTCCAGGG-3′ (reverse) | ||
| Mouse Gapdh | 5′-TGTCAGCAATGCATCCTGCA-3′ (forward) | |
| 5′-CCGTTCAGCTCTGGGATGAC-3′ (reverse) | ||
| TaqMan primers | ||
| Mouse Rcan1 | Mm01213406_m1 | |
| Mouse Gapdh | Mm99999915_m1 |
Hypoosmotic Stress Assay.
Following acute isolation, myocytes from one mouse heart were plated in a 12-well culture plate and incubated in isoosmotic culture media [Minimum Essential Medium (Sigma-Aldrich; M4655) with 5% FBS, 1% penicillin/streptomycin, 300 mOsm/L] or culture media diluted with 40%, 50%, or 60% water (corresponding to osmolarities of 180, 150, and 120 mOsm/L). Each hypoosmotic solution was added to three wells of cells. Thirty minutes after incubation, images from six fields of view were acquired per well using a Leica DMIL LED Inverted Fluorescence Microscope equipped with a HI PLAN 20×, 0.3 N.A. objective. The frequency of membrane rupture was calculated by dividing the number of cells with one or more blebs by the total number of cells in the six fields of view. Lysed cells were excluded from analysis.
Subcellular Fractionation of Heart Lysate.
Excised left ventricle tissue was weighed, and lysis buffer [25 mM Tris, pH 7.4, 5 mM EDTA, protease inhibitor mixture (Roche)] was added to achieve a concentration of 100 mg of tissue per 1 mL of buffer. Lysates were homogenized using a Dounce homogenizer (40 strokes) and incubated on ice for 15 min. Five hundred microliters of homogenized lysate was centrifuged at 3,000 × g for 5 min. The postnuclear supernatant was then spun at 17,000 × g for 25 min. This second supernatant was saved as the cytosolic fraction while the pellet was resuspended in 100 µL of 1× LDS sample buffer (Invitrogen) and saved as the membrane fraction. Twenty-five microliters from cytosol and membrane fractions were loaded on SDS/PAGE gels for Western blot analysis.
Statistical Analyses.
Data are presented as mean ± SEM. Statistical significance of differences between two groups was assessed using a two-tailed unpaired Student’s t test. In cases in which Fgf13 KO values were normalized to control, a one-sample t test was used to assess whether KO values were significantly different from 100% control. For experiments involving two factors (e.g., genotype, TAC surgery), two-way ANOVA followed by Sidak’s multiple-comparison test was used to assess main effects, interactions, and simple main effects. For serial echocardiographic measurements, two-way repeated-measures ANOVA was used to test for main effects and interactions of genotype by time. Comparisons between genotypes at each time point were made using Holm–Sidak’s multiple-comparison test. If the data distribution fails normality testing (by the Shapiro–Wilk test), data are presented as box plots showing medians with interquartile range and whiskers representing 10th to 90th percentile, and nonparametric Mann–Whitney U test or Kruskal–Wallis test with Dunn’s multiple-comparison test was used in place of Student’s t test or ANOVA, respectively. For all tests, statistical significance was set at P < 0.05. Analyses were conducted with GraphPad Prism 6 or OriginLab OriginPro 8.
Acknowledgments
We thank Dr. Howard Rockman and Dr. Jorg Grandl for insightful discussions and critical comments on the manuscript. We thank Neil Medvitz at the Duke Electron Microscopy Service for help with the electron microscopy sample preparation and image acquisition. We also acknowledge the Duke Cardiovascular Physiology Core for the echocardiograms and TAC studies. This work was supported by National Heart, Lung, and Blood Institute (NHLBI) Grants R01 HL71165 and R01 HL112918 (to G.S.P.); by American Heart Association Predoctoral Fellowship Award 13PRE15990006 (to E.Q.W.); by NHLBI Grant F30 HL131217 (to D.S.S.); and by Duke Medical Scientist Training Program Grant T32 GM007171 (to E.Q.W. and D.S.S.). The animal studies were supported in part by the Mandel Center for Hypertension and Atherosclerosis at Duke.
Footnotes
The authors declare no conflict of interest.
This article is a PNAS Direct Submission.
This article contains supporting information online at www.pnas.org/lookup/suppl/doi:10.1073/pnas.1616393114/-/DCSupplemental.
References
- 1.Smallwood PM, et al. Fibroblast growth factor (FGF) homologous factors: New members of the FGF family implicated in nervous system development. Proc Natl Acad Sci USA. 1996;93:9850–9857. doi: 10.1073/pnas.93.18.9850. [DOI] [PMC free article] [PubMed] [Google Scholar]
- 2.Olsen SK, et al. Fibroblast growth factor (FGF) homologous factors share structural but not functional homology with FGFs. J Biol Chem. 2003;278:34226–34236. doi: 10.1074/jbc.M303183200. [DOI] [PubMed] [Google Scholar]
- 3.Liu Cj, Dib-Hajj SD, Waxman SG. Fibroblast growth factor homologous factor 1B binds to the C terminus of the tetrodotoxin-resistant sodium channel rNav1.9a (NaN) J Biol Chem. 2001;276:18925–18933. doi: 10.1074/jbc.M101606200. [DOI] [PubMed] [Google Scholar]
- 4.Goetz R, et al. Crystal structure of a fibroblast growth factor homologous factor (FHF) defines a conserved surface on FHFs for binding and modulation of voltage-gated sodium channels. J Biol Chem. 2009;284:17883–17896. doi: 10.1074/jbc.M109.001842. [DOI] [PMC free article] [PubMed] [Google Scholar]
- 5.van Swieten JC, et al. A mutation in the fibroblast growth factor 14 gene is associated with autosomal dominant cerebellar ataxia [corrected] Am J Hum Genet. 2003;72:191–199. doi: 10.1086/345488. [DOI] [PMC free article] [PubMed] [Google Scholar]
- 6.Goldfarb M, et al. Fibroblast growth factor homologous factors control neuronal excitability through modulation of voltage-gated sodium channels. Neuron. 2007;55:449–463. doi: 10.1016/j.neuron.2007.07.006. [DOI] [PMC free article] [PubMed] [Google Scholar]
- 7.Laezza F, et al. The FGF14(F145S) mutation disrupts the interaction of FGF14 with voltage-gated Na+ channels and impairs neuronal excitability. J Neurosci. 2007;27:12033–12044. doi: 10.1523/JNEUROSCI.2282-07.2007. [DOI] [PMC free article] [PubMed] [Google Scholar]
- 8.Hennessey JA, et al. FGF12 is a candidate Brugada syndrome locus. Heart Rhythm. 2013;10:1886–1894. doi: 10.1016/j.hrthm.2013.09.064. [DOI] [PMC free article] [PubMed] [Google Scholar]
- 9.Wang C, et al. Fibroblast growth factor homologous factor 13 regulates Na+ channels and conduction velocity in murine hearts. Circ Res. 2011;109:775–782. doi: 10.1161/CIRCRESAHA.111.247957. [DOI] [PMC free article] [PubMed] [Google Scholar]
- 10.Musa H, et al. SCN5A variant that blocks fibroblast growth factor homologous factor regulation causes human arrhythmia. Proc Natl Acad Sci USA. 2015;112:12528–12533. doi: 10.1073/pnas.1516430112. [DOI] [PMC free article] [PubMed] [Google Scholar]
- 11.Hennessey JA, Wei EQ, Pitt GS. Fibroblast growth factor homologous factors modulate cardiac calcium channels. Circ Res. 2013;113:381–388. doi: 10.1161/CIRCRESAHA.113.301215. [DOI] [PMC free article] [PubMed] [Google Scholar]
- 12.Yan H, Pablo JL, Pitt GS. FGF14 regulates presynaptic Ca2+ channels and synaptic transmission. Cell Reports. 2013;4:66–75. doi: 10.1016/j.celrep.2013.06.012. [DOI] [PMC free article] [PubMed] [Google Scholar]
- 13.Wang X, et al. Conditional knockout of Fgf13 in murine hearts increases arrhythmia susceptibility and reveals novel ion channel modulatory roles. J Mol Cell Cardiol. 2017;104:63–74. doi: 10.1016/j.yjmcc.2017.01.009. [DOI] [PMC free article] [PubMed] [Google Scholar]
- 14.Wilde AAM, Brugada R. Phenotypical manifestations of mutations in the genes encoding subunits of the cardiac sodium channel. Circ Res. 2011;108:884–897. doi: 10.1161/CIRCRESAHA.110.238469. [DOI] [PubMed] [Google Scholar]
- 15.Horikawa YT, et al. Cardiac-specific overexpression of caveolin-3 attenuates cardiac hypertrophy and increases natriuretic peptide expression and signaling. J Am Coll Cardiol. 2011;57:2273–2283. doi: 10.1016/j.jacc.2010.12.032. [DOI] [PMC free article] [PubMed] [Google Scholar]
- 16.Parton RG, del Pozo MA. Caveolae as plasma membrane sensors, protectors and organizers. Nat Rev Mol Cell Biol. 2013;14:98–112. doi: 10.1038/nrm3512. [DOI] [PubMed] [Google Scholar]
- 17.Sohal DS, et al. Temporally regulated and tissue-specific gene manipulations in the adult and embryonic heart using a tamoxifen-inducible Cre protein. Circ Res. 2001;89:20–25. doi: 10.1161/hh1301.092687. [DOI] [PubMed] [Google Scholar]
- 18.Rockman HA, et al. Segregation of atrial-specific and inducible expression of an atrial natriuretic factor transgene in an in vivo murine model of cardiac hypertrophy. Proc Natl Acad Sci USA. 1991;88:8277–8281. doi: 10.1073/pnas.88.18.8277. [DOI] [PMC free article] [PubMed] [Google Scholar]
- 19.Boukens BJ, Rivaud MR, Rentschler S, Coronel R. Misinterpretation of the mouse ECG: “Musing the waves of Mus musculus.”. J Physiol. 2014;592:4613–4626. doi: 10.1113/jphysiol.2014.279380. [DOI] [PMC free article] [PubMed] [Google Scholar]
- 20.Xiao M, et al. Impaired hippocampal synaptic transmission and plasticity in mice lacking fibroblast growth factor 14. Mol Cell Neurosci. 2007;34:366–377. doi: 10.1016/j.mcn.2006.11.020. [DOI] [PubMed] [Google Scholar]
- 21.Wu Q-F, et al. Fibroblast growth factor 13 is a microtubule-stabilizing protein regulating neuronal polarization and migration. Cell. 2012;149:1549–1564. doi: 10.1016/j.cell.2012.04.046. [DOI] [PubMed] [Google Scholar]
- 22.Bastiani M, et al. MURC/Cavin-4 and cavin family members form tissue-specific caveolar complexes. J Cell Biol. 2009;185:1259–1273. doi: 10.1083/jcb.200903053. [DOI] [PMC free article] [PubMed] [Google Scholar]
- 23.Yarbrough TL, Lu T, Lee H-C, Shibata EF. Localization of cardiac sodium channels in caveolin-rich membrane domains: Regulation of sodium current amplitude. Circ Res. 2002;90:443–449. doi: 10.1161/hh0402.105177. [DOI] [PubMed] [Google Scholar]
- 24.Minamisawa S, et al. Junctophilin type 2 is associated with caveolin-3 and is down-regulated in the hypertrophic and dilated cardiomyopathies. Biochem Biophys Res Commun. 2004;325:852–856. doi: 10.1016/j.bbrc.2004.10.107. [DOI] [PubMed] [Google Scholar]
- 25.Liu L, Pilch PF. A critical role of cavin (polymerase I and transcript release factor) in caveolae formation and organization. J Biol Chem. 2008;283:4314–4322. doi: 10.1074/jbc.M707890200. [DOI] [PubMed] [Google Scholar]
- 26.Hill MM, et al. PTRF-Cavin, a conserved cytoplasmic protein required for caveola formation and function. Cell. 2008;132:113–124. doi: 10.1016/j.cell.2007.11.042. [DOI] [PMC free article] [PubMed] [Google Scholar]
- 27.Smart EJ, Ying Ys, Donzell WC, Anderson RGW. A role for caveolin in transport of cholesterol from endoplasmic reticulum to plasma membrane. J Biol Chem. 1996;271:29427–29435. doi: 10.1074/jbc.271.46.29427. [DOI] [PubMed] [Google Scholar]
- 28.Markandeya YS, et al. Caveolin-3 overexpression attenuates cardiac hypertrophy via inhibition of T-type Ca2+ current modulated by protein kinase Cα in cardiomyocytes. J Biol Chem. 2015;290:22085–22100. doi: 10.1074/jbc.M115.674945. [DOI] [PMC free article] [PubMed] [Google Scholar]
- 29.Lo HP, et al. The caveolin-cavin system plays a conserved and critical role in mechanoprotection of skeletal muscle. J Cell Biol. 2015;210:833–849. doi: 10.1083/jcb.201501046. [DOI] [PMC free article] [PubMed] [Google Scholar]
- 30.Cheng JPX, et al. Caveolae protect endothelial cells from membrane rupture during increased cardiac output. J Cell Biol. 2015;211:53–61. doi: 10.1083/jcb.201504042. [DOI] [PMC free article] [PubMed] [Google Scholar]
- 31.Maillet M, van Berlo JH, Molkentin JD. Molecular basis of physiological heart growth: Fundamental concepts and new players. Nat Rev Mol Cell Biol. 2013;14:38–48. doi: 10.1038/nrm3495. [DOI] [PMC free article] [PubMed] [Google Scholar]
- 32.Lau C, et al. Syk associates with clathrin and mediates phosphatidylinositol 3-kinase activation during human rhinovirus internalization. J Immunol. 2008;180:870–880. doi: 10.4049/jimmunol.180.2.870. [DOI] [PubMed] [Google Scholar]
- 33.Kim J-H, et al. Inhibition of EGFR signaling in human prostate cancer PC-3 cells by combination treatment with beta-phenylethyl isothiocyanate and curcumin. Carcinogenesis. 2006;27:475–482. doi: 10.1093/carcin/bgi272. [DOI] [PubMed] [Google Scholar]
- 34.Konhilas JP, et al. Exercise can prevent and reverse the severity of hypertrophic cardiomyopathy. Circ Res. 2006;98:540–548. doi: 10.1161/01.RES.0000205766.97556.00. [DOI] [PubMed] [Google Scholar]
- 35.Kreusser MM, et al. Cardiac CaM kinase II genes δ and γ contribute to adverse remodeling but redundantly inhibit calcineurin-induced myocardial hypertrophy. Circulation. 2014;130:1262–1273. doi: 10.1161/CIRCULATIONAHA.114.006185. [DOI] [PMC free article] [PubMed] [Google Scholar]
- 36.Hayer A, Stoeber M, Bissig C, Helenius A. Biogenesis of caveolae: Stepwise assembly of large caveolin and cavin complexes. Traffic. 2010;11:361–382. doi: 10.1111/j.1600-0854.2009.01023.x. [DOI] [PubMed] [Google Scholar]
- 37.Liu L, et al. Deletion of Cavin/PTRF causes global loss of caveolae, dyslipidemia, and glucose intolerance. Cell Metab. 2008;8:310–317. doi: 10.1016/j.cmet.2008.07.008. [DOI] [PMC free article] [PubMed] [Google Scholar]
- 38.Munoz-Sanjuan I, Simandl BK, Fallon JF, Nathans J. Expression of chicken fibroblast growth factor homologous factor (FHF)-1 and of differentially spliced isoforms of FHF-2 during development and involvement of FHF-2 in chicken limb development. Development. 1999;126:409–421. doi: 10.1242/dev.126.2.409. [DOI] [PubMed] [Google Scholar]
- 39.Muñoz-Sanjuán I, Cooper MK, Beachy PA, Fallon JF, Nathans J. Expression and regulation of chicken fibroblast growth factor homologous factor (FHF)-4 during craniofacial morphogenesis. Dev Dyn. 2001;220:238–245. doi: 10.1002/1097-0177(20010301)220:3<238::AID-DVDY1104>3.0.CO;2-T. [DOI] [PubMed] [Google Scholar]
- 40.Nishimoto S, Nishida E. Fibroblast growth factor 13 is essential for neural differentiation in Xenopus early embryonic development. J Biol Chem. 2007;282:24255–24261. doi: 10.1074/jbc.M704277200. [DOI] [PubMed] [Google Scholar]
- 41.DeStefano GM, et al. Position effect on FGF13 associated with X-linked congenital generalized hypertrichosis. Proc Natl Acad Sci USA. 2013;110:7790–7795. doi: 10.1073/pnas.1216412110. [DOI] [PMC free article] [PubMed] [Google Scholar]
- 42.Yamada E. The fine structure of the gall bladder epithelium of the mouse. J Biophys Biochem Cytol. 1955;1:445–458. doi: 10.1083/jcb.1.5.445. [DOI] [PMC free article] [PubMed] [Google Scholar]
- 43.Palade GE. Fine structure of blood capillaries. J Appl Phys. 1953;24:1424–1436. [Google Scholar]
- 44.Woodman SE, et al. Caveolin-3 knock-out mice develop a progressive cardiomyopathy and show hyperactivation of the p42/44 MAPK cascade. J Biol Chem. 2002;277:38988–38997. doi: 10.1074/jbc.M205511200. [DOI] [PubMed] [Google Scholar]
- 45.Ardissone A, et al. Novel PTRF mutation in a child with mild myopathy and very mild congenital lipodystrophy. BMC Med Genet. 2013;14:89. doi: 10.1186/1471-2350-14-89. [DOI] [PMC free article] [PubMed] [Google Scholar]
- 46.Hayashi YK, et al. Human PTRF mutations cause secondary deficiency of caveolins resulting in muscular dystrophy with generalized lipodystrophy. J Clin Invest. 2009;119:2623–2633. doi: 10.1172/JCI38660. [DOI] [PMC free article] [PubMed] [Google Scholar]
- 47.Rajab A, et al. Fatal cardiac arrhythmia and long-QT syndrome in a new form of congenital generalized lipodystrophy with muscle rippling (CGL4) due to PTRF-CAVIN mutations. PLoS Genet. 2010;6:e1000874. doi: 10.1371/journal.pgen.1000874. [DOI] [PMC free article] [PubMed] [Google Scholar]
- 48.McMahon K-A, et al. SRBC/cavin-3 is a caveolin adapter protein that regulates caveolae function. EMBO J. 2009;28:1001–1015. doi: 10.1038/emboj.2009.46. [DOI] [PMC free article] [PubMed] [Google Scholar]
- 49.Hansen CG, Shvets E, Howard G, Riento K, Nichols BJ. Deletion of cavin genes reveals tissue-specific mechanisms for morphogenesis of endothelial caveolae. Nat Commun. 2013;4:1831. doi: 10.1038/ncomms2808. [DOI] [PMC free article] [PubMed] [Google Scholar]
- 50.Naslavsky N, Caplan S. EHD proteins: Key conductors of endocytic transport. Trends Cell Biol. 2011;21:122–131. doi: 10.1016/j.tcb.2010.10.003. [DOI] [PMC free article] [PubMed] [Google Scholar]
- 51.Curran J, et al. EHD3-dependent endosome pathway regulates cardiac membrane excitability and physiology. Circ Res. 2014;115:68–78. doi: 10.1161/CIRCRESAHA.115.304149. [DOI] [PMC free article] [PubMed] [Google Scholar]
- 52.Curran J, et al. Eps15 homology domain-containing protein 3 regulates cardiac T-type Ca2+ channel targeting and function in the atria. J Biol Chem. 2015;290:12210–12221. doi: 10.1074/jbc.M115.646893. [DOI] [PMC free article] [PubMed] [Google Scholar]
- 53.Morén B, et al. EHD2 regulates caveolar dynamics via ATP-driven targeting and oligomerization. Mol Biol Cell. 2012;23:1316–1329. doi: 10.1091/mbc.E11-09-0787. [DOI] [PMC free article] [PubMed] [Google Scholar]
- 54.Sinha B, et al. Cells respond to mechanical stress by rapid disassembly of caveolae. Cell. 2011;144:402–413. doi: 10.1016/j.cell.2010.12.031. [DOI] [PMC free article] [PubMed] [Google Scholar]
- 55.Pfeiffer ER, et al. Caveolae in ventricular myocytes are required for stretch-dependent conduction slowing. J Mol Cell Cardiol. 2014;76:265–274. doi: 10.1016/j.yjmcc.2014.09.014. [DOI] [PMC free article] [PubMed] [Google Scholar]
- 56.Patel HH, Murray F, Insel PA. Caveolae as organizers of pharmacologically relevant signal transduction molecules. Annu Rev Pharmacol Toxicol. 2008;48:359–391. doi: 10.1146/annurev.pharmtox.48.121506.124841. [DOI] [PMC free article] [PubMed] [Google Scholar]
- 57.Stary CM, et al. Caveolins: Targeting pro-survival signaling in the heart and brain. Front Physiol. 2012;3:393. doi: 10.3389/fphys.2012.00393. [DOI] [PMC free article] [PubMed] [Google Scholar]
- 58.Koga A, et al. Adenovirus-mediated overexpression of caveolin-3 inhibits rat cardiomyocyte hypertrophy. Hypertension. 2003;42:213–219. doi: 10.1161/01.HYP.0000082926.08268.5D. [DOI] [PubMed] [Google Scholar]
- 59.National Research Council . Guide for the Care and Use of Laboratory Animals. 8th Ed National Academies Press; Washington, DC: 2011. [Google Scholar]
- 60.Mitchell GF, Jeron A, Koren G. Measurement of heart rate and Q-T interval in the conscious mouse. Am J Physiol. 1998;274:H747–H751. doi: 10.1152/ajpheart.1998.274.3.H747. [DOI] [PubMed] [Google Scholar]
- 61.Ostrom RS, Insel PA. Methods for the study of signaling molecules in membrane lipid rafts and caveolae. Methods Mol Biol. 2006;332:181–191. doi: 10.1385/1-59745-048-0:181. [DOI] [PubMed] [Google Scholar]


