

Abstract
Chlamydia trachomatis is the world's most prevalent bacterial sexually transmitted infection and leading infectious cause of blindness, yet it is one of the least understood human pathogens, in part due to the difficulties of in vitro culturing and the lack of available tools for genetic manipulation. Genome sequencing has reinvigorated this field, shedding light on the contemporary history of this pathogen. Here, we analyze 563 full genomes, 455 of which are novel, to show that the history of the species comprises two phases, and conclude that the currently circulating lineages are the result of evolution in different genomic ecotypes. Temporal analysis indicates these lineages have recently expanded in the space of thousands of years, rather than the millions of years as previously thought, a finding that dramatically changes our understanding of this pathogen's history. Finally, at a time when almost every pathogen is becoming increasingly resistant to antimicrobials, we show that there is no evidence of circulating genomic resistance in C. trachomatis.
Chlamydia trachomatis infections, including their severe sequelae, are major public health concerns globally, resulting in significant morbidity and health care costs (Owusu-Edusei et al. 2013). C. trachomatis has been estimated to be the most common bacterial sexually transmitted infection (STI) worldwide, with 131 million cases among adults annually (World Health Organisation 2014; Newman et al. 2015). Furthermore C. trachomatis is the etiological agent of the severe ocular disease trachoma, with an estimated 232 million people at risk of blindness worldwide (World Health Organisation 2014).
Our clinical and epidemiological understanding of C. trachomatis is primarily based upon typing of the ompA gene: genotypes A, B, Ba, and C associate with trachoma (ocular lineage); D, E, F, G, H, I, Ia, J, and K with urogenital infection (lineages T1 and T2); and L1, L2, L2b, L2c, and L3 with the more invasive lymphogranuloma venereum (LGV) lineage (Harris et al. 2012). Biologically, despite the large number of cases and the potential severity of infections, C. trachomatis is poorly understood due to its obligate intracellular lifestyle, the difficulties in growing strains in vitro, and, until recently, a lack of genetic tools for manipulation and transformation (Wang et al. 2011; Song et al. 2013).
Genomics has provided an alternative route to understanding this disease and has shown that C. trachomatis has evolved through reductive evolution, likely from nonpathogenic ancestors that became specialized to humans (Stephens et al. 1998; Borges et al. 2012). C. trachomatis comprises a ∼1-Mb chromosome and ∼7-kb plasmid (Stephens et al. 1998). The species phylogeny consists of four deeply branching lineages that are strongly, but not exclusively, associated with site of infection (Joseph et al. 2011; Borges et al. 2012; Harris et al. 2012; Andersson et al. 2016).
Homologous recombination, pervasive across the bacterial kingdom (Feil et al. 2001), was initially thought to be uncommon in C. trachomatis owing to its intracellular niche (Fraser et al. 2007; Nunes et al. 2007). However, recent whole-genome analyses have shown that recombination is widespread across multiple species of the Chlamydiaceae with the ratio of diversity introduced by recombination and mutation (r/m) estimated at between 0.56 and 3.19 (r/m 0.71–1.11 for C. trachomatis), and certain regions of the genome, including the clinically and epidemiologically relevant ompA, exhibit elevated levels of fixed, and therefore detectable, recombinations (Brunelle and Sensabaugh 2005; Klint et al. 2007; Joseph et al. 2011, 2012; Harris et al. 2012; Read et al. 2013). This is backed up experimentally, with in vitro coinfections of several C. trachomatis strains leading to extensive homologous recombination (Jeffrey et al. 2013), and supported by epidemiological estimates of mixed infections at between 2% and 13% (DeMars et al. 2007). These studies indicate that recombination is possibly the more important mechanism generating diversity in this species.
Antimicrobial resistance is currently recognized as one of the most critical threats to human health. Many bacterial species are becoming fully resistant to all frontline drugs, including sexually transmitted bacteria such as Neisseria gonorrhoeae and Mycoplasma genitalium, which commonly coinfect with C. trachomatis (Unemo and Shafer 2011). Despite treatment failures of C. trachomatis infections with recommended therapeutic antimicrobials being reported (Hogan et al. 2004), isolated reports of genomically conferred resistance (Misyurina et al. 2004; Jiang et al. 2015), and the ease with which resistance can be selected for in vitro by exposure to subinhibitory antimicrobial concentrations (Sandoz and Rockey 2010), little is known about the prevalence, if any, of circulating resistance traits.
This study was motivated by the fact that our current genomic view of C. trachomatis is based on whole-genome data sets of at most 59 genomes, limited largely by sample collection technology and sequencing cost. There remain many unanswered questions, including the age of C. trachomatis, the rate of evolution, and the evolutionary differences between and within the four deep-branching lineages. The rate of single-nucleotide polymorphism (SNP) accumulation is particularly important as estimating it would allow us to better understand the dynamics of infection transmission. In addition, there is a critical need to establish whether antimicrobial resistance has begun to circulate in clinical isolates. This study sought to elucidate, in a detailed manner, the evolution of the C. trachomatis species by sequencing a worldwide collection of hundreds of current and historical clinical strains, increasing the sample size studied for this pathogen by nearly an order of magnitude. This study forms the most comprehensive and robust analysis of C. trachomatis genomics yet undertaken, includes cultured isolates as well as those sequenced directly from primary clinical specimens, and provides clear insights into the evolutionary history and dynamics, which may have implications for diagnosis, epidemiology, and human public health worldwide.
Results
We present the largest and broadest genomic and evolutionary study of C. trachomatis published to date, comprising 563 full genomes of isolates collected between 1957 and 2012, 455 of which are reported here for the first time (Supplemental Table S1). We strove to obtain samples without, or with minimal, laboratory passage in order to assemble a set of isolates representative of clinical and in vivo evolution. Recent work examining the impact of in vitro culture has shown that pseudogenization is directly associated with prolonged laboratory passage, emphasizing the importance of culture-free techniques to fully understand natural patterns of evolution (Bonner et al. 2015). This entailed the use of culture-free DNA extraction methods from primary diagnostic swab samples and direct-from-sample sequencing strategies developed by us and others to complement the samples grown by minimal culture (Seth-Smith et al. 2013a; Christiansen et al. 2014). We obtained 76 genomes using multiple displacement amplification (MDA), 103 with additional immunomagnetic separation (IMS-MDA), and 77 samples by SureSelect target enrichment, providing 170 novel genomes obtained without the use of culture. Our sampling included clinical samples from a diverse cross-section of countries (n = 21) in Europe, North America, South America, Africa, Asia, and Australia. All known genotypes are represented, including isolates that do not fit the generally understood linkage between genotype and site of infection. Historical archived samples dating to the 1950s are also included. Together, this data set provides a unique basis to answer subtle, but fundamental, questions about the evolutionary flux in this important human pathogen.
The species consists of four deep-branching lineages
The global phylogeny of all samples sequenced thus far (Fig. 1) confirms that the species consists of four deep-branching monophyletic lineages that generally associate with tropism—two urogenital lineages, T1 (n = 250) and T2 (n = 193); an ocular lineage (n = 61); and a LGV lineage (n = 59)—consistent with previous reports (Harris et al. 2012; Joseph et al. 2012; Nunes and Gomes 2014). Plasmid inheritance was almost entirely vertical at this resolution except for three cases where plasmid replacement from other lineages has occurred (Supplemental Fig. S1); in addition, the plasmid phylogeny associated with lineage T2 is paraphyletic due to an apparent recombination event (Supplemental Fig. S2).
Figure 1.

Global phylogeny and recombination landscape of 563 C. trachomatis genomes. The phylogeny (left), with associated genotype and geographical data, is displayed alongside the linearized chromosome (right). Lineage labels are as per previous publications. Line graph (right, top) shows the number of recombination events affecting individual genes and are colored according to lineage. Black blocks below this graph show previously identified “hotspots” of recombination (Harris et al. 2012). Colored blocks (right, bottom) indicate inferred recombination events each affecting selected taxa and genomic location, with color indicating the number of inferred events. Gene annotations correspond to strain D/UW3. (PZ) Plasticity zone.
Geographical location is significantly associated with phylogenetic distance in the urogenital lineages (Fig. 2). This information allows us to say that isolates fewer than 210 (T1) or 280 (T2) SNPs apart are more than 50% likely to come from the same country, whereas for isolates to have a 50% probability of sharing the same genotype, the distances are much larger: 1850 SNPs and 1470 SNPs for lineages T1 and T2, respectively. Genotype, as expected, is also significantly correlated with evolutionary distance (Fig. 2) and, furthermore, is strongly associated with lineage (Table 1). We see no association between the gender of the patient and evolutionary separation of strain. Limited geographical sampling in the ocular and LGV lineages prohibits us from drawing definitive conclusions, although we note that all LGV isolates were sampled from males due to current transmission patterns of this clade. Culture-free isolates show phylogenetic clustering most likely due to the nonrandom nature of sample collection and processing. Importantly, we see both cultured and culture-free extraction methods providing samples that locate throughout the tree, indicating that there is no sizeable diversity missed by culture methods alone.
Figure 2.

Proportion of pairwise isolates sharing a given trait (country or genotype) as a function of genomic divergence for the well-sampled urogenital lineages T1 (top) and T2 (bottom). (Top, left) For instance any pair of isolates less than approximately 400 mutations apart contain the same trait (country of isolation) in 50% of cases. (Red) Observed data; (blue) 100 permutations; (left) country of isolation; (right) genotype.
Table 1.
Genotype distribution and prevalence across the lineages
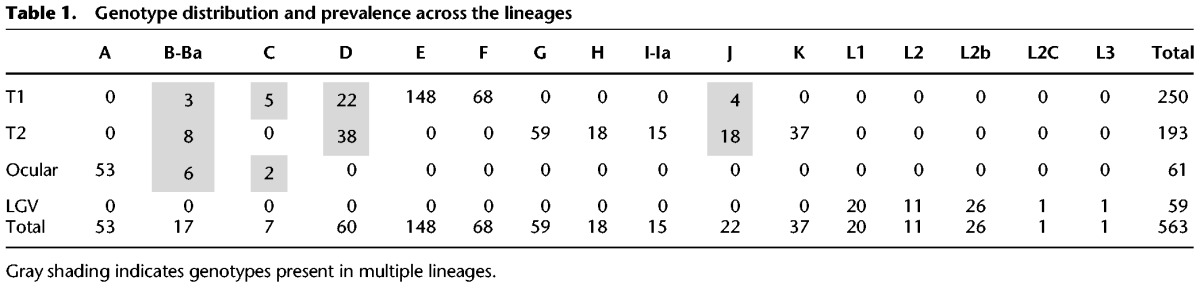
Of the 51 countries known or suspected to be endemic for trachoma (World Health Organisation 2014), we have samples from only six. This limited range reflects the fact that most control programs do not routinely collect samples, so our sampling is largely limited to the areas that have active research projects; therefore, we are limited to analyzing small pockets of genetic variation for this disease. A recent study investigating trachoma in the Aboriginal population of Australia showed that isolates with genotypes B, Ba, and C were found outside the ocular lineage and were associated with ocular disease (Andersson et al. 2016), as indicated in Supplemental Figure S3. Within this study, we find isolates with the same genomic backbone, including genotype, as those from Australia in urogenital samples from Europe (Supplemental Fig. S3), indicating that these strains are not restricted to Australia.
Previous studies with relatively small sample sizes have allowed identification of the broad differences between lineages but have not been able to define evolutionary characteristics within the lineages themselves. The phylogeny shown in Figure 1 elucidates the contrasting appearance of the two urogenital lineages. T1, in comparison with T2, contains fewer vertically inherited SNPs as evidenced by its “flatter” appearance. T1, the most sampled lineage in this study, contains a monophyletic expansion consisting almost entirely of genotype E isolates (n = 148/149) (Table 1). Genotype E is the most epidemiologically successful genotype worldwide and is entirely contained within this expansion, indicating a relatively recent emergence where recombination has not disrupted the ompA gene, yet one that has spread worldwide. This contrasts with previous studies showing that ompA has the highest rates of observed recombination, which results in frequent genotype switching across the species (Harris et al. 2012).
A comparison of phylogenies with and without predicted recombination events (Supplemental Fig. S4) left the overall structure of four lineages firmly intact, indicating that recombination events have not introduced sufficient homoplasy to disrupt this evolutionary signal. Recombinations have, however, resulted in extensive intra-lineage changes in topology, a discordance that indicates that recombination must be taken into account when trying to understand the evolution of the species on detailed level.
Lineage-specific patterns of recombination
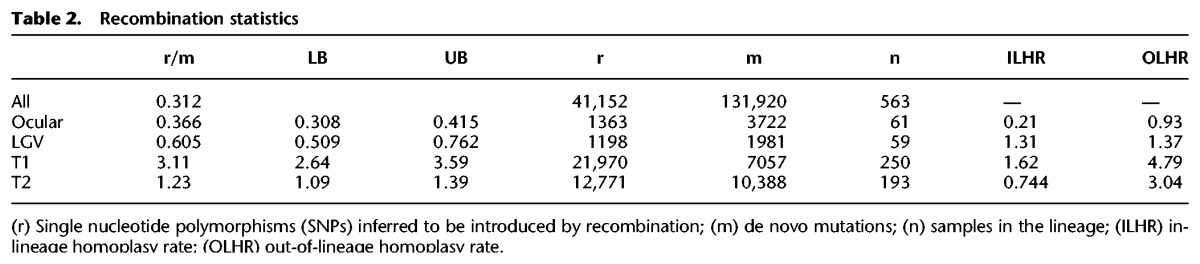
The evolutionary, clinical, and epidemiological significance of recombination in C. trachomatis has recently become apparent, and we have investigated these dynamics in much greater detail than previously possible. By examining all 563 genomes in the present study, we detected 1116 putative recombination blocks (Fig. 1, heatmap) spanning an average of 7.5 kb per recombination (95% CI: 7.0–8.0 kb) and covering an average of 246 kb per isolate (23% of the genome) with an average r/m of 0.31. Hotspots of recombination were originally observed around the ompA locus (Gomes et al. 2006) and subsequently detected to be nonuniformly distributed across the genome (Harris et al. 2012). It is clear that with deeper sampling, the recombination landscape is more dynamic than would be expected from a small number of hotspots (Fig. 1). The six previously identified regions of higher than average recombination (Harris et al. 2012) are identified here, including region 1 (around ompA), region 2 (including pmpE-I), region 3 (around CT051 and hemN), and region 6 (around CT622). We find that regions 4 and 5 are bridged into one continuous region of increased recombination that encompasses the plasticity zone (PZ) (Fig. 1). While these regions show increased rates of recombination in all lineages, the majority of recombination is specific to a lineage or a clade within a lineage, such as between regions 3 and 4 (spanning rl28 to CT103) that has markedly increased recombination present only in lineage T1. Indeed, the overall effect of recombination varies nearly 10-fold between lineages, from r/m = 0.37 (ocular) to 3.11 (T1) (Table 2). The two urogenital lineages also experience markedly differing amounts of recombination (r/m 1.23–3.11), a result that leads to dramatic differences in how recombination shapes their respective phylogenies (Table 1; Supplemental Fig. S4), further suggesting that T1 is a more recent lineage that has experienced expansion driven by recombination. These observations are only made possible by larger and more representative sampling and confirm that our previous views were too simplistic. Variation in recombination across a genome may be mechanistic, selective, or stochastic. There is no evidence for mechanistic differences (Gomes et al. 2006), and the consistency of locations of recombination across samples refutes a stochastic process, leading us to conclude that we are seeing the signatures of selective pressures on multiple levels: the species as a whole, a lineage, or an expansion within a lineage.
Table 2.
Recombination statistics
These lineage-specific evolutionary traits provide for the first time important clues as to the roles of genes in different host environments. To define the genes in these recombination regions that are lineage specific, we clustered genes according to the number of observed recombination events per lineage. This clustering (Fig. 3; Supplemental Table S2) helps us to elucidate sets of genes under differing selective pressures in different lineages. For example, we found a set of 18 genes, including the inclusion membrane protein genes incA and incB, that appears to be under increased selective pressure in the LGV clade. Inc genes are known immune targets, and these results may indicate a selective host pressure specific to this lineage. As in vitro experiments often use LGV strains (owing to their ease of infection in cell culture), these data should be consulted to ensure that the genes of interest are not under differing dynamics in the LGV lineage alone.
Figure 3.

Clustering of genes by recombination frequency in each lineage reveals lineage-specific profiles. Each horizontal line represents a gene with colors corresponding to standard deviations from the clade-specific mean. (Right) Expansion of the seven most actively recombining clusters. Clusters do not necessarily represent order of genes along the genome.
Evolutionary timeline for the emergence of C. trachomatis
The temporal history and mutation rate of C. trachomatis is poorly understood and has never been directly calculated. Root-to-tip analysis shows that the LGV clade contains significant temporal structure (R2 = 0.62, permuted P ≤ 0.001) (Supplemental Fig. S5). This clade contained a number of isolates dating to the 1960s, sequenced here from stocks archived in the 1960s. A Bayesian analysis of these isolates using BEAST (Drummond and Rambaut 2007) placed the most recent common ancestor (MRCA) of the LGV clade around 900 CE (common era) (95% highest posterior density [HPD] 200 CE–1430 CE) (Fig. 4A; Supplemental Fig. S5). These results are dramatically different to a previous estimate of 15 Myr ago (Joseph et al. 2012), which used estimates of the split between C. trachomatis and C. pneumoniae, rather than our historical sampling approach. Our data predict that the L2b isolates arose about 100 yr ago, which fits with epidemiological reports (Schachter and Moncada 2005).
Figure 4.

(A) Temporal analysis of the LGV clade indicates a most recent common ancestor (MRCA) between 200 CE and 1430 CE (95% highest posterior density [HPD]). Dates along the x-axis are in years (CE), and blue bars show the 95% posterior probability. Posterior probabilities of node positions are indicated by closed circles (P = 1) or open circles (P > 0.8). (B) The Chlamydia trachomatis LGV mutation rate is shown in the context of other viruses, bacteria and eukaryotes. Error bars differ per species according to methodology, but for the case of C. trachomatis represent 95% posterior probability. Data sources shown in Supplemental Table S3. Buchnera aphidicola, another intracellular bacterium, has a similar genome size and mutation rate.
Our estimated substitution rates for this lineage were 2.15 × 10⁻⁷ SNPs/site/year (95% HPD 1.03 × 10⁻⁷–3.33 × 10⁻⁷), i.e., 0.2 SNPs per genome per year, which is consistent with rates reported for other bacteria, including the intracellular Buchnera aphidicola (Fig. 4B). The recently published substitution rate for the closely related Chlamydia psittaci of 1.68 × 10⁻⁴ mutations/site/yr (∼175 SNPs/yr) (Read et al. 2013) is nearly three orders of magnitude faster than that reported here and, when applied to these data, would predict that all modern C. trachomatis strains share a common ancestor within the past century, which is not possible. Analysis of other lineages showed some correlation between age and root-to-tip distance; however, this was not significant and could be an artifact of population structure, unidentified recombination events, or the scarcity of remaining vertically inherited SNPs. Long-term laboratory passage results in very few adaptive mutations, indicating that this is not a major source of bias (Borges et al. 2013). While it is perhaps unwise to extend the results from the LGV lineage to other lineages, doing so would indicate that all lineages are expansions during a timescale measured in thousands or in tens of thousands of years rather than in millions.
The origins of ompA
The ompA gene has strong relevance for clinical, epidemiological, and public health understanding, despite recombining frequently and at different rates compared with the rest of the genome. Our results clarify the usefulness and limitations of using ompA for epidemiology or phylogenetic inference. The majority of genotypes (12/16) are restricted to single lineages, with a further two (D, J) each found in both urogenital lineages (T1, T2) (Table 2). We found classical ocular genotypes B/Ba and C segregating multiple times in the urogenital lineages, consistent with previous reports and once again underlining the danger of using genotyping as a proxy for phylogenetic relatedness (Supplemental Fig. S3). Importantly, some of these isolates, which have a urogenital backbone and ocular ompA genes, were associated both with urogenital infections and ocular disease in children up to 9 yr of age, a finding detailed by Andersson et al. (2016). We find European isolates that are almost identical, including ompA type, showing that these strains are not geographically isolated.
The gene ompA is associated with phylogeny and tropism, despite experiencing the highest rates of observable recombination in the genome. The C. trachomatis ompA gene phylogeny reveals three clear lineages (labeled α, β, and γ) (Fig. 5A), which are broadly inconsistent with both tropism and whole-genome phylogeny. For instance, the “ocular” ompA types appear phylogenetically unrelated, while all LGV ompA types group together consistent with the whole genome. Four variable regions provide the majority of variation within the ompA gene with the regions at the 5′ and 3′ ends of the gene showing the most conservation (Fig. 5C), a pattern that was conserved across all members of the genus studied and may facilitate homologous recombination (Supplemental Fig. S6). Comparison between major outer membrane protein (MOMP)–encoding genes in other members of the Chlamydiaceae revealed evidence for between-species recombination in other members of the genus, but the C. trachomatis ompA forms a monophyly most closely related to those of Chlamydia muridarum and Chlamydia suis (Fig. 5B). The pattern of divergence from the reconstructed ancestor is not uniform among the clades, which may be due to differing selection pressures. Indeed, we found two regions in the C. trachomatis ompA clade β that are more closely related to ancestral C. suis isolates than other C. trachomatis clades (Supplemental Fig. S6).
Figure 5.

Diversity of the major outer membrane protein (MOMP) gene ompA. (A) Phylogenetic relationship between all 563 Chlamydia trachomatis isolates (ompA gene) shows separation into three clades labeled α, β, and γ. (B) Phylogenetic tree of 1003 MOMP-encoding genes across the Chlamydiaceae. (C) Divergence (proportion of differing nucleotides) of the ompA gene in three C. trachomatis clades compared with that of a reconstructed ancestor, shading indicates 10th and 90th percentiles.
No evidence for antimicrobial resistance in circulating C. trachomatis populations
While chlamydial persistence is a reported but poorly understood phenomenon (Hogan et al. 2004), there is no evidence for stable antimicrobial resistance in a clinical setting (Sandoz and Rockey 2010). This is despite the ease at which mutations conferring a high level antimicrobial resistance to most clinically relevant antimicrobials can be generated in vitro (for review, see Sandoz and Rockey 2010) and sporadic reports of clinical resistance (Hogan et al. 2004; Sandoz and Rockey 2010), including a case of phenotypic but not genotypic resistance (O'Neill et al. 2013). Although none of the isolates in this study were deemed clinically resistant, in order to understand whether any of these mutations were present in a circulating population, we performed a systematic search for known resistance alleles, either fixed or heterozygous. We found absolutely no evidence for genomic resistance in this large, clinically relevant data set. This analysis included the 23S rRNA gene, which contains previously described resistance mutations to the macrolide azithromycin, the current frontline antimicrobial treatment. It is important to note that these samples were collected from patients for routine diagnosis prior to antibiotic treatment and were not from treatment failures.
Discussion
It is unlikely that older or more diverse strains will ever be available for analysis on the scale presented here. Despite the geographical clustering present in the data, our sampled locations are spread across the phylogeny, giving us the necessary platform to draw broad conclusions about the current genomic picture of this pathogen, such that observations made here about the evolution of these lineages are likely to be applicable to the species as a whole.
Our data indicate two distinct phases in the evolution of C. trachomatis: deep variation and contemporary mixing. The phylogeny clearly shows four deeply divergent lineages that we estimate to have expanded over the last few thousand years, with the flatter appearance of lineage T1 potentially a signature of a more recent history of clonal expansions than found in T2 (Grenfell 2004). This overall structure is consistent with population bottlenecks such as isolation due to barriers created by geographical isolation facilitated by low host population density and lack of migration, which create barriers to recombination flow between groups (Fraser et al. 2007). We speculate that these populations would diverge, but themselves remain coherent through periodic selection by recombination and selective sweeps within the ecotype (Cohan 2001; Bendall et al. 2016). There is no evidence or requirement under this model for these lineages to be the result of introgression from other hosts; however, broader sampling, including of different host species, is required to truly clarify this hypothesis. Our analyses are not able to address the possibility of recombination between extant and unsampled lineages.
Contemporarily, we see large amounts of mixing between and within lineages. The lower rate of recombination between LGV and other lineages could be explained by a lower rate of coinfection, and therefore opportunity to recombine, with isolates from other lineages. Detectable recombination in this pathogen requires coinfection between diverse strains, and we hypothesize that this has become more frequent due to increases in human population density and mixing. We speculate that over time these recombinations will break down the deep phylogenetic structure we currently observe. While we see recent small-scale expansions in the phylogeny that correlate with source location and genotype, we expect each of these to be transient in nature and, in time, to disappear as these clades expand and are subject to recombination with strains outside their niche.
There are three notable exceptions to these trends. The epidemiologically driven expansion of the L2b monophyly is most probably due to their epidemiological association to the population of men who have sex with men. Thus, this expansion is a direct result of a niche created by human behavior, as observed in other pathogens such as Shigella flexneri serotype 3a (Baker et al. 2015). Second, ocular disease is today mostly understood in the context of the ocular lineage, which has maintained genetic coherence potentially due to geographical factors. Recent results (Andersson et al. 2016), included here, indicate that the trachoma lineage is not the only source for ocular disease and that this disease may be more ancient and genetically diverse than the ocular lineage alone. Finally, the expansion of genotype E, currently the most prevalent genotype, may be due to increased fitness at or around ompA, preventing recombinations being fixed in this region, being simply a stochastic increase, or being a combination of the two. These exceptions are fascinating and reinforce the fact that the evolutionary dynamics of C. trachomatis are intertwined with human behavior and population structure.
We noted across all our metrics that many of the variable regions are focused around membrane proteins (omp, pmp, inc), which are believed to be targets of immune response. We know that different lineages often inhabit different niches, and we have for the first time identified the differing signatures between lineages that are most likely due to changing tropic or immune pressures across the species. These results provide an invaluable resource for prospective in vitro studies or for the selection of appropriate vaccine candidates.
At a time in which nearly every human pathogen is becoming resistant to antimicrobials, C. trachomatis stands apart. It is interesting to contrast this with N. gonorrhoeae, with which it frequently coinfects, which is becoming a global health concern due to acquired genetic resistance. Our finding that there is absolutely no genetic evidence of resistance in circulating C. trachomatis is surprising given that resistance can easily evolve in vitro and that sporadic treatment failures do occur. While the sample collection did not include treatment failures, prior exposure to antibiotics (for any reason) of patients who visited an STI clinic for either C. trachomatis or N. gonorrhoeae has been reported to be ∼10% (Dukers-Muijrers et al. 2014). Thus, although these findings do not preclude the evolution of resistance in clinical cases, they show that any such mutations are not in the circulating C. trachomatis clinical population sampled in this study.
If reported treatment failures are a result of genetic mutations, these have not spread, implying that the fitness burden of resistance is too high for successful transmission. The rapid rise of the Swedish new variant of C. trachomatis (nvCt) (Seth-Smith et al. 2009; Unemo et al. 2010; Unemo and Clarke 2011), in which a deletion in the plasmid allowed diagnostic escape, shows that minority variants can rise in frequency to become fixed within a host and that given the right selective conditions, such as treatment escape, variants can quickly spread throughout the population. Given that this pathogen has been one of the two most common bacterial STIs during the entire antimicrobial era, the likelihood of resistance emerging and spreading now seems low.
Methods
C. trachomatis strains and DNA extraction
Samples (n = 563) were collected from 21 countries and include historical and current samples spanning over 50 yr (1957–2012). Previously published sequences, as well as resequenced strains, were also included in the analysis. DNA for sequencing was isolated directly from clinical swabs, from cultured collections, as well as from historical isolates propagated in yolk sac of embryonated hens’ eggs. DNA was processed using a variety of methods, including IMS (using an antibody against C. trachomatis lipopolysaccharide) with or without MDA (Seth-Smith et al. 2013a), as well as a custom SureSelect enrichment system similar to that recently described by Christiansen et al. (2014) that allows sequencing from clinical swabs stored in lysis buffer. Details of all strains and methods used are in Supplemental Table S1.
Sequencing, mapping, and quality control
Sequencing was performed using Illumina HiSeq with multiplexing using paired read lengths of between 75 and 100 bp. In order to check coverage and quality, sequences were first mapped to a published reference chromosome specific to their lineage (T1: F/SW4, T2: D/UW3, LGV: L2/434, ocular: A/HAR-13) (for accession numbers, see Supplemental Table S1) using SMALT (version 0.7.4, 90% minimum read identity; www.sanger.ac.uk/resources/software/smalt/) and GATK insertion/deletion realignment (McKenna et al. 2010). Sequences with less than 5× mean coverage across 95% of the chromosome were excluded, as were sequences with uneven coverage, indicated by a coefficient of variation greater than one (Seth-Smith et al. 2013b). SNPs were called using previously described methods (Harris et al. 2012), and short insertions/deletions were included in the resulting alignment. To identify samples with mixed C. trachomatis populations, we identified heterozygous sequences by identifying all positions with minor allele frequencies >0.2 as determined by BCFtools v0.1.19 (Li et al. 2009; http://samtools.github.io/bcftools/) and excluding those sequences with more than 300 such positions (mean 105 bp; standard deviation 600 bp). For consistent analysis, we created a pseudogenome to represent all the diversity observed in a previously published species-wide analysis (Harris et al. 2012) with gene names as per the published D/UW3 strain (Stephens et al. 1998), to which all samples were remapped.
Genotyping
We genotyped samples by mapping reads to a panel of 28 reference ompA sequences chosen to represent all previously published genotypes. Genotypes B/Ba, I/Ia, and J/Ja are grouped together since the ompA sequence differences between these pairs of genotypes are minimal. Samples were mapped against this panel using the same parameters given in the previous section. Genotypes were allocated by minimizing pairwise differences. Where multiple references had fewer than two SNPs against the samples, the results were manually checked using Artemis (Carver et al. 2012) to ensure accurate mapping.
Phylogenetics and recombination detection
Initial chromosome and plasmid phylogenies were constructed using RAxML (Stamatakis et al. 2005) from a variable sites alignment using C. muridarum as an outgroup (this outgroup is not displayed in figures). Putative recombination regions were identified as previously published (Croucher et al. 2011). In brief, regions of increased SNP density relative to the phylogenetic neighbors were identified and removed in an iterative fashion. Final phylogenies were constructed using RAxML on the resulting (recombination removed) alignment.
Pairwise sharing of traits was investigated by calculating the proportion of pairs of isolates below a certain distance (patristic distance from the recombination removed tree) that share the same trait. One hundred permutations of the traits were computed to test the null hypothesis that the trait was not correlated with difference and to calculate the statistical significance of any observed difference.
Recombination analysis
To investigate the genes affected by recombination and the differences between lineages, we scored each gene with the number of recombination events overlapping that gene in each lineage. To correct for any sampling differences, scores in each lineage were represented by the number of standard deviations from the mean (of the lineage). k-means clustering was used to partition all genes into groups with the number of groups chosen by inspecting the sum of squared error plot. To explore whether recombination was due to donors from the same lineage, we classed homoplasic SNPs as those confined to a certain lineage as opposed to those found in multiple lineages. The number of such positions were scaled by the synapomorphic SNPs in a 10-kb sliding window at 1-kb intervals across the genome, similar to the method previously described (Everitt et al. 2014).
Dating analysis
Only samples with associated sample collection dates were included in this analysis with putative recombination events removed from the genomic data. Root-to-tip regression analysis was used to date the phylogeny. The significance of this regression was estimated by comparison of the R2 values between 100 permutations. BEAST version 1.8.0 (Drummond and Rambaut 2007) was run in triplicate under a strict clock and a number of population models (constant population size, exponential growth, and Bayesian skyline with four groups). In all three cases, the triplicates converged (effective sample size > 200 and highly similar parameter estimate distributions), and the inferred tree height and mutation rates were comparable.
MOMP comparisons
In addition to the C. trachomatis ompA sequences, 440 genes >500 bp were extracted from NCBI via the search term (“Chlamydia/Chlamydophila group”[Organism] NOT “Chlamydia trachomatis”[Organism]) AND (ompA[Gene Name] OR MOMP[Gene Name]). MUSCLE version 3.8.31 (Edgar 2004) was used to align these genes, and a phylogenetic tree was drawn as before. Pairwise differences were calculated by comparison with a given reference and used a 50-bp sliding window with 1-bp step size. FastML (Pupko et al. 2000) was used to reconstruct the C. trachomatis ancestor.
Putative resistance mutations and 23S rRNA mapping
The high depth of sequence coverage obtained allows identification of allele variants that are present but not fixed (as SNPs) in samples. Short-read mapping data were investigated at positions that confer antimicrobial resistance in vitro in the literature. Heterozygous alleles were identified as positions with multiple alleles each with a per-strand read depth above five where mapping and base (phred) quality was above 30, and optical duplicates were removed. As the reference C. trachomatis genome has two (identical) copies of the rRNA operon, one copy of the 23S rRNA gene was masked out during mapping. Kraken (Wood and Salzberg 2014) analysis of reads mapping to this region indicated that a proportion were from other species. We therefore employed differential mapping to one copy of the C. trachomatis rRNA operon and the corresponding operon from Lactobacillus salivarius strain UCC118 (the highest species match from multiple Kraken results) and additionally required that mapped reads were properly paired (i.e., both reads map to the operon). Differential mapping is essential as DNA from other species is often extracted and subsequently sequenced at low depth. Due to the high similarity of rRNA regions, this may cause the appearance of heterozygous SNPs and possible resistance alleles (Supplemental Fig. S7).
Data access
The sequencing data from this study have been submitted to the European Nucleotide Archive (ENA; http://www.ebi.ac.uk/ena) under the accession numbers listed in Supplemental Table S1.
Supplementary Material
Acknowledgments
This study was supported by the Sanger Institute through the Wellcome Trust grant 098051. We thank the sequencing teams at the Wellcome Trust Sanger Institute for sequencing the samples and for all of those who meticulously collected and preserved the samples included in this study. We thank the Australian National Health and Medical Research Council project grant 1060768 for their support of P.A. and P.M.G.
Footnotes
[Supplemental material is available for this article.]
Article published online before print. Article, supplemental material, and publication date are at http://www.genome.org/cgi/doi/10.1101/gr.212647.116.
Freely available online through the Genome Research Open Access option.
References
- Andersson P, Harris SR, Smith HMBS, Hadfield J, Neill COR, Cutcliffe LT, Douglas FP, Asche LV, Mathews JD, Hutton SI, et al. 2016. Chlamydia trachomatis from Australian Aboriginal people with trachoma are polyphyletic composed of multiple distinctive lineages. Nat Commun 6: 1–11. [DOI] [PMC free article] [PubMed] [Google Scholar]
- Baker KS, Dallman TJ, Ashton PM, Day M, Hughes G, Crook PD, Gilbart VL, Zittermann S, Allen VG, Howden BP, et al. 2015. Intercontinental dissemination of azithromycin-resistant shigellosis through sexual transmission: a cross-sectional study. Lancet Infect Dis 15: 913–921. [DOI] [PubMed] [Google Scholar]
- Bendall ML, Stevens SL, Chan L-K, Malfatti S, Schwientek P, Tremblay J, Schackwitz W, Martin J, Pati A, Bushnell B, et al. 2016. Genome-wide selective sweeps and gene-specific sweeps in natural bacterial populations. ISME J 10: 1589–1601. [DOI] [PMC free article] [PubMed] [Google Scholar]
- Bonner C, Caldwell HD, Carlson JH, Graham MR, Kari L, Sturdevant GL, Tyler S, Zetner A, McClarty G. 2015. Chlamydia trachomatis virulence factor CT135 is stable in vivo but highly polymorphic in vitro. Pathog Dis 73: ftv043. [DOI] [PMC free article] [PubMed] [Google Scholar]
- Borges V, Nunes A, Ferreira R, Borrego MJ, Gomes JP. 2012. Directional evolution of Chlamydia trachomatis towards niche-specific adaptation. J Bacteriol 194: 6143–6153. [DOI] [PMC free article] [PubMed] [Google Scholar]
- Borges V, Ferreira R, Nunes A, Sousa-Uva M, Abreu M, Borrego MJ, Gomes JP. 2013. Effect of long-term laboratory propagation on Chlamydia trachomatis genome dynamics. Infect Genet Evol 17: 23–32. [DOI] [PubMed] [Google Scholar]
- Brunelle BW, Sensabaugh GF. 2005. The ompA gene in Chlamydia trachomatis differs in phylogeny and rate of evolution from other regions of the genome. Infect Immun 74: 578–585. [DOI] [PMC free article] [PubMed] [Google Scholar]
- Carver T, Harris SR, Berriman M, Parkhill J, McQuillan JA. 2012. Artemis: an integrated platform for visualization and analysis of high-throughput sequence-based experimental data. Bioinformatics 28: 464–469. [DOI] [PMC free article] [PubMed] [Google Scholar]
- Christiansen MT, Brown AC, Kundu S, Tutill HJ, Williams R, Brown JR, Holdstock J, Holland MJ, Stevenson S, Dave J, et al. 2014. Whole-genome enrichment and sequencing of Chlamydia trachomatis directly from clinical samples. BMC Infect Dis 14: 591. [DOI] [PMC free article] [PubMed] [Google Scholar]
- Cohan FM. 2001. Bacterial species and speciation. Syst Biol 50: 513–524. [DOI] [PubMed] [Google Scholar]
- Croucher NJ, Harris SR, Fraser C, Quail MA, Burton J, van der Linden M, McGee L, von Gottberg A, Song JH, Ko KS, et al. 2011. Rapid pneumococcal evolution in response to clinical interventions. Science 331: 430–434. [DOI] [PMC free article] [PubMed] [Google Scholar]
- DeMars R, Weinfurter J, Guex E, Lin J, Potucek Y. 2007. Lateral gene transfer in vitro in the intracellular pathogen Chlamydia trachomatis. J Bacteriol 189: 991–1003. [DOI] [PMC free article] [PubMed] [Google Scholar]
- Drummond AJ, Rambaut A. 2007. BEAST: Bayesian evolutionary analysis by sampling trees. BMC Evol Biol 7: 214. [DOI] [PMC free article] [PubMed] [Google Scholar]
- Dukers-Muijrers NHTM, van Liere GAFS, Wolffs PFG, Heijer Den C, Werner MILS, Hoebe CJPA. 2014. Antibiotic use before chlamydia and gonorrhea genital and extragenital screening in the sexually transmitted infection clinical setting. Antimicrob Agents Chemother 59: 121–128. [DOI] [PMC free article] [PubMed] [Google Scholar]
- Edgar RC. 2004. MUSCLE: multiple sequence alignment with high accuracy and high throughput. Nucleic Acids Res 32: 1792–1797. [DOI] [PMC free article] [PubMed] [Google Scholar]
- Everitt RG, Didelot X, Batty EM, Miller RR, Knox K, Young BC, Bowden R, Auton A, Votintseva A, Larner-Svensson H, et al. 2014. Mobile elements drive recombination hotspots in the core genome of Staphylococcus aureus. Nat Commun 5: 1–9. [DOI] [PMC free article] [PubMed] [Google Scholar]
- Feil EJ, Holmes EC, Bessen DE, Chan MS, Day NP, Enright MC, Goldstein R, Hood DW, Kalia A, Moore CE, et al. 2001. Recombination within natural populations of pathogenic bacteria: short-term empirical estimates and long-term phylogenetic consequences. Proc Natl Acad Sci 98: 182–187. [DOI] [PMC free article] [PubMed] [Google Scholar]
- Fraser C, Hanage WP, Spratt BG. 2007. Recombination and the nature of bacterial speciation. Science 315: 476–480. [DOI] [PMC free article] [PubMed] [Google Scholar]
- Gomes JP, Bruno WJ, Nunes A, Santos N, Florindo C, Borrego MJ, Dean D. 2006. Evolution of Chlamydia trachomatis diversity occurs by widespread interstrain recombination involving hotspots. Genome Res 17: 50–60. [DOI] [PMC free article] [PubMed] [Google Scholar]
- Grenfell BT. 2004. Unifying the epidemiological and evolutionary dynamics of pathogens. Science 303: 327–332. [DOI] [PubMed] [Google Scholar]
- Harris SR, Clarke IN, Seth-Smith HMB, Solomon AW, Cutcliffe LT, Marsh P, Skilton RJ, Holland MJ, Mabey D, Peeling RW, et al. 2012. Whole-genome analysis of diverse Chlamydia trachomatis strains identifies phylogenetic relationships masked by current clinical typing. Nat Genet 44: 413–419. [DOI] [PMC free article] [PubMed] [Google Scholar]
- Hogan RJ, Mathews SA, Mukhopadhyay S, Summersgill JT, Timms P. 2004. Chlamydial persistence: beyond the biphasic paradigm. Infect Immun 72: 1843–1855. [DOI] [PMC free article] [PubMed] [Google Scholar]
- Jeffrey BM, Suchland RJ, Eriksen SG, Sandoz KM, Rockey DD. 2013. Genomic and phenotypic characterization of in vitro-generated Chlamydia trachomatis recombinants. BMC Microbiol 13: 142. [DOI] [PMC free article] [PubMed] [Google Scholar]
- Jiang Y, Zhu H, Yang LN, Liu YJ, Hou SP, Qi ML, Liu QZ. 2015. Differences in 23S ribosomal RNA mutations between wild-type and mutant macrolide-resistant Chlamydia trachomatis isolates. Exp Ther Med 10: 1189–1193. [DOI] [PMC free article] [PubMed] [Google Scholar]
- Joseph SJ, Didelot X, Gandhi K, Dean D, Read TD. 2011. Interplay of recombination and selection in the genomes of Chlamydia trachomatis. Biol Direct 6: 28. [DOI] [PMC free article] [PubMed] [Google Scholar]
- Joseph SJ, Didelot X, Rothschild J, de Vries HJC, Morre SA, Read TD, Dean D. 2012. Population genomics of Chlamydia trachomatis: insights on drift, selection, recombination, and population structure. Mol Biol Evol 29: 3933–3946. [DOI] [PMC free article] [PubMed] [Google Scholar]
- Klint M, Fuxelius HH, Goldkuhl RR, Skarin H, Rutemark C, Andersson SGE, Persson K, Herrmann B. 2007. High-resolution genotyping of Chlamydia trachomatis strains by multilocus sequence analysis. J Clin Microbiol 45: 1410–1414. [DOI] [PMC free article] [PubMed] [Google Scholar]
- Li H, Handsaker B, Wysoker A, Fennell T, Ruan J, Homer N, Marth G, Abecasis G, Durbin R; 1000 Genome Project Data Processing Subgroup. 2009. The Sequence Alignment/Map format and SAMtools. Bioinformatics 25: 2078–2079. [DOI] [PMC free article] [PubMed] [Google Scholar]
- McKenna A, Hanna M, Banks E, Sivachenko A, Cibulskis K, Kernytsky A, Garimella K, Altshuler D, Gabriel S, Daly M, et al. 2010. The Genome Analysis Toolkit: a MapReduce framework for analyzing next-generation DNA sequencing data. Genome Res 20: 1297–1303. [DOI] [PMC free article] [PubMed] [Google Scholar]
- Misyurina OY, Chipitsyna EV, Finashutina YP, Lazarev VN, Akopian TA, Savicheva AM, Govorun VM. 2004. Mutations in a 23S rRNA gene of Chlamydia trachomatis associated with resistance to macrolides. Antimicrob Agents Chemother 48: 1347–1349. [DOI] [PMC free article] [PubMed] [Google Scholar]
- Newman L, Rowley J, Vander Hoorn S, Wijesooriya NS, Unemo M, Low N, Stevens G, Gottlieb S, Kiarie J, Temmerman M. 2015. Global estimates of the prevalence and incidence of four curable sexually transmitted infections in 2012 based on systematic review and global reporting. PLoS One 10: e0143304. [DOI] [PMC free article] [PubMed] [Google Scholar]
- Nunes A, Gomes JP. 2014. Evolution, phylogeny, and molecular epidemiology of Chlamydia. Infect Genet Evol 23: 49–64. [DOI] [PubMed] [Google Scholar]
- Nunes A, Gomes JP, Mead S, Florindo C, Correia H, Borrego MJ, Dean D. 2007. Comparative expression profiling of the Chlamydia trachomatis pmp gene family for clinical and reference strains. PLoS One 2: e878. [DOI] [PMC free article] [PubMed] [Google Scholar]
- O'Neill CE, Seth-Smith HMB, Van Der Pol B, Harris SR, Thomson NR, Cutcliffe LT, Clarke IN. 2013. Chlamydia trachomatis clinical isolates identified as tetracycline resistant do not exhibit resistance in vitro: whole-genome sequencing reveals a mutation in porB but no evidence for tetracycline resistance genes. Microbiology 159: 748–756. [DOI] [PubMed] [Google Scholar]
- Owusu-Edusei K, Chesson HW, Gift TL, Tao G, Mahajan R, Ocfemia MCB, Kent CK. 2013. The estimated direct medical cost of selected sexually transmitted infections in the United States, 2008. Sex Transm Dis 40: 197–201. [DOI] [PubMed] [Google Scholar]
- Pupko T, Pe'er I, Shamir R, Graur D. 2000. A fast algorithm for joint reconstruction of ancestral amino acid sequences. Mol Biol Evol 17: 890–896. [DOI] [PubMed] [Google Scholar]
- Read TD, Joseph SJ, Didelot X, Liang B, Patel L, Dean D. 2013. Comparative analysis of Chlamydia psittaci genomes reveals the recent emergence of a pathogenic lineage with a broad host range. mBio 4: e00604-12. [DOI] [PMC free article] [PubMed] [Google Scholar]
- Sandoz KM, Rockey DD. 2010. Antibiotic resistance in Chlamydiae. Future Microbiol 5: 1427–1442. [DOI] [PMC free article] [PubMed] [Google Scholar]
- Schachter J, Moncada J. 2005. Lymphogranuloma venereum: how to turn an endemic disease into an outbreak of a new disease? Start looking. Sex Transm Dis 32: 331–332. [DOI] [PubMed] [Google Scholar]
- Seth-Smith HM, Harris SR, Persson K, Marsh P, Barron A, Bignell A, Bjartling C, Clark L, Cutcliffe LT, Lambden PR, et al. 2009. Co-evolution of genomes and plasmids within Chlamydia trachomatis and the emergence in Sweden of a new variant strain. BMC Genomics 10: 239. [DOI] [PMC free article] [PubMed] [Google Scholar]
- Seth-Smith HMB, Harris SR, Scott P, Parmar S, Marsh P, Unemo M, Clarke IN, Parkhill J, Thomson NR. 2013a. Generating whole bacterial genome sequences of low-abundance species from complex samples with IMS-MDA. Nat Protoc 8: 2404–2412. [DOI] [PubMed] [Google Scholar]
- Seth-Smith HMB, Harris SR, Skilton RJ, Radebe FM, Golparian D, Shipitsyna E, Duy PT, Scott P, Cutcliffe LT, O'Neill C, et al. 2013b. Whole-genome sequences of Chlamydia trachomatis directly from clinical samples without culture. Genome Res 23: 855–866. [DOI] [PMC free article] [PubMed] [Google Scholar]
- Song L, Carlson JH, Whitmire WM, Kari L, Virtaneva K, Sturdevant DE, Watkins H, Zhou B, Sturdevant GL, Porcella SF, et al. 2013. Chlamydia trachomatis plasmid-encoded Pgp4 is a transcriptional regulator of virulence-associated genes. Infect Immun 81: 636–644. [DOI] [PMC free article] [PubMed] [Google Scholar]
- Stamatakis A, Ludwig T, Meier H. 2005. RAxML-III: a fast program for maximum likelihood-based inference of large phylogenetic trees. Bioinformatics 21: 456–463. [DOI] [PubMed] [Google Scholar]
- Stephens RS, Kalman S, Lammel C, Fan J, Marathe R, Aravind L, Mitchell W, Olinger L, Tatusov RL, Zhao Q, et al. 1998. Genome sequence of an obligate intracellular pathogen of humans: Chlamydia trachomatis. Science 282: 754–759. [DOI] [PubMed] [Google Scholar]
- Unemo M, Clarke IN. 2011. The Swedish new variant of Chlamydia trachomatis. Curr Opin Infect Dis 24: 62–69. [DOI] [PubMed] [Google Scholar]
- Unemo M, Shafer WM. 2011. Antibiotic resistance in Neisseria gonorrhoeae: origin, evolution, and lessons learned for the future. Ann N Y Acad Sci 1230: E19–E28. [DOI] [PMC free article] [PubMed] [Google Scholar]
- Unemo M, Seth-Smith HMB, Cutcliffe LT, Skilton RJ, Barlow D, Goulding D, Persson K, Harris SR, Kelly A, Bjartling C, et al. 2010. The Swedish new variant of Chlamydia trachomatis: genome sequence, morphology, cell tropism and phenotypic characterization. Microbiology 156: 1394–1404. [DOI] [PMC free article] [PubMed] [Google Scholar]
- Wang Y, Kahane S, Cutcliffe LT, Skilton RJ, Lambden PR, Clarke IN. 2011. Development of a transformation system for Chlamydia trachomatis: restoration of glycogen biosynthesis by acquisition of a plasmid shuttle vector. PLoS Pathog 7: e1002258-14. [DOI] [PMC free article] [PubMed] [Google Scholar]
- Wood DE, Salzberg SL. 2014. Kraken: ultrafast metagenomic sequence classification using exact alignments. Genome Biol 15: R46. [DOI] [PMC free article] [PubMed] [Google Scholar]
- World Health Organisation. 2014. WHO alliance for the global elimination of blinding trachoma by the year 2020. Wkly Epidemiol Rec 89: 421–428. [PubMed] [Google Scholar]
Associated Data
This section collects any data citations, data availability statements, or supplementary materials included in this article.