Abstract
Background
Proper mitochondrial function is essential to maintain normal cellular bioenergetics and ionic homeostasis. In instances of severe tissue damage, such as traumatic brain and spinal cord injury, mitochondria become damaged and unregulated leading to cell death. The relatively unexplored field of mitochondrial transplantation following neurotrauma is based on the theory that replacing damaged mitochondria with exogenous respiratory-competent mitochondria can restore overall tissue bioenergetics.
New Method
We optimized techniques in vitro to prepare suspensions of isolated mitochondria for transplantation in vivo. Mitochondria isolated from cell culture were genetically labeled with turbo-green fluorescent protein (tGFP) for imaging and tracking purposes in vitro and in vivo.
Results
We used time-lapse confocal imaging to reveal the incorporation of exogenous fluorescently-tagged mitochondria into PC-12 cells after brief co-incubation. Further, we show that mitochondria can be injected into the spinal cord with immunohistochemical evidence of host cellular uptake within 24 hours.
Comparison to Existing Methods
Our methods utilize transgenic fluorescent labeling of mitochondria for a nontoxic and photostable alternative to other labeling methods. Substrate addition to isolated mitochondria helped to restore state III respiration at room temperature prior to transplantation. These experiments delineate refined methods to use transgenic cell lines for the purpose of isolating well coupled mitochondria that have a permanent fluorescent label that allows real time tracking of transplanted mitochondria in vitro, as well as imaging in situ.
Conclusions
These techniques lay the foundation for testing the potential therapeutic effects of mitochondrial transplantation following spinal cord injury and other animal models of neurotrauma.
Keywords: PC-12 cells, bioenergetics, spinal cord injury, MitoTracker, transgenic labeling
1. Introduction
Mitochondria are widely referred to as the powerhouse of the cell. They sustain life by providing the cell with energy in the form of adenosine triphosphate (ATP) via a process known as oxidative phosphorylation, and are crucial regulators of calcium buffering and apoptosis (Nunnari & Suomalainen 2012). Since mitochondria are vital to maintain normal cellular functions, their dysfunction can have widespread and devastating effects. Mitochondrial dysfunction has long been associated with neuronal trauma and ischemia/reperfusion damage to central nervous system tissues (Azbill et al 1997, Fiskum 2000, Sullivan et al 2005, Visavadiya et al 2015). Promising pharmacotherapies have been developed to target mitochondrial dysfunction using antioxidants (Bains & Hall 2012, Gilgun-Sherki et al 2002, Jin et al 2014, Patel et al 2014, Smith et al 2008), electron transport system (ETS) uncouplers (Cunha et al 2011, Jin et al 2004, Patel et al 2009b, Rodriguez-Jimnez et al 2012, Sullivan et al 2004), and alternative biofuels (Patel et al 2010, Petruzzella et al 1992) to feed into the electron transport system. In the burgeoning field of organelle transplantation, a novel paradigm has emerged to transplant exogenous, well-coupled mitochondria to replace those that are nonfunctional. As evidenced with earlier experiments, not only can this approach supplement the original pool of mitochondria with more endogenous antioxidant systems and improve energy producing capabilities, but it can also replace those mitochondria that are too damaged to function (Islam et al 2012, Katrangi et al 2007, Masuzawa et al 2013).
Mitochondrial transplantation has been shown to have beneficial effects in different injury models in vitro using co-incubation methods (Chang et al 2013b, Clark & Shay 1982, Elliott et al 2012, Katrangi et al 2007), direct injection techniques (King & Attardi 1988) or co-cultured cell delivery approaches (Cselenyak et al 2010, Plotnikov et al 2008, Spees et al 2006, Wang & Gerdes 2015, Yang & Koob 2012); as well as in vivo using direct injections (Masuzawa et al 2013) or cell-to-cell transfer (Islam et al 2012). In the emerging field of mitochondrial medicine (for reviews see (Armstrong 2007, Luft 1994), mitochondrial transplantation has a unique set of caveats that require careful consideration. Multiple labs have shown that exogenous mitochondria can be integrated into host cells (Chang et al 2013b, Clark & Shay 1982, Cselenyak et al 2010, Islam et al 2012, Katrangi et al 2007, Kitani et al 2014a, Masuzawa et al 2013, Pacak et al 2015, Spees et al 2006). Relevant to the current study, verification of mitochondrial incorporation into host tissues has been performed using various techniques including quantifying transplanted mitochondrial DNA (Islam et al 2012, Spees et al 2006, Yang & Koob 2012) or visualizing mitochondria with transgenic labeling or post-isolation fluorescence tagging (Chang et al 2013b, Clark & Shay 1982, Kitani et al 2014a, Lin et al 2013, Masuzawa et al 2013, McCully et al 2009, Plotnikov et al 2008). More recently, it has been reported that mitochondrial particles are transferred from astrocytes into nearby damaged neurons after ischemic stroke in mice, resulting in neuroprotection (Hayakawa et al 2016). This group also showed that injecting isolated mitochondria particles labeled with MitoTracker Red CMXRos into the mouse brain allows for tracking of mitochondria in distinct cell types in the CNS in situ.
Using fluorescent mitochondrial labels does not come without its caveats. Different mitochondrial dyes have been utilized when tracking mitochondria in vitro (Chang et al 2013b, McCully et al 2009, Plotnikov et al 2008). Transgenic labeling of mitochondria in vitro provides a stable alternative to labeling with more photosensitive MitoTracker dyes (Rizzuto et al 1996, Shitara et al 2001). While MitoTracker Green FM is a dye whose fluorescence intensity is altered with changing membrane potentials (Keij et al 2000), it is reported that the MitoTracker dyes can inhibit mitochondrial respiration (Buckman et al 2001). The latter group reported that upon mitochondrial damage, such as uncoupling using FCCP, MitoTracker dyes were released into the cell cytoplasm, indicating that these dyes are not irreversibly bound to the mitochondria. MitoTracker Green FM is reported to be cytotoxic in Hela cells even at low concentrations of 250 nM (Han et al 2013), and MitoTracker Red CMXRos is toxic to human 143B osteosarcoma cells (Minamikawa et al 1999). CMXRos is a photosensitizer that causes chemical damage when subjected to laser scanning, such as used in confocal imaging.
In order to address the fidelity of using fluorescent trackers to label exogenous mitochondria without leakage of the label, we investigated the use of transgenically-labeled mitochondria isolated from cell culture compared to traditionally labeled MitoTracker mitochondria to ascertain which could provide a non-toxic, indelible tag that allows for long-term visualization of transplanted mitochondria in vitro. After we established optimal isolation protocols to obtain well-coupled and easily identifiable mitochondria for characterizing transplantation into cell cultures, we further addressed technical hurdles for transplanting mitochondria in vivo. In summary, we show successful passive transplantation of exogenous, transgenically labeled mitochondria both into PC-12 cells in vitro and within various host cells in the rat spinal cord in situ. This sets the stage to apply these techniques to injured spinal cord tissue to discern cell type incorporation and the effects of mitochondrial transplantation on overall bioenergetics and tissue sparing.
2. Materials and Methods
2.1 Transgenic Labeling of PC-12 Cells
The section of the plasmid vector pTurbo-GFP-mito (evrogen cat # FP517 Farmingdale, NY) containing the sequence coding for both the turbo green fluorescent protein (tGFP) and the mitochondrial targeting sequence was removed and inserted into a pIRESpuro3 vector. Briefly, the restriction enzymes NheI-HF and NotI-HF were used to digest both vectors. NheI cuts the pTurbo-GFP-mito vector at the 591 position, and NotI cuts at the 1406 position. Within these cuts are the mitochondrial targeting sequence and the turbo-GFP coding sequence. This insert was then gel purified and ligated with the PIRESpuro3 vector using a rapid DNA ligation kit (Roche). The resulting plasmid contained CMV promoter, the mitochondrial targeting sequence, tGFP coding sequence, and puromycin resistance sequence. OneShotStbl3 E. coli (Invitrogen cat no C7373-03 Carlsbad, CA) were then transformed with the resulting plasmid. Briefly, the plasmid was diluted to 1ng/μL and used according to manufacturer protocol for E. coli transformation. One colony from the resulting plate was then selected for plasmid DNA purification using a Miniprep kit (Qiagen 27106 Valencia, CA) according to manufacturer’s protocol. PC-12 Adh (ATCC CRL-1721.1 Manassas, VA) cells used in these experiments were grown at 37°C with 95% air, 5% CO2 in complete growth media consisting of F-12K Medium (ATCC cat # 30-2004 Manassas, VA) with 2.5% fetal bovine serum (Atlanta Biologicals # S1111OH, Atlanta, GA), 15% horse serum (Gibco # 26050-070), and 1.1% penicillin streptomycin (Corning # 30-002-CI, Tewksbury, MA). Cells were passaged every 3–4 days. Transfection was carried out using LipoJet In Vitro DNA and siRNA Transfection kit (SignaGen Laboratories Rockville, MD) according to manufacturer’s protocol for transfecting adherent cells. At 24 hours after transfection, selective media (3ug/mL puromycin in complete media) was applied to the cells. Cells were stably transfected by continual growth in selective media for the remainder of the studies.
2.2 Mitochondrial Isolation from Cell Culture
Isolation of mitochondria from cell culture was carried out by using techniques for isolating mitochondria from spinal cords (Patel et al 2014), with modifications for removing PC-12 Adh cells from culture plates and homogenization with additional nitrogen bomb steps to ensure cellular disruption. Briefly, cells were removed from 15cm culture plates at 95% confluence by trypsinization (0.25% Trypsin EDTA) or manual cell scraping, as described for experiments comparing cell removal techniques. Cells were concentrated by centrifugation at 500 × g for 5 min at 4°C and resuspended in 2 mL isolation buffer (215 mM mannitol, 75 mM sucrose, 0.1% BSA, 20 mM HEPES, pH adjusted to 7.2 with KOH) containing 1 mM ethylene glycol tetraacetic acid (EGTA). The solution was centrifuged at 1.8 rcf for 3min, 4°C. The resulting pellet was then resuspended and mechanically homogenized using a drill press with 10 gentle passes of the pestle into and out of the solution. The cells were then nitrogen bombed at 1500 psi, 10 min, 4°C to further release mitochondria from cells and increase yield. Mechanical homogenization was then repeated before the solution was again centrifuged at 1.8 rcf, 3 min, 4°C. The supernatant containing mitochondria was removed and saved in an Eppendorf tube to be combined at later step. To further increase mitochondrial yield, the pellet was resuspended in isolation buffer, and mechanical homogenization and nitrogen bombing steps were repeated. The solution was again centrifuged at 1.8 rcf, 3 min, 4°C, after which the supernatant containing mitochondria was saved and the pellet was again resuspended and underwent mechanical homogenization, nitrogen bombing, and centrifugation at 1.8rcf for 3min, 4°C. Finally, the 3 resulting supernatant portions that had been saved from previous steps were centrifuged at 13,000 rcf for 10 min at 4°C, and the pellets were then resuspended in isolation buffer, combined into one sample, and purified using ficoll gradient (7.5%/10%) centrifugation at 32,000 rpm for 30 min, 4°C. After centrifugation, mitochondria remain in a pellet at the bottom of the tube. Importantly, we found that there is an inconspicuous layer of non-mitochondrial particles lying on top of the pellet that must be aspirated gently prior to removing the rest of the supernatant. The purified mitochondrial pellet was resuspended 600μL isolation buffer without EGTA and centrifuged at 10,000 rcf, 10 min, 4°C resulting in the final pellet which was then resuspended in 20 μL isolation buffer without EGTA. 2 μL of this was used in the Pierce BCA protein assay kit (Thermo Scientific cat# 23227 Rockford, IL) with the Biotek Synergy HT plate reader (Winooski, VT) measuring absorbance at 560 nm to determine mitochondrial protein concentration.
2.3 MitoTracker Green Labeling and Filter Testing
Mitochondria were isolated from naïve, unlabeled PC-12 Adh cell cultures (see 2.2). After centrifugation at 10,000 rcf, 10min, 4°C, the mitochondria were labeled with MitoTracker Green FM (MTG, Invitrogen cat# M7514) according to manufacturer’s protocol. Briefly, mitochondria were incubated with 1 uM MTG for 5 min at room temperature, covered from light. The solution was centrifuged at 10,000 rcf, 10 min, 4°C to wash any remaining unbound MTG. The mitochondrial pellet was then resuspended in isolation buffer with EGTA, drawn into a 1mL syringe, slowly passed through a 0.2 μm pore Nalgene filter (Thermo Scientific cat # 723-2520) placed at the end of the syringe, and then seeded onto 35 mm plates containing unlabeled PC-12 Adh cells. The cells were placed in a 37°C incubator for 1 hour, after which they were imaged using a Nikon confocal microscope (see 2.8). In tandem, a filter test was performed on isolated tGFP mitochondria, which were drawn into a separate syringe, passed through a filter and seeded onto naïve cells for imaging.
2.4 Transmission Electron Microscopy
For transmission electron microscopy (TEM), tGFP-labeled mitochondria were isolated as described above. After 10,000 rcf centrifugation, the mitochondrial pellet was fixed in 3% glutaraldehyde in sodium cacodylate buffer overnight at 4°C. The pellet was then rinsed in 0.2M sodium cacodylate buffer 3 times for 5 minutes each at 4°C. The pellet was then placed in 2% osmium tetroxide for 1 hour at 4°C, followed by washing in distilled water 5 times for 5 min each at 4°C. The pellet was then placed in 2% uranyl acetate overnight at 4°C. The sample was rinsed in distilled water 5 times for 5 min each at room temperature, followed by sequential ethyl alcohol dehydrations in 30, 50, 70, and 90% EtOH for 10 min each at room temperature. This was followed by three washes in 100% EtOH for 15 min each wash at room temperature. The pellet was then washed in resin (23.1% ERL 4221 (3,4-Epoxycyclohexylmethyl-3′,4′-epoxycyclohexane carboxylate) Electron Microscopy Sciences Hatfield PA), 18.5% DER (Diglycidyl ether of polypropylene glycol, Electron Microscopy Sciences Hatfield PA), 57.7% NSA (Nonenyl succinic anhydride, Electron Microscopy Sciences Hatfield PA), 0.69% DMAE (Dimethylaminoethanol, Electron Microscopy Sciences Hatfield PA) 3 times, each for 1 hour at room temperature with gentle spinning. The pellet was then cut into smaller sections, placed in fresh resin in molded blocks, and incubated at 60°F for 48 hours. The blocks were then trimmed and cut at 90 nm thickness using Ultracut UCT (Leica Microsystems, Buffalo Grove IL). The sections were placed onto copper grids and allowed to dry at room temp, covered to protect from dust accumulation, overnight. The mounted grids were then processed using lead citrate. Briefly, each grid was placed on top of a drop of 0.5% aqueous lead citrate at room temperature in a petri dish containing sodium hydroxide pellets to absorb carbon dioxide. The grids were left on the droplet for 3 minutes, then moved to a new droplet of distilled water, in turn “washing” the grid. The grid was then moved to a fresh droplet of water every 5 min, for a total of 5 washes. The grid was then dabbed with a Kimwipe to remove the excess water and allowed to dry. Grids were then imaged at 60kV on a Philips TECNAI 12 BT transmission electron microscope. The images captured represent the inner portion of the mitochondria pellet.
2.5 Assaying Respiration of Isolated Mitochondria
Mitochondria, whether labeled or not, were assayed for oxygen consumption rates (OCR) immediately after isolation using the Seahorse Bioscience XFe Flux Analyzer as described previously (Sauerbeck et al 2011, Patel et al 2014). Briefly, isolated mitochondria were applied into cell plate cartridges that were then centrifuged to concentrate mitochondria to the bottom of each well. Then, automatically 5mM pyruvate/2.5 mM malate/1mM adenosine diphosphate (ADP), 1μg/uL oligomycin, 3 μM carbonilcyanide p-trifluoromethoxyphenylhydrazone (FCCP), and 100nM rotenone/10mM succinate were sequentially added to each well. Oxygen levels were measured after each substrate/inhibitor addition over time to obtain OCR in each instance of manipulating different complexes of the electron transport system.
2.6 Co-incubation of PC-12 Cells with Transgenically-Labeled tGFP Mitochondria
Transgenically-labeled tGFP mitochondria were isolated from cell culture and then applied to confluent naïve (unlabeled) PC-12 Adh cells. tGFP mitochondria were isolated as described above (section 2.2) and diluted to desired concentrations using complete media at 37°C. Naïve PC-12 cells were plated 24 hours prior in 35mm dishes (MatTek corp. Part no. P35GC-1.5-14-C Ashland, MA) with glass coverslip bottoms for imaging purposes. The media on naïve PC-12 cells was replaced with mitochondrial-supplemented media at concentrations of 5, 10, or 20 μg per 2mL of media, which was left on the cells for 1 or 2 hours dependent on the experimental design at 37°C on a gently rocking platform. The mitochondria-enriched media was then aspirated and the cells were rinsed once, followed by replacement with fresh complete media at 37°C and imaging.
2.7 Imaging of PC-12 Adh Cells After Mitochondrial Transplantation
Cells were evaluated using a confocal Nikon Ti-e inverted microscope (Nikon Instruments Melville NY) for high magnification and live imaging purposes or an American Microscopy Group (AMG) Evos fluorescent microscope for low magnification images to verify transfection efficiency of tGFP. For live imaging, the cell plates were placed in an incubation chamber situated above an inverted laser, set to 5% CO2 and 37°C. Cells were imaged using wavelengths for tGFP using excitation laser 488-20 nm (Nikon) or using the green fluorescent protein (GFP) filter cube (EVOS).
2.8 Quantification of tGFP Transplantation in vitro
tGFP-labeled mitochondria at three different dosages (5ug, 10ug or 20ug) were applied to and incubated with unlabeled PC-12 Adh cells (Passage 31, 80% confluent in 35 mm dish) for 2 hours before washing and imaging (section 2.7). In each of 3 separate experimental runs performed on separate days, each dosage was applied to 3 different culture dishes, and 4 random non-overlapping fields of view in each dish were captured using Nikon confocal microscopy representing the region of interest (ROI). These images were taken on live, non-fixed cells. After capturing the ROI, the image was thresholded above background fluorescence, and quantification of the number of green fluorescent objects was calculated using Nikon NIS software (Nikon Instruments).
2.9 Microinjection of tGFP Mitochondria in vivo
Adult female Sprague Dawley rats (250g, Harlan, n=13) underwent a T12 laminectomy to expose the L1/L2 spinal level (Patel et al 2012). Isolated tGFP mitochondria were injected into the mediolateral gray matter at 4 circumferential sites of the spinal cord separated by 2mM in the rostral caudal direction using a glass micropipette needle (World Precision Instruments, Sarasota, FL cat no. 4878) pulled and beveled to a 20–30 μm inner diameter pore opening. One cohort of naïve animals was used to determine tGFP co-localization with other mitochondrial markers (n=2). Each injection site consisted of 750 nL of 12.5μg tGFP mitochondria suspended in vehicle (isolation buffer with 5mM pyruvate, 2.5 mM malate and 10mM succinate); hence a total of 50μg tGFP mitochondria in 3μL vehicle was injected per cord. Animals survived 24 hours after injections and then spinal cords were processed for histological assessment. A separate cohort of animals was used to determine cell-type co-localization after spinal cord injury (n=11). Each injection site consisted of 750 nL of either vehicle (n=3) (isolation buffer with 5mM pyruvate, 2.5 mM malate and 10mM succinate) or 25μg tGFP mitochondria (n=8) suspended in vehicle; hence a total of 100μg tGFP mitochondria in 3μL vehicle was injected per cord. Animals survived 24 (n=6) or 48 (n=5) hours after injections and then spinal cords were processed for histological assessments.
2.10 Immunohistochemistry and Image Analysis
At 24 hours after injections animals were overdosed with 0.2 mL Fatal-Plus solution (Vortech Pharma Ltd., Dearborn, MI) followed by transcardial perfusion first with 0.1M PBS, then 4% paraformaldehyde in PBS. A 1.5cm segment of spinal cord centered on theL1/L2 injection sites was dissected, cryoprotected in 20% sucrose/PBS, embedded in gum tragacanth, cryopreserved, and serially cryosectioned coronally at 25μM, keeping every section as we have reported (Patel et al 2010, Rabchevsky et al 2002). Antibodies used for fluorescent imaging and co-localization comparisons included rabbit anti-tGFP (0.13μg/mL, Evrogen # Ab513), mouse anti-COXIV (2μL/mL, Cell Signal #11967), mouse anti-TOMM20 (5μg/mL, abcam # ab56783), mouse anti-RECA1 (5μg/mL, abcam # ab9774), mouse anti-Ox42 (5μg/mL, abcam # ab78457), goat anti-rabbit 488 (4μg/mL, Invitrogen # A11008), goat anti-mouse Biotin (7.5μg/mL, Vector # BA-9200), and Streptavidin Texas red (3.3μg/mL, Vector # SA-5006). Images were obtained using Nikon Eclipse Ti Confocal microscope and NIS elements software (Nikon Instruments).
2.11 Statistical Analyses
Mander’s overlap analyses were carried out using NIS software (Nikon Instruments), in which the percentage of overlap between pixels which were both TRITC + and FITC + was calculated within the injection site ROI in tissue sections. Changes in OCR and respiratory control ratio (RCR) were analyzed using a one-way analysis of variance (ANOVA) for each respiration state. For passage OCR comparisons, we first found no differences within the groups of the passage OCR using one way ANOVA. Because there were no differences, the passages were combined to do a broad comparison between treatment groups. The treatment groups (naïve vs tGFP) were then compared using Student’s T test. Dose-response incorporation studies in vitro were analyzed using a one-way ANOVA with Tukey’s multiple comparisons. All analyses were performed using Graphpad Prism 6 (Graphpad Software, Inc., La Jolla, CA). Significance was set to p < 0.05.
3. Results
3.1 Transgenic Labeling with pTurboGFP-mito Vector
The pTurboGFP-mito vector encodes tGFP as a fusion protein with the mitochondrial targeting sequence of subunit VIII of cytochrome c oxidase complex. When transfected into PC-12 cells, this plasmid targets the protein to the inner mitochondrial membrane (Matz et al 1999, Rizzuto et al 1995, Rizzuto et al 1989). By exploiting the puromycin resistance cassette of the vector, puromycin was used to select for and amplify cells that expressed tGFP (Figure 1).
Figure 1.
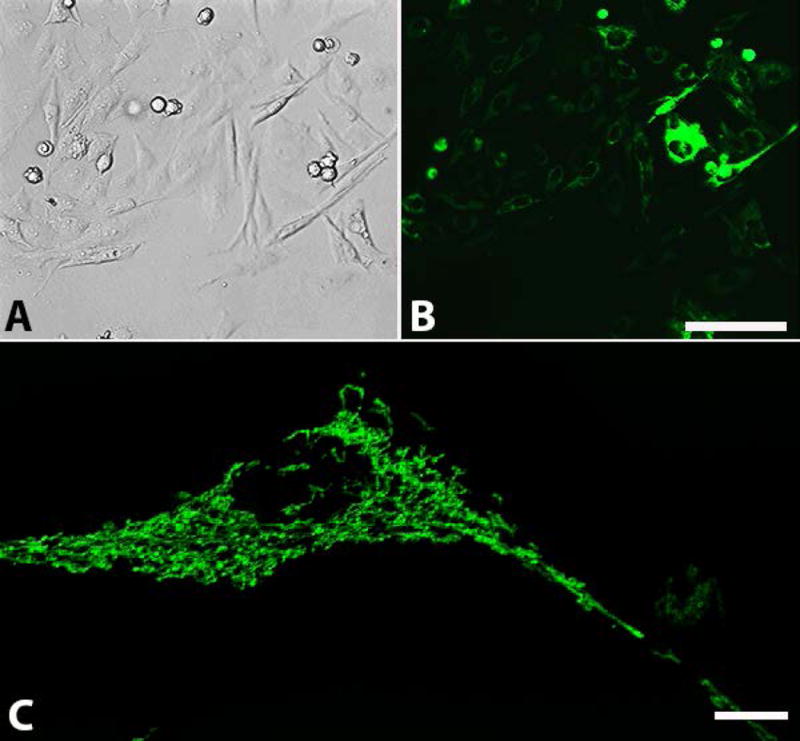
tGFP transfected PC-12 Adh cells. Representative images show PC-12 cells expressing tGFP fluorescent protein under (A) bright-field or (B) Green Fluorescent Protein filters. Cells were under constant selection using puromycin (passage 19). High transfection efficiency is evident, though it should be noted that there are varying degrees of signal intensity. (C) High magnification of a tGFP transfected cell showing perinuclear mitochondrial networks throughout the cytoplasm. Images A and B were taken on AMG scope, scale bar = 50μM. Image C taken on Nikon confocal Ti-e microscope using 488nm excitation laser, scale bar= 10μM.
3.2 Transmission Electron Microscopy (TEM)
The morphological features of tGFP-labeled mitochondria under TEM showed typical healthy structures such as prominent cristae and intact outer and inner mitochondrial membranes (Figure 2), as we have reported (Patel et al 2009a). Verifying the structural integrity of the labeled mitochondria to be transplanted is important, but to ensure that isolated tGFP mitochondria were functioning properly we assessed their respiration rates to confirm the integrity of the electron transport system; notably in comparison to mitochondria labeled with a fluorescent dye.
Figure 2.
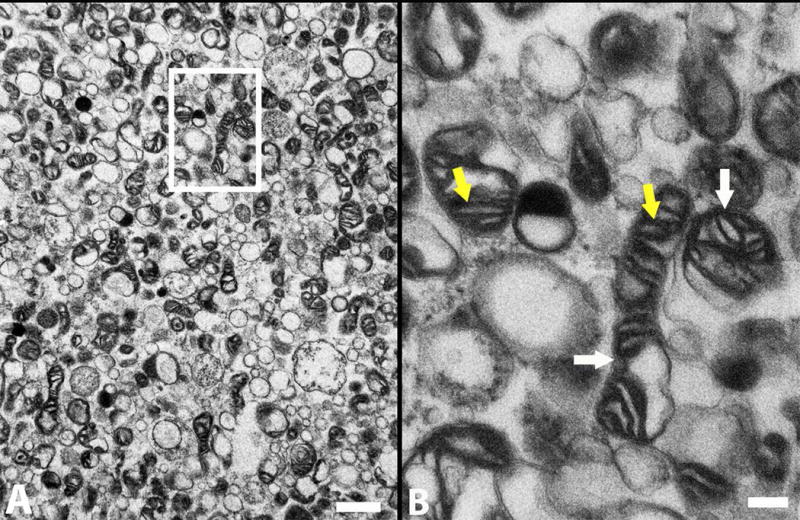
TEM shows that the tGFP-labeled mitochondria have dense cristae (yellow arrows) and intact membranes (white arrows), indicative of healthy mitochondria. B is a higher magnification of boxed insert shown in A. Scale bars = 1 um (A), 200 nm (B).
3.3 Comparing Fidelity of Mitochondrial Labels
There are concerns about both the fidelity of MTG to irreversibly label targeted mitochondria and the potential to affect the function of isolated mitochondria (Buckman et al 2001). To compare the fidelity of the MTG label versus the transgenic tGFP label, we performed an experiment in which labeled, isolated mitochondria were gently pushed through a 0.2 μM filter which does not allow the mitochondria (0.4 – 1 μM) to pass through, but does allow for unbound MTG or tGFP to pass through. We found that while the filtered MTG/mitochondria solution resulted in positive green fluorescence labeling of naive cells (Figure 3A), there was no fluorescent labeling with the filtered tGFP/mitochondria solution (Figure 3B). This indicates that using MTG in mitochondria transplantation experiments may render ambiguous results since the dye can label endogenous mitochondria as well. Therefore, transgenic labeling of mitochondria in cultured cells affords an alternative method of labeling mitochondria in an indelible manner.
Figure 3.
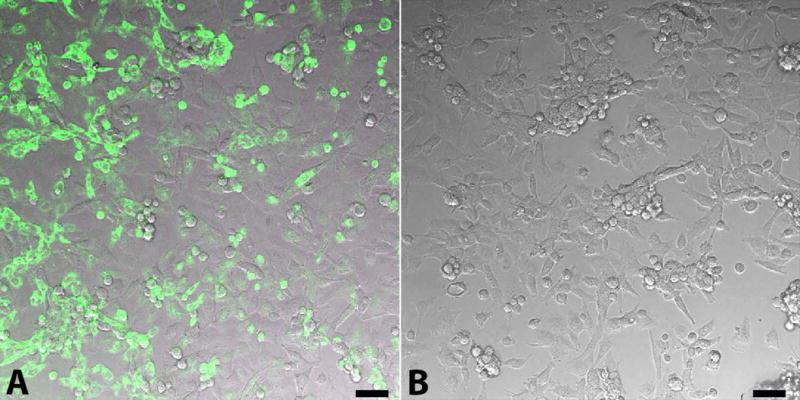
MTG label dissociates from mitochondria, leading to non-specific labeling. A. MTG labeling (green) of PC-12 cells after MTG mitochondria solution passage through 0.02 um filter. B. Absence of tGFP fluorescence after passing the tGFP mitochondria solution through 0.02um filter, indicating no leakage of the label. Scale bars= 50μM.
3.4 Testing Respiration of Isolated, Transgenically-Labeled Mitochondria
Prior to comparing transgenic versus MTG labeling of mitochondria on bioenergetic integrity, we tested transgenically labeled tGFP mitochondria for functionality to ensure the integrity of the electron transport chain. We first compared mitochondria isolated from cells at various passage numbers to ensure that there were no alterations in mitochondrial functionality with age or cell passage numbers. Simultaneously, respiration rates of tGFP-labeled mitochondria were also compared to respiration rates of naïve, unlabeled PC-12 mitochondria (Figure 4). Isolated mitochondria were assayed using the Seahorse Bioscience Flux Analyzer to determine the OCR and RCR, as described in Section 2.5. Mitochondrial respiration rates at the different states gives insight into the function of different complexes of the mitochondrial electron transport system. The following methods are published in our lab (Patel et al., 2014). For further reference, Brand and Nicholls have published a review of mitochondrial assessment techniques and theories (Brand & Nicholls 2011). Briefly- addition of pyruvate, malate, and ADP creates movement of electrons through the electron transport system, creating ATP and consuming oxygen in the process. OCR at this point is referred to as State III respiration- it includes the flow of electrons through the electron transport chain from complex I through complex IV, including coupling to the ATP synthase complex to give a complete picture of the electron transport system integrity. This is a measurement of oxygen consumption that corresponds to ATP production. Oligomycin is then added, resulting in State IV respiration- where the ATP synthase complex is inhibited so that any oxygen consumption is caused by leakage of electrons from the electron transport chain. Subsequent addition of FCCP, a protonophore, causes collapse of the membrane potential across the inner mitochondrial membrane, and uncouples the ATP synthase complex from the electron transport chain. Referred to as State V.1 respiration, proton pumping across the membrane is at a maximal rate, and is reflected by a high rate of oxygen consumption. Final addition of rotenone (a complex I inhibitor) and succinate (feeding electrons into complex II) elicits State V.2 respiration. Oxygen consumption in this state is caused by electrons entering the electron transport chain through complex II. The ratio of State III divided by State IV respiration gives the RCR- a ratiometric measurement that is indicative of mitochondrial integrity as it incorporates respiration from both the entirety of the electron transport chain as well as leakage of electrons. For example, respiratory competent mitochondria with low leakage will have a high OCR after pyruvate, malate, and ADP addition, but a very low OCR following addition of oligomycin, thus resulting in a higher RCR value.
Figure 4.
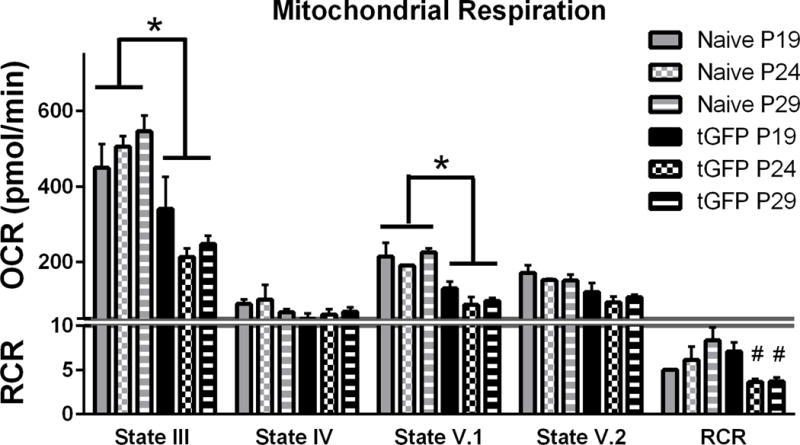
Oxygen Consumption Rates (OCR) of isolated tGFP-labeled mitochondria or naïve non-labeled mitochondria at different passage generations. One way ANOVA was performed for each state of respiration within treatment groups. With no significant differences among passage number OCR values using a one way ANOVA, the groups were collapsed (indicated by the horizontal bars) and compared using Student’s T tests to determine overall group effects. RCR were analyzed using a one way ANOVA for each cell group, with Tukey’s multiple comparisons. Bars are means ± SEM. *p<0.0001 tGFP vs Naïve; #p<0.05 vs tGFP P19. n= 3/group performed in triplicate.
There were no passage-dependent differences in respiration rates within cell lines, indicating that the passage generation of the cells did not significantly affect respiration; though there was a trend for decreased state III and V.1 OCR with increased passages of the tGFP mitochondria group. Therefore, group passage OCR values were collapsed to compare differences between naïve and tGFP mitochondria at each state. Results showed significant decreases in respiration when comparing tGFP to naive groups (State III- P < 0.0001; State V.1- P <0.0001) (Figure 4), indicating that tGFP mitochondria respire at lower rates than naïve mitochondria, perhaps producing less ATP. Additionally, tGFP mitochondria from lower passage numbers had significantly higher RCR values (F (2, 6) = 8.388, P=0.0183). While this is important to note, it is not yet known what optimal respiration rates are for mitochondria to be transplanted since ATP production may be different among cell types. Therefore, in subsequent experiments we utilized tGFP mitochondria from low passage numbers.
Respiration rates of tGFP-labeled mitochondria were then compared to MTG-labeled mitochondria. Results show that regardless of the label, there were no significant differences in OCR at any state (State III- F (2, 6) = 3.652, P= 0.0917; State IV- F (2, 6) = 3.098, P= 0.1190; State V.1- F (2, 6) = 2.010, P= 0.2147; State V.2- F (2, 6) = 1.277, P= 0.3450), or RCR values among groups (F (2, 6) = 0.1853, P= 0.8355) (Figure 5). The electron transport system does not appear hindered by either the MTG or tGFP label as the RCR for each group was above 5. While tGFP mitochondria were found again to respire at an overall lower rates, they remained well-coupled. It should be noted that, per manufacturer’s protocol, MTG is reconstituted in DMSO to a final concentration of 1% DMSO in solution, which may have effects on the lipid membrane of mitochondria causing partial mitochondrial ETS uncoupling and increased OCR.
Figure 5.
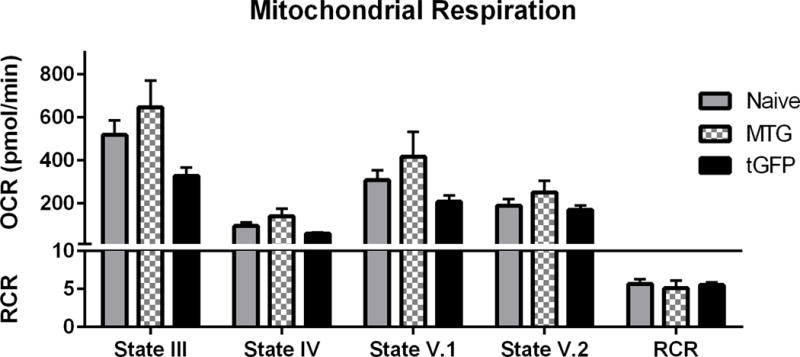
tGFP and MTG mitochondria have comparable RCR. Mitochondria were isolated from either transgenic tGFP PC-12 cells or naïve PC-12 cells that were then labeled using MTG, then assayed for respiration using the Seahorse Flux Analyzer. Bars are means ± SEM. (1-way ANOVA for each state) n=3/group, performed in triplicate.
After isolating well-coupled transgenically-labeled mitochondria from cell culture, we optimized techniques for increasing both bioenergetics and mitochondrial yield. In order to perform in vivo transplantation experiments, a sufficient yield of respiratory-competent mitochondria is needed to elicit responses following their supplementation. Using isolation methods with or without ficoll, we have found that we can obtain a higher yield of crude mitochondria versus purified mitochondria. However, when the health of cell culture-derived mitochondria in the crude vs purified fractions was tested, we found that purified mitochondria give much higher respiration rates (data not shown). Our initial use of trypsin as a means to permeabilize the cell membranes and release mitochondria resulted in a higher yield of mitochondria. Importantly, however, we found in preliminary studies that intraspinal transplantation of mitochondria isolated with trypsin caused tissue damage due to residual trypsin remaining in the pellet (data not shown), even after washing and centrifugation. Therefore, while the isolated mitochondria appear well-coupled, trace amounts of trypsin in the suspension can be detrimental to tissues in vivo. Therefore, subsequent studies using mitochondria derived from cell culture were isolated using manual scraping with the ficoll purification step.
During in vivo transplantation experiments, isolated mitochondria may be exposed to room temperature (RT) for up to 30 minutes while in the microinjection needle. An experiment was performed on tGFP mitochondria to test the effects of temperature and substrate supplementation on respiration (Figure 6). The mitochondria were resuspended in isolation buffer and either left at RT or on ice for 30 minutes, and either with or without substrate supplementation (5mM pyruvate/malate and 10mM succinate).
Figure 6.
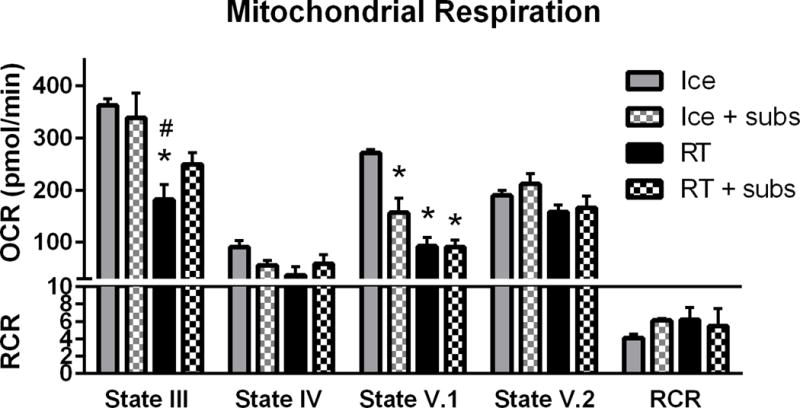
Mitochondrial respiration changes with temperature and substrate addition. Mitochondrial respiration was highest when left on ice, with State III and V.1 decreasing significantly at room temperature (RT). Addition of substrates (subs) at RT helped maintain State III respiration. Bars are means ± SEM. *p<0.05 vs Ice; #p<0.05 vs Ice + subs (1-way ANOVA for each state, Tukey’s multiple comparison) n=3/group in triplicate.
tGFP mitochondria that were kept on ice in centrifuge tubes had higher respiration rates compared to tGFP mitochondria left at RT. State III OCR changed significantly (F (3, 8) = 7.407, P= 0.0107) and post hoc analysis revealed significantly decreased OCR in samples that were left at RT without substrates compared to those on ice, with or without substrates. Addition of 5mM pyruvate malate and 10mM succinate substrates to mitochondria held at RT helped maintain State III OCR near mitochondria on ice. Alternatively, while there were no differences in State IV (F (3, 8) = 2.561, P= 0.1279), State V.2 (F (3, 8) = 2.059, P= 0.1842), or RCR (F (3, 8) = 0.5777, P= 0.6458) among the groups, State V.1 OCR was significantly decreased (F (3, 8) = 22.79, P=0.0003) in all samples compared those on ice.
3.5 tGFP Mitochondrial Transplantation in vitro
We tested whether isolated transgenically-labeled tGFP mitochondria could be incorporated into PC-12 cells by co-incubation. The tGFP mitochondria were isolated from cell culture and 10μg was mixed with 2mL fresh complete media and added to 35 mm culture dishes that were 80% confluent with naïve PC-12 cells. After one hour, cells were live-imaged and showed positive tGFP labeling within somas (Figure 7).
Figure 7.
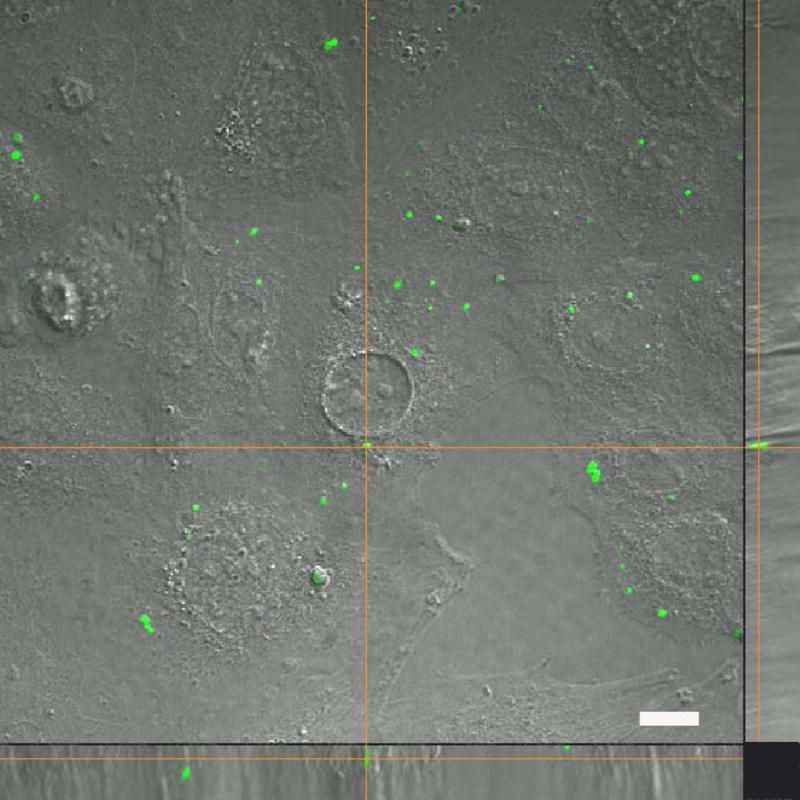
Transplanted tGFP mitochondria are taken into naïve PC-12 Adh cells. After 10 μg tGFP mitochondria were incubated with unlabeled PC-12 cells for one hour, live-imaging showed positive tGFP labeling within soma. The bottom panel shows the X plane, and the right panel shows the Y plane. Cross hairs indicate one instance of punctate tGFP mitochondria within a cell. Image was taken using Nikon Ti confocal microscope. Scale bar = 25 μm.
We next applied increasing concentrations of tGFP mitochondria to naïve PC-12 cells. After two hours of co-incubation, the cells were washed of any remaining extracellular mitochondria and live-imaged (Figure 8A). Upon visualization, there appeared to be much more instances of tGFP labeling in the higher dosage groups, with no labeling in the control group (Figure 8A). These differences in fluorescence were compared to assess the dose-dependent incorporation of tGFP mitochondria. Regions of interest (Figure 8B) were chosen and the captured images were then thresholded to a non-transplanted plate to remove non-specific background fluorescence for quantification. Our results showed that there was a significant dose-dependent difference between different groups. Post-hoc analysis showed a significantly higher amount of tGFP immunofluorescence within PC-12 Adh cells administered 20μg tGFP mitochondria compared to naive (F (3, 8) = 5.430, P= 0.0248), with decreasing amounts of fluorescence in the lower dosage groups (Figure 8C).
Figure 8.
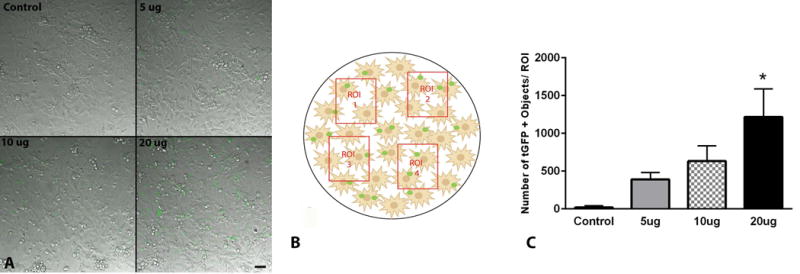
tGFP mitochondria are taken up by PC-12 Adh cells in a dose-dependent manner. A. Representative DIC/FITC images of individual regions of interest (ROI) in cell cultures from each dosage showing varying amounts of tGFP mitochondria within cells. B. Schematic depiction of four random non-overlapping ROIs chosen per plate analyzed for each dosage, replicated in three plates. C. Quantification of ROI densities of tGFP for each dosage administered showed that the 20μg transplant group had the highest number of mitochondria taken up. Bars are means ± SEM. *p <0.05 vs control group using one-way ANOVA with Tukey’s multiple comparisons. n=3/dosage performed in triplicate, scale bar = 50μM, applies to all images.
To further confirm that mitochondria were successfully incorporated into cultured cells, time-lapse experiments were performed. After 10 μg of isolated tGFP-labeled mitochondria were incubated with naïve PC-12 cells for 2 hours as described earlier, the cells were imaged over a 12 hour period during which positive intracellular tGFP fluorescence was evident (Figure 9). Remarkably, cells could be seen replicating during this time, segregating transplanted mitochondria between daughter cells (see also supplemental video 1).
Figure 9.
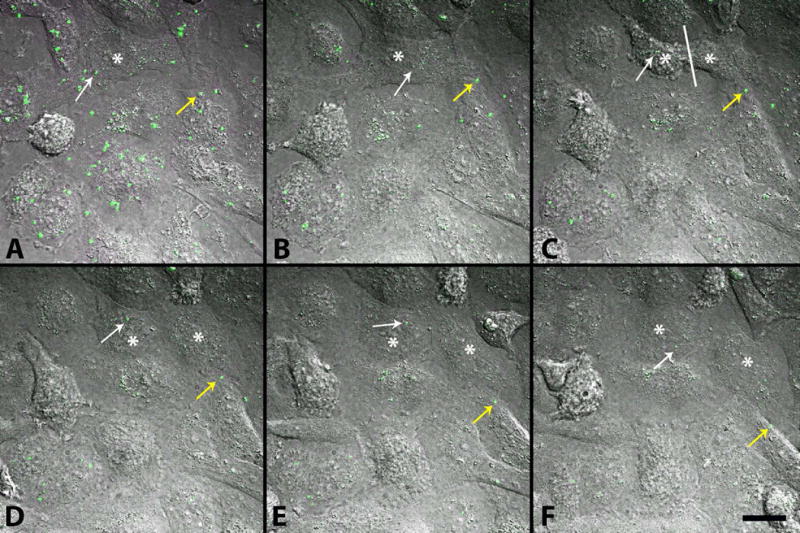
Movement of exogenous tGFP mitochondria within PC-12 cells. After 10 μg tGFP mitochondria was added to naïve PC-12 cells and incubated at 37°C on a gently rolling platform for 2 hours, they were washed off and replaced with complete media before time lapse images were taken over a 12-hour period. Images represent beginning of imaging (A) separated by 100 minutes for each time frame (B–F). Mitochondria can be visualized moving within cells (yellow arrow). As a cell divides (white asterisk on mother cell in A and B, then on each daughter cell in C–F, with division occurring at white line in C), transplanted mitochondria can be seen throughout the division process, and are retained in the daughter cells (white arrow). Images were taken using Nikon Ti confocal microscope. Scale bar = 20μM.
3.6 In vivo Transplantation
Using the optimal isolation methods, mitochondrial transplantation was performed in vivo to determine if transgenically-labeled, cell culture-derived exogenous mitochondria can be incorporated into living spinal cord tissues. Briefly, tGFP mitochondria were isolated and injected into the medial lateral gray matter of the rat spinal cord at the L1/L2 spinal level. At 24 hr after transplantation, animals were euthanized and spinal cords processed for histology. An anti-tGFP antibody was used in tandem with antibodies specific to mitochondrial proteins (Figure 10) or macrophages and endothelial cells to determine cell type co-localization (Figure 11).
Figure 10.
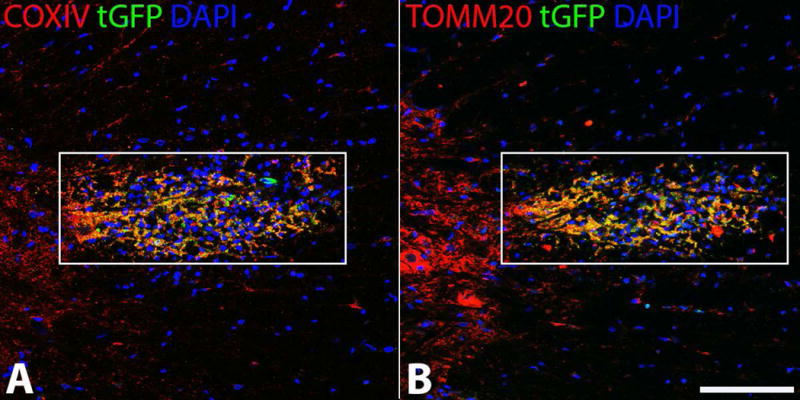
tGFP labeled mitochondria injected into the spinal cord co-localize with mitochondrial markers. tGFP mitochondria were isolated from PC-12 cells and injected into the rat spinal cord. Antibodies against tGFP and the inner (A) (COXIV) and outer (B) (TOMM20) mitochondrial membranes show that the injected green fluorescence is intact mitochondria. Images taken on Nikon Ti confocal microscope. White boxes indicate region of injection and co-localization analyses. Scale bar= 100μM.
Figure 11.
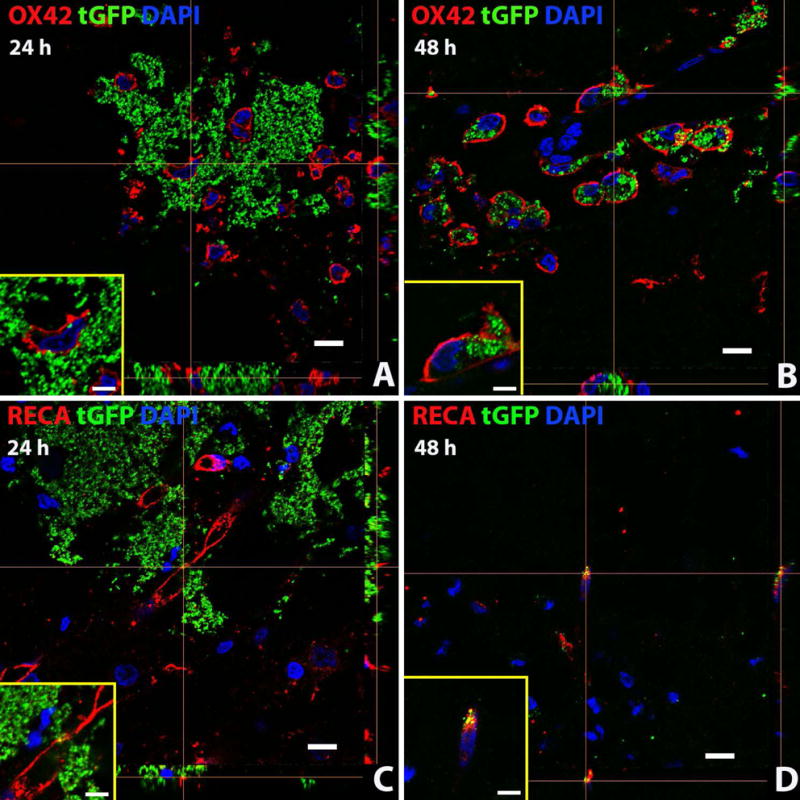
Exogenous tGFP mitochondria are incorporated into different cell types in situ. tGFP mitochondria were injected into the naïve spinal cord. Representative z-stack images were taken from spinal cords at the 24 (A, C) or 48 hour (B,D) time points after injection. OX42 = microglia/macrophages, RECA = endothelial cells. Scale bars = 10μM. Images were taken with Nikon Ti confocal microscope.
COXIV antibody targets the inner mitochondrial membrane, while TOMM20 antibody targets the outer mitochondrial membrane. When visualized with tGFP which also localizes to the inner membrane, COX IV co-localization indicates that the tGFP signal is indeed mitochondria. Further, the exogenous mitochondria appear intact as the tGFP tag localizes to the inner membrane and TOMM20 labels the outer membrane; positive co-localization indicates grafted mitochondria with both inner and outer membranes intact (Figure 10). When quantifying the co-localization of the tGFP positive and Texas Red positive pixels in the injection region (indicated by white boxes), the Mander’s overlap value for tGFP and COXIV was 0.843 and for tGFP and TOMM20 was 0.855. This indicates that within the region of injection, the tGFP mitochondria are co-localized with mitochondrial markers.
Positive signal overlap (yellow) of green (tGFP) signal within cell membranes (red) indicate co-localization. Exogenous tGFP mitochondria were found to be within both microglia/macrophages and endothelial cells of the spinal cord at both 24 and 48 hours after injection (Figure 11). There may be a cell-specific mode for mitochondrial incorporation. For example, there is much evidence of punctate tGFP+ signal within the cell membrane of macrophages (Fig. 11 A and B), though it is not known if the mitochondria underwent phagocytosis or whether they were passively incorporated into the cytoplasm. Additionally, tGFP mitochondria were found within endothelial cells at both time points (Fig. 11 C and D). There was positive tGFP signal directly associated with the membranes of some endothelial cells that appeared perinuclear, which may indicate the mitochondria are being taken into perivascular pericytes (Figure 11 C, tGFP+ signal closely associated with endothelial membrane). Further studies will utilize markers for pericytes to determine if exogenous mitochondria are being taken into these cells, and we will comprehensively characterize cell-type incorporation over time.
4. Discussion
The results of our feasibility study demonstrate that transgenically-labeled tGFP mitochondria are a viable option for visually tracking transplanted mitochondria both in vitro and in situ. It is possible to label the inner mitochondrial membrane of cultured cells with tGFP with high transfection efficiency and isolated mitochondria have intact inner and outer mitochondrial membranes, as well as dense cristae as seen in TEM images. We also found that supplementation of isolated mitochondria with pyruvate malate and succinate is beneficial for maintaining State III respiration at room temperature for prolonged periods of time often required for transplantation procedures in vivo. Further, we demonstrate that the transgenic tGFP label is an indelible marker of transplanted mitochondria, and contrary to previous studies (Katrangi et al 2007), we found that MTG did not stay irreversibly bound to exogenous mitochondria; this may result in host labeling and inaccurate conclusions of successful transplantation. Others have also found MTG fluorescence intensity to be at least partially dependent upon membrane potential (Keij et al 2000).
The bioenergetics of mitochondria isolated from cultured cells did not change across multiple passages, but there was an overall decreased respiration rate of transgenically-labeled mitochondria when compared to unlabeled mitochondria. This may be partially contributed to the stable transfection attained by puromycin selection. While the transgenic cells have a puromycin resistance sequence, they grew more slowly than naive cells at the same passage numbers. We noted that the cell doubling time for unlabeled cells is about 24 hours, whereas the doubling time for transgenic cells was closer to 72 hours. We did not note any higher levels of die-off or cell death while the transgenic cells were under selection. At lower cell passage generations, the isolated mitochondria remained well-coupled with comparable RCR to naïve mitochondria. In contrast, MTG-labeled mitochondria showed higher respiration than tGFP-labeled mitochondria, although this increase was not significant. Importantly, naïve, MTG-labeled and tGFP-labeled mitochondria had healthy RCRs indicating that the electron transport chain is well coupled to the ATP synthase complex. Differences in respiration of MTG labeled mitochondria vs naive unlabeled mitochondria has been documented (Buckman et al 2001), where it was concluded that MTG alters ETC activity such as uncoupling the ETC from ATP synthesis.
Use of transgenically-labeled mitochondria opens the possibilities for cell type co-localization/double labeling and tracking experiments to evaluate incorporation of exogenous mitochondria distinguishable from host cells. Transgenic labeling of mitochondria in vitro can supply a pool of stably transfected mitochondria that affords the opportunity to visualize the movement and integration of exogenous mitochondria within host cells and/or tissues. This can be especially important in future studies to determine the fusion and fission properties of exogenous mitochondria in the context of their successful integration into the host mitochondrial networks after transplantation. Further, this labeling strategy could be useful for visualizing mitochondria in paradigms of transplantation after cytotoxic insult to cultured cells to determine beneficial effects afforded by mitochondrial supplementation.
Upon co-incubation of tGFP mitochondria with naïve PC-12 cells, we showed that exogenous mitochondria were taken into cells within hours and could be seen moving within cells. This reflects previous reports that supplemented mitochondria, labeled in various manners, are taken into cultured cells upon co-incubation (Chang et al 2013a, Clark & Shay 1982, Katrangi et al 2007, Kitani et al 2014b). Our results showed concentration-dependent tGFP mitochondria incorporation into naïve cells, and time lapse imaging over 12 hours after co-incubation showed tGFP mitochondria moving within cells. We also performed in vivo transplantation to test incorporation in spinal cord tissues in situ. Co-labeling of TOMM20 and COXIV showed that the tGFP+ signals represent exogenous mitochondria, and subsequent immunohistochemistry indicated that transplanted tGFP mitochondria were co-localized predominantly with both microglia/macrophages and endothelial cells. Further analyses are quantifying the incorporation propensity into these cells, as well as other cell types of the spinal cord including neurons, oligodendrocytes, and astrocytes.
Mitochondrial uptake into cells similar to our results has been reported, but it is yet unknown what the mechanism of incorporation is- whether the process is passive or active, as multiple studies have found evidence for different mechanisms not always supporting each other. For instance, some have shown that different cell lines are more likely than others to incorporate exogenous mitochondria upon co-incubation, which was theorized to be due to differential endocytic properties of cell types (Clark & Shay 1982). Others have shown xenogenic transfer of exogenous mitochondria in culture upon co-incubation (Katrangi et al 2007). It has been posited alternatively that mitochondria cannot be taken into recipient cells via passive endocytosis (Pacak et al 2015). This group utilized chemicals to block different methods of internalization and found that only cytochalasin D, which blocks actin polymerization, inhibited mitochondrial uptake. They also blocked clathrin-dependent endocytosis, tunneling nanotubes, and macropinocytosis, but found none of these inhibited mitochondrial uptake. However, others reports that macropinocytosis is necessary for mitochondrial internalization utilizing the same blocker of macropinocytosis the Pacak study used (Kitani et al 2014b). Different cell types were used in the two studies, which may support the findings of Clark and Shay (1982) that cell types can behave differently. While these studies all support that exogenous mitochondria can be taken into host cells in culture, there is not yet consensus on mechanisms by which this happens.
In summary, by using transgenic mitochondrial labeling and time-lapse imaging, it is possible to visualize mitochondrial uptake into cells in real time in vitro, allowing further investigation into the exact mechanisms of incorporation. Importantly, we present data showing that transgenic labeling is indelible without affecting mitochondrial integrity so that they may be effectively tracked and visualized after transplantation in both cultured cells and tissues in situ. We found the transgenic tGFP tag 1) permanently labels mitochondria with no evidence of dissociation, 2) does not affect mitochondrial integrity, and 3) is easily identified using both fluorescent microscopy alone or with enhanced antibody labeling. Our transgenically-labelled mitochondria did have lower overall respiration rates compared to unlabeled mitochondria, which is a caveat that must be considered for future transplantation experiments. Depending upon the purpose of the experiment, there is a caveat that using tGFP mitochondria may respire more slowly, but they have a reliable marker for visualization. Ongoing studies are characterizing cell-type and propensity for incorporation of exogenous tGFP mitochondria over time in naïve and injured spinal cords, including neurons, oligodendrocytes, astrocytes, microglia/macrophages, and endothelial cells. Future analyses will determine the functionality of mitochondria after transplantation following spinal cord injury. The question will then be asked what effects exogenous mitochondria may have on tissues in vivo where there is a complex environment including different cell types, potential immune responses, as well as further technical hurdles to consider. With the refinements we have made in the isolation protocols for transplantation, we can begin to address these uncertainties.
Supplementary Material
Highlights.
Mitochondria of PC-12 cells can be genetically labeled with a fluorescent tag.
This tag does not significantly compromise the respiratory health of the mitochondria.
Substrate addition helps to maintain mitochondrial health at room temperature.
Exogenous labeled mitochondria are taken into cells in culture following co-incubation.
Exogenous labeled mitochondria can incorporate into host cells in the rat spinal cord.
Acknowledgments
We would like to thank David Cox for his assistance in surgical procedures. This work was supported by NIH/NINDS T32 Training Grant 5T32 NS077889 (JLG), NIH/NINDS F31NS093904-01A1 (JLG), Conquer Paralysis Now “Out-of-Box” Award, NIH/NINDS R21NS096670 (AGR), University of Kentucky Spinal Cord and Brain Injury Center Chair Endowment (AGR), NIH/NINDS 2P30NS051220.
Footnotes
Publisher's Disclaimer: This is a PDF file of an unedited manuscript that has been accepted for publication. As a service to our customers we are providing this early version of the manuscript. The manuscript will undergo copyediting, typesetting, and review of the resulting proof before it is published in its final citable form. Please note that during the production process errors may be discovered which could affect the content, and all legal disclaimers that apply to the journal pertain.
References
- Armstrong JS. Mitochondrial medicine: pharmacological targeting of mitochondria in disease. Br J Pharmacol. 2007;151:1154–65. doi: 10.1038/sj.bjp.0707288. [DOI] [PMC free article] [PubMed] [Google Scholar]
- Azbill RD, Mu X, Bruce-Keller AJ, Mattson MP, Springer JE. Impaired mitochondrial function, oxidative stress and altered antioxidant enzyme activities following traumatic spinal cord injury. Brain research. 1997;765:283–90. doi: 10.1016/s0006-8993(97)00573-8. [DOI] [PubMed] [Google Scholar]
- Bains M, Hall ED. Antioxidant therapies in traumatic brain and spinal cord injury. Biochim Biophys Acta. 2012;1822:675–84. doi: 10.1016/j.bbadis.2011.10.017. [DOI] [PMC free article] [PubMed] [Google Scholar]
- Brand MD, Nicholls DG. Assessing mitochondrial dysfunction in cells. The Biochemical journal. 2011;435:297–312. doi: 10.1042/BJ20110162. [DOI] [PMC free article] [PubMed] [Google Scholar]
- Buckman JF, Hernandez H, Kress GJ, Votyakova TV, Pal S, Reynolds IJ. MitoTracker labeling in primary neuronal and astrocytic cultures: influence of mitochondrial membrane potential and oxidants. J Neurosci Methods. 2001;104:165–76. doi: 10.1016/s0165-0270(00)00340-x. [DOI] [PubMed] [Google Scholar]
- Chang J, Liu K, Chuang C, Wu S, Kuo S, Liu C. Transplantation of Pep-1-labeled mitochondria protection against a 6-OHDA-induced neurotoxicity in rats. The Changhua Journal of Medicine. 2013a;11:8–17. [Google Scholar]
- Chang JC, Liu KH, Li YC, Kou SJ, Wei YH, et al. Functional recovery of human cells harbouring the mitochondrial DNA mutation MERRF A8344G via peptide-mediated mitochondrial delivery. Neurosignals. 2013b;21:160–73. doi: 10.1159/000341981. [DOI] [PubMed] [Google Scholar]
- Clark MA, Shay JW. Mitochondrial transformation of mammalian cells. Nature. 1982;295:605–7. doi: 10.1038/295605a0. [DOI] [PubMed] [Google Scholar]
- Cselenyak A, Pankotai E, Horvath EM, Kiss L, Lacza Z. Mesenchymal stem cells rescue cardiomyoblasts from cell death in an in vitro ischemia model via direct cell-to-cell connections. BMC Cell Biol. 2010;11:29. doi: 10.1186/1471-2121-11-29. [DOI] [PMC free article] [PubMed] [Google Scholar]
- Cunha FM, Caldeira da Silva CC, Cerqueira FM, Kowaltowski AJ. Mild mitochondrial uncoupling as a therapeutic strategy. Curr Drug Targets. 2011;12:783–9. doi: 10.2174/138945011795528778. [DOI] [PubMed] [Google Scholar]
- Elliott RL, Jiang XP, Head JF. Mitochondria organelle transplantation: introduction of normal epithelial mitochondria into human cancer cells inhibits proliferation and increases drug sensitivity. Breast Cancer Res Treat. 2012;136:347–54. doi: 10.1007/s10549-012-2283-2. [DOI] [PubMed] [Google Scholar]
- Fiskum G. Mitochondrial participation in ischemic and traumatic neural cell death. Journal of neurotrauma. 2000;17:843–55. doi: 10.1089/neu.2000.17.843. [DOI] [PubMed] [Google Scholar]
- Gilgun-Sherki Y, Rosenbaum Z, Melamed E, Offen D. Antioxidant therapy in acute central nervous system injury: current state. Pharmacological reviews. 2002;54:271–84. doi: 10.1124/pr.54.2.271. [DOI] [PubMed] [Google Scholar]
- Han J, Han MS, Tung CH. A non-toxic fluorogenic dye for mitochondria labeling. Biochimica et biophysica acta. 2013;1830:5130–5. doi: 10.1016/j.bbagen.2013.07.001. [DOI] [PMC free article] [PubMed] [Google Scholar]
- Hayakawa K, Esposito E, Wang X, Terasaki Y, Liu Y, et al. Transfer of mitochondria from astrocytes to neurons after stroke. Nature. 2016;535:551–5. doi: 10.1038/nature18928. [DOI] [PMC free article] [PubMed] [Google Scholar]
- Islam MN, Das SR, Emin MT, Wei M, Sun L, et al. Mitochondrial transfer from bone-marrow-derived stromal cells to pulmonary alveoli protects against acute lung injury. Nat Med. 2012;18:759–65. doi: 10.1038/nm.2736. [DOI] [PMC free article] [PubMed] [Google Scholar]
- Jin H, Kanthasamy A, Ghosh A, Anantharam V, Kalyanaraman B, Kanthasamy AG. Mitochondria-targeted antioxidants for treatment of Parkinson’s disease: preclinical and clinical outcomes. Biochim Biophys Acta. 2014;1842:1282–94. doi: 10.1016/j.bbadis.2013.09.007. [DOI] [PMC free article] [PubMed] [Google Scholar]
- Jin Y, McEwen ML, Nottingham SA, Maragos WF, Dragicevic NB, et al. The mitochondrial uncoupling agent 2,4-dinitrophenol improves mitochondrial function, attenuates oxidative damage, and increases white matter sparing in the contused spinal cord. J Neurotrauma. 2004;21:1396–404. doi: 10.1089/neu.2004.21.1396. [DOI] [PubMed] [Google Scholar]
- Katrangi E, D’Souza G, Boddapati SV, Kulawiec M, Singh KK, et al. Xenogenic transfer of isolated murine mitochondria into human rho0 cells can improve respiratory function. Rejuvenation Res. 2007;10:561–70. doi: 10.1089/rej.2007.0575. [DOI] [PubMed] [Google Scholar]
- Keij JF, Bell-Prince C, Steinkamp JA. Staining of mitochondrial membranes with 10-nonyl acridine orange, MitoFluor Green, and MitoTracker Green is affected by mitochondrial membrane potential altering drugs. Cytometry. 2000;39:203–10. doi: 10.1002/(sici)1097-0320(20000301)39:3<203::aid-cyto5>3.0.co;2-z. [DOI] [PubMed] [Google Scholar]
- King MP, Attardi G. Injection of mitochondria into human cells leads to a rapid replacement of the endogenous mitochondrial DNA. Cell. 1988;52:811–9. doi: 10.1016/0092-8674(88)90423-0. [DOI] [PubMed] [Google Scholar]
- Kitani T, Kami D, Kawasaki T, Nakata M, Matoba S, Gojo S. Direct human mitochondrial transfer: a novel concept based on the endosymbiotic theory. Transplant Proc. 2014a;46:1233–6. doi: 10.1016/j.transproceed.2013.11.133. [DOI] [PubMed] [Google Scholar]
- Kitani T, Kami D, Matoba S, Gojo S. Internalization of isolated functional mitochondria: involvement of macropinocytosis. J Cell Mol Med. 2014b;18:1694–703. doi: 10.1111/jcmm.12316. [DOI] [PMC free article] [PubMed] [Google Scholar]
- Lin HC, Liu SY, Lai HS, Lai IR. Isolated mitochondria infusion mitigates ischemia-reperfusion injury of the liver in rats. Shock. 2013;39:304–10. doi: 10.1097/SHK.0b013e318283035f. [DOI] [PubMed] [Google Scholar]
- Luft R. The development of mitochondrial medicine. Proc Natl Acad Sci U S A. 1994;91:8731–8. doi: 10.1073/pnas.91.19.8731. [DOI] [PMC free article] [PubMed] [Google Scholar]
- Masuzawa A, Black KM, Pacak CA, Ericsson M, Barnett RJ, et al. Transplantation of autologously derived mitochondria protects the heart from ischemia-reperfusion injury. Am J Physiol Heart Circ Physiol. 2013;304:H966–82. doi: 10.1152/ajpheart.00883.2012. [DOI] [PMC free article] [PubMed] [Google Scholar]
- Matz MV, Fradkov AF, Labas YA, Savitsky AP, Zaraisky AG, et al. Fluorescent proteins from nonbioluminescent Anthozoa species. Nat Biotechnol. 1999;17:969–73. doi: 10.1038/13657. [DOI] [PubMed] [Google Scholar]
- McCully JD, Cowan DB, Pacak CA, Toumpoulis IK, Dayalan H, Levitsky S. Injection of isolated mitochondria during early reperfusion for cardioprotection. Am J Physiol Heart Circ Physiol. 2009;296:H94–H105. doi: 10.1152/ajpheart.00567.2008. [DOI] [PMC free article] [PubMed] [Google Scholar]
- Minamikawa T, Sriratana A, Williams DA, Bowser DN, Hill JS, Nagley P. Chloromethyl-X-rosamine (MitoTracker Red) photosensitises mitochondria and induces apoptosis in intact human cells. Journal of cell science. 1999;112(Pt 14):2419–30. doi: 10.1242/jcs.112.14.2419. [DOI] [PubMed] [Google Scholar]
- Nunnari J, Suomalainen A. Mitochondria: in sickness and in health. Cell. 2012;148:1145–59. doi: 10.1016/j.cell.2012.02.035. [DOI] [PMC free article] [PubMed] [Google Scholar]
- Pacak CA, Preble JM, Kondo H, Seibel P, Levitsky S, et al. Actin-dependent mitochondrial internalization in cardiomyocytes: evidence for rescue of mitochondrial function. Biol Open. 2015;4:622–6. doi: 10.1242/bio.201511478. [DOI] [PMC free article] [PubMed] [Google Scholar]
- Patel SP, Gamboa JL, McMullen CA, Rabchevsky A, Andrade FH. Lower respiratory capacity in extraocular muscle mitochondria: evidence for intrinsic differences in mitochondrial composition and function. Invest Ophthalmol Vis Sci. 2009a;50:180–6. doi: 10.1167/iovs.08-1911. [DOI] [PMC free article] [PubMed] [Google Scholar]
- Patel SP, Sullivan PG, Lyttle TS, Magnuson DS, Rabchevsky AG. Acetyl-L-carnitine treatment following spinal cord injury improves mitochondrial function correlated with remarkable tissue sparing and functional recovery. Neuroscience. 2012;210:296–307. doi: 10.1016/j.neuroscience.2012.03.006. [DOI] [PMC free article] [PubMed] [Google Scholar]
- Patel SP, Sullivan PG, Lyttle TS, Rabchevsky AG. Acetyl-L-carnitine ameliorates mitochondrial dysfunction following contusion spinal cord injury. J Neurochem. 2010;114:291–301. doi: 10.1111/j.1471-4159.2010.06764.x. [DOI] [PMC free article] [PubMed] [Google Scholar]
- Patel SP, Sullivan PG, Pandya JD, Goldstein GA, VanRooyen JL, et al. N-acetylcysteine amide preserves mitochondrial bioenergetics and improves functional recovery following spinal trauma. Exp Neurol. 2014;257:95–105. doi: 10.1016/j.expneurol.2014.04.026. [DOI] [PMC free article] [PubMed] [Google Scholar]
- Patel SP, Sullivan PG, Pandya JD, Rabchevsky AG. Differential effects of the mitochondrial uncoupling agent, 2,4-dinitrophenol, or the nitroxide antioxidant, Tempol, on synaptic or nonsynaptic mitochondria after spinal cord injury. J Neurosci Res. 2009b;87:130–40. doi: 10.1002/jnr.21814. [DOI] [PMC free article] [PubMed] [Google Scholar]
- Petruzzella V, Baggetto LG, Penin F, Cafagna F, Ruggiero FM, et al. In vivo effect of acetyl-L-carnitine on succinate oxidation, adenine nucleotide pool and lipid composition of synaptic and non-synaptic mitochondria from cerebral hemispheres of senescent rats. Archives of gerontology and geriatrics. 1992;14:131–44. doi: 10.1016/0167-4943(92)90048-9. [DOI] [PubMed] [Google Scholar]
- Plotnikov EY, Khryapenkova TG, Vasileva AK, Marey MV, Galkina SI, et al. Cell-to-cell crosstalk between mesenchymal stem cells and cardiomyocytes in co-culture. J Cell Mol Med. 2008;12:1622–31. doi: 10.1111/j.1582-4934.2007.00205.x. [DOI] [PMC free article] [PubMed] [Google Scholar]
- Rabchevsky AG, Fugaccia I, Sullivan PG, Blades DA, Scheff SW. Efficacy of methylprednisolone therapy for the injured rat spinal cord. J Neurosci Res. 2002;68:7–18. doi: 10.1002/jnr.10187. [DOI] [PubMed] [Google Scholar]
- Rizzuto R, Brini M, De Giorgi F, Rossi R, Heim R, et al. Double labelling of subcellular structures with organelle-targeted GFP mutants in vivo. Curr Biol. 1996;6:183–8. doi: 10.1016/s0960-9822(02)00451-7. [DOI] [PubMed] [Google Scholar]
- Rizzuto R, Brini M, Pizzo P, Murgia M, Pozzan T. Chimeric green fluorescent protein as a tool for visualizing subcellular organelles in living cells. Curr Biol. 1995;5:635–42. doi: 10.1016/s0960-9822(95)00128-x. [DOI] [PubMed] [Google Scholar]
- Rizzuto R, Nakase H, Darras B, Francke U, Fabrizi GM, et al. A gene specifying subunit VIII of human cytochrome c oxidase is localized to chromosome 11 and is expressed in both muscle and non-muscle tissues. J Biol Chem. 1989;264:10595–600. [PubMed] [Google Scholar]
- Rodriguez-Jimnez FJ, Alastrue-Agudo A, Erceg S, Stojkovic M, Moreno-Manzano V. FM19G11 favors spinal cord injury regeneration and stem cell self-renewal by mitochondrial uncoupling and glucose metabolism induction. Stem Cells. 2012;30:2221–33. doi: 10.1002/stem.1189. [DOI] [PubMed] [Google Scholar]
- Shitara H, Kaneda H, Sato A, Iwasaki K, Hayashi J, et al. Non-invasive visualization of sperm mitochondria behavior in transgenic mice with introduced green fluorescent protein (GFP) FEBS Lett. 2001;500:7–11. doi: 10.1016/s0014-5793(01)02574-1. [DOI] [PubMed] [Google Scholar]
- Smith RA, Adlam VJ, Blaikie FH, Manas AR, Porteous CM, et al. Mitochondria-targeted antioxidants in the treatment of disease. Ann N Y Acad Sci. 2008;1147:105–11. doi: 10.1196/annals.1427.003. [DOI] [PubMed] [Google Scholar]
- Spees JL, Olson SD, Whitney MJ, Prockop DJ. Mitochondrial transfer between cells can rescue aerobic respiration. Proc Natl Acad Sci U S A. 2006;103:1283–8. doi: 10.1073/pnas.0510511103. [DOI] [PMC free article] [PubMed] [Google Scholar]
- Sullivan PG, Rabchevsky AG, Waldmeier PC, Springer JE. Mitochondrial permeability transition in CNS trauma: cause or effect of neuronal cell death? Journal of neuroscience research. 2005;79:231–9. doi: 10.1002/jnr.20292. [DOI] [PubMed] [Google Scholar]
- Sullivan PG, Springer JE, Hall ED, Scheff SW. Mitochondrial uncoupling as a therapeutic target following neuronal injury. J Bioenerg Biomembr. 2004;36:353–6. doi: 10.1023/B:JOBB.0000041767.30992.19. [DOI] [PubMed] [Google Scholar]
- Visavadiya NP, Patel SP, VanRooyen JL, Sullivan PG, Rabchevsky AG. Cellular and subcellular oxidative stress parameters following severe spinal cord injury. Redox Biol. 2015;8:59–67. doi: 10.1016/j.redox.2015.12.011. [DOI] [PMC free article] [PubMed] [Google Scholar]
- Wang X, Gerdes HH. Transfer of mitochondria via tunneling nanotubes rescues apoptotic PC12 cells. Cell Death Differ. 2015;22:1181–91. doi: 10.1038/cdd.2014.211. [DOI] [PMC free article] [PubMed] [Google Scholar]
- Yang YW, Koob MD. Transferring isolated mitochondria into tissue culture cells. Nucleic Acids Res. 2012;40:e148. doi: 10.1093/nar/gks639. [DOI] [PMC free article] [PubMed] [Google Scholar]
Associated Data
This section collects any data citations, data availability statements, or supplementary materials included in this article.


