

Abstract
Improved clinical care for Bipolar Disorder (BD) relies on the identification of diagnostic markers that can reliably detect disease-related signals in clinically heterogeneous populations. At the very least, diagnostic markers should be able to differentiate patients with BD from healthy individuals and from individuals at familial risk for BD who either remain well or develop other psychopathology, most commonly Major Depressive Disorder (MDD). These issues are particularly pertinent to the development of translational applications of neuroimaging as they represent challenges for which clinical observation alone is insufficient. We therefore applied pattern classification to task-based functional magnetic resonance imaging (fMRI) data of the n-back working memory task, to test their predictive value in differentiating patients with BD (n=30) from healthy individuals (n=30) and from patients’ relatives who were either diagnosed with MDD (n=30) or were free of any personal lifetime history of psychopathology (n=30). Diagnostic stability in these groups was confirmed with 4-year prospective follow-up. Task-based activation patterns from the fMRI data were analyzed with Gaussian Process Classifiers (GPC), a machine learning approach to detecting multivariate patterns in neuroimaging datasets. Consistent significant classification results were only obtained using data from the 3-back versus 0-back contrast. Using contrast, patients with BD were correctly classified compared to unrelated healthy individuals with an accuracy of 83.5%, sensitivity of 84.6% and specificity of 92.3%. Classification accuracy, sensitivity and specificity when comparing patients with BD to their relatives with MDD, were respectively 73.1%, 53.9% and 94.5%. Classification accuracy, sensitivity and specificity when comparing patients with BD to their healthy relatives were respectively 81.8%, 72.7% and 90.9%. We show that significant individual classification can be achieved using whole brain pattern analysis of task-based working memory fMRI data. The high accuracy and specificity achieved by all three classifiers suggest that multivariate pattern recognition analyses can aid clinicians in the clinical care of BD in situations of true clinical uncertainty regarding the diagnosis and prognosis.
INTRODUCTION
Bipolar disorder (BD) is an affective disorder that ranks amongst the leading causes of disability worldwide across all age groups (World Health Organization, 2008). This motivates efforts to characterize valid and reliable biological markers of disease expression in order to facilitate early identification and novel treatment discovery.
Magnetic resonance imaging (MRI) has been extensively used to investigate the neural correlates of disease expression in BD. Structural MRI (sMRI) studies have demonstrated that BD is associated with reductions in whole brain and regional gray matter volumes (Hallahan et al., 2011; Kempton et al., 2011; Fears et al., 2014). Functional MRI (fMRI) studies have provided further information in terms of changes in regional blood-oxygen-level-dependent (BOLD) signal, most commonly in the domains of affect processing and executive control, where both genetically-derived and disease-related deficits have been reported (Glahn et al., 2010; Fears et al., 2014). The common network for affect processing notably involves the amygdala (AMG), ventral striatum and putamen and the ventral prefrontal (VPFC), ventral anterior cingulate (ACC) and insular cortices (Lindquist et al., 2012). The common network supporting executive control functions includes dorsal striatal structures as well as the dorsolateral prefrontal (DLPFC), dorsal ACC, and parietal (PAR) cortices (Niendam et al., 2012). In patients with BD, exaggerated activation during affective and executive tasks has been consistently observed in the AMG, insula, and ventral ACC coupled with reduced PFC engagement (Chen at al., 2011; Cusi et al., 2012; Delvecchio et al., 2012; Fusar-Poli et al., 2012; Jogia et al., 2012; Cremaschi et al., 2013; Dima et al., 2013). These observations have improved the characterization of the biological underpinnings of BD but have had limited clinical utility as they are based on group-level inferences that cannot be readily applied to the categorization of single individuals.
Advances in machine learning techniques, a field of artificial intelligence, represent a major development that could lead to clinical useful neuroimaging applications in psychiatry. Multivariate pattern recognition is a particular type of machine learning concerned with the discovery of regularities in data through the use of computer algorithms (Vapnik 1995). Frequently used machine learning approaches are support vector machines (SVM) and Gaussian Process Classifiers (GPC) (Figure 1). Our group and others have shown that the application of multivariate pattern recognition analyses can reliably classify patients with BD from healthy individuals (Rocha-Rego et al., 2014; Mwangi et al., 2014; Schnack et al., 2014) and from patients with schizophrenia (Schnack et al., 2014) or Major Depressive Disorder (MDD) (Grotegerd et al., 2013; Grotegerd et al., 2014) with an accuracy of approximately 70–80%.
Figure 1. Machine Learning Classification.
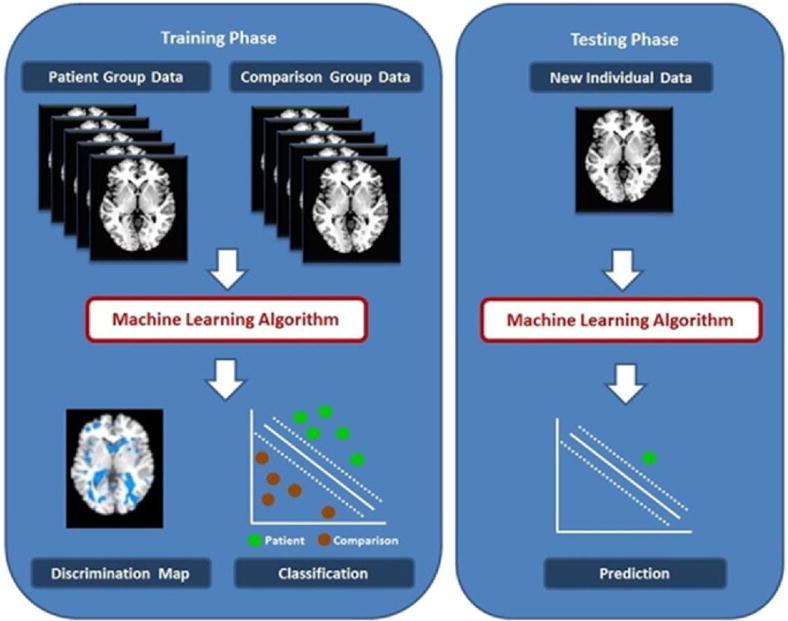
This is a simplified illustration of the Gaussian Process Classifier functions that outlines the general principles of multivariate machine learning classification as applied to neuroimaging data from two hypothetical groups, referred to as patient and comparison group. During the training phase (left panel), the classifier is separately presented with multiple neuroimaging datasets of individuals that belong to one or the other group. The algorithm uses these data to assign a predictive weight to each voxel as more or less likely to be associated with one or the other group. The output of the classifier is a discrimination maps showing regions that have the most significant contribution to classification (left panel, bottom left) and values regarding the performance of the classifier based on their separating hyperplane (left panel, bottom right). During the test phase, a previously unseen dataset is presented to the algorithm and is classified based on its probability of belonging to either the patient or comparison group.
It can be argued however, that neuroimaging may be able to make a unique contribution in situations where clinical assessment and observation are not sufficient for diagnosis and prognosis. For clinicians, one of the greatest challenges lies in the differential diagnosis of BD from MDD. Although mania is the diagnostic hallmark of BD, in the majority of patients the disorder first presents with depressive symptoms (Forty et al., 2009). Even after disease onset, depressive symptoms dominate and contribute to morbidity and psychosocial disability (Judd et al., 2002). A substantial body of research has focused on identifying phenomenological features that could differentiate MDD from BD depression; the weight of evidence suggests that reliable and accurate differentiation at the level of the individual patient is beyond the resolution of even rigorous and detailed clinical assessment (Mitchell et al., 2008), particularly amongst those with a family history of BD (Mitchell et al., 2011). Consequently, many patients are misdiagnosed and treated as having MDD either because they present with depression at illness onset or because they generally underreport manic symptoms. This has important treatment implications as antidepressant treatment in BD may exaggerate mood instability (El-Mallakh et al., 2015). A further challenge lies in predicting the outcome of asymptomatic individuals with a family history of BD. As a group, these individuals are a higher risk than the general population for developing BD (Duffy et al., 2015; Fullerton et al., 2015).
Therefore the aim of the current study was to test whether neuroimaging can indeed assist clinicians when faced with true clinical uncertainty in situations where clinical acumen and observation are insufficient. We tackle two challenges; one focuses on the differential diagnosis of BD from MDD in the presence of family history of BD in the MDD patients. The other on the correct identification of individuals who have remained well but would be conventionally considered “at risk” based on having a first-degree relative with BD. We therefore test the hypothesis that GPCs of task-based fMRI data during the n-back working memory task can identify patterns of neural function that will prove useful in differentiating patients with BD from healthy unrelated individuals, and individuals at familial risk for BD who have either developed MDD or remained free of psychopathology. We focus on the functional neuroanatomy of the n-back task because it has been shown to be robust to variations in the paradigms used, scanner types and acquisition sequences (Owen et al., 2005; Dima et al., 2014) and has been reliably used to elicit disease-related abnormalities in patients with BD and their relatives (Fusar-Poli et al., 2012; Cremaschi et al., 2013).
METHODS
The study sample comprised 120 demographically matched participants consisting of 30 patients with BD-type I, 30 of their first-degree relatives diagnosed with MDD, 30 psychiatrically healthy first-degree relatives and 30 unrelated healthy controls (Table 1). Participants were drawn from with the VIBES study sample (Frangou 2009; Kempton et al., 2009a,b; Walterfang et al., 2009; Takahashi et al., 2010; Forcada et al., 2011; Lelli-Chiesa et al., 2011; Perrier et al., 2011; Pompei et al., 2011a,b; Ruberto et al., 2011; Jogia et al., 2011; Jogia et al., 2012a,b; Dima et al., 2013; Rocha-Rego et al., 2014; Delvecchio et al., 2015). Participants with BD or MDD fulfilled the respective diagnostic criteria outlined in the Diagnostic and Statistical Manual of Mental Disorders, 4th edition, revised (DSM-IV) (APA, 1994). Healthy relatives had no lifetime history of any major psychiatric disorder. Healthy unrelated controls had no family history or personal lifetime history of any major psychiatric disorder. All participants were free of any medical comorbidity and had no lifetime history of substance dependence or substance abuse in the six months leading to their brain scan. The diagnostic status of all participants was assessed using the Structured Clinical Interview for DSM-IV for Axis I diagnoses (First et al., 2002a, b). Patients with BD and their relatives with MDD did not differ in the age of onset of their respective diagnosis. The diagnostic stability of patients with BD, their MDD and healthy relatives was confirmed through annual interview over a 4-year period following their brain scan. On the day of scanning, all participants were assessed using the Hamilton Depression Rating Scale (HDRS) (Hamilton, 1960), the Young Mania Rating Scale (YMRS) (Young et al., 1978), the Brief Psychiatric Rating Scale (BPRS) (Lukoff et al., 1986) and the Wechsler Adult Intelligence Scale 3rd Edition (Wechsler, 1997). To ensure patients with BD and relatives with MDD were in remission their psychopathology was assessed weekly over period of 1 month leading to their scan and at each assessment patients’ scored below 7 in the HDRS and YMRS. Although the level of symptomatology was very low, patients with BD were more symptomatic than all other groups (p<0.001). The BPRS, HDRS and YMRS scores were highly correlated (all r > 0.78, all p< 0.001). BD patients were medicated at the time of scanning with atypical antipsychotics (n=21), antiepileptics (n=8), lithium (n=14), as monotherapy (n=18) or combination therapy (n=12). Three relatives with MDD were on selective serotonin re-uptake inhibitors. All medicated participants had remained on the same type and dose of medication for a minimum of 6 months prior to scanning. Informed consent was obtained from all participants. The study was approved by the institutional ethics review board.
Table 1.
Demographic, Clinical and Task Performance Data
| Unrelated Healthy Controls (n=30) |
Healthy Relatives (n=30) |
MDD Relatives (n=30) |
BD Patients (n=30) |
|
|---|---|---|---|---|
| Age (years) | 33.4 (11.6) | 35.3 (5.6) | 32.9 (9.9) | 34.7 (7.7) |
| Male: Female | 15:15 | 14:16 | 16:14 | 15:15 |
| Full scale IQ | 108.4 (10.9) | 110.5 (10.5) | 109 (11.4) | 107.1 (12.1) |
| Age of onset (years) | n/a | n/a | 20.1 (9.1) | 19.2 (10.8) |
| HDRSa | 0.1 (0.5) | 0.1 (0.4) | 1.3 (0.9) | 3.2 (1.1) |
| YMRSa | 0.1 (0.8) | (0) (0) | 0.1 (1.3) | 1.3 (0.7) |
| BPRSa | 24.4 (0.7) | 24.5 (0.6) | 25.4 (0.9) | 27.1 (2.4) |
| 3-back, % correctb | 73.2 (12.4) | 88.5 (14.3) | 73.4 (17.2) | 69.8 (16.7) |
| 3-back, response time [sec]c | 0.85 (0.3) | 0.79 (0.3) | 0.84 (0.5) | 0.87 (0.6) |
Except for sex, data are presented as mean (standard deviation). Bipolar disorder=BD; BPRS=Brief Psychiatric Rating Scale; IQ=Intelligence Quotient; HDRS=Hamilton depression Rating Scale; MDD=Major Depressive Disorder; YMRS=Young Mania Rating Scale; n/a=not applicable; there were no group differences in age, sex distribution, IQ and age of onset, P>0.7;
Significant effect of group for HDRS, YMRS and BPRS P<0.001; Post-hoc pairwise Bonferroni corrected comparisons showed that patients with BD more symptomatic than all other groups, P<0.01;
Significant effect of group F=15.8, P<0.01; Post-hoc Bonferroni corrected pairwise comparisons showed healthy relatives outperformed all other groups, P<0.02; Significant effect of group F=21.4, P<0.01; Post-hoc Bonferroni corrected pairwise comparisons showed healthy relatives outperformed all other groups, P<0.02
Working Memory Functional Imaging Task
The n-back task was employed in a block design incorporating alternating experimental and sensorimotor control conditions. A series of letters in yellow font were displayed on a blue screen for two seconds each. Participants were instructed to indicate by a button press whether the letter currently displayed matched the letter from the preceding n trials. In the sensorimotor control (0-back) the letter “X” was the designated target. In the experimental conditions (1, 2, 3-back) the target letter was defined as any letter that was identical to the one presented in the preceding one, two, or three trials. There were 18 epochs in all, each lasting 30 seconds, comprising 14 letters with a ratio of target to non-target letters ranging from 2:12 to 4:10 per epoch. The entire experiment lasted 9 minutes and included a total of 49 target and 203 non-target stimuli. To avoid any systematic order effects the conditions were pseudo-randomised. Performance was evaluated in terms of reaction time to target letters and accuracy (% correct responses). The task was explained to participants prior to scanning but there was no training.
Image acquisition
Gradient echo planar magnetic resonance (MR) images were acquired using a 1.5-Tesla GE Neurooptimised Signa MR system (General Electric, Milwaukee, WI, USA) fitted with 40 mT/m highspeed gradients. Foam padding and a forehead strap were used to limit head motion. A quadrature birdcage head coil was used for radio frequency (RF) transmission and reception. A total of 180 T2*-weighted MR brain volumes depicting BOLD contrast were acquired at each of 36 near-axial planes parallel to the inter-commissural (AC-PC) plane; repetition time (TR) = 3000ms, echo time (TE) = 40ms, slice thickness = 3mm, voxel dimensions = 3.75 × 3.75 × 3.30mm, interslice gap = 0.3mm, matrix size = 64 * 64, flip angle=90°. Prior to each acquisition sequence, four dummy data acquisition scans were performed to allow the scanner to reach a steady state in T1 contrast. During the same session, a high-resolution T1-weighted structural image was acquired in the axial plane (inversion recovery prepared, spoiled gradient-echo sequence; TR = 18ms, TE = 5.1 ms, TI = 450 ms, slice thickness = 1.5 mm, voxel dimensions = 0.9375 × 0.9375 × 1.5 mm, matrix size 256 * 192, field of view = 240 × 180 mm, flip angle = 20°, number of excitations = 1) for subsequent co-registration.
Image Processing
Conventional fMRI analyses were implemented using Statistical Parametric Mapping (SPM8) (www.fil.ion.ucl.ac.uk/spm/software/spm8/). fMRI images were realigned, normalized and smoothed using an 8 mm full-width-half-maximum Gaussian kernel. To ensure data quality, task registration parameters were extracted and were used to identify participants with excessive interscan motion (defined as >4 mm translation, >4° rotation) and to conduct group comparisons. No subjects were excluded and there were no significant group differences in motion. The smoothed single-participant images were analysed via multiple regressions using the linear convolution model, with vectors of onset representing the memory load conditions (1, 2, and 3 back) and the 0-back condition as sensorimotor control. Six movement parameters were also entered as nuisance covariates. Serial correlations were removed using an AR(1) model. A high pass filter (128s) was applied to remove low-frequency noise. Contrast images of each memory load condition (1-, 2-, 3- back) versus 0-back were produced for each participant. At the individual subject level, a standard general linear modelling (GLM) approach was used to obtain estimates of the response size (beta) in each the memory load condition against the 0-back control condition.
Conventional fMRI Analysis
We examined the effect of group (patients with BD, MDD relatives, healthy relatives and unrelated healthy controls) on BOLD signal using a standard general linear modelling (GLM) in SPM8 separately for each memory load condition (1-, 2-, 3- back) against the 0-back control. We examined each condition separately, instead of modelling activation changes with increasing load. This is because it has long been known that cortical loci, particularly in prefrontal regions, show non-linear changes in activation with increasing memory load (Callicott et al., 1999) which could increase voxel level variability. Suprathreshold clusters were identified using family wise error (FWE) voxel-wise correction of p<0.05. Stereotactic coordinates were converted from MNI spatial array to that of Talairach and Tournoux (www.mrc-cbu.cam.ac.uk/Imaging/mnispace.html) and corresponding anatomical and Brodmann area (BA) labels were identified with The Talairach Daemon Client (www.talairach.org). Measures of brain activation (weighted parameter estimates) from each subject were extracted using the MarsBaR toolbox (marsbar.sourceforge.net) from regions of interest (ROIs) defined on the basis of the whole brain analysis as 5 mm radius spheres at peak height coordinates within each suprathreshold cluster. These measures were also used to examine the role of potentially confounding variables of age, IQ, age of onset, task performance and medication. Although we report uncorrected P values, due to the large number of correlations undertaken the level of significant inference was set at a conservative P vale of 0.005.
Multivariate pattern classification
Probability of group membership was determined using Gaussian Process Classifiers (GPCs) implemented in the Pattern Recognition for Neuroimaging Toolbox (PRoNTo) (www.mlnl.cs.ucl.ac.uk/pronto/) using whole-brain individual beta maps/GLM coefficients for the contrasts of 1-back, 2-back and 3-back versus 0-back. Technical descriptions of GPC inference have been presented elsewhere (Schrouff et al. 2013). Briefly, the classifier is first trained to determine a predictive distribution that best distinguishes between two groups (e.g., case and controls); any parameters controlling the behaviour of this distribution are computed by maximizing the logarithm of the marginal likelihood on the training data only. Then in the test phase, the classifier predicts the group membership of a previously unseen example. This is achieved by integrating over the predictive distribution for the test case and passing the output through a sigmoidal function, resulting in predictive probabilities scaled between 0 and 1 which precisely quantify the predictive uncertainty of the classifier for the test case.
We focus on the usefulness of fMRI data derived from the n-back task in differentiating patients with BD from (a) healthy individuals, (b) their relatives with MDD, and (c) from their psychiatrically healthy relatives. Each classifiers was trained a leave-two-out cross-validation. For each cross-validation iteration, a matched pair of subjects from each group was excluded first and then the data were partitioned into training and test sets. For each trial, we thresholded the probabilistic predictions at 0.5 to convert the probabilistic predictions to class labels allowing the sensitivity and specificity of classification to be computed over all trials (Rasmussen and Williams, 2006). Statistical significance of each classifier was determined by permutation testing, as described previously (Marquand et al., 2010). Briefly, permutation testing was performed by repeatedly retraining the classifier after permuting the class labels (1000 permutations). A P-value for classification accuracy was computed by counting the number of permutations for which the permuted accuracy was equal or greater than the true accuracy (obtained with non-permuted labels), then dividing by 1000. In addition for each classifier, Pearson correlation analyses were carried out between GPC predictive probability and total BPRS scores, age, IQ, task performance, age of onset and medication dose. As a secondary outcome we generated an unthresholded GPC weight map for each classifier. As GPC classifiers are multivariate, these discrimination maps do not describe focal activation effects but instead they represent the spatially distributed pattern of coefficients that quantify the contribution of each voxel to the classifier’s decision function. We then estimated the positive (PPV) and negative (NPV) predictive value of each classifier.
RESULTS
Conventional fMRI Analysis
There were no group differences in the 1-back or 2-back versus 0-back contrasts. In the 3-back versus 0-back contrast a main effect of group was found (p=0.05 FWE voxel level corrected) in the middle frontal gyrus (BA10) (x=36 y=58 z=0, F score= 6.64, cluster size 240), the superior temporal gyrus (BA22) (x=58 y=−44 z=12, F score=6.54, cluster size 169) and the posterior cingulate cortex (BA30) (x=−28 y=−68 z=8, F score= 6.97, cluster size 76). Patients with BD had reduced mean level of activation in the middle frontal gyrus compared to healthy relatives and unrelated controls (p <0.02); however relatives with MDD did not differ compared to any other group and had an intermediate level of mean activation between healthy relatives/unrelated controls and BD patients. In the superior temporal gyrus, BD patients showed a greater mean level of activation compared to healthy controls and psychiatrically well relatives (p<0.05); however, relatives with MDD did not differ compared to any group and had an intermediate level of mean activation between healthy relatives/controls and BD patients. In the posterior cingulate cortex, the mean level of activation was reduced in relatives with MDD compared to all the other groups (p<0.04); all other pairwise comparisons were not significant.
We examined the role of potential confounders in several ways. We used three multivariate analyses of variance with medication status (antiepileptics vs. not on antiepileptic, lithium vs. not on lithium and antipsychotic vs. not on antipsychotics) as the independent factors and levels of activation in suprathreshold clusters in patients with BD as dependent variables. No group differences were found (all P>0.28). We examined correlations between activation in suprathreshold regions in patients with BD and dose of lithium and antipsychotics on the day of scanning. None were significant (all r<0.21, P>0.28). Similarly, we did not observe any correlation with age of onset in patients and relatives with MDD (all r<0.23, P>0.07). Further analyses in the entire sample did not reveal significant correlations between the level of activation in any suprathreshold cluster and age (all r<0.10, P>0.27), IQ (all r<0.08, P>0.38), accuracy (all r<0.06, P>0.51) and response time (all r<0.16, P>0.08). None of these correlations survive correction for multiple testing.
Multivariate Classification
Patients with BD versus unrelated healthy controls
Classifiers using the 1-back or 2-back versus 0-back contrast did not lead to a statistically significant differentiation between patients with BD and healthy controls. Classification based on the 1-back versus 0-back contrast resulted in 65.5% accuracy, 61. 5% sensitivity (true positives for BD) and 69.2% specificity (true negatives for unrelated controls) and was not significant (p=0.01). Classification based on the 2-back versus 0-back contrast resulted in 73.1% accuracy, 76.9% sensitivity and 69.3% specificity and was also not significant (p=0.08). In contrast, the classifier based on the 3-back versus 0-back contrast significantly differentiated patients from unrelated controls with an accuracy of 83.5% (p=0.001). The sensitivity of the classification was 84.6% and the specificity 92.3%/. The PPV (probability that individuals classified as BD patients were correctly identified) and NPV (probability that individuals classified as healthy controls were correctly identified) values were respectively 0.91 and 0.85. The unthresholded discrimination map showing the global spatial pattern by which the two groups differ based on the 3-back versus 0-back classifier is displayed in Figure 2A; the largest clusters discriminating patients with BD from unrelated controls were located in the left inferior/middle/superior frontal gyrus and in the superior parietal lobule.
Figure 2. Unthresholded discrimination maps for the classifier based on the 3-back >0-back contrast.
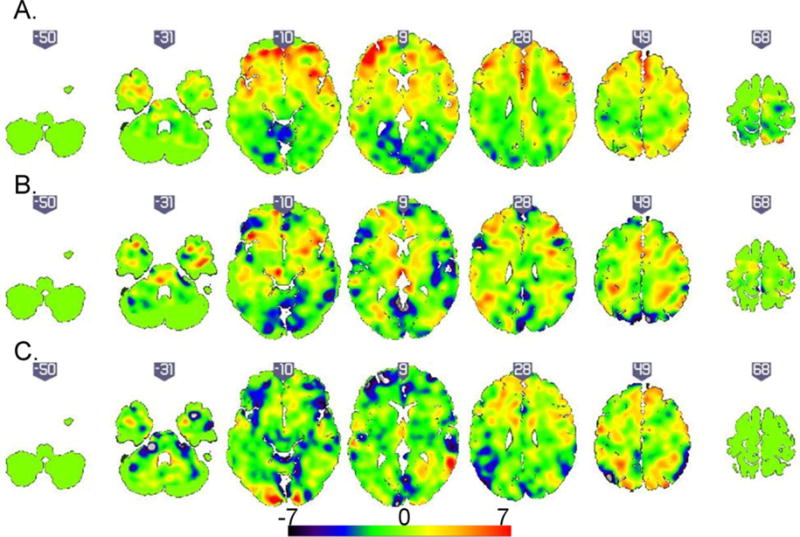
(A). Patients with Bipolar Disorder (BD) versus unrelated healthy individuals. In the corresponding discrimination map, positive coefficients (red) indicate clusters with predictive value for BD (B). Patients with BD versus relatives with Major Depressive Disorder. In the corresponding discrimination map, positive coefficients (red) indicate clusters with predictive value for BD (C). Patients with BD versus healthy relatives. In the corresponding discrimination map, positive coefficients (red) indicate clusters with predictive value for psychiatrically healthy relatives.
Patients with BD versus relatives with MDD
Significant results were found for classifiers based on contrast images from the 1-back (p=0.003), 2-back (p=0.001) and 3-back (p=0.001) conditions. The classifier based on the 1-back versus 0-back contrast resulted in 76.9% accuracy, 53.9% sensitivity (true positives for patients with BD), 100% specificity (true negatives for relatives with MDD), PPV of 1 and NPV of 0.68. The classifier based on the 2-back versus 0-back contrast resulted in 73% accuracy, 61.5% sensitivity, 84.6% specificity, 0.79 PPV and 0.68 NPV. The classifier based on the 3-back versus 0-back contrast resulted in 73.1% accuracy, 53.9% sensitivity, 94.5%specificity, 0.90 PPV and 0.67 NPV. To maintain consistency with the results of the other classification problems, the unthresholded discrimination map showing the global spatial pattern by which the two groups differ based on the 3-back versus 0-back classifier is displayed in Figure 2B; the largest discriminating clusters were located in the left superior frontal gyrus, right middle frontal gyrus, bilaterally in the middle/superior frontal gyrus and the right temporal lobe.
Patients with BD versus healthy relatives
Classifiers using the 1-back or 2-back versus 0-back contrast did not differentiate between patients with BD and healthy relatives. Classification based on the 1-back versus 0-back contrast resulted in 54.5% accuracy, 36.6% sensitivity (true positives for patients with BD) and 72.3% specificity (true negatives for healthy relatives) but the results were not significant (p=0.41). Classification based on the 2-back versus 0-back contrast resulted in 59.1% accuracy, 36.3% sensitivity and 81.2% specificity and was also not significant (p=0.17). In contrast, the classifier based on the 3-back versus 0-back contrast was significant (p=0.004) and had 81.8% accuracy, 72.7% sensitivity, 90.9% specificity (true for healthy relative), 0.88 PPV and NPV 0.76. The unthresholded discrimination map showing the global spatial pattern by which the two groups differ based on the 3-back versus 0-back classifier is displayed in Figure 2C; the largest discriminating clusters were located in the lingual gyrus and the cerebellum on the left.
For each classifier, Pearson correlation analyses between GPC predictive probabilities and age, IQ, task accuracy and reaction time, age of onset, BPRS total score and medication dose were not significant (r<0.28; p>0.14).
Discussion
We demonstrate the potential translational utility of task-based fMRI in aiding diagnosis and prognosis in BD. The approach highlighted here provides proof of concept for the development of new tools for the categorization of individuals where there is general agreement that clinical data alone are insufficient.
In this study we show that patients diagnosed with BD, show sufficient consistency in their neurofunctional patterns for them to be reliably differentiated from healthy individuals with an accuracy of 83.4%. Using structural MRI data alone, we have previously achieved classification accuracies of 69–78% in differentiating patients with BD from healthy individuals based on whole-brain gray or white matter classifiers (Rocha-Rego et al., 2014). Others who have also used structural MRI data have reported similar or lower accuracies (Schnack et al., 2014). It would therefore appear that task-based fMRI data may improve classification accuracy in BD as they may be more sensitive to disease-related pathology. Additionally, it is encouraging that the clusters that contribute to the correct classification of patients compared to controls, show biological plausibility. The conventional fMRI analysis of this same dataset, as well as results from independent samples (Cremaschi et al., 2013; Fusar-Poli et al., 2012), have consistently identified decreased prefrontal activation in patients with BD in the 3-back vs 0-back contrast compared to healthy controls. This is consistent with the clusters contributing to successful classification of patients from controls which implicate the prefrontal cortex, particularly lateral and frontopolar regions, and the dorsal parietal cortex, both key functional nodes of the working memory network (Niendam et al., 2012). Nevertheless, it could be argued that differentiating patients with established BD from healthy controls is of marginal clinical interest as real-life diagnostic assessments deal with more complex issues than separating people that have been ill for some time from those who are not ill at all (Wolfers et al., 2015). The value of testing classifiers for patients versus controls based on different imaging modalities is threefold. First, it serves to identify the type of data, or combinations of data, derived from neuroimaging applications that would be adapted for clinical practice. Once this is achieved, one could test the best-performing classifiers on different clinical groups that are prodromal or have atypical or comorbid presentations. Second, examining the relationship between the multivariate neuroimaging signature and the clinical or demographic features of a disorder can lead to mechanistic insights regarding etiology and progression. Third, the availability of objective brain imaging tests can improve the social perception of psychiatry. At the level of individual patients, objective tests would provide re-assurance that clinical assessment and diagnostic assignment are not purely based on subjective judgment. At the societal level, it would help integrate psychiatry into mainstream medicine.
To our knowledge this is the first study to employ neuroimaging to address core issues of clinical uncertainty. We provide preliminary evidence for using neuroimaging classifiers to differentiate MDD from BD, especially in individuals who have a family history of BD. There are several clinical indicators of increased likelihood of conversion to BD in those who present with depression and have a family history of the disorder (Mitchell et al., 2008; 2011). However, none can be reliably applied to individual patients. In contrast, GPC classifiers differentiated patients with BD from relatives with MDD with an accuracy ranging from 73 to 77%. The sensitivity of these classifiers were low (53–62%). This is not surprizing given the phenomenological overlap between BD and MDD and the dominance of depressive psychopathology in both disorders (Judd et al., 2002; Forty et al., 2009). What is more important however is that the classifier had very high specificity ranging from 84–100%. In principle this means that at the level of the individual patient clinicians would be able to exclude the possibility of BD, with a very high level of confidence, after a 10-min brain scan. This finding requires replication in different samples and settings and in more diverse clinical populations in terms of their age and duration of illness. Nevertheless, our results suggest that this is an avenue of research worth pursuing in demonstrating the translational value of neuroimaging.
Our third classifier, based on the 3-back versus 0-back contrast, differentiated patients with BD from their psychiatrically healthy relatives with an accuracy of 81.8%. This classifier identified high-risk individuals unlikely to convert to BD with 90.9% specificity. However, its sensitivity was 72.7% which suggest that some high-risk individual likely to convent may be missed. These results are very encouraging and could potentially inform early intervention services, where positive family history is a key criterion of risk and possible service inclusion (Duffy et al., 2015). There are a number of behavioral indicators of increased likelihood of conversion to syndromal BD but longitudinal studies suggest that they have low predictive value as a significant number of high-risk individuals never convert (Tijssen et al., 2010). Correctly identifying those who are in need of treatment is of paramount significance both in terms of cost-effectiveness of early intervention services but also in terms of preventing unnecessary treatment, concern and self-stigmatization in those unlikely to convert to BD. Of the clusters contributing to the correct identification of healthy relative, one was in the lingual gyrus, an occipital region involved in visual processing, and another in the cerebellum. Intriguingly, the lingual gyrus is closely related to cognitive function particularly with increasing age in BD (Fears et al., 2014) and shows dysfunctional connectivity during a range of tasks in patients but not their unaffected relatives (Dima et al., 2013). The volume of the cerebellum has been shown to be increased in healthy relatives of patients (Kempton et al., 2009) compared to controls while in BD patients it is known to progressively decrease (Moorhead et al., 2007). Therefore clusters contributing to the correct categorization of healthy relatives may point us to regions that are particularly important for maintaining resilience when preserved or for disease expression when abnormal.
Patients with BD differed from the other groups (MDD relatives, healthy relatives, unrelated healthy individuals) in medication status. This raises the issue of whether classification might have been based on medication rather than diagnostic status. We cannot address this issue directly but we note that correlations between medication variables and GPC predictive probabilities were low and not statistically significant. We have previously shown that medication status did not have a significant influence on classifier performance when using brain structural data to classify patients with BD from controls (Rocha-Rego et al., 2014). Patients with BD were on a variety of psychotropic agents with different mechanisms of action and it is therefore unlikely that the neural correlates of medication effects would be consistent across all participants. This mitigates the possibility that the classifiers could have identified uniform medication-related classification rules. In addition, the very low levels of psychopathology in patients suggest that it is unlikely that classification rules were derived from neural patterns associated with symptomatic expression on the day of the scan. Further investigations are, however, needed to confirm the reproducibility of our findings in more diverse and larger samples.
In summary, this is the first study to our knowledge that has tested the contribution of neuroimaging to problems that arise in the clinical care of BD for which adequate non-imaging solutions have been elusive. Although in need to replication and refinement, our data provide clear direction for the development of translational imaging applications in psychiatry.
Acknowledgments
Dr Sophia Frangou is partially supported by R01 MH104284-01A1 from National Institute of Mental Health (NIMH)
Footnotes
Publisher's Disclaimer: This is a PDF file of an unedited manuscript that has been accepted for publication. As a service to our customers we are providing this early version of the manuscript. The manuscript will undergo copyediting, typesetting, and review of the resulting proof before it is published in its final citable form. Please note that during the production process errors may be discovered which could affect the content, and all legal disclaimers that apply to the journal pertain.
Conflict of Interest
No conflict of interest.
References
- Almeida JR, Mourao-Miranda J, Aizenstein HJ, Versace A, Kozel FA, Lu H, Marquand A, LaBarbara EJ, Brammer M, Trivedi M, Kupfer DJ, Phillips ML. Pattern recognition analysis of anterior cingulate cortex blood flow to classify depression polarity. Br J Psychiatry. 2013;203(3):310–1. doi: 10.1192/bjp.bp.112.122838. [DOI] [PMC free article] [PubMed] [Google Scholar]
- American Psychiatric Association. Diagnostic and Statistical Manual of Mental Disorders. 4th. Washington, DC: American Psychiatric Association; 1994. [Google Scholar]
- Arts B, Jabben N, Krabbendam L, van Os J. Meta-analyses of cognitive functioning in euthymic bipolar patients and their first-degree relatives. Psychol Med. 2008;38(6):771–85. doi: 10.1017/S0033291707001675. [DOI] [PubMed] [Google Scholar]
- Bora E, Yucel M, Pantelis C. Cognitive endophenotypes of bipolar disorder: a meta-analysis of neuropsychological deficits in euthymic patients and their first-degree relatives. J Affect Disord. 2009;113(1–2):1–20. doi: 10.1016/j.jad.2008.06.009. [DOI] [PubMed] [Google Scholar]
- Callicott JH, Mattay VS, Bertolino A, Finn K, Coppola R, Frank JA, Goldberg TE, Weinberger DR. Physiological characteristics of capacity constraints in working memory as revealed by functional MRI. Cereb Cortex. 1999;9(1):20–6. doi: 10.1093/cercor/9.1.20. [DOI] [PubMed] [Google Scholar]
- Chen CH, Suckling J, Lennox BR, Ooi C, Bullmore ET. A quantitative meta-analysis of fMRI studies in bipolar disorder. Bipolar Disord. 2011;13(1):1–15. doi: 10.1111/j.1399-5618.2011.00893.x. [DOI] [PubMed] [Google Scholar]
- Cremaschi L, Penzo B, Palazzo M, Dobrea C, Cristoffanini M, Dell’Osso B, Altamura AC. Assessing Working Memory via N-Back Task in Euthymic Bipolar I Disorder Patients: A Review of Functional Magnetic Resonance Imaging Studies. Neuropsychobiology. 2013;68(2):63–70. doi: 10.1159/000352011. [DOI] [PubMed] [Google Scholar]
- Cusi AM, Nazarov A, Holshausen K, Macqueen GM, McKinnon MC. Systematic review of the neural basis of social cognition in patients with mood disorders. J Psychiatry Neurosci. 2012;37(3):154–69. doi: 10.1503/jpn.100179. [DOI] [PMC free article] [PubMed] [Google Scholar]
- Dima D, Jogia J, Collier D, Vassos E, Burdick KE, Frangou S. Independent Modulation of Engagement and Connectivity of the Facial Network During Affect Processing by CACNA1C and ANK3 Risk Genes for Bipolar Disorder. JAMA Psychiatry. 2013;70(12):1303–1311. doi: 10.1001/jamapsychiatry.2013.2099. [DOI] [PubMed] [Google Scholar]
- Dima D, Jogia J, Frangou S. Dynamic causal modeling of load-dependent modulation of effective connectivity within the verbal working memory network. Hum Brain Mapp. 2014;35(7):3025–35. doi: 10.1002/hbm.22382. [DOI] [PMC free article] [PubMed] [Google Scholar]
- Delvecchio G, Fossati P, Boyer P, Brambilla P, Falkai P, Gruber O, Hietala J, Lawrie SM, Martinot JL, McIntosh AM, Meisenzahl E, Frangou S. Common and distinct neural correlates of emotional processing in Bipolar Disorder and Major Depressive Disorder: a voxel-based meta-analysis of functional magnetic resonance imaging studies. Eur Neuropsychopharmacol. 2012;22(2):100–13. doi: 10.1016/j.euroneuro.2011.07.003. [DOI] [PubMed] [Google Scholar]
- Duffy A, Jones S, Goodday S, Bentall R. Candidate Risks Indicators for Bipolar Disorder: Early Intervention Opportunities in High-Risk Youth. Int J Neuropsychopharmacol. 2015 doi: 10.1093/ijnp/pyv071. [DOI] [PMC free article] [PubMed] [Google Scholar]
- El-Mallakh RS, Vöhringer PA, Ostacher MM, Baldassano CF, Holtzman NS, Whitham EA, Thommi SB, Goodwin FK, Ghaemi SN. Antidepressants worsen rapid-cycling course in bipolar depression: A STEP-BD randomized clinical trial. J Affect Disord. 2015;184:318–21. doi: 10.1016/j.jad.2015.04.054. [DOI] [PMC free article] [PubMed] [Google Scholar]
- Fears SC, Service SK, Kremeyer B, Araya C, Araya X, Bejarano J, Ramirez M, Castrillón G, Gomez-Franco J, Lopez MC, Montoya G, Montoya P, Aldana I, Teshiba TM, Abaryan Z, Al-Sharif NB, Ericson M, Jalbrzikowski M, Luykx JJ, Navarro L, Tishler TA, Altshuler L, Bartzokis G, Escobar J, Glahn DC, Ospina-Duque J, Risch N, Ruiz-Linares A, Thompson PM, Cantor RM, Lopez-Jaramillo C, Macaya G, Molina J, Reus VI, Sabatti C, Freimer NB, Bearden CE. Multisystem component phenotypes of bipolar disorder for genetic investigations of extended pedigrees. JAMA Psychiatry. 2014;71(14):375–87. doi: 10.1001/jamapsychiatry.2013.4100. [DOI] [PMC free article] [PubMed] [Google Scholar]
- First MB, Spitzer RL, Gibbon M, Williams JBW. Structured Clinical Interview for DSM-IV-TR Axis I Disorders, Patient Edition. New York Biometrics Research; New York (SCID-I/P): 2002a. Research Version. [Google Scholar]
- First MB, Spitzer RL, Gibbon M, Williams JBW. Structured Clinical Interview for DSM- IV-TR Axis I Disorders, Non-Patient Edition. New York Biometrics Research; New York (SCID-I/NP): 2002b. Research Version. [Google Scholar]
- Forty L, Jones L, Jones I, Smith DJ, Caesar S, Fraser C, Gordon-Smith K, Hyde S, Craddock N. Polarity at illness onset in bipolar I disorder and clinical course of illness. Bipolar Disord. 2009;11(1):82–8. doi: 10.1111/j.1399-5618.2008.00654.x. [DOI] [PubMed] [Google Scholar]
- Forcada I, Papachristou E, Mur M, Christodoulou T, Jogia J, Reichenberg A, Vieta E, Frangou S. The impact of general intellectual ability and white matter volume on the functional outcome of patients with Bipolar Disorder and their relatives. J Affect Disord. 2011;130(3):413–20. doi: 10.1016/j.jad.2010.10.048. [DOI] [PubMed] [Google Scholar]
- Frangou S. Risk and resilience in bipolar disorder: rationale and design of the Vulnerability to Bipolar Disorders Study (VIBES) Biochem Soc Trans. 2009;37(Pt 5):1085–9. doi: 10.1042/BST0371085. [DOI] [PubMed] [Google Scholar]
- Fullerton JM, Koller DL, Edenberg HJ, Foroud T, Liu H, Glowinski AL, McInnis MG, Wilcox HC, Frankland A, Roberts G, Schofield PR, Mitchell PB, Nurnberger JI, Bipolar High Risk Study Group, BiGS Consortium Assessment of first and second degree relatives of individuals with bipolar disorder shows increased genetic risk scores in both affected relatives and young at-risk individuals. Am J Med Genet B Neuropsychiatr Genet. 2015 doi: 10.1002/ajmg.b.32344. [DOI] [PMC free article] [PubMed] [Google Scholar]
- Fusar-Poli P, Howes O, Bechdolf A, Borgwardt S. Mapping vulnerability to bipolar disorder: a systematic review and meta-analysis of neuroimaging studies. J Psychiatry Neurosci. 2012;37(3):170–84. doi: 10.1503/jpn.110061. [DOI] [PMC free article] [PubMed] [Google Scholar]
- Glahn DC, Almasy L, Barguil M, Hare E, Peralta JM, Kent, Dassori A, Contreras J, Pacheco A, Lanzagorta N, Nicolini H, Raventós H, Escamilla MA. 2010. Neurocognitive endophenotypes for bipolar disorder identified in multiplex multigenerational families. Arch Gen Psychiatry. 2010;67(2):168–77. doi: 10.1001/archgenpsychiatry.2009.184. [DOI] [PMC free article] [PubMed] [Google Scholar]
- Grotegerd D, Suslow T, Bauer J, Ohrmann P, Arolt V, Stuhrmann A, Heindel W, Kugel H, Dannlowski U. Discriminating unipolar and bipolar depression by means of fMRI and pattern classification: a pilot study. Eur Arch Psychiatry Clin Neurosci. 2013;263(2):119–31. doi: 10.1007/s00406-012-0329-4. [DOI] [PubMed] [Google Scholar]
- Grotegerd D, Stuhrmann A, Kugel H, Schmidt S, Redlich R, Zwanzger P, Rauch AV, Heindel W, Zwitserlood P, Arolt V, Suslow T, Dannlowski U. Amygdala excitability to subliminally presented emotional faces distinguishes unipolar and bipolar depression: an fMRI and pattern classification study. Hum Brain Mapp. 2014;35(7):2995–3007. doi: 10.1002/hbm.22380. [DOI] [PMC free article] [PubMed] [Google Scholar]
- Hallahan B, Newell J, Soares JC, Brambilla P, Strakowski SM, Fleck DE, Kieseppä T, Altshuler LL, Fornito A, Malhi GS, McIntosh AM, Yurgelun-Todd DA, Labar KS, Sharma V, MacQueen GM, Murray RM, McDonald C. Structural magnetic resonance imaging in bipolar disorder: an international collaborative mega-analysis of individual adult patient data. Biol Psychiatry. 2011;69(4):326–35. doi: 10.1016/j.biopsych.2010.08.029. [DOI] [PubMed] [Google Scholar]
- Hamilton M. A rating scale for depression. J Neurol Neurosurg Psychiatry. 1960;23:56–62. doi: 10.1136/jnnp.23.1.56. [DOI] [PMC free article] [PubMed] [Google Scholar]
- Jogia J, Ruberto G, Lelli-Chiesa G, Vassos E, Maierú M, Tatarelli R, Girardi P, Collier D, Frangou S. The impact of the CACNA1C gene polymorphism on frontolimbic function in bipolar disorder. Mol Psychiatry. 2011;16(11):1070–1. doi: 10.1038/mp.2011.49. [DOI] [PubMed] [Google Scholar]
- Jogia J, Dima D, Kumari V, Frangou S. Frontopolar cortical inefficiency may underpin reward and working memory dysfunction in bipolar disorder. World J Biol Psychiatry. 2012;13(8):605–15. doi: 10.3109/15622975.2011.585662. [DOI] [PubMed] [Google Scholar]
- Jogia J, Dima D, Frangou S. Sex differences in bipolar disorder: a review of neuroimaging findings and new evidence. Bipol Disord. 2012;14(4):461–471. doi: 10.1111/j.1399-5618.2012.01014.x. [DOI] [PubMed] [Google Scholar]
- Judd LL, Akiskal HS, Schettler PJ, Endicott J, Maser J, Solomon DA, Leon AC, Rice JA, Keller MB. The long-term natural history of the weekly symptomatic status of bipolar I disorder. Arch Gen Psychiatry. 2002;59(6):530–7. doi: 10.1001/archpsyc.59.6.530. [DOI] [PubMed] [Google Scholar]
- Kempton MJ, Salvador Z, Munafò MR, Geddes JR, Simmons A, Frangou S, Williams SC. Structural neuroimaging studies in major depressive disorder. Meta-analysis and comparison with bipolar disorder. Arch Gen Psychiatry. 2011;68(7):675–90. doi: 10.1001/archgenpsychiatry.2011.60. [DOI] [PubMed] [Google Scholar]
- Kempton MJ, Haldane M, Jogia J, Grasby PM, Collier D, Frangou S. Dissociable brain structural changes associated with predisposition, resilience, and disease expression in bipolar disorder. J Neurosci. 2009;29(35):10863–8. doi: 10.1523/JNEUROSCI.2204-09.2009. [DOI] [PMC free article] [PubMed] [Google Scholar]
- Kempton MJ, Ruberto G, Vassos E, Tatarelli R, Girardi P, Collier D, Frangou S. Effects of the CACNA1C risk allele for bipolar disorder on cerebral gray matter volume in healthy individuals. Am J Psychiatry. 2009;166(12):1413–45. doi: 10.1176/appi.ajp.2009.09050680. [DOI] [PubMed] [Google Scholar]
- Lelli-Chiesa G, Kempton MJ, Jogia J, Tatarelli R, Girardi P, Powell J, Collier DA, Frangou S. The impact of the Val158Met catechol-O-methyltransferase genotype on neural correlates of sad facial affect processing in patients with bipolar disorder and their relatives. Psychol Med. 2011;41(4):779–88. doi: 10.1017/S0033291710001431. [DOI] [PubMed] [Google Scholar]
- Lindquist KA, Wager TD, Kober H, Bliss-Moreau E, Barrett LF. The brain basis of emotion: a meta-analytic review. Behav Brain Sci. 2012;35(3):121–43. doi: 10.1017/S0140525X11000446. [DOI] [PMC free article] [PubMed] [Google Scholar]
- Lukoff D, Liberman RP, Nuechterlien KH. Symptom monitoring in the rehabilitation of schizophrenic patients. Schizophr Bull. 1986;12(4):578–602. doi: 10.1093/schbul/12.4.578. [DOI] [PubMed] [Google Scholar]
- Marquand A, Howard M, Brammer M, Chu C, Coen S, Mourao-Miranda J. Quantitative prediction of subjective pain intensity from whole brain fMRI data using Gaussian processes. Neuroimage. 2010;49:2178–2189. doi: 10.1016/j.neuroimage.2009.10.072. [DOI] [PubMed] [Google Scholar]
- Mwangi B, Spiker D, Zunta-Soares GB, Soares JC. Prediction of pediatric bipolar disorder using neuroanatomical signatures of the amygdala. Bipolar Disord. 2014;16(7):713–21. doi: 10.1111/bdi.12222. [DOI] [PMC free article] [PubMed] [Google Scholar]
- Mitchell PB, Goodwin GM, Johnson GF, Hirschfeld RM. Diagnostic guidelines for bipolar depression: a probabilistic approach. Bipolar Disord. 2008;10(1 Pt 2):144–52. doi: 10.1111/j.1399-5618.2007.00559.x. [DOI] [PubMed] [Google Scholar]
- Mitchell PB, Frankland A, Hadzi-Pavlovic D, Roberts G, Corry J, Wright A, Loo CK, Breakspear M. Comparison of depressive episodes in bipolar disorder and in major depressive disorder within bipolar disorder pedigrees. Br J Psychiatry. 2011;199(4):303–9. doi: 10.1192/bjp.bp.110.088823. [DOI] [PubMed] [Google Scholar]
- Moorhead TW, McKirdy J, Sussmann JE, Hall J, Lawrie SM, Johnstone EC, McIntosh AM. Progressive gray matter loss in patients with bipolar disorder. Biol Psychiatry. 2007;62(8):894–900. doi: 10.1016/j.biopsych.2007.03.005. [DOI] [PubMed] [Google Scholar]
- Niendam TA, Laird AR, Ray KL, Dean YM, Glahn DC, Carter CS. Meta-analytic evidence for a superordinate cognitive control network subserving diverse executive functions. Cogn Affect Behav Neurosci. 2012;12(2):241–68. doi: 10.3758/s13415-011-0083-5. [DOI] [PMC free article] [PubMed] [Google Scholar]
- Owen AM, McMillan KM, Laird AR, Bullmore E. N-back working memory paradigm: a meta-analysis of normative functional neuroimaging studies. Hum Brain Mapp. 2005;25(1):46–59. doi: 10.1002/hbm.20131. [DOI] [PMC free article] [PubMed] [Google Scholar]
- Perrier E, Pompei F, Ruberto G, Vassos E, Collier D, Frangou S. Initial evidence for the role of CACNA1C on subcortical brain morphology in patients with bipolar disorder. Eur Psychiatry. 2011;26(3):135–7. doi: 10.1016/j.eurpsy.2010.10.004. [DOI] [PubMed] [Google Scholar]
- Pompei F, Dima D, Rubia K, Kumari V, Frangou S. Dissociable functional connectivity changes during the Stroop task relating to risk, resilience and disease expression in bipolar disorder. Neuroimage. 2011;57(2):576–82. doi: 10.1016/j.neuroimage.2011.04.055. [DOI] [PubMed] [Google Scholar]
- Pompei F, Jogia J, Tatarelli R, Girardi P, Rubia K, Kumari V, Frangou S. Familial and disease specific abnormalities in the neural correlates of the Stroop Task in Bipolar Disorder. Neuroimage. 2011;56(3):1677–84. doi: 10.1016/j.neuroimage.2011.02.052. [DOI] [PubMed] [Google Scholar]
- Rasmussen C, Williams CKI. Gaussian Processes for Machine Learning. Cambridge MA: The MIT Press; 2006. [Google Scholar]
- Redlich R, Almeida JJ, Grotegerd D, Opel N, Kugel H, Heindel W, Arolt V, Phillips ML, Dannlowski U. Brain morphometric biomarkers distinguishing unipolar and bipolar depression. A voxel-based morphometry-pattern classification approach. JAMA Psychiatry. 2014;71(11):1222–30. doi: 10.1001/jamapsychiatry.2014.1100. [DOI] [PMC free article] [PubMed] [Google Scholar]
- Rocha-Rego V, Jogia J, Marquand AF, Mourao-Miranda J, Simmons A, Frangou S. Examination of the predictive value of structural magnetic resonance scans in bipolar disorder: a pattern classification approach. Psychol Med. 2014;44(3):519–32. doi: 10.1017/S0033291713001013. [DOI] [PMC free article] [PubMed] [Google Scholar]
- Ruberto G, Vassos E, Lewis CM, Tatarelli R, Girardi P, Collier D, Frangou S. The cognitive impact of the ANK3 risk variant for bipolar disorder: initial evidence of selectivity to signal detection during sustained attention. PLoS One. 2011;6(1):e16671. doi: 10.1371/journal.pone.0016671. [DOI] [PMC free article] [PubMed] [Google Scholar]
- Schnack HG, Nieuwenhuis M, van Haren NE, Abramovic L, Scheewe TW, Brouwer RM, Hulshoff Pol HE, Kahn RS. Can structural MRI aid in clinical classification? A machine learning study in two independent samples of patients with schizophrenia, bipolar disorder and healthy subjects. Neuroimage. 2014;84:299–306. doi: 10.1016/j.neuroimage.2013.08.053. [DOI] [PubMed] [Google Scholar]
- Schrouff J, Rosa MJ, Rondina JM, Marquand AF, Chu C, Ashburner J, Phillips C, Richiardi J, Mourão-Miranda J. PRoNTo: pattern recognition for neuroimaging toolbox. Neuroinformatics. 2013;11(3):319–37. doi: 10.1007/s12021-013-9178-1. [DOI] [PMC free article] [PubMed] [Google Scholar]
- Takahashi T, Walterfang M, Wood SJ, Kempton MJ, Jogia J, Lorenzetti V, Soulsby B, Suzuki M, Velakoulis D, Pantelis C, Frangou S. Pituitary volume in patients with bipolar disorder and their first-degree relatives. J Affect Disord. 2010;124(3):256–61. doi: 10.1016/j.jad.2009.12.002. [DOI] [PubMed] [Google Scholar]
- Tijssen MJ, Van Os J, Wittchen HU, Lieb R, Beesdo K, Wichers M. Risk factors predicting onset and persistence of subthreshold expression of bipolar psychopathology among youth from the community. Acta Psychiatr Scand. 2010;122(3):255–66. doi: 10.1111/j.1600-0447.2010.01539.x. [DOI] [PubMed] [Google Scholar]
- Vapnik V. The Nature of Statistical Learning Theory. Springer-Verlag; New York: 1995. [Google Scholar]
- Walterfang M, Wood AG, Barton S, Velakoulis D, Chen J, Reutens DC, Kempton MJ, Haldane M, Pantelis C, Frangou S. Corpus callosum size and shape alterations in individuals with bipolar disorder and their first-degree relatives. Prog Neuropsychopharmacol Biol Psychiatry. 2009;33(6):1050–7. doi: 10.1016/j.pnpbp.2009.05.019. [DOI] [PubMed] [Google Scholar]
- Wolfers T, Buitelaar JK, Beckmann CF, Franke B, Marquand AF. From estimating activation locality to predicting disorder: A review of pattern recognition for neuroimaging-based psychiatric diagnostics. Neurosci Biobehav Rev. 2015;57:328–49. doi: 10.1016/j.neubiorev.2015.08.001. [DOI] [PubMed] [Google Scholar]
- World Health Organization. The global burden of disease: 2004 update. Geneva, Switzerland: World Health Organization; 2008. http://www.who.int/healthinfo/global_burden_disease/GBD_report_2004update_full.pdf. [Google Scholar]