Abstract
Experiments measuring contact formation between probes in disordered chains provide information on the fundamental timescales relevant to protein folding. However, their interpretation usually relies on one-dimensional (1D) diffusion models, as do many experiments probing a single distance. Here, we use all-atom molecular simulations to capture both the time-scales of contact formation, as well as the scaling with peptide length for tryptophan triplet quenching experiments, revealing the sensitivity of the experimental quenching times to the configurational space explored by the chain. We find a remarkable consistency between the results of the full calculation and from Szabo-Schulten-Schulten theory applied to a 1D diffusion model, supporting the validity of such models. The significant reduction in diffusion coefficient at the small probe separations which most influence quenching rate, suggests that contact formation and FRET correlation experiments provide complementary information on diffusivity.
Characterizing the configuration distribution and dynamics within unfolded or disordered peptides is a first step toward understanding more complex processes such as protein folding and aggregation [1]. To this end, contact quenching pump-probe experiments are a sensitive measure of dynamics in disordered peptides, which can be used to determine loop formation rates [2–5], helix-coil dynamics [6, 7] and even the folding rate of small proteins [8]. In these experiments, a probe is excited to a long-lived electronic state which can be quenched by contact with a second species distant in sequence, allowing chain dynamics to be monitored. However, as in other experiments monitoring a single intramolecular distance, interpretation of the data usually requires fairly strong assumptions about the nature of the probe-quencher distance distribution and dynamics; inclusion of additional data such as Förster resonance energy transfer (FRET) efficiencies can help to constrain the distance distributions [9].
No simplifying assumptions are needed if molecular simulations are used to compute quenching rates directly [10] and the distance dependence of the contact quenching rate is known. In previous insightful work using atomistic simulations to interpret contact quenching rates in short disordered peptides it was found that the rates obtained from simulation needed to be reduced by a factor of 2–3 to match experiment, attributed to the viscosity of the simulation water model being too low [10]. However, this assumes that all rates, including the quenching rate, are slowed by the same factor, which may not be realistic. In addition, the interpretation is complicated by the collapsed nature of the disordered ensemble, relative to estimates from FRET, SAXS or light scattering experiments [11–13]. Recent physically motivated refinements of protein force fields, have yielded more accurate equilibrium properties for disordered chains [13, 14], and should not require viscosity correction, as they use accurate water models [14, 15].
Here, we focus on a set of experiments in which the dynamics of a series of peptides of composition C(AGQ)nW-NH2 (hereafter: AGQn) was monitored from the rate at which the triplet state of the tryptophan (W) at one end of the chain was quenched by van der Waals contact with the cysteine residue (C) at the other end [3–5]. After optical excitation, the termini of the peptide will diffuse relative to each other, and may be quenched on contact. In the extreme “diffusion-limited” scenario, the quenching on contact is so fast that the observed rate of triplet quenching kobs is just the diffusion-limited rate of contact formation, kD+. In the opposite “reaction-limited” extreme, quenching is very slow and the termini must contact many times on average before a quenching event occurs, in which case the overall quenching rate depends only on the population of the contact states. The actual rate of quenching is usually somewhere between these scenarios, and so contains information on both the distance distribution and the dynamics of quenching.
In order to test the sensitivity of the experiments to the configurational sampling and dynamics, we have carried out extensive molecular dynamics simulations of a series of AGQn peptides, for n = 1 – 6, using three related force fields: the Amber ff03* protein force field [16, 17] together with the TIP3P water model [18]; the Amber ff03w protein force field [19], which is used in combination with a more accurate water model, TIP4P/2005 [15]; and the Amber ff03ws protein force field [13] which also uses TIP4P/2005 water, but with strengthened protein water interactions. Specifically, in ff03ws the values of Lennard-Jones ε for all protein-water atom pairs are scaled by a factor 1.10 relative to the standard combination rule, in order to correct the overly-collapsed nature of the disordered ensemble [13]. The simulations were run using Gromacs 4.5 or 4.6 [20] at a constant pressure of 1 bar and a constant temperature of 293 K for a total time of 2–10 µs for each peptide and force field. Initial conditions were obtained either from short temperature replica exchange simulations, or from high-temperature runs at constant volume (see electronic supplementary information (ESI) for full details).
In order to compare our results directly with experiment, we compute quenching rates using a step function for the dependence of the quenching rate q on the Trp-Cys separation rcw, that is q(rcw) = qcH(rc − rcw), where qc = 8 × 10⁸ s−1 is the constant quenching rate in contact, H(x) is the Heaviside step function and rc = 0.4 nm is the contact distance. The distance rcw is taken as the minimum distance between the sulfur in the cysteine side-chain and the heavy atoms of the tryptophan indole ring system [3, 10]. The observed quenching rate is then determined from the decay of the triplet survival probability , where the average is over equilibrium initial conditions t0, obtained by taking every saved frame of the simulation as a valid starting point.
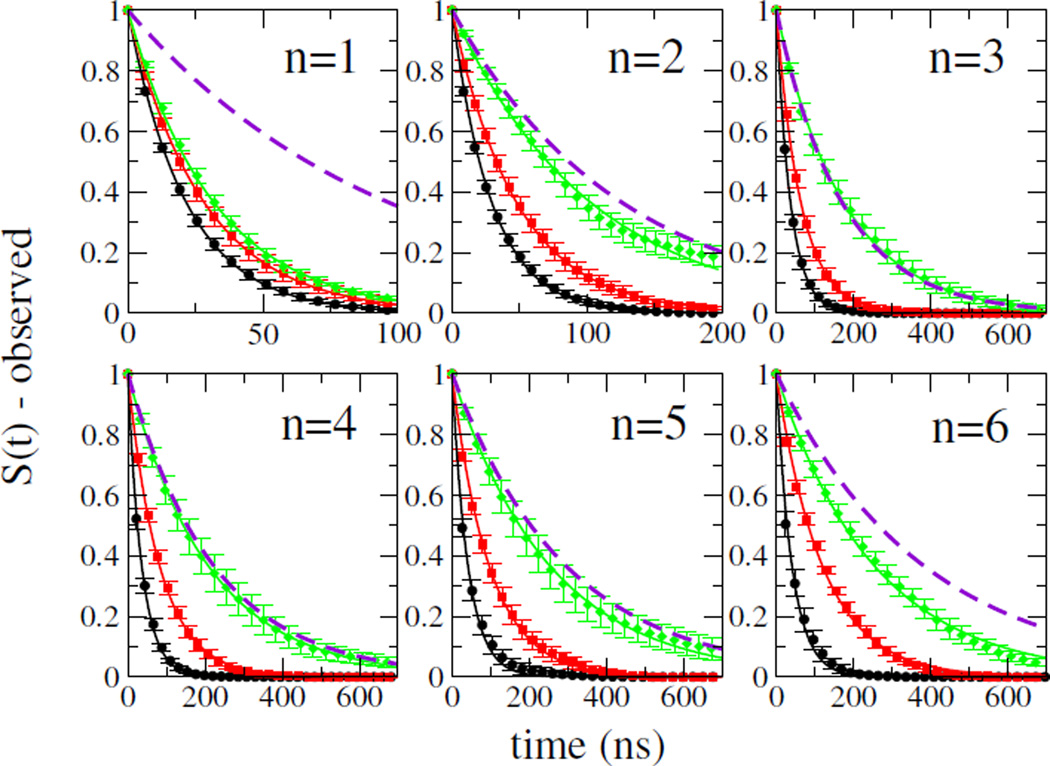
Overall decay curves for the triplet population determined using the step function form for q(rcw) are shown in Figure 1, compared with experimental decays [4]. The simulation data for Amber ff03ws is in excellent agreement with the experiment for n = 2 – 5 and reasonably close for n = 6, considering the difficulty of sampling that peptide. As expected, there are large differences amongst the force fields, with quenching rates for ff03ws being significantly slower than for those ff03* and ff03w. Part of the difference between ff03* and ff03ws is expected to be due to the ~ 3-fold lower viscosity of the TIP3P water model relative to TIP4P/2005 (the latter being very close to the true value) [10]. However, this is clearly not the only effect, since the decay for the ff03w force field, which also uses TIP4P/2005 water, is only slightly slower than that for ff03*. Therefore, the change in equilibrium conformational distribution from ff03w to ff03ws must also play a role in the observed difference.
FIG. 1.
Decays of tryptophan triplet state. Overall decays calculated from simulations with the ff03* (black), ff03w (red), and ff03ws (green) force fields are shown for peptides AGQn for n = 1–6, together with the corresponding experimental decays (broken purple lines). Symbols: simulation data; lines: single exponential fits to data.
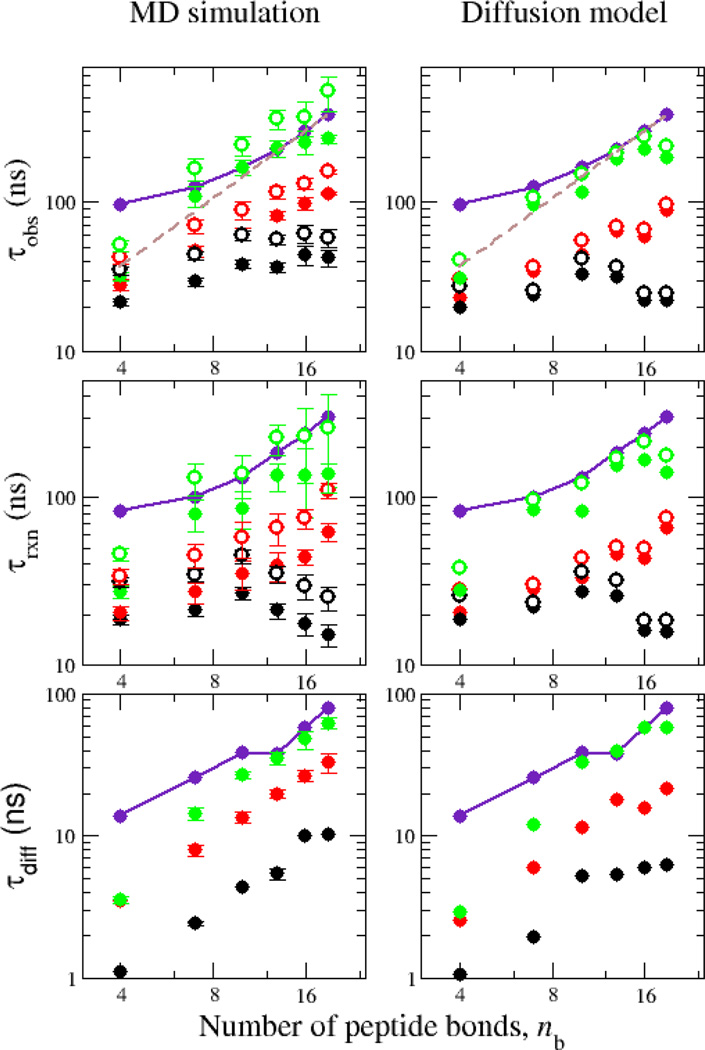
We summarize the peptide-length dependence of the observed quenching rate in Figure 2. This confirms that the observed rate is in excellent agreement with the experimental data for ff03ws, while at the opposite extreme, ff03* results in rates which are almost independent of peptide length. The ff03ws results approximately follow an dependence of the reaction-limited quenching time on the number of peptide bonds nb, as expected for a Gaussian chain [4]. The power law which best fits the data is which is also in agreement with the trend in experiment toward for longer AGQ sequences [4], as well with the fit to data for a different peptide sequence () [2]. Interestingly, these quenching rates exhibit a very different scaling compared with loop formation rates in single stranded DNA [21].
FIG. 2.
Dependence of quenching times (inverse of quenching rates) on chain length. Top, middle and bottom rows show the overall, reaction-limited and diffusion-limited quenching times, respectively. Simulation data for Amber ff03*, ff03w and ff03ws are shown by black, red and green symbols, respectively. Filled and empty symbols are for step-function and exponential distance dependence respectively. Experimental data are shown by purple symbols, and scaling expected for a Gaussian chain by the broken line. Left panels are rates calculated directly from simulation and right panels are those calculated from 1D diffusion model using SSS theory.
We can obtain more insight into the contributions to the observed relaxation rate by splitting it into diffusion-controlled and reaction-controlled parts [4], via . We determine the reaction-limited kR by integrating over the Trp-Cys distance distribution, . The diffusion limited rate can be obtained by using a step function for the survival probability S(t) and averaging over time origins t0, S(t) = 〈H(tc(t0) − t − t0)〉t0. Here, tc(t0) is the first time after t0 when the Trp and Cys contact, H(x) is again the Heaviside step function, and all time points in the simulation where the probes are not already in contact are used as separate time origins t0. This calculation (Figure 2) reveals that for all of the peptides, the observed rates are in fact closer to the reaction-limited rates, although there is a non-negligible contribution from diffusion. Interestingly, the slowdown in the diffusion-limited rate from ff03* to ff03w (by changing from TIP3P to TIP4P/2005) is very close to the 2–3 fold expected from the change of water viscosity. There is an additional slowdown in the diffusion limited rate when moving from ff03w to ff03ws, which presumably arises from the larger configurational space which must be explored due to the more expanded chain [13]. In summary, it is clear that most of the improved agreement with experiment which we obtain by using Amber ff03ws comes from the reaction-limited rate. A similar calculation using a more sophisticated distance-dependence of the quenching (Figure 2) leads to similar results.
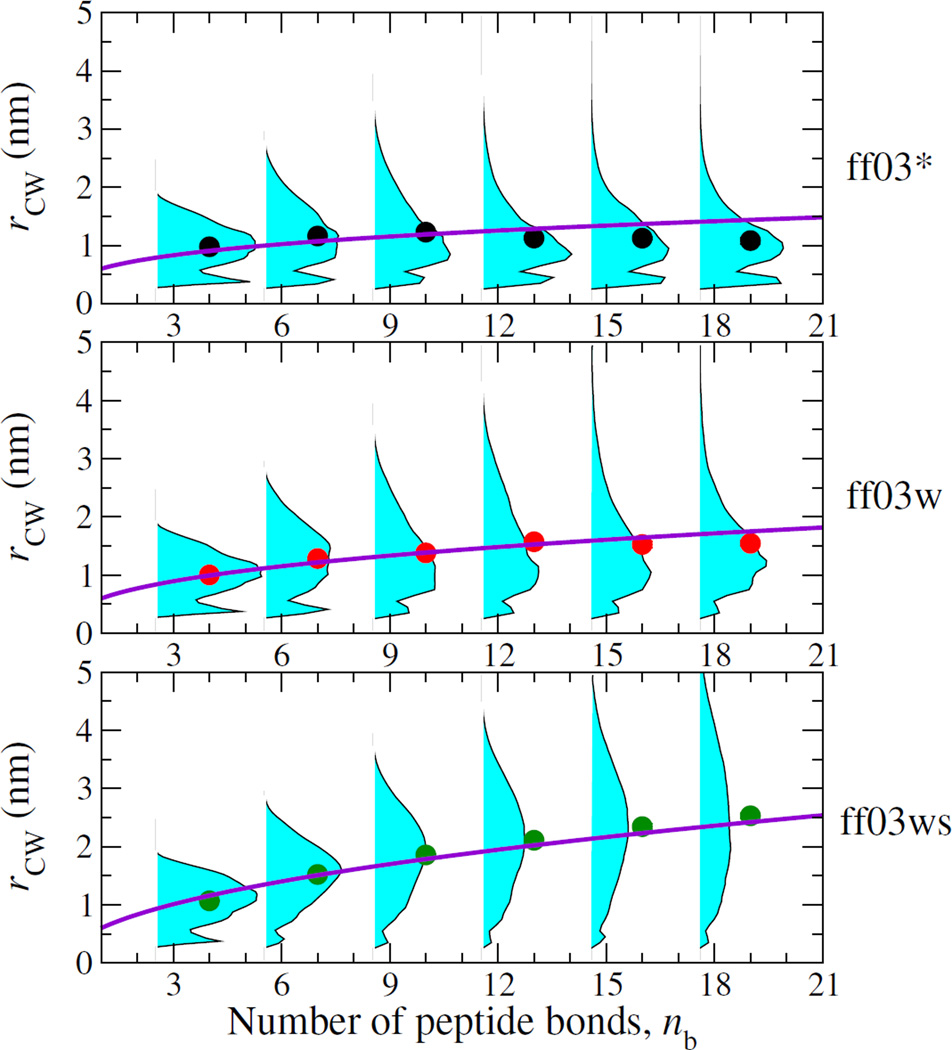
To understand the relationship between the chain dynamics and its structural properties, we characterize the equilibrium ensemble of conformations by the distribution of distances between the tryptophan and cysteine, shown in Figure 3. These reveal distinct differences amongst the different force fields, more apparent for larger numbers of AGQ repeats: the simulations with Amber ff03* and ff03w tend to be quite collapsed, while those with ff03ws are relatively expanded. Notably, for ff03* the mode of the distance distributions (cyan-shaded curves in Figure 3) and the mean Trp-Cys distances (symbols in Figure 3) hardly shift as a function of chain length n, remaining near ~ 1 nm. The only hint of expansion comes from the fitted power law curve, described below. For ff03w, weak expansion of the chain as a function of n from ~ 1 to 1.5 nm is observed. In contrast, AGQn expands with n for the ff03ws force field as expected for a chain in good solvent. We have quantified the polymer scaling properties of AGQn peptides by fitting the dependence of the mean Trp-Cys distance on the number of peptide bonds nb to a power law (similar results are obtained using the end-to-end distance), with the prefactor A fixed to 0.6 nm for all peptides. The exponents of 0.30 (0.02) and 0.36 (0.01) for ff03* and ff03w respectively are indicative of a chain in poor solvent [22], while the ff03ws exponent of 0.47 (0.01) is close to the average exponent of 0.46 (0.05) determined experimentally for unfolded and disordered proteins [23]. The trends for the reaction limited rates are consistent with the equilibrium distance distributions, with the collapsed ff03* and ff03w being very similar to one another, and relatively independent of chain length. Lastly, we note that an important distinction relative to the distributions frequently assumed in interpreting experiments [4, 5], is the existence of an additional short-range peak for the contact population in Fig. 3. The relative orientation of the Trp and Cys appears to be broad with no strongly preferred interaction modes (see ESI). The lifetime of this population is 0.4–0.9 ns for the ff03ws force field, depending on the peptide.
FIG. 3.
Distribution of Trp-Cys distance for each chain length nb for AGQn peptides, for three force fields. Symbols show the mean distance and curves are power law fits.
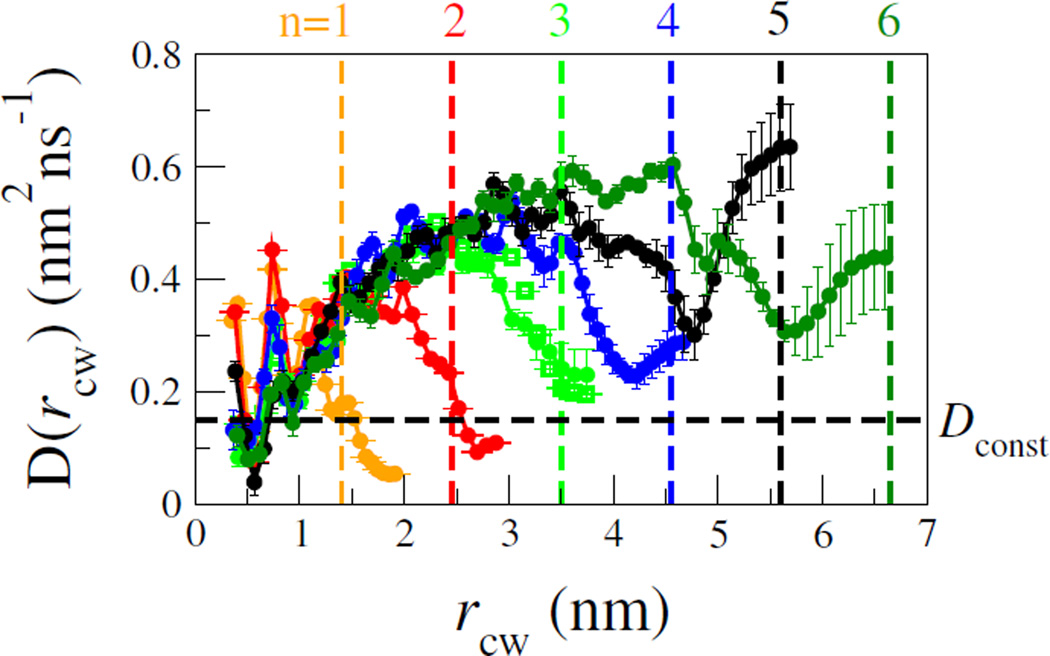
Next, we test an important approximation commonly used to analyze experimental data on contact formation, namely that the dynamics of the chain can be approximated as one-dimensional diffusion along the Trp-Cys distance coordinate. 1D diffusion models are commonly also used to interpret single molecule FRET or optical tweezer experiments also probing a single distance [24, 25]. We have fitted the distance rcw(t) from our simulations to a 1D diffusion model, using an established Bayesian approach [26–29]. Briefly, the method attempts to find the diffusive model, defined by a potential of mean force F(rcw) = −ln peq(rcw) and position-dependent diffusion coefficients D(rcw), whose propagators best match the observed history of the simulations (details in ESI). The diffusion coefficients thus obtained are shown in Figure 4 for ff03ws as a function of the number of AGQ repeats n in the peptides.
FIG. 4.
Position-dependent diffusion coefficients D(rcw), for each peptide AGQn, n = 1 – 6. Error bars calculated from division of data into 5 non-overlapping blocks. Vertical lines indicate the backbone extension for a fully extended chain. Empty symbols for n = 3 are results from a 5 nm simulation box (vs 4 nm for solid symbols). Horizontal line is constant diffusion coefficient Dconst needed to fit the data for n = 3 – 6.
The diffusion coefficients we estimate are quite comparable to those obtained for the same peptide from direct analysis of contact quenching data, ~ 0.2 nm2ns−1 [4], and from MD simulations, 0.3 – 0.9 nm2ns−1 [10] (after considering the low viscosity of the TIP3P water model used), as well as with diffusion coefficients estimated for an unfolded protein from single molecule FRET in water ~ 0.1 nm2ns−1 [24]. However, our analysis reveals a significant distance-dependence to the diffusion coefficient not included in prior work. Specifically, the diffusion coefficients vary relatively little at large separations, but strongly decrease at short probe-quencher distances, most likely due to the increased chain density at small distances, as well as hydrodynamic effects as the Trp and Cys approach each other. Remarkably, the D(rcw) curves are nearly superimposable for short and intermediate separations rcw of Trp and Cys, for all of the peptides. Each peptide deviates from this common curve only when it approaches its maximum extension (vertical broken lines in Fig. 4). This is not a finite size effect, as we obtain almost identical results for n = 3 with a larger simulation box (Fig. 4).
Although we have been able to determine a “best-fit” one-dimensional model, this does not guarantee that the dynamics of this model is faithful to that of the full simulation (projected onto the same coordinate). We checked this by using Szabo-Schulten-Schulten (SSS) theory [30] to compute rates from the diffusion model for all simulations and compare them with those computed without dynamical approximations from the simulations (details in ESI), obtaining excellent agreement (Figure 2). This self-consistency provides direct support from simulation for the adequacy of the 1D diffusion models usually used in interpreting quenching experiments.
Our position-dependent diffusion coefficients D(r) cannot be compared directly with the constant diffusion coefficients assumed in experiment, which will be a complex average over D(r). To determine a value appropriate for experimental comparison, we compute the effective constant diffusion coefficient Dconst which yields the same diffusion-limited quenching rates in SSS theory when it replaces the position dependent D(r) in the full 1D model (ESI eq. 5). For n = 1 – 2, we obtain Dconst ~ 0.3 nm2 ns−1, and for n = 3 – 6, Dconst ~ 0.15 nm2 ns−1 (the latter value in close agreement with the experimental estimate [4] of ~ 0.17 nm2 ns−1). This is also expected from the SSS expression for the rate (ESI eq. 2), as the D(r) at short separations are weighted much more, rationalizing the experimental observation that the diffusion coefficient for describing contact formation is about an order of magnitude smaller than the relative bimolecular Trp-Cys diffusion coefficient [4]. Thus, contact formation experiments provide complementary information on diffusivity to that obtained from experiments monitoring equilibrium distance fluctuations by FRET cross-correlation, which should be more sensitive to the diffusion coefficient close to the Förster radius [24]; therefore a future combination of these two experiments performed on the same polypeptide could probe the distance-dependence of the diffusion coefficient found in our calculation.
One of our central results is that 1D diffusion models can capture contact formation dynamics quite accurately, justifying their use (and SSS theory) in interpreting experiment. This is a remarkable result because there are many situations where end-end distance is not a good reaction coordinate [25, 31]. However, the simulation results suggest additional complexity beyond what could reasonably be assumed a priori when interpreting the experimental data: namely, the distance distribution functions P(rcw) include an additional contact peak at short separations, and the diffusion coefficients D(rcw) exhibit strong distance-dependence at the short separations most important for determining the diffusion-limited rate of contact formation: indeed, effective position-independent diffusion coefficients obtained by fitting SSS theory to experimental quenching rates would be almost entirely determined by the diffusion coefficients at the shortest probe-quencher separations. These results should aid in interpreting contact quenching experiments, as well as other experiments probinng a single distance coordinate, including single molecule FRET, optical tweezers, and atomic force microscopy experiments.
Supplementary Material
Acknowledgments
We thank Marco Buscaglia, Bill Eaton, Gerhard Hummer and Ben Schuler for helpful comments on the manuscript. This study was supported by the U.S. DOE Award DE-SC0013979 (J.M.) and the Intramural Research Program of the NIDDK, NIH (R.B.B.), and utilized the high-performance computational capabilities of the Biowulf Linux cluster at the NIH, Bethesda, Md. (http://biowulf.nih.gov) and XSEDE grant no. TG-MCB-120014.
Contributor Information
Gül Zerze, Department of Chemical and Biomolecular Engineering, Lehigh University, Bethlehem PA.
Jeetain Mittal, Department of Chemical and Biomolecular Engineering, Lehigh University, Bethlehem PA.
Robert B. Best, Laboratory of Chemical Physics, National Institute of Diabetes and Digestive and Kidney Diseases, National Institutes of Health, Bethesda MD 20892
References
- 1.Kubelka J, Hofrichter J, Eaton WA. Curr. Opin. Struct. Biol. 2004;14:76. doi: 10.1016/j.sbi.2004.01.013. [DOI] [PubMed] [Google Scholar]
- 2.Bieri O, Wirz J, Hellrung B, Schutkowski M, Drewello M, Kiefhaber T. Proc. Natl. Acad. Sci. U. S. A. 1999;96:9597. doi: 10.1073/pnas.96.17.9597. [DOI] [PMC free article] [PubMed] [Google Scholar]
- 3.Lapidus LJ, Eaton WA, Hofrichter J. Proc. Natl. Acad. Sci. U.S.A. 2000;97:7220. doi: 10.1073/pnas.97.13.7220. [DOI] [PMC free article] [PubMed] [Google Scholar]
- 4.Lapidus LJ, Steinbach PJ, Eaton WA, Szabo A, Hofrichter J. J. Phys. Chem. B. 2002;106:11628. [Google Scholar]
- 5.Buscaglia M, Lapidus LJ, Eaton WA, Hofrichter J. Biophys. J. 2006;91:276. doi: 10.1529/biophysj.105.071167. [DOI] [PMC free article] [PubMed] [Google Scholar]
- 6.Lapidus LJ, Eaton WA, Hofrichter J. J. Mol. Biol. 2002;319:19. doi: 10.1016/S0022-2836(02)00193-6. [DOI] [PubMed] [Google Scholar]
- 7.Fierz B, Reiner A, Kiefhaber T. Proc. Natl. Acad. Sci. U. S. A. 2009;106:1057. doi: 10.1073/pnas.0808581106. [DOI] [PMC free article] [PubMed] [Google Scholar]
- 8.Buscaglia M, Kubelka J, Eaton WA, Hofrichter J. J. Mol. Biol. 2005;347:657. doi: 10.1016/j.jmb.2005.01.057. [DOI] [PubMed] [Google Scholar]
- 9.Soranno A, Longhi R, Bellini T, Buscaglia M. Biophys. J. 2009;96:1515. doi: 10.1016/j.bpj.2008.11.014. [DOI] [PMC free article] [PubMed] [Google Scholar]
- 10.Yeh I-C, Hummer G. J. Am. Chem. Soc. 2002;124:6563. doi: 10.1021/ja025789n. [DOI] [PubMed] [Google Scholar]
- 11.Nettels D, Müller-Spath S, Küster F, Hofmann H, Haenni D, Rüegger S, Reymond L, Hoffmann A, Kubelka J, Heinz B, Gast K, Best RB, Schuler B. Proc. Natl. Acad. Sci. U.S.A. 2009;106:20740. doi: 10.1073/pnas.0900622106. [DOI] [PMC free article] [PubMed] [Google Scholar]
- 12.Piana S, Klepeis JL, Shaw DE. Curr. Opin. Struct. Biol. 2014;24:98. doi: 10.1016/j.sbi.2013.12.006. [DOI] [PubMed] [Google Scholar]
- 13.Best RB, Zheng W, Mittal J. J. Chem. Theor. Comput. 2014;10:5113. doi: 10.1021/ct500569b. [DOI] [PMC free article] [PubMed] [Google Scholar]
- 14.Piana S, Donchev AG, Robustelli P, Shaw DE. J. Phys. Chem. B. 2015;119:5113. doi: 10.1021/jp508971m. [DOI] [PubMed] [Google Scholar]
- 15.Abascal JLF, Vega C. J. Chem. Phys. 2005;123:234505. doi: 10.1063/1.2121687. [DOI] [PubMed] [Google Scholar]
- 16.Duan Y, Wu C, Chowdhury S, Lee MC, Xiong G, Zhang W, Yang R, Cieplak P, Luo R, Lee T, Caldwell J, Wang J, Kollman PA. J. Comp. Chem. 2003;24:1999. doi: 10.1002/jcc.10349. [DOI] [PubMed] [Google Scholar]
- 17.Best RB, Hummer G. J. Phys. Chem. B. 2009;113:9004. doi: 10.1021/jp901540t. [DOI] [PMC free article] [PubMed] [Google Scholar]
- 18.Jorgensen WL, Chandrasekhar J, Madura JD. J. Chem. Phys. 1983;79:926. [Google Scholar]
- 19.Best RB, Mittal J. J. Phys. Chem. B. 2010;114:14916. doi: 10.1021/jp108618d. [DOI] [PubMed] [Google Scholar]
- 20.Hess B, Kutzner C, van der Spoel D, Lindahl E. J. Chem. Theory Comput. 2008;4:435. doi: 10.1021/ct700301q. [DOI] [PubMed] [Google Scholar]
- 21.Cheng RR, Uzawa T, Plaxco KW, Makarov DE. Biophys. J. 2010;99:3959. doi: 10.1016/j.bpj.2010.11.017. [DOI] [PMC free article] [PubMed] [Google Scholar]
- 22.Mao AH, Crick SL, Vitalis A, Chicoine C, Pappu RV. Proc. Natl. Acad. Sci. U. S. A. 2010;107:8183. doi: 10.1073/pnas.0911107107. [DOI] [PMC free article] [PubMed] [Google Scholar]
- 23.Hofmann H, Soranno A, Borgia A, Gast K, Nettels D, Schuler B. Proc. Natl. Acad. Sci. U. S. A. 2012;109:16155. doi: 10.1073/pnas.1207719109. [DOI] [PMC free article] [PubMed] [Google Scholar]
- 24.Nettels D, Gopich IV, Hoffmann A, Schuler B. Proc. Natl. Acad. Sci. U. S. A. 2007;104:2655. doi: 10.1073/pnas.0611093104. [DOI] [PMC free article] [PubMed] [Google Scholar]
- 25.Dudko OK, Graham TGW, Best RB. Phys. Rev. Lett. 2011;107:208301. doi: 10.1103/PhysRevLett.107.208301. [DOI] [PubMed] [Google Scholar]
- 26.Hummer G. New J. Phys. 2005;7:34. [Google Scholar]
- 27.Best RB, Hummer G. Phys. Rev. Lett. 2006;96:228104. doi: 10.1103/PhysRevLett.96.228104. [DOI] [PubMed] [Google Scholar]
- 28.Mittal J, Truskett TM, Errington JR, Hummer G. Phys. Rev. Lett. 2008;100:145901. doi: 10.1103/PhysRevLett.100.145901. [DOI] [PubMed] [Google Scholar]
- 29.Mittal J, Hummer G. J. Chem. Phys. 2012;137:034110. doi: 10.1063/1.4732515. [DOI] [PMC free article] [PubMed] [Google Scholar]
- 30.Szabo A, Schulten K, Schulten Z. J. Chem. Phys. 1980;72:4350. [Google Scholar]
- 31.Morrison G, Hyeon C, Hinczewski M, Thirumalai D. Phys. Rev. Lett. 2011;106:138102. doi: 10.1103/PhysRevLett.106.138102. [DOI] [PMC free article] [PubMed] [Google Scholar]
- 32.See Supplemental Material [url], which includes Refs. [33–39]
- 33.Bonomi M, Parrinello M. Phys. Rev. Lett. 2010;104:190601. doi: 10.1103/PhysRevLett.104.190601. [DOI] [PubMed] [Google Scholar]
- 34.Deighan M, Bonomi M, Pfaendtner J. J. Chem. Theory Comput. 2012;8:2189. doi: 10.1021/ct300297t. [DOI] [PubMed] [Google Scholar]
- 35.Sutto L, Gervasio FL. Proc. Natl. Acad. Sci. U. S. A. 2013;110:10616. doi: 10.1073/pnas.1221953110. [DOI] [PMC free article] [PubMed] [Google Scholar]
- 36.Bussi G, Donadio D, Parrinello M. J. Chem. Phys. 2007;126:014101. doi: 10.1063/1.2408420. [DOI] [PubMed] [Google Scholar]
- 37.Darden T, York D, Pedersen L. J. Chem. Phys. 1993;98:10089. [Google Scholar]
- 38.Best RB, Hummer G. Phys. Chem. Chem. Phys. 2011;13:16902. doi: 10.1039/c1cp21541h. [DOI] [PMC free article] [PubMed] [Google Scholar]
- 39.Lapidus LJ, Eaton WA, Hofrichter J. Phys. Rev. Lett. 2001;87:258101. doi: 10.1103/PhysRevLett.87.258101. [DOI] [PubMed] [Google Scholar]
Associated Data
This section collects any data citations, data availability statements, or supplementary materials included in this article.


