

ABSTRACT
Human cells derived for in vitro cultures are conventionally grown as adherent monolayers (2D) which do not resemble natural 3 dimensional (3D) tissue architecture. We examined genome structure with chromosome conformation capture (Hi-C) and gene expression with RNA-seq in fibroblasts derived from human foreskin grown in 2D and 3D conditions. Our combined analysis of Hi-C and RNA-seq data shows a large number of differentially expressed genes between 2D and 3D cells, and these changes are localized in genomic regions that displayed structural changes. We also find a trend of expression in a subset of skin-specific genes in fibroblast cells grown in 3D that resembles those in native tissue.
keywords: Fiedler number, form, function, Gene Ontology, nucleome, topologically associating domain
Introduction
Growing mammalian cells in vitro is an indispensable technique for cell biology and biomedical research. Conventionally, human cells have been derived to grow in defined medium either in suspension or as an adherent monolayer. For examples, lymphoblastoid cells derived from human blood are grown in suspension while fibroblasts derived from human skin and many cancer cell lines are grown in monolayers. Adherent monolayer (2D) cell cultures do not resemble the natural 3 dimensional (3D) structures of body tissues, and as a result cells grown in 2D may have considerable discordances in cellular morphology, physiology, pathology, cell-cell interaction and communication compared with natural tissues.
Increasing evidence shows that in vitro 3D culture captures natural tissue complexity better than 2D cultures.1-4 Advances in 3D culture techniques open new avenues for in vitro modeling of human organ development, tissue morphogenesis, pathogenesis of diseases, cellular response to drugs or other perturbations, and screening for novel therapeutics.4,5 Modeling of organogenesis and development has been advanced by generating human micro-tissues in vitro.6 For example, human pluripotent stem cells can differentiate into midbrain-like structure in 3D cultures consisting of neurons expressing midbrain markers such as neuromelanin, and producing dopamine.7 Alzheimer disease pathology has been recapitulated in 3D neural culture, which demonstrated a more matured neuronal and glial differentiation, and increased expression of adult tau isoform protein levels in 3D culture compared with 2D culture.3 Human cell-based 3D models in pharmaceutical research can complement animal models, which often fail to predict the efficacy and toxicities of new drugs. 3D human-cell models may also provide more effective and economical screening of new drugs than the use of animal models.8,9 Furthermore, in vitro 3D modeling of native tissue provides tools for regenerative medicine. However, understanding the fundamental cell biology is critical in translating in vitro discoveries into clinical applications, e.g., functional replacement of damaged tissue.
Tissue-specific gene expression is the molecular basis of cellular function. It is not fully established how closely in vitro 3D tissue culture mimics native tissue. We hypothesize that the interplay between genome structure and function, i.e., the nucleome (https://commonfund.nih.gov/4Dnucleome/index), is the key component of tissue-specific gene expression. Genome wide chromosome conformation capture (Hi-C)10 provides a tool to study genome structure by allowing measurement of genomic regions that are physically close together in cell nuclei. Analysis of Hi-C data suggests that mammalian chromatin is partitioned into 2 compartments, corresponding to transcriptional active euchromatin and inactive heterochromatin regions.10 In addition, Hi-C analysis identified that mammalian chromosomes are organized into local chromatin interaction domains, called topologically associating domains (TADs).11 The nucleome of a cell type can be investigated by combining analysis of Hi-C with deep sequencing of RNA transcripts (RNA-seq).12 We are interested in studying how the nucleome changes between 3D- and 2D-grown cells. We previously observed chromosome conformation changes between human fibroblasts grown as spheroids vs. monolayer cultures.13 Here we extend our investigation into how genome conformation (structure) changes affect changes in genome-wide transcription (function). We focus on the nucleome of human fibroblasts grown in 3D and 2D cultures for 48 hours. We find that more than 3 thousand genes change expression levels greater than 2-fold (false discovery rate, FDR ≤ 0.05) between 2D and 3D cultures without other perturbations. Analysis of Hi-C data shows that these genes are localized in genomic regions with different spatial configuration between cells grown in 3D and 2D cultures.
Results
Differentially expressed genes between 3D and 2D cell cultures
We analyzed the expression profiles between 3D and 2D cultures with the edgeR software,14 and identified 3297 genes that changed expression levels greater than 2-fold between the 2 groups (FDR ≤ 0.05). Among these changes, 1253 genes showed increased expression levels, and 2044 genes showed decreased expression levels in the 3D group relative to the 2D samples (Fig. 1, Table S1). We identified biologic themes from the lists of up- and downregulated genes using the EASE software for gene ontology (GO) annotation.15 We used a false discovery rate (FDR) threshold ≤ 0.05 to call for significant gene set enrichment under any GO term.
Figure 1.
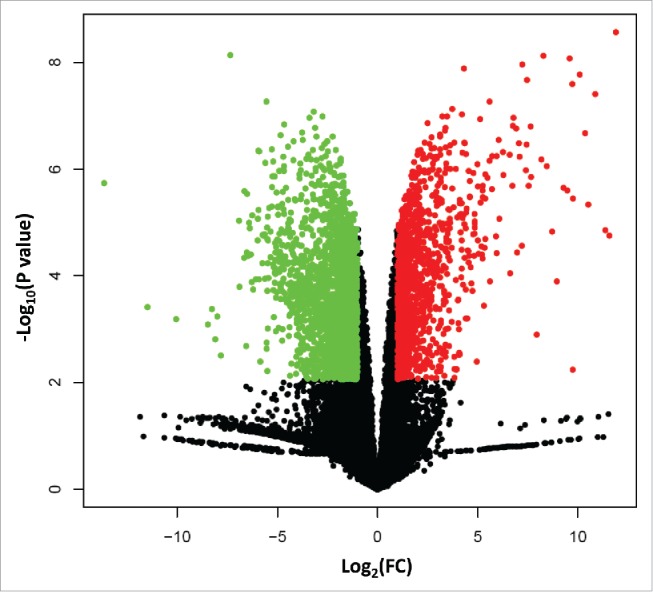
A volcano plot shows the upregulated genes (red dots) and downregulated genes (green dots) in 3D cells relative to 2D cells. The X-axis shows log base 2-fold change (log2FC), and Y-axis indicates edgeR statistics of P values in –log base 10 scales.
Among the genes with increased expression levels in the 3D samples, we identified functional gene sets that significantly clustered under 113 GO terms (Table S2). These functional gene sets are part of several important biologic processes, including those for chromosome structure/chromatin assembly; transcription or regulation of transcription; apoptosis; responses to stress, defense, inflammatory, or wound healing; responses to unfold protein or protein stimulus; signal transduction; and cytokine-cytokine receptor interaction. In addition, several gene sets are identified under GO terms in the “Cellular Component” system, including genes whose protein products are localized in cellular sub-compartments, i.e., enriched under GO terms of nucleus, chromosome, chromatin, nucleosome, and extracellular space (Table S2). The preferential cellular component localization suggests that the upregulated genes are non-randomly distributed in cellular sub-compartments. Two examples of the coordinated expression of these functionally related genes follow.
First, we looked at the 131 genes clustered under the GO term “transcription” (Table S2). For example, more than 21 genes encode DNA binding zinc finger transcription factors; 11 genes (GTF2A1, GTF2B, NR1D1, NR2C2, NR4A2, NR4A3, POLR2H, PPARA, TAF13, TAF7, TBP) encode factors involved in transcription initiation or transcription elongation from RNA polymerase II promoters; 9 genes (AHR, ARNTL, ATF4, CRY1, CREM, NPAS2, NR1D1, PPARA, RELB) encode transcription factors that are known components critical for circadian regulation of gene expression. Second, in a cluster of 111 genes under the GO term “cell differentiation” many of them are likely to be regulated by the transcription factors from the “transcription” cluster described above. The “cell differentiation” related genes were expressed at higher levels in the 3D samples relative to 2D samples (Table S2). For instance, 14 of these genes encode cytokines or growth factors and are secreted into the extracellular space; 12 genes encode for proteins participating in signaling pathways, such as the TNF, NF-kappa B signaling, and cytokine-cytokine receptor pathways, likely leading to increased activity of these pathways.
We separately performed GO annotation for the downregulated genes in 3D cells relative to 2D cells. We identified gene clusters significantly enriched under 116 GO terms (Table S3). The main biologic themes extracted from the downregulated genes include cell cycle control; cell growth regulation; and cytoskeleton organization and biogenesis. For example, we found 102 genes significantly clustered under the GO term of “cell cycle.” To name a few, genes encoding cyclins (CCNA2, CCNB1, and CCNE1) and cyclin dependent kinase 6 (CDK6) are significantly downregulated. The expression of these genes is cell cycle regulated, and promotes G1 progression, G1/S and G2/M phase transitions. As another example, we found 228 genes clustered under the GO term of “anatomic structure development” (Table S3). Among the 228 genes, for instance, there are sub-clusters encoding signal peptides (89 genes), secreted proteins (62 genes), glycoproteins (88 genes), or proteins for extracellular matrix organization (22 genes), or extracellular space (57 genes). In addition, from the list of downregulated genes we found that GO terms in the “Cellular Component” system enriched with genes whose protein products were predominantly localized outside the nucleus, and formed significant clusters for basement membrane, cytoskeleton, extracellular matrix, intracellular membrane-bound organelles, mitochondrion, and cytoplasm. These cellular sub-component distributions are different from those upregulated in 3D cells.
Validation of RNA-seq results with TaqMan assays
We tested the expression levels of 8 genes with TaqMan assays16 for validating differential gene expression between 2D and 3D cells identified from edgeR analysis. We found that all the genes tested were differentially expressed as shown in the RNA-seq result (Table 1). The log base 2 FCs between TaqMan and RNA-seq are highly correlated (r = 0.997, p = 3.467E-8). This analysis confirmed the list of differentially expressed genes identified from our RNA-seq experiment.
Table 1.
Comparison of TaqMan assay-based real-time quantitative PCR and RNA-seq analyses of 8 genes differentially expressed between 2D and 3D cells. The TaqMan P is the t test p value from TaqMan data analysis for each gene. The log base 2-fold change (log2FC) correlation coefficient between TaqMan and RNA-seq is 0.997 (P = 3.467E-8).
| Gene symbol | RNAseq_mean log2FC | TaqMan_mean log2FC | TaqMan P (Bonferroni) |
|---|---|---|---|
| ATP5O | −1.02 | −0.83 | 1.14E-02 |
| BDH2 | −2.28 | −2.80 | 2.88E-03 |
| COL5A2 | −3.58 | −4.06 | 4.12E-06 |
| DEPDC1 | −5.09 | −5.09 | 7.72E-05 |
| FKBP8 | −1.02 | −1.49 | 3.51E-04 |
| IL6 | 7.55 | 7.18 | 1.73E-05 |
| NFIL3 | 2.77 | 2.73 | 4.03E-05 |
| TFRC | 1.60 | 1.63 | 5.29E-05 |
Taken together, we show that the upregulated genes in 3D cells compared with 2D cells whose products are mostly transcription factors, growth factors, signaling proteins, or proteins involved in chromosome assembly. The downregulated genes are related to cell cycle control, cytoskeleton organization and cellular structure morphogenesis, formation of extracellular matrix, or they are signaling peptides. The coordinated expression of a large number of genes suggests that the nucleome is re-configured in 3D samples to adapt to the dense growing environment in spheroids.
Previous results suggest that 3D cultures are closer to native tissues.1-4 In our experiments we analyzed gene expression in human foreskin fibroblasts. Therefore, the nearest native tissue to compare is human skin. A recent study of gene expression profiles in human tissues by Edqvist et al. identified 106 skin-specific genes known to be involved in skin development and differentiation.17 Comparing the top 50 skin-specific genes available from this publication, we found that in both 3D and 2D samples, 17 of them were not detectable at the current sequencing depth, 30 genes were expressed at low levels (FPKM < 1) either in 3D or 2D cells, and 3 genes were called expressed. All 3 expressed genes (ASPRV1, KRT10, and SERPINB7) showed increased expression levels in 3D cells relative to 2D cells. Among the 30 low level expression genes, 20 showed higher levels in 3D cells (Table S4). This trend of higher expression of skin-specific genes in 3D cells suggests that 3D cultures are closer to native tissues.
Relationship between chromosome conformation and gene expression level changes
To gain insights into how genome structure affects gene expression patterns observed in 3D cells, we explored chromosome conformation changes from Hi-C data for the respective culturing conditions. First, we calculated the Fiedler number for each of the differentially expressed genes.12 In the context of Hi-C analysis, the magnitude of the Fiedler number is a measure of the underlying stability of the topology of the genomic region, in this case a gene with defined linear sequence coordinates. A high Fiedler number suggests a high conformational stability, i.e., few alterations between chromatin states that may be important for regulation of gene expression. We found that the Fiedler number changes in 91% of the differentially expressed genes, while for the entire genome, this number changed in 86% of the genes (). Figure S1 shows the interaction matrices for 4 sets of genes clustered under GO terms transcription (131 genes), cell differentiation (111 genes), anatomic structure development (228 genes), and cell cycle (102 genes) for the 3D and 2D samples, as well as the difference between them. These plots show that the connections within a set of related genes change between 3D and 2D growth. This, in combination with the observation that the Fiedler number of these regions changes, shows that differentially expressed genes also undergo structural changes between 3D and 2D culture.
We also wanted to explore more generally on how changes in structure are related to changes in expression. It is known that the genome is partitioned into transcriptional active or inactive regions,10 and further organized into TADs.11 We found 2,487 TADs in the 3D sample and 3,018 TADs in the 2D sample (Table S5, also see supplemental method). Three quarters of the TAD boundaries defined in the 3D samples were also present in the 2D samples. Interestingly, the TADs on chromosomes 18 were the most consistent between the samples while the TADs on chromosome 19 changed the most between 3D and 2D culture (also 3, 6, 11, and 21). It has previously been shown that chromosome 18 had increased intra-chromosomal interactions while the chromosomes whose TADs changed the most, including 19, had decreased intra-chromosomal interactions.13 Additionally, chromosome 19 has the highest gene density while chromosome 18 has the lowest, which further suggests that gene expression and chromosomal structure are tightly coupled. Fig. 2 shows the gene expression and Fiedler vectors for chromosomes 18 and 19, as well as a portion of the Hi-C matrix with the TAD boundaries overlaid and the strong interactions within the region in both 3D and 2D growth conditions. The small number of bins whose Fiedler vector flips sign in chromosome 18 compared with the large number that change in chromosome 19 indicates that the very gene poor chromosome does not change structure nearly as much as the very gene rich chromosome in 3D cells relative to 2D cells. This is consistent with the interaction plots (Fig. 2D and H) in which chromosome 19 had far fewer connections that did not change between samples than chromosome 18 (14 and 125, respectively).
Figure 2.

Differences in structure and function across chromosomes. The gene expression (top bar plot,1Mb resolution), Fiedler vector (middle bar plot, 1 Mb resolution), and a portion of the Hi-C matrix with TAD boundaries overlaid (heat map, 100 kb resolution) for chromosome 18 in (A) 2D culture, (B) 3D culture, and (C) the difference between the cultures. (D) Strong interactions within the portion of chromosome 18 shown in A-C in the 2D sample (red), 3D sample (yellow), and both samples (blue). The gene expression (1Mb resolution), Fiedler vector (1 Mb resolution), and a portion of the Hi-C matrix with TAD boundaries overlaid (100 kb resolution) for chromosome 19 in (E) for 2D culture (F) 3D culture, and (G) the difference between cultures. (H) Strong interactions within the portion of chromosome 19 shown in E-G in the 2D sample (red), 3D sample (yellow), and both samples (blue).
In summary, we present here a comprehensive comparison of both genome structure, as measured using Hi-C, and function as established by RNA-seq. Our results show massive changes between 3D and 2D cultured isogenic cells in both structure and function and we conclude that 3D cultures more faithfully recapitulate patterns observed in primary tissues.
Discussion
We report here a larger number of genes that are differentially expressed between 3D and 2D cells due to a simple change in the growth condition on a flat surface compared with spheroids. Among the 1253 genes that increase expression levels in 3D cells, gene ontology annotation shows clusters of genes significantly enriched under GO terms related to transcription, chromosome assembly, and signaling pathways. There are also 2044 downregulated genes whose protein products are primarily localized in the cytoplasm, extracellular matrix, extracellular space, and are related to cell cycle and cellular signaling. We validated a subset of 8 genes using the TaqMan method.16
Our gene expression data show increased expression of genes (e.g., CDKN1C, CCNT1, and CCNT2) inhibiting G1 progression, G1/S and G2/M transition in the cell cycle, or decreased expression of genes (e.g., CCNA2, CCNB1, CCNE1, and CDK6) promoting proliferation. This suggests the 3D cells may have reduced proliferation rates compared with 2D cells. It is currently undetermined whether cells grown in 3D are quiescent or senescent. However, the increased expression of 111 genes related to cell differentiation suggests fibroblasts grown in 3D may transition toward a more differentiated state compared with the more proliferating state in 2D. A comparison to the top 50 skin-specific genes from previously published work17 showed a trend of higher expression of skin-specific genes (23 out of 50) in 3D cells relative to 2D cells. For the remaining 27 genes, 17 were not detected in our samples, and 10 showed lower expression levels in the 3D samples. This discrepancy might be explained due to the relatively short period of tissue culture (48 h). At this early stage the 3D spheroid is immature and not even developed into skin structure. Nevertheless, the fact that more skin-specific genes show higher expression levels in the 3D samples suggests that 3D cultures might be closer to native tissues.
We also compared these changes in gene expression to changes in the structure of the genome as measured by Hi-C. We found that differentially expressed genes were significantly more likely to have changes in their structural stability, as measured by Fiedler number, than expected from a random change. Of the differentially expressed genes 71% showed decreases and 18% showed increases in Fiedler number from 2D to 3D. This indicates that the genes that change functionally, i.e., expression levels, also have corresponding changes in their chromatin organization.
In our analysis of Hi-C data to infer chromosome conformation, we use the Fiedler vector for chromatin compartment partition and TAD identification.12,18 This method performs equally well compared with other methods.10,11,19 In general, we observed TAD boundaries changing and Fiedler vector sign switching between 3D and 2D cells genome-wide. These observations suggest that chromosome conformation is reconfigured in 3D cells when 2D cells were used as the baseline. Interestingly, the most gene dense chromosome, chromosome 19, has one of the greatest changes in structure while the least gene dense chromosome, chromosome 18, has the least change in structure between 2D and 3D culture. This may be due to the fact that chromosome 19 is gene rich and transcriptionally active, therefore significant changes in structure are required for the changes in gene expression between 3D and 2D growth. Chromosome 18 is gene poor, and transcriptionally inactive, thus might not need to undergo as many structural changes.
We notice that TADs identified by our method do not exactly match those from other studies.11,19; see detailed comparison in our previous publication by Chen et al.18 However, the majority of TADs are approximately within the same genomic regions given a boundary between TADs in sizes from 40 kb to 400 kb.11 It is possible that a TAD found by another method might decompose into several TADs obtained by our method. This is not surprising, since we take into account the connectivity of Hi-C while finding TADs. To be specific, if one TAD defined by other methods does not meet our connectivity criterion (namely, greater than λ0),18 it would further split into TADs of reduced size in our approach. We feel that our method is reasonable since one can adjust the parameter λ0 to find TADs of proper size,18 and a high connectivity indicates a large modularity of a community structure in Hi-C.20
A Hi-C matrix naturally associates a graph to the genome, where nodes are defined by binned loci in the genome, and the edge weight between a pair of loci is proportional to their contact frequency. Consequently, a topological domain (or a community structure) is a compact region that can often be visually distinguished as a diagonal block in the Hi-C matrix.18 We emphasize that our proposed topological domains are strongly connected graph components having strong intra-connections and weak inter-connections, which could be sub-regions of the commonly-used TADs.
We are aware of the fact that no standard criteria are applicable to the selection of significant genes from genome-scale expression analyses. We believe that the use of FC ≥ 2 plus FDR ≤ 0.05 is a reasonable control to compensate for false positives. This may include “a lot of genes changing.” We applied this threshold with the intent to minimize not considering genes that could be truly differentially expressed even though the magnitude of FC is not high.
In summary, we find a large number of differentially expressed genes between cells grown in 3D and 2D. Genes that show significantly increased expression levels in 3D cells are responsible for the regulation of transcription, for chromatin assembly, and for the production of cytokines and growth factors. Those that are significantly decreased in 3D cells are enriched in cell cycle control, proliferation, cytoskeleton organization and cellular morphogenesis. We observed that genes that changed expression levels were co-localized in genomic regions with structural changes as seen in sign switching in the Fiedler vectors and in changing of TAD boundaries between 3D and 2D cells. In addition, our data add evidence to previous observations that 3D cultures recapitulate the environment of native tissues more faithfully than 2D cultures.
Materials and methods
Hi-C and RNA-seq data collection
We grew human foreskin fibroblasts (BJ, ATCC number CRL-2522) in 150mm dishes (2D) and in hanging drops in a 96-well PERFECTA3D plate (3D) (3D Biomatrix, Ann Arbor, MI). After 48-h of growth, we sampled the cells for Hi-C and RNA-seq analyses. Hi-C libraries were constructed from 20 million cells for each culturing condition as described by Chen et al.13 Briefly, we used the HindIII restriction enzyme (RE) for chromatin digestion. RE created DNA fragment ends were marked with biotin-dCTP (Cat# 19518–018, Life Technologies) and re-ligated. After reverse cross-linking, the DNA is fragmented for paired-end sequencing on the Illumina HiSeq2500 platform. Meanwhile, 3 biologic replicates were collected from 2D and 3D culture conditions for RNA-seq analysis as described by Chen et al..12
RNA-seq data analysis
We used Tophat21(version 2.0.9) and Bowtie22 (version 2.1.0.0) to align the RNA-seq reads to the reference transcriptome (HG19). The average number of sequence reads generated from each sample is 35.6 million, and the average read genome alignment rate is 83.51%. We generated quantification counts from RNA-seq reads for a set of 23599 unique transcripts of RefSeq definition by NCBI (https://www.ncbi.nlm.nih.gov/refseq). FKPM values (fragments per kilobase of transcript per million mapped reads) were calculated for each gene. We used an average FKPM value ≥ 1 in either the 2D or the 3D group to call a gene as expressed, which identifies a set of 13907 genes for subsequent analysis. We used the edgeR software package14 to identify differentially expressed genes between 2D and 3D cells. A gene is called differentially expressed given an absolute FC ≥ 2 with false discovery rate (FDR) ≤ 0.05. We performed functional annotation of significant genes identified using the EASE (Expression Analysis Systematic Explorer) software package.15
Validation of differentially expressed genes identified with edgeR
We performed real-time quantitative polymerase chain reaction (RT-qPCR) using the TaqMan method16 to verify a subset of differentially expressed genes. Eight TaqMan assays were purchased from Thermo Fisher (Cat # 4331182). All TaqMan assays were performed using a 2-step procedure according to the supplier's manual (Part Number 4454239 Rev. A). First, we performed single-stranded cDNA synthesis from total RNA with the SuperScript® III First-Strand Synthesis System (cat # 18080051, Thermo Fisher). Second, we performed TaqMan RT–qPCR assays according to the manufacturer's recommended conditions (ABI) on a 7900HT Fast Real-Time PCR System (ABI). We used SDS2.2.1 software (ABI) for quantification analysis in conjunction with the 2-ΔΔCt method23 using GAPDH as the reference control for normalization. The same biologic replicates for 2D and 3D RNA-seq analysis were used for TaqMan assays. The mean log base 2-fold change (log2FC) was derived from 3 TaqMan replicates for each biologic sample in each group. For significance testing, we performed 2-tailed unpaired t test and adjusted the p values using Bonferroni correction.
Hi-C analysis
Initial processing and normalization were performed as described by Chen et al.12 Genome-wide TADs were defined using the iterative methods of maximizing the Fiedler number of Hi-C matrices as described by Chen et al. (2016).18 A boundary was considered unchanged if it moved by less than 2 bins to account for uncertainty in the boundaries based on previous work that allowed variation in the boundary size.11 At gene level analysis, an adjacency matrix for a gene was generated by the method described by Chen et al. (2015), and the Fiedler number corresponding to each gene matrix was derived. The Fiedler number is a graph theory based measure of how well connected a graph is, with a more connected graph leading to a higher Fiedler number. Interaction matrices for the gene sets were extracted from the genome wide 1 Mb resolution Hi-C map by picking the rows and columns with the relevant differentially expressed genes in them. In line with Hi-C 1Mb resolution maps, RNA-seq data are combined into the corresponding 1Mb regions along a chromosome, and the gene expression level of each bin is the sum of FPKM values for all the genes in a bin. Strong Hi-C interactions are those above the 95th percentile of all interactions on that chromosome.
Supplementary Material
Disclosure of potential conflicts of interest
No potential conflicts of interest were disclosed.
Acknowledgments
We thank the University of Michigan Sequencing Core members for outstanding data generation. We thank Walter Meixner for critically reading the manuscript.
Funding
This work is supported by grants from DARPA, and the Intramural Research Program of the NIH/NCI.
References
- [1].Griffith LG, Swartz MA. Capturing complex 3D tissue physiology in vitro. Nat Rev Mol Cell Biol 2006; 7:211-24; PMID:16496023; https://doi.org/ 10.1038/nrm1858 [DOI] [PubMed] [Google Scholar]
- [2].Antoni D, Burckel H, Josset E, Noel G. Three-dimensional cell culture: a breakthrough in vivo. Int J Mol Sci 2015; 16:5517-27; PMID:25768338; https://doi.org/ 10.3390/ijms16035517 [DOI] [PMC free article] [PubMed] [Google Scholar]
- [3].Choi SH, Kim YH, Hebisch M, Sliwinski C, Lee S, D'Avanzo C, Chen H, Hooli B, Asselin C, Muffat J, et al.. A three-dimensional human neural cell culture model of Alzheimer's disease. Nature 2014; 515:274-8; PMID:25307057; https://doi.org/ 10.1038/nature13800 [DOI] [PMC free article] [PubMed] [Google Scholar]
- [4].Sasai Y. Next-generation regenerative medicine: organogenesis from stem cells in 3D culture. Cell Stem Cell 2013; 12:520-30; PMID:23642363; https://doi.org/ 10.1016/j.stem.2013.04.009 [DOI] [PubMed] [Google Scholar]
- [5].Clevers H. Modeling Development and Disease with Organoids. Cell 2016; 165:1586-97. [DOI] [PubMed] [Google Scholar]
- [6].Kretzschmar K, Clevers H. Organoids: Modeling Development and the Stem Cell Niche in a Dish. Dev Cell 2016; 38:590-600; PMID:27676432; https://doi.org/ 10.1016/j.devcel.2016.08.014 [DOI] [PubMed] [Google Scholar]
- [7].Jo J, Xiao Y, Sun AX, Cukuroglu E, Tran HD, Göke J, Tan ZY, Saw TY, Tan CP, Lokman H, et al.. Midbrain-like Organoids from Human Pluripotent Stem Cells Contain Functional Dopaminergic and Neuromelanin-Producing Neurons. Cell Stem Cell 2016; 19:248-57; PMID:27476966; https://doi.org/ 10.1016/j.stem.2016.07.005 [DOI] [PMC free article] [PubMed] [Google Scholar]
- [8].Sivaraman A, Leach JK, Townsend S, Iida T, Hogan BJ, Stolz DB, Fry R, Samson LD, Tannenbaum SR, Griffith LG. A microscale in vitro physiological model of the liver: predictive screens for drug metabolism and enzyme induction. Curr Drug Metab 2005; 6:569-91; PMID:16379670; https://doi.org/ 10.2174/138920005774832632 [DOI] [PubMed] [Google Scholar]
- [9].Weigelt B, Ghajar CM, Bissell MJ. The need for complex 3D culture models to unravel novel pathways and identify accurate biomarkers in breast cancer. Adv Drug Deliv Rev 2014; 69–70:42-51; PMID:24412474; https://doi.org/ 10.1016/j.addr.2014.01.001 [DOI] [PMC free article] [PubMed] [Google Scholar]
- [10].Lieberman-Aiden E, van Berkum NL, Williams L, Imakaev M, Ragoczy T, Telling A, Amit I, Lajoie BR, Sabo PJ, Dorschner MO, et al.. Comprehensive mapping of long-range interactions reveals folding principles of the human genome. Science 2009; 326:289-93; PMID:19815776; https://doi.org/ 10.1126/science.1181369 [DOI] [PMC free article] [PubMed] [Google Scholar]
- [11].Dixon JR, Selvaraj S, Yue F, Kim A, Li Y, Shen Y, Hu M, Liu JS, Ren B. Topological domains in mammalian genomes identified by analysis of chromatin interactions. Nature 2012; 485:376-80; PMID:22495300; https://doi.org/ 10.1038/nature11082 [DOI] [PMC free article] [PubMed] [Google Scholar]
- [12].Chen H, Chen J, Muir LA, Ronquist S, Meixner W, Ljungman M, Ried T, Smale S, Rajapakse I. Functional organization of the human 4D Nucleome. Proc Natl Acad Sci U S A 2015; 112:8002-7; PMID:26080430; https://doi.org/ 10.1073/pnas.1505822112 [DOI] [PMC free article] [PubMed] [Google Scholar]
- [13].Chen H, Comment N, Chen J, Ronquist S, Hero A, Ried T, Rajapakse I. Chromosome conformation of human fibroblasts grown in 3-dimensional spheroids. Nucleus 2015; 6:55-65; PMID:25738643; https://doi.org/ 10.1080/19491034.2014.1003745 [DOI] [PMC free article] [PubMed] [Google Scholar]
- [14].Robinson MD, McCarthy DJ, Smyth GK. edgeR: a Bioconductor package for differential expression analysis of digital gene expression data. Bioinformatics 2010; 26:139-40; PMID:19910308; https://doi.org/ 10.1093/bioinformatics/btp616 [DOI] [PMC free article] [PubMed] [Google Scholar]
- [15].Hosack DA, Dennis G, Sherman BT, Lane HC, Lempicki RA. Identifying biological themes within lists of genes with EASE. Genome Biol 2003; 4:R70; PMID:14519205; https://doi.org/ 10.1186/gb-2003-4-10-r70 [DOI] [PMC free article] [PubMed] [Google Scholar]
- [16].Holland PM, Abramson RD, Watson R, Gelfand DH. Detection of specific polymerase chain reaction product by utilizing the 5′—-3′ exonuclease activity of Thermus aquaticus DNA polymerase. Proc Natl Acad Sci U S A 1991; 88:7276-80; PMID:1871133; https://doi.org/ 10.1073/pnas.88.16.7276 [DOI] [PMC free article] [PubMed] [Google Scholar]
- [17].Edqvist PH, Fagerberg L, Hallstrom BM, Danielsson A, Edlund K, Uhlén M, Pontén F. Expression of human skin-specific genes defined by transcriptomics and antibody-based profiling. J Histochem Cytochem 2015; 63:129-41; PMID:25411189; https://doi.org/ 10.1369/0022155414562646 [DOI] [PMC free article] [PubMed] [Google Scholar]
- [18].Chen J, Hero AO 3rd, Rajapakse I. Spectral identification of topological domains. Bioinformatics 2016; 32:2151-58; PMID:27153657; https://doi.org/ 10.1093/bioinformatics/btw221 [DOI] [PMC free article] [PubMed] [Google Scholar]
- [19].Filippova D, Patro R, Duggal G, Kingsford C. Identification of alternative topological domains in chromatin. Algorithms for molecular biology : AMB 2014; 9:14; PMID:24868242; https://doi.org/ 10.1186/1748-7188-9-14 [DOI] [PMC free article] [PubMed] [Google Scholar]
- [20].Newman ME. Modularity and community structure in networks. Proc Natl Acad Sci U S A 2006; 103:8577-82; PMID:16723398; https://doi.org/ 10.1073/pnas.0601602103 [DOI] [PMC free article] [PubMed] [Google Scholar]
- [21].Trapnell C, Pachter L, Salzberg SL. TopHat: discovering splice junctions with RNA-Seq. Bioinformatics 2009; 25:1105-11; PMID:19289445; https://doi.org/ 10.1093/bioinformatics/btp120 [DOI] [PMC free article] [PubMed] [Google Scholar]
- [22].Langmead B, Trapnell C, Pop M, Salzberg SL. Ultrafast and memory-efficient alignment of short DNA sequences to the human genome. Genome Biol 2009; 10:R25; PMID:19261174; https://doi.org/ 10.1186/gb-2009-10-3-r25 [DOI] [PMC free article] [PubMed] [Google Scholar]
- [23].Livak KJ, Schmittgen TD. Analysis of relative gene expression data using real-time quantitative PCR and the 2(-Delta Delta C(T)) Method. Methods 2001; 25:402-8; PMID:11846609; https://doi.org/ 10.1006/meth.2001.1262 [DOI] [PubMed] [Google Scholar]
Associated Data
This section collects any data citations, data availability statements, or supplementary materials included in this article.