

Abstract
Interleukin-15 receptor alpha (IL15RA) is an important component of interleukin-15 (IL15) pro-inflammatory signaling. In addition, IL15 and IL15RA are present in the circulation and are detected in a variety of tissues where they influence physiological functions such as muscle contractility and overall metabolism. In the skeletal system, IL15RA was previously shown to be important for osteoclastogenesis. Little is known, however, about its role in osteoblast function and bone mineralization. In this study, we evaluated bone structural and mechanical properties of an Il15ra whole-body knockout mouse (Il15ra−/−) and used in vitro and bioinformatic analyses to understand the role IL15/IL15RA signaling on osteoblast function. We show that lack of IL15RA decreased bone mineralization in vivo and in isolated primary osteogenic cultures, suggesting a cell-autonomous effect. Il15ra−/− osteogenic cultures also had reduced Rankl/Opg mRNA ratio, indicating defective osteoblast/osteoclast coupling. We analyzed the transcriptome of primary pre-osteoblasts from normal and Il15ra−/− mice and identified 1150 genes that were differentially expressed at a FDR of 5%. Of these, 844 transcripts were upregulated and 306 were downregulated in Il15ra−/− cells. The largest functional clusters, highlighted using DAVID analysis, were related to metabolism, immune response, bone mineralization and morphogenesis. The transcriptome analysis was validated by qPCR of some of the most significant hits. Using bioinformatic approaches, we identified candidate genes, including Cd200 and Enpp1, that could contribute to the reduced mineralization. Silencing Il15ra using shRNA in the calvarial osteoblast MC3T3-E1 cell line decreased ENPP1 activity. Taken together, these data support that IL15RA plays a cell-autonomous role in osteoblast function and bone mineralization.
Keywords: Interleukin-15, interleukin-15 receptor alpha, bone mineralization, cortical bone, osteoblast, BMSC, Enpp1, Cd200, phosphate metabolism, osteoblast/osteoclast coupling
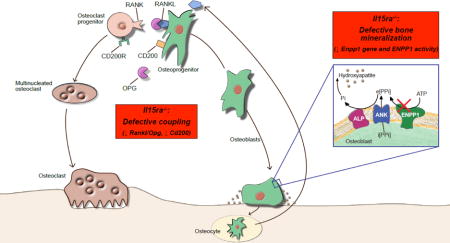
Graphical abstract
Introduction
Maintenance of bone mass requires a dynamic equilibrium between bone formation by osteoblasts and resorption by osteoclasts. Perturbation of this balance leads to conditions such as osteoporosis (decreased bone mass) or osteopetrosis (increased bone mass). Within the bone marrow, osteoblasts originate from mesenchymal progenitor cells and are responsible for deposition of newly formed bone matrix[1]. Osteoclasts, derived from the monocyte/macrophage hematopoietic lineage, adhere to and degrade bone matrix, a key function in the bone remodeling process that is needed to establish and maintain healthy bone quality[2]. Coupling between these two cell types occurs through RANKL (receptor activator of NF-kB ligand)-RANK-OPG (osteoprotegerin) signaling. The cytokine RANKL is secreted by activated osteoblasts, and by B and T-cells, and stimulates osteoclast differentiation upon binding to its receptor RANK expressed on the osteoclast’s surface. OPG acts as a decoy receptor for RANKL, therefore antagonizing RANKL binding to RANK[3]. Bone resorption by osteoclasts releases factors such as Semaphorin-4D, TGFβl, and IGF1 from the bone matrix, which in turn regulate recruitment of mesenchymal progenitor cells and osteoblast differentiation[4]. In addition to RANKL, several other cytokines such as tumor necrosis factor α (TNFα) and interleukins (IL1, IL6, IL7, IL15, IL17) regulate bone formation and maintenance and have been implicated in bone and cartilage pathologies including osteoporosis and rheumatoid arthritis[5–7].
IL15 is a widely expressed pro-inflammatory cytokine and also functions as a myokine that is secreted from muscle in response to exercise[8–12]. Elevated IL15 receptor alpha (IL15RA) levels are found in the synovial fluid of patients affected by rheumatoid arthritis and other chronic inflammatory diseases that are associated with bone loss[7,13]. IL15 was shown to participate in both activation and turnover of osteoclasts mediated by NK cells[14,15]. Absence of IL15 signaling impairs osteoclast activity and protects against trabecular bone loss in ovariectomized mice[16].
Single nucleotide polymorphisms (SNPs) of the IL15RA gene have been associated with bone volume[17] as well as susceptibility to ossification of the posterior longitudinal ligament of the spine[18]. While the effects of IL15/IL15RA signaling on osteoclast function are known, the understanding of the effects of these signals on osteoblast function and on the coupling between osteoblasts and osteoclasts remains limited.
Previously, we and others have demonstrated that ablation of Il15ra increases spontaneous locomotor activity[19,20], improves fatigue resistance and reprograms energy metabolism favoring the maintenance of a lean phenotype[21]. Given the established crosstalk between exercise, metabolism and the musculoskeletal system[22,23], we examined the effects of IL15/IL15RA signaling on bone mineralization and osteoblast function in a mouse model lacking Il15ra (Il15ra−/−). Using ex vivo bone imaging, mechanical testing and histological analysis, we evaluated bone mineralization and morphogenesis in Il15ra−/− femurs. Primary cultures of mouse osteoblast precursors from Il15ra−/− and control bones were used to test for a cell autonomous role of IL15RA in osteoblast function. Further, we combined bioinformatics approaches and transcriptome analysis to identify the mechanisms connecting IL15/IL15RA signaling to bone mineralization and phosphate homeostasis.
Methods
Animals
All animal experiments were in accordance with protocols approved by the Institutional Animal Care and Use Committee (IACUC) of the University of Pennsylvania. 11weeks old (unless differently stated) male Il15ra−/− (stock no. 003723) and background control B6129SF2/J (stock no. 101045) mice were purchased from Jackson Laboratories and housed at 22°C under a 12-hour light/12-hour dark cycle with food and water provided ad libitum. For double labeling, mice were injected intraperitoneally with 20 mg/kg Calcein 6 days before being sacrificed, and with 200 mg/kg Xylenol orange 1 day before being sacrificed.
Bone Micro-Computed Tomography (μCT) and three-point bending
μCT (microCT 35, ScancoMedical AG, Brüttisellen, Switzerland) was used to determine structural parameters of femur trabecular (1.2mm region proximal to growth plate, 6μm isotropic voxels) and cortical regions (0.3mm at 50% length, 6μm isotropic voxels), as well as tibia cortical region (1.2mm region distal to growth plate, 6μm isotropic voxels). Trabecular bone mineral density (BMD), bone volume fraction (BV/TV), trabecular thickness (Tb.Th), trabecular spacing (Tb.Sp), trabecular number (Tb.N), structure model index (SMI), connectivity density (Tb.Conn.D), degree of anisotropy (DA), bone surface (BS), cortical tissue mineral density (Ct.TMD), cortical area (Ct.Ar) and cortical bone thickness (Ct.Th) were calculated by 3D standard microstructural analysis.
For 3-point bending test, femurs were placed in a consistent orientation and continuously hydrated in phosphate-buffered saline prior to test initiation. The span between the lower supports was set to 10mm. The upper contact point was aligned at the mid-point of the lower supports. The upper actuator was ramped at a rate of 0.3 mm/sec till failure of the specimen was achieved. μCT computed tomography scans of the mid-diaphyseal region were utilized to calculate the second moment of inertia of the samples. Flexural rigidity (N/mm2), was calculated together with load at failure (N), displacement at failure (mm), and second moment of area (mm4).
Histology and histomorphometry
Right and left femurs were dissected from 11 weeks old mice, fixed in 4% formaldehyde in PBS, embedded in methylmethacrylate (MMA) or decalcified and embedded in paraffin. Five μm longitudinal unstained MMA sections were imaged with a Leica TCS SP8 MP Multiphoton Confocal Microscope to calculate the cortical and trabecular mineral apposition rate (MAR). Five μm MMA longitudinal sections were stained with Goldner’s trichrome stain to calculate Osteoblast surface/bone surface (Ob.S/BS) and Osteoblast/bone perimeter (Ob.N/BS).
For paraffin, five μm longitudinal sections were cut and stained with hematoxylin & eosin, Goldner trichromic, or with a tartrate-resistant acid phosphatase (TRAP) kit (MilliporeSigma). Images were collected using an EVOS FL Auto Cell Imaging System (LifeTechnologies) and analyzed with Fiji. Osteocyte/cortical area (Ocy/BA), Osteoclasts surface/bone surface (Oc.S/BS), Osteoclasts number (Oc.N/BS) were calculated.
Cell culture and mineralization assay
Bone marrow stromal cell cultures (BMSC) were obtained from both tibiae marrow compartments according to Soleimani and Nadri, 2009[24]. BMSC and MC3T3-E1 cells were cultured in MEM-alpha (LifeTechnologies) supplemented with 10% fetal bovine serum in a 37°C-5% CO2 incubator. Differentiation was achieved by addition to the culture medium of 10 mM β-glycerophosphate (Sigma) and 50 μg/ml ascorbic acid, with daily medium changes.
For the Alizarin red (ARS) mineralization assay after 12 days of differentiation, equally seeded monolayers in 24-well plates were washed with PBS, fixed with 4% formaldehyde and stained with 40 mM ARS for 20 minutes at room temperature with gentle rocking. Unincorporated dye was washed with an excess of dH2O, then the final wash was aspirated and the plate was left to dry for imaging. After imaging, the content of each well was solubilized with 10% (v/v) acetic acid, collected into a tube and heated at 85°C for 10 minutes. The slurry was centrifuged at 16,000g for 15 minutes, supernatants were neutralized with 0.1N sodium hydroxide and absorbance read in triplicate at 405nm with a 96-well plate reader. For every sample, at least one well of the 24-well plate was used to determine the protein content (Pierce) for normalization of the ARS signal.
Microarray Target Preparation and Hybridization
Microarray services were provided by the UPenn Molecular Profiling Facility, including quality control tests of the total RNA samples using an Agilent Bioanalyzer and Nanodrop spectrophotometry. BMSCs were differentiated for 5 days as described above and collected in Trizol for total RNA extraction. All protocols were conducted as described in the Affymetrix WT Plus Reagent Kit Manual and the Affymetrix GeneChip Expression Analysis Technical Manual. Briefly, 250ng of total RNA was converted to first-strand cDNA using reverse transcriptase primed by poly(T) and random oligomers that incorporated the T7 promoter sequence. Second-strand cDNA synthesis was followed by in vitro transcription with T7 RNA polymerase for linear amplification of each transcript, and the resulting cRNA was converted to cDNA, fragmented, assessed by Bioanalyzer, and biotinylated by terminal transferase end labeling. Five and a half micrograms of labeled cDNA were added to Affymetrix hybridization cocktails, heated at 99°C for 5 min and hybridized for 16 h at 45°C to Mouse Transcriptome 1.0 ST GeneChips (Affymetrix Inc., Santa Clara CA) using the GeneChip Hybridization oven 645. The microarrays were then washed at low (6X SSPE) and high (100mM MES, 0.1M NaCl) stringency and stained with streptavidin-phycoerythrin. Fluorescence was amplified by adding biotinylated anti-streptavidin and an additional aliquot of streptavidin-phycoerythrin stain. A GeneChip 3000 7G scanner was used to collect fluorescence signal. Affymetrix Command Console and Expression Console were used to quantitate expression levels for targeted genes; default values provided by Affymetrix were applied to all analysis parameters.
Bioinformatic analysis of microarray data
Data Analysis of differentially expressed genes was analyzed with Affymetrix® Transcriptome Analysis Console (TAC) Software at the Penn Genomic Analysis Core. Affymetrix probe intensity (.cel) files were normalized using RMA-sst (Expression Console Software, Affymetrix, Inc.). Log2-transformed transcript intensities of 65,770 transcript IDs corresponding to 39,415 unique gene symbols were imported to Partek Genomics Suite (v6.6, Partek Inc., St. Louis, MO), where Principal Components Analysis was used to visualize inter-sample variation. Significance Analysis of Microarrays (SAM, samr v2.0)[25] was used in 2-class unpaired mode to evaluate differential expression including fold-change, d-score and false discovery rate (FDR). A gene was considered significant if its fold change was >±1.5x between groups and its FDR was <= 5%. Raw cel files for each of the 12 subjects were uploaded into the GEO database with the following identifier GSE99414.
Scatterplot representation was generated using the R Bioconductor package ggplot2[26]. Heatmaps of log2-transformed data were generated with the R Bioconductor package heatmap3 using average linkage hierarchical clustering and Pearson correlation as a measure of similarity[27]. Gene Ontology analysis was performed using the online tool DAVID 6.8[28,29]. Protein-protein interaction network analysis and representation was obtained using the iRegulon and PhenomScape apps for Cytoscape v3.4.0[30]. Sequence-based detection of transcription factors, binding motifs and targets from the list of differentially expressed genes was performed using the iRegulon[31] at default settings. The identification of differentially regulated sub-networks with known disease associations was performed using the PhenomeScape app[32] for Cytoscape.
Il15ra silencing, western blotting, ENPP1 and ALP activity assay
MC3T3 cells were transfected with Il15ra shRNA vectors (OriGene) and differentiated for 5 days. Nucleoside triphosphate pyro-phosphohydrolase (NTPPPH) enzymatic activity correlates with ENPP1 activity and was assayed using the colorimetric substrate, p-nitrophenyl thymidine 5′-monophosphate (Sigma) as previously described[33]. Alkaline phosphatase (ALP) activity was assayed using p-nitrophenyl phosphate (pNPP) as substrate. To detect IL15RA protein levels, MC3T3 were lysed with RIPA buffer supplemented with protease inhibitors. After a pre-clearing step, lysates were incubated with a rat anti-IL15RA antibody (AbCam), followed by a precipitation step using magnetic beads. After SDS gel electrophoresis and western blotting, IL15RA was detected using a goat anti-IL15RA antibody (R&D clone af551) and a trueblot anti-goat secondary antibody (Rockland).
qPCR
Total RNA was extracted from cells using Trizol reagent (Life Technologies) and converted to cDNA using Superscript III (Invitrogen) and Oligo dT primers. SYBR Green qPCR was run and analyzed using a QuantStudio 3 Real-Time PCR System (Applied ByoSystems). The primers used annealed across exon-exon boundaries to ensure specific detection of mRNA transcripts over genomic DNA. The sequence of each primer is reported in Supplementary Table 1.
Statistical analysis
Data was analyzed using GraphPad Prism v5 (GraphPad Software, La Jolla, CA) and is reported as means ± SE. Two-way ANOVA with Tukey’s multiple comparisons test were used when the genotypes were compared across different age groups. Two-tailed t-test was used to compare one variable between genotypes when the distribution passed the D’Agostino & Pearson omnibus normality test, otherwise Mann-Whitney test was used. P<0.05 was considered statistically significant.
Results
Lack of IL15RA protects trabecular bone against age-related bone loss but Impairs cortical mineralization and quality
Femur length measured at different ages was comparable between genotypes (Figure 1A), consistent with body weight and lean mass measurements previously documented by our group[21]. To examine the effects of IL15RA on bone mineralization in vivo, we performed micro-CT analysis of trabecular and cortical bone from femurs of 11 and 33-week-old Il15ra−/− and control mice. In control mice, femur trabecular number, thickness, connectivity and BV/TV decreased significantly at 33 weeks compared with control animals at 11 weeks, consistent with previously published data on the effects of age on trabecular bone[34]. Il15ra−/− femur trabecular bone however, was protected from this decline (Figure 1B–D and Table 1), consistent with a previous report that ablation of IL15RA confers resistance to osteoporosis[16]. A similar protective effect against age-related trabecular bone reduction was observed in tibia from Il15ra−/− mice (Table 1).
Figure 1. Absence of IL15RA preserves trabecular bone structure but decreases cortical bone quality.
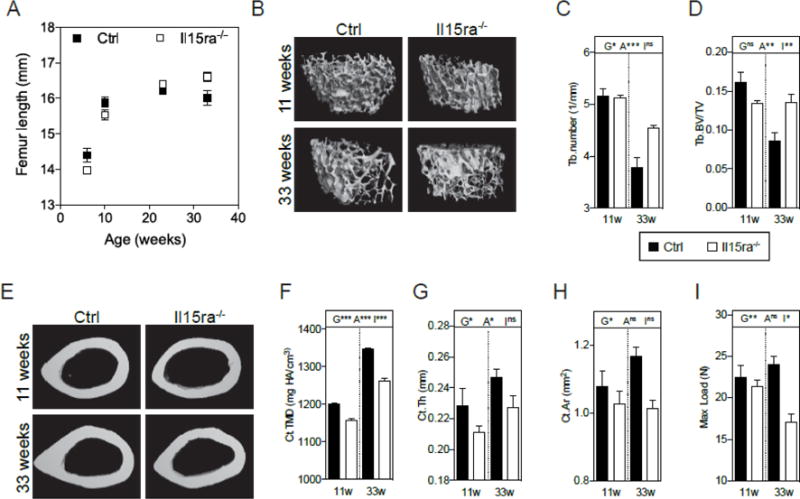
(A) Femur length at different ages (n=4–6/timepoint); (B) representative rendered microCT scans of femur trabeculae from control and Il15ra−/− mice at 11 and 33 weeks of age; trabeculae number (C) and trabecular bone volume/total volume (Tb.BV/TV) ratio (D) (n=5). (E) Representative rendered microCT scans of femur cortical bone; cortical tissue mineral density (F), thickness (G) and area (H) (n=5). (I) Maximal load as calculated with 3-points bending analysis (n=5). G: effect of genotype; A: effect of age; I: interaction between genotype and age.
Table 1.
μCT and 3-point bending test
| Ctrl | Il15ra−/− | 2-way ANOVA | |||||
|---|---|---|---|---|---|---|---|
| 11 weeks | 33 weeks | 11 weeks | 33 weeks | Genotype | Age | Interaction | |
| Femur – Trabecular | |||||||
| Tb.BV/TV | 0.161±0.012 | 0.086±0.011 | 0.134±0.004 | 0.135±0.011 | ** | ** | |
| Tb.Conn.D. (1/mm3) | 268.3±26.94 | 113.8±26.49 | 296.0±20.91 | 170.3±11.39 | * | *** | |
| SMI | 1.725±0.125 | 2.487±0.235 | 1.788±0.048 | 1.795±0.172 | * | * | * |
| Tb.N (1/mm) | 5.154±0.156 | 3.790±0.192 | 5.123±0.052 | 4.538±0.059 | * | *** | |
| Tb.Th (mm) | 0.045±0.002 | 0.043±0.002 | 0.040±0.002 | 0.044±0.001 | |||
| Tb.Sp (mm) | 0.187±0.006 | 0.257±0.015 | 0.192±0.002 | 0.210±0.004 | ** | *** | ** |
| BMD (mgHA/cm3) | 234.0±13.76 | 150.7±11.36 | 209.5±3.140 | 200.8±13.90 | ** | ** | |
| DA | 1.410±0.055 | 1.240±0.040 | 1.557±0.048 | 1.126±0.220 | * | ||
| BS (mm) | 26.42±1.232 | 12.16±1.939 | 23.11±0.666 | 16.6±1.207 | *** | ** | |
| BS/BV | 62.12±3.095 | 68.76±3.378 | 70.38±2.659 | 61.93±1.877 | * | ||
| Femur – Cortical | |||||||
| BV/TV | 0.947±0.004 | 0.9515±0.002 | 0.944±0.004 | 0.9459±0.002 | |||
| TMD (mgHA/cm3) | 1200±4.046 | 1347±3.913 | 1158±4.013 | 1263±6.792 | *** | *** | *** |
| Ct.Ar (mm2) | 1.078±0.046 | 1.166±0.028 | 1.026±0.039 | 1.015±0.022 | * | ||
| Tt.Ar (mm2) | 1.341±0.231 | 1.226±0.030 | 1.086±0.040 | 1.072±0.021 | |||
| Ct.Ar/Tt.Ar | 0.861±0.085 | 0.951±0.002 | 0.944±0.003 | 0.946±0.002 | |||
| Ct.Th (mm) | 0.228±0.011 | 0.247±0.005 | 0.211±0.004 | 0.227±0.008 | * | * | |
| Femur - 3-point bending | |||||||
| Load at failure (N) | 22.45±1.43 | 23.96±1.05 | 21.32±0.793 | 17.08±0.973 | ** | * | |
| Displacement at failure (mm) | 0.966±0.10 | 0.719±0.15 | 1.044±0.142 | 0.485±0.041 | ** | ||
| Flexural rigidity (N•mm2) | 1694±200.5 | 2232±565.3 | 1415±107.7 | 3176±335.4 | ** | ||
| Second moment of area (mm4) | 0.368±0.012 | 0.397±0.03 | 0.352±0.02 | 0.268±0.02 | ** | * | |
| Tibia – Trabecular | |||||||
| BV/TV | 0.144±0.015 | 0.114±0.014 | 0.135±0.007 | 0.148±0.011 | |||
| Connectivity (1/mm3) | 187.8±37.70 | 119.8±13.77 | 230.4±36.88 | 144.1±15.17 | * | ||
| SMI | 2.139±0.128 | 2.117±0.161 | 2.178±0.076 | 1.845±0.162 | |||
| Tb.N (1/mm) | 5.226±0.237 | 4.306±0.166 | 5.418±0.215 | 4.914±0.049 | * | ** | |
| Tb.Th (mm) | 0.045±0.001 | 0.043±0.002 | 0.043±0.002 | 0.04±0.001 | |||
| Tb.Sp (mm) | 0.188±0.011 | 0.226±0.009 | 0.184±0.008 | 0.193±0.002 | * | * | |
| BMD (mgHA/cm3) | 223.5±13.54 | 183.4±19.44 | 211.2±7.348 | 204.0±14.67 | |||
| DA | 1.891±0.021 | 1.78±0.0522 | 1.95±0.0318 | 2.017±0.126 | |||
| BS (mm) | 12.56±2.455 | 9.869±0.900 | 13.03±1.821 | 10.63±0.949 | |||
| BS/BV | 62.25±1.894 | 63.07±3.746 | 66.69±3.434 | 58.75±2.152 | |||
BV, bone volume; TV, total volume; Conn.D., Connectivity Density; SMI, structure model index; Tb, trabecular; N, number; Th, thickness; Sp, space; BMD, bone mineral density; DA, degree of anisotropy; H2, directionality coefficient of DA; BS, bone surface; BV, bone volume; TMD, tissue mineral density; Ct, cortical. Values are mean±SEM (n=5 per group).
Cortical tissue mineral density (TMD) was significantly lower in Il15ra−/− than in control femurs at both 11 and 33 weeks, increasing with age in both control and Il15ra−/− (Figure 1E, F and Table 1). Femur cortical thickness and area were also significantly lower in Il15ra−/− femurs (Figure 1G, H). Consistent with this reduced cortical bone quality, Il15ra−/− femurs required lower loads to fracture when subjected to a three-point bending test (Figure 1I and Table 1).
Lack of IL15RA alters osteoblast and osteoclast function in vivo
To study the functional consequences of the lack of IL15RA on bone mineral apposition rates (MAR), we performed in vivo double labeling with calcein and xylenol orange in 11-week-old mice. The rate of mineralization in Il15ra−/− femurs was decreased (40.0% lower for trabecular bone and 59.7% in the cortical) compared to age-matched controls (Figure 2A–C). Using Goldner trichrome staining (Figure 2D), no differences were noted in osteoblast number/bone surface (Ob.N/B.S., Figure 2E) and osteoblast surface/bone surface (Ob.S./B.S., Figure 2F) between the two genotypes. Osteocyte density was 21.4% lower in Il15ra−/− cortical bone (Figure 2G, H). To evaluate osteoclast activity, we performed TRAP staining of femurs from 11 week-old mice. Both osteoclast number and osteoclast resorption surface were significantly decreased in Il15ra−/− trabecular bone (Figure 2I–M).
Figure 2. Lack of IL15RA associates with low mineral apposition rates, decreased osteoclast and osteocyte number.
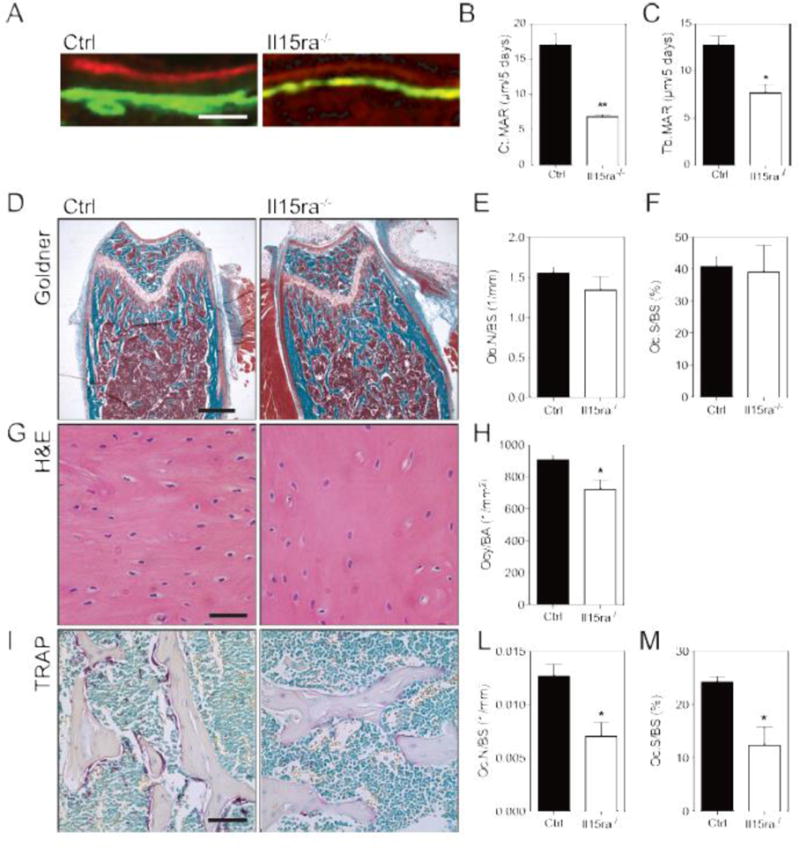
(A) Representative double labeling (scalebar 40μm) of control and il15ra−/− femurs and Mineral Apposition Rate quantification for the cortical (B) and trabecular (C) regions (n=3). (D) Goldner’s trichromic of femur trabecular bone sections (scalebar 500μm) and quantification of osteoblast per bone surface (E) and osteoclast surface per bone surface (F) (n=3). (G) Hematoxylin and eosin staining of femur cortical bone (scalebar 50μm) and quantification of osteocytes/are (H) (n = 3). (I) TRAP staining of femur trabecular bone sections (scalebar 100μm) and quantification of osteoclast per bone surface (L) and osteoclast surface per bone surface (M) (n=3).
Il15ra−/− osteoblasts produce less mineral matrix in vitro
To investigate in vitro the effects of reduced IL15RA on osteoblasts without the confounding presence of osteoclasts and other interacting cells normally present in vivo, we isolated primary osteoblast precursors (bone marrow stromal cells-BMSCs) and cultured them under osteogenic conditions. The mRNA levels of osteoblast differentiation markers such as collagen 1a (Figure 3A), osteocalcin (Figure 3B) and alkaline phosphatase (Figure 3C), were similar between control and Il15ra−/− cells at 0, 5 and 12 days of differentiation. However, after 12 days of osteogenic differentiation, mineral deposition measured by Alizarin red staining was significantly lower than in controls (Figure 3D, E). This finding supports a cell autonomous effect of lack of IL15RA on osteoblasts. To determine if lack of IL15RA also affects the regulatory crosstalk between osteoblast and osteoclasts, we measured the mRNA expression levels of Rankl and Opg. The Rankl/Opg ratio was lower in Il15ra−/− cells compared to controls (due to decreased Rankl and increased Opg mRNA levels) at both 5 (T5, Figure 3F) and 12 (T12, Figure 3G) days of differentiation, suggesting a potentially impaired feedback between osteoblast and osteoclast function.
Figure 3. Il15ra−/− osteoblasts have defective mineralization and lower rankl/opg ratio.
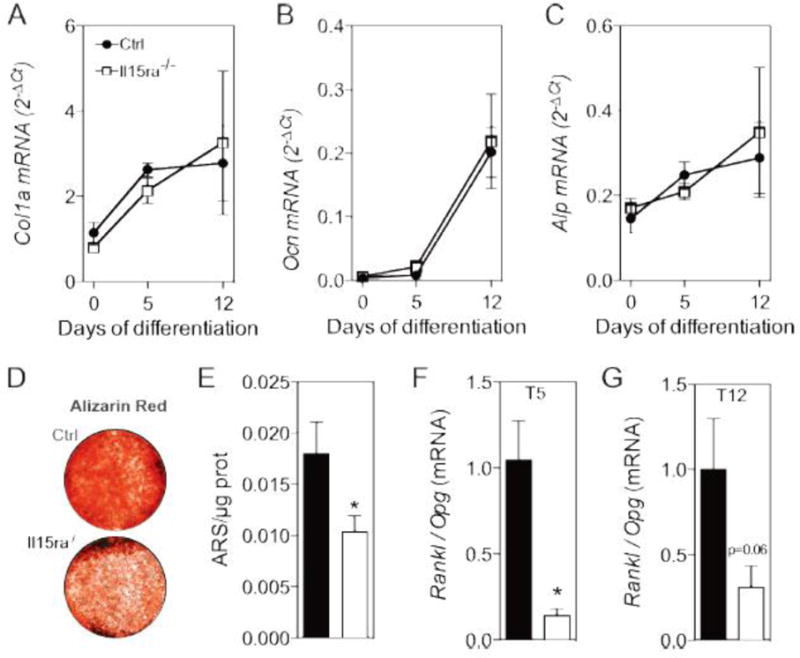
qPCR analysis of collagen 1a (A), osteocalcin (B) and alkaline phosphatase (C) at 0, 5 and 12 days of osteoblast differentiation (n = 7-5). (D) Alizarin mineralization assay and (E) quantification (n=7-5). (F,G) Rankl/Opg mRNA ratio at 5 (C) and 12 (D) days of differentiation (n = 5).
Transcriptome analysis
To determine whether the decreased mineralization capacity of Il15ra−/− osteoblasts derives from changes at the gene expression level, we conducted microarray transcriptome analysis of T5 pre-osteoblasts from control and Il15ra−/− tibiae (n=6 per group). We identified 1150 transcripts that were differentially expressed in Il15ra−/− vs control pre-osteoblasts (1.5 fold change and FDR<5% cutoff). The scattergram of the log2 expression for the detected transcripts is shown in Figure 4A. Of these, 844 were upregulated and 306 were downregulated in Il15ra−/− cells compared to controls, as shown in the heatmap in Figure 4B. Based on DAVID clustering analysis, the most represented Gene Ontology (GO) categories for the upregulated genes were related to metabolism, particularly fatty acid metabolism, and immune response. Cell cycle, retinoic acid metabolism, bone mineralization, and embryonic forelimb morphogenesis were among the top 10 GO categories enriched for the genes downregulated in Il15ra−/− (Figure 4C and Suppl Table 2). qRT-PCR of the most differentially expressed genes (Figure 4D) was used to validate the transcriptome analysis in independent biological replicates.
Figure 4. Transcriptome analysis of primary pre-osteoblasts (T5) shows downregulation of genes related to bone mineralization.
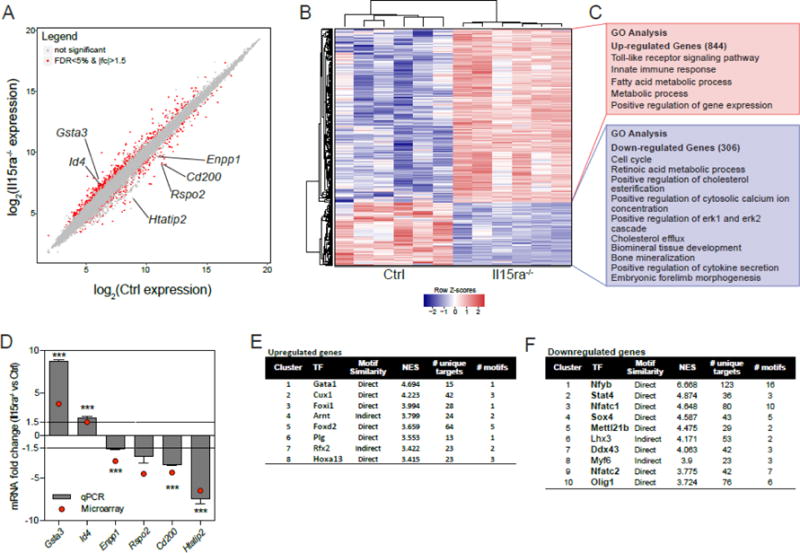
(A) Scatterplot representation of log2 expression values (FDR<5% and 1.5 fold change are shown in red). (B) Heatmap representation of differentially expressed genes (FDR<5% and 1.5 fold change), with (C) the most enriched Gene Ontology categories according to DAVID analysis. (D) qPCR validation of bone-related transcripts. Predicted transcription factors associated with upregulated (E) and downregulated (F) genes.
To predict the classes of transcription factors potentially involved in the transcriptome-level changes detected, we used the iRegulon Cytoscape app (Supplemental Table 3). The analysis of upregulated genes showed, among others, the enrichment for target motifs for the Gata family and the regulator of distal limb morphogenesis Hoxa13 [35,36] (Figure 4E), suggesting that these transcription factors may drive the differential expression. The list of transcription factor motifs associated with the downregulated genes included Nfy, Nfatc1/2 and interestingly, members of the Stat family (Figure 4F), which are known mediators of cytokine signaling.
We compared our list of differentially expressed genes with a previously published expression profile from MC3T3-E1 calvarial pre-osteoblasts 5 days following induction of osteogenic differentiation (GSE37676)[37]. Using an FDR of 5%, the two datasets shared 442 differentially expressed genes (Figure 5A). We then compared the changes in gene expression applying a 1.5X fold change cutoff (Figure 5B). This analysis highlighted 4 groups of genes, with concordant or discordant differential expression between the two datasets. Quadrant 1 (Figure 5B, C) and 4 (Figure 5B, F) contain genes that are differentially expressed during MC3T3-E1 differentiation and control pre-osteoblasts but are discordantly regulated in Il15ra−/− vs control cells. Quadrant 2 (Figure 5B, D) and 3 (Figure 5B, F) contain genes differentially expressed during osteoblast differentiation that change concordantly in Il15ra−/− and control pre-osteoblasts. Quadrant 1 included Id4 (inhibitor of differentiation, 4) (Figure 5C), a gene previously shown to be involved in osteogenic differentiation[37–39]. Quadrant 4 included Cd200, which was up-regulated in differentiating MC3T3-E1 but down in Il15ra−/− (Figure 5F). Cd200 is important for osteoblast/osteoclast coupling[40].
Figure 5. Comparison with MC3T3 gene expression after 5 days of differentiation.
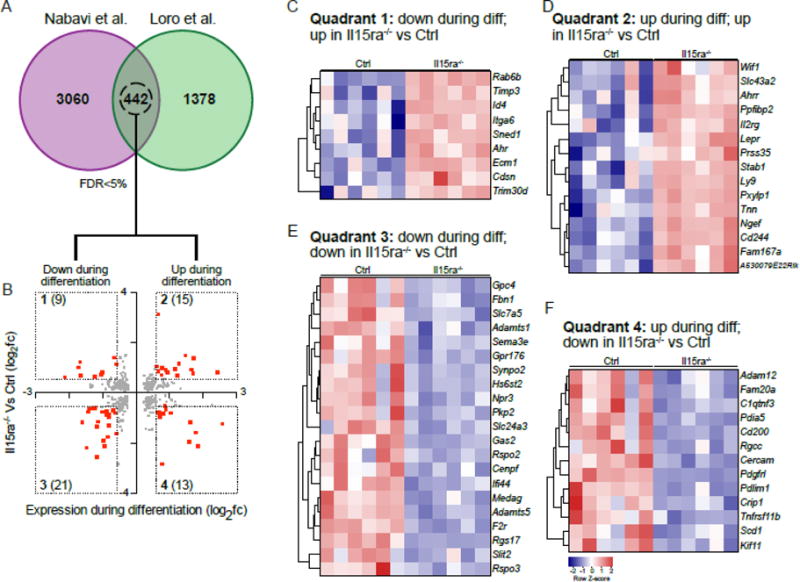
(A) Venn diagram of genes with FDR<5% in the two datasets. (B) scatterplot representation of the 442 genes shared between the two datasets, with il15ra−/− vs Ctrl log2 fold changes on the y-axis and undifferentiated Vs T5-differentiated MC3T3 log2 fold changes on x-axis. The number of differentially expressed genes with fold change >1.5 or <−1.5 (red dots) is reported within brackets. (C, D, E, F) Heatmap representations of genes contained in each quadrant.
Identification of genes and pathways associated with decreased bone mineralization
To focus on osteoblast-related genes, we applied two bioinformatics approaches to interrogate our dataset using specific bone mineralization-related terms. The first approach, performed with Ingenuity Pathway Analysis, returned a list of 19 genes related to the term “osteoblast” (5% FDR cutoff and 1.5 fold change). Of these, 12 were up-regulated in Il15ra−/− pre-osteoblasts and 7 were down-regulated (Supplemental Table 4). Among the validated osteoblast-related genes were Id4 (MTA fold change 1.54, qPCR fold change 1.99), Rspo2 (MTA f.c. −4.54, qPCR f.c. −2.51), Cd200 (MTA f.c. −4.38, qPCR f.c. −3.44) and Enpp1 (MTA f.c. −3.04, qPCR f.c. −1.6) (Figure 4A, validation in Figure 4D). Additionally, by comparing our dataset with the available literature, we identified a number osteoblast-related genes not highlighted by our bioinformatics tools, including Gpnmb (MTA f.c. 2.38)[41,42] and Msx2 (MTA f.c. 1.68)[43].
As second approach, we used the Cytoscape app PhenomeScape (5% FDR cutoff) to identify differentially regulated sub-networks within the dataset, filtering for known disease associations. We applied the PhenomeScape algorithm using keywords related to reduced bone mineralization and impaired osteoblast physiology (see Supplemental Table 5 for the complete list). Using default parameters, the algorithm returned a list of 10 sub-networks which, according to GO enrichment analysis, could be associated with the cellular processes summarized in Figure 6B. Of these, two sub-networks captured our attention. The first, associated with the GO term “Metabolic processes” (Figure 6C), included several collagen isoforms and multiple entries with moderate association with abnormal bone mineralization and osteoblast physiology. The second was related to “Nucleic acid phosphodiester bond hydrolysis” and included ENPP1 as a primary node strongly associated with abnormal bone mineralization and osteoblast physiology (Figure 6D). ENPP1 catalyses the generation of extracellular inorganic pyrophosphate (PPi, a major inhibitor of bone mineralization) in osteoblasts and chondrocytes, therefore reduced ENPP1 would lead to enhanced bone formation. However, PPi is also substrate for ALP, which hydrolyzes it to phosphate (Pi) necessary for bone mineralization. Indeed, mice lacking Enpp1 or carrying inactivating mutations, have decreased bone mineralization and unbalanced ectopic vs eutopic tissue mineralization[33,44].
Figure 6. IPA and Phenomescape analyses highlight the involvement of phosphate homeostasis and metabolic processes.
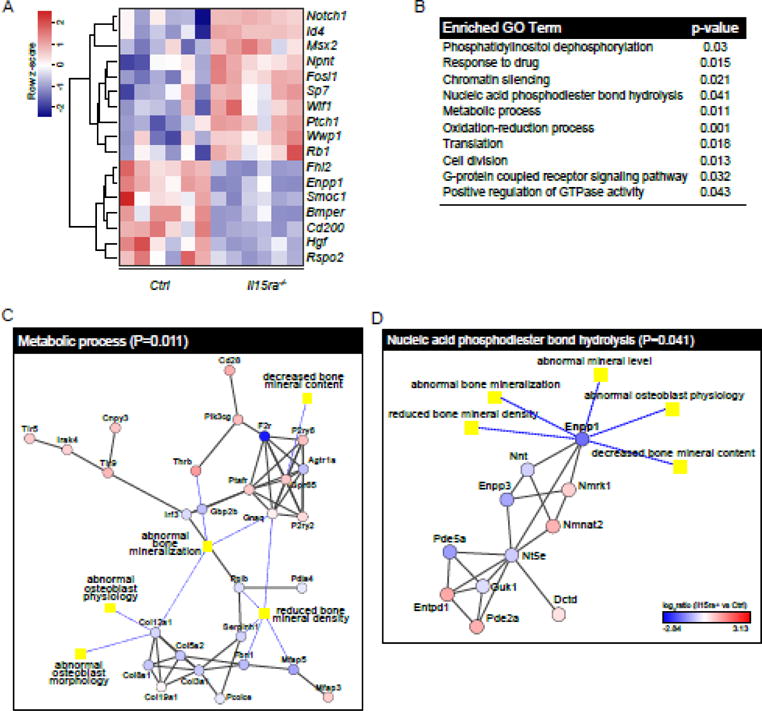
(A) Heatmap of differentially expressed osteoblast-related genes obtained with Ingenuity Pathway Analysis. (B) Enriched Gene ontology categories identified by Phenomescape. Protein-protein interaction networks of “Metabolic processes” (C) and “Nucleic acid phosphodiester bond hydrolysis” (D) from Phenomescape analysis.
Lack of IL15RA leads to decreased ENPP1 activity
To validate the functional connection between IL15RA and ENPP1 suggested by our bioinformatics analysis, we suppressed Il15ra mRNA expression in calvarial MC3T3 pre-osteoblasts using shRNA-mediated silencing and measured ENPP1 activity after 5 days of differentiation. Two independent shRNAs for Il15ra were effective in downregulating IL15RA protein levels (Figure 7A). The reduction of IL15RA did not affect ALP activity (in presence of excess pNPP substrate), but had a significant effect on NTPPPH enzyme activity (indicative of ENPP1 enzyme activity) (Figure 7B), supporting our bioinformatics data.
Figure 7. Silencing Il15ra in MC3T3 decreases ENPP1 activity.
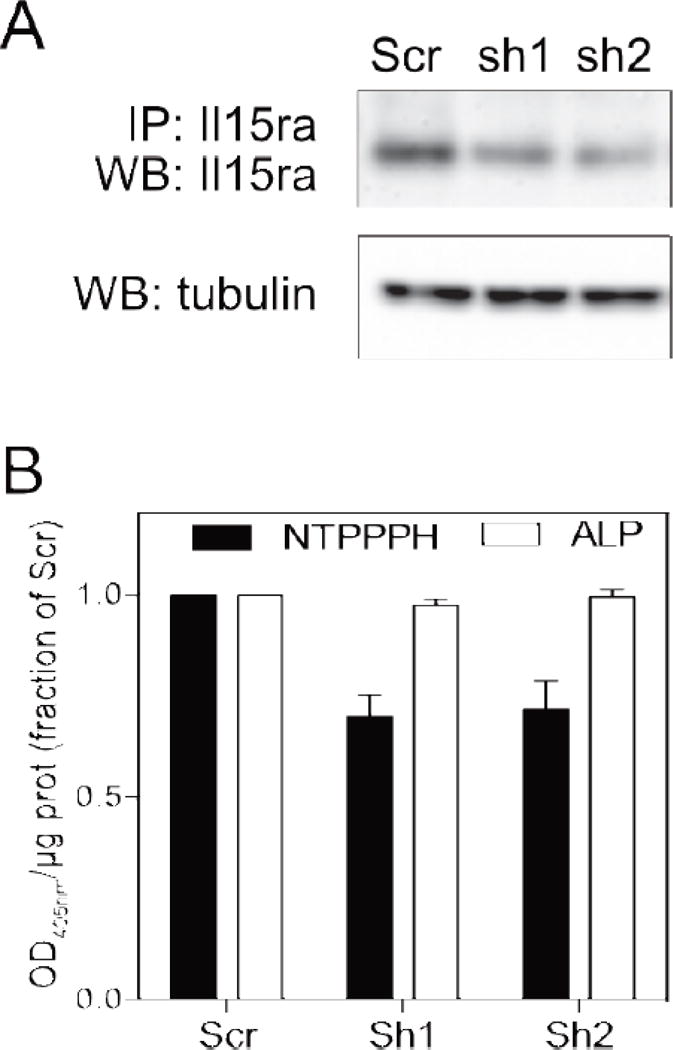
(A) IL15RA protein levels after treatment with two different Il15ra shRNAs. (B) ALP and NTPPPH activity (indicative of ENPP1 activity) following Il15ra silencing. Data are shown as fraction of the activity of scramble-transfected cells (mean±SEM of three separate experiments).
Discussion
In this study, we applied cellular and molecular approaches to study the effects of IL15/IL15RA signaling on osteoblast function and bone mineralization. We determined that Il15ra−/− cortical bone is more fragile due to impaired osteoblast mineralization capacity. Transcriptome analysis of isolated mesenchymal progenitors under osteogenic differentiation identified several genes associated with osteoblast function that are down-regulated in the absence of IL15RA, including Cd200, an important osteoblast/osteoclast coupling factor, and Enpp1, a key component of phosphate metabolism. ENPP1 activity was decreased in MC3T3 cells treated with Il15ra shRNAs, confirming this pathway interaction. Our data highlight the importance of IL15/IL15RA signaling for osteoblast function and provide novel insights into how controlled levels of pro-inflammatory factors, such as those associated with exercise activity, exert beneficial effects on bone mineralization.
IL15RA is an important component of proinflammatory signaling, but is also increasingly recognized for its involvement in multiple physiological and metabolic processes. IL15 and IL15RA levels are elevated acutely during low-grade inflammation induced by exercise[8–12], but also chronically in pathological conditions such as rheumatoid arthritis, particularly in the synovial fluid[7]. IL15 SNPs correlate with bone mineral density and cortical bone volume in humans[17,45].
In ovariectomized mice, Djaafar et al showed that lack of IL15RA protects against osteoporosis[16], mainly due to impairment of the signaling required for osteoclast activation. Given the established functional connections between osteoblast and osteoclast activities, our study investigated the less documented role of IL15RA in osteoblast regulation and therefore bone mineralization.
Our ex vivo microCT analysis showing that Il15ra−/− trabecular bone is protected from the age-related deterioration (Figure 1B–D) is most likely due to the concomitant effect of decreased osteoclast activity (Figure 2I–M) and the high remodeling rates characteristic of trabecular bone. The cortical portion, however, had a significantly lower mineral density (Figure 1F) and was weaker (Figure 1I) in Il15ra−/− mice at both 11 and 33 weeks of age. This finding is contrary to our initial hypothesis that cortical bone would adapt to the increased load deriving from the higher spontaneous locomotor activity. It also partially differs from Djaafar et al previous report in which 16 week-old female Il15ra−/− mice showed higher femur mineral density and cortical thickness than controls[16]. This difference is not surprising, given the sexual dimorphic nature of the musculoskeletal system. In addition, gender-specific differences have recently been reported in muscle-specific Il15ra−/− mice[46].
Histological examination and in vivo double labeling (Figure 2) showed that, despite being present in similar numbers as controls, Il15ra−/− osteoblasts had reduced capacity to deposit bone mineral matrix, which could have contributed to the observed lower osteocyte density (Figure 2G, H) in the mutant mice. Mineralization of the bone extracellular matrix has been shown to directly impact osteocytic differentiation[47,48].
Our results clearly indicated that lack of IL15RA alters osteoblast function. IL15RA mediates IL15 signaling via both cis- and trans-presentation mechanisms[49]. Trans-presentation from NK cells to macrophages is responsible for its effects on osteoclastogenesis[14]. However, the observed cell autonomous effects on osteoblast function suggest that IL15 may be acting in osteoblasts in cis to activate the trimeric IL15 receptor complex expressed on the same cell.
Microarray analysis of pre-osteoblasts identified a unique transcriptome of 1150 differentially expressed genes (844 up and 306 down) when comparing Il15ra−/− vs controls. The up-regulation of metabolic genes, particularly those of fatty acid oxidation, is consistent with our previous findings in muscle[21]. Interestingly, our bioinformatics analysis identified Cd200 and Enpp1 as downregulated in Il15ra−/− pre-osteoblasts compared to control cells. Cd200 is expressed in a variety of mouse and human cell types, including mouse osteoblasts[40] and is induced by pro-osteogenic or pro-inflammatory stimuli acting through the NF-kB pathway[50]. The interaction with the receptor CD200R expressed on the surface of myeloid cells triggers their differentiation into osteoclasts. Mice lacking Cd200 have decreased osteoclast activity and higher bone mass[40]. Reduction in Cd200 in the Il15ra null mice suggests that disruption of this signaling pathway adversely affects osteoblast-osteoclast coupling in addition to cell-autonomous effects on these two cell types. The Enpp1 gene encodes for a protein with ectonucleotide pyrophosphatases/phosphodiesterases (ENPP) activity, which hydrolyzes inorganic phosphate from extracellular nucleotides[51]. ENPP proteins are known to have multiple roles, such as nucleotide recycling, modulation of purinergic signaling, regulation of extracellular pyrophosphate and modulation of insulin receptor signaling[52,53]. Alterations of this gene have been associated with susceptibility to insulin resistance[54], generalized arterial calcification of infancy (IIAC)[55], ossification of the posterior longitudinal ligament of the spine (OPLL)[56], and finally Rickets type 2 (ARHR2), a condition characterized by hypophosphatemia, hyperphosphaturia, and in the most severe cases, short stature and bone deformation[57,58]. Enpp1 knockout mice have impaired bone mineralization due to abnormal phosphate metabolism[33]. Interestingly, the same IL15RA polymorphism linked to elite athlete endurance performance has been associated with susceptibility to ossification of the posterior longitudinal ligament of the spine, a recurring symptom in rickets patients[18]. Silencing Il15ra in calvarial MC3T3 cells using shRNA (Figure 7) demonstrated a cell autonomous decrease in ENPP1 enzymatic activity, offering a mechanism for the lower cortical bone mineralization seen in vivo and in vitro in Il5ra−/− mice.
In summary, our data highlight the importance of IL15RA on bone mineralization and osteoblast function. Our transcriptome analysis provided mechanistic insights into the interaction between inflammatory cytokine signaling and bone function. This study demonstrates for the first time that IL15RA is required to ensure efficient osteoblast/osteoclast coupling and plays an important role in determining osteoblast phosphate homeostasis and mineralization capacity, essential for cortical bone mineralization.
Supplementary Material
Highlights.
Lack of IL15RA decreases femur cortical mineral density and resistance to load
Il15ra−/− primary osteoblasts have defective mineralization capacity
Il15ra−/− primary pre-osteoblasts express a unique transcriptome
Osteoblast/osteoclast coupling is defective in Il15ra−/− bone due to altered Rankl/Opg and Cd200 expression.
IL15RA deficiency negatively impacts mineralization by decreasing Enpp1 levels and activity.
Acknowledgments
We thank Dr. H. Rodrigues and Dr. J. Tobias for help with processing and analysis of the microarray. We thank J. Soul (Faculty of Biology, Medicine and Health, University of Manchester, Manchester M13 9PT, UK) for assistance with PhenomeScape. We thank M.W. Hast and S. Shetye at the McKay Orthopaedic Research Laboratory for their assistance with the 3-point bending test.
We acknowledge and thank the NIH/NIAMS supported Penn Center for Musculoskeletal Disorders (P30AR050950), the Institute for Translational Medicine and Therapeutics (ITMAT) Transdisciplinary Program in Translational Medicine and Therapeutics, NIH/NIAMS R01-AR046831 (EMS), the International FOP Association (IFOPA), the Progressive Osseous Heteroplasia Association (POHA) the Center for Research in FOP and Related Disorders, the Ian Cali Endowment, the Whitney Weldon Endowment, and the Cali-Weldon Professorship of FOP Research (EMS).
Footnotes
Publisher's Disclaimer: This is a PDF file of an unedited manuscript that has been accepted for publication. As a service to our customers we are providing this early version of the manuscript. The manuscript will undergo copyediting, typesetting, and review of the resulting proof before it is published in its final citable form. Please note that during the production process errors may be discovered which could affect the content, and all legal disclaimers that apply to the journal pertain.
References
- 1.Ducy P, Schinke T, Karsenty G. The osteoblast: a sophisticated fibroblast under central surveillance. Science. 2000;289:1501–4. doi: 10.1126/science.289.5484.1501. [DOI] [PubMed] [Google Scholar]
- 2.Teitelbaum SL. Bone resorption by osteoclasts. Science. 2000;289:1504–8. doi: 10.1126/science.289.5484.1504. [DOI] [PubMed] [Google Scholar]
- 3.Liu W, Zhang X. Receptor activator of nuclear factor-κΒ ligand (RANKL)/RANK/osteoprotegerin system in bone and other tissues (review) Mol Med Rep. 2015;11:3212–8. doi: 10.3892/mmr.2015.3152. [DOI] [PubMed] [Google Scholar]
- 4.Sims NA, Martin TJ. Coupling the activities of bone formation and resorption: a multitude of signals within the basic multicellular unit. Bonekey Rep. 2014;3:481. doi: 10.1038/bonekey.2013.215. [DOI] [PMC free article] [PubMed] [Google Scholar]
- 5.Ruiz C, Pérez E, García-Martínez O, Díaz-Rodríguez L, Arroyo-Morales M, Reyes-Botella C. Expression of cytokines IL-4, IL-12, IL-15, IL-18, and IFNgamma and modulation by different growth factors in cultured human osteoblast-like cells. J Bone Miner Metab. 2007;25:286–92. doi: 10.1007/s00774-007-0767-7. [DOI] [PubMed] [Google Scholar]
- 6.Lorenzo J. Interactions between immune and bone cells: new insights with many remaining questions. J Clin Invest. 2000;106:749–52. doi: 10.1172/JCI11089. [DOI] [PMC free article] [PubMed] [Google Scholar]
- 7.Santos Savio A, Machado Diaz AC, Chico Capote A, Miranda Navarro J, Rodríguez Alvarez Y, Bringas Pérez R, Estévez del Toro M, Guillen Nieto GE. Differential expression of pro-inflammatory cytokines IL-15Ralpha, IL-15, IL-6 and TNFalpha in synovial fluid from rheumatoid arthritis patients. BMC Musculoskelet Disord. 2015;16:51. doi: 10.1186/s12891-015-0516-3. [DOI] [PMC free article] [PubMed] [Google Scholar]
- 8.Hamrick MW. The skeletal muscle secretome: an emerging player in muscle-bone crosstalk. Bonekey Rep. 2012;1:60. doi: 10.1038/bonekey.2012.60. [DOI] [PMC free article] [PubMed] [Google Scholar]
- 9.Riechman SE, Balasekaran G, Roth SM, Ferrell RE. Association of interleukin-15 protein and interleukin-15 receptor genetic variation with resistance exercise training responses. J Appl Physiol (1985) 2004;97:2214–9. doi: 10.1152/japplphysiol.00491.2004. [DOI] [PubMed] [Google Scholar]
- 10.Kim HJ, Park JY, Oh SL, Kim YA, So B, Seong JK, Song W. Effect of treadmill exercise on interleukin-15 expression and glucose tolerance in zucker diabetic Fatty rats, Diabetes. Metab J. 2013;37:358–64. doi: 10.4093/dmj.2013.37.5.358. [DOI] [PMC free article] [PubMed] [Google Scholar]
- 11.Yang H, Chang J, Chen W, Zhao L, Qu B, Tang C, Qi Y, Zhang J. Treadmill exercise promotes interleukin 15 expression in skeletal muscle and interleukin 15 receptor alpha expression in adipose tissue of high-fat diet rats. Endocrine. 2013;43:579–85. doi: 10.1007/s12020-012-9809-6. [DOI] [PubMed] [Google Scholar]
- 12.Crane JD, MacNeil LG, Lally JS, Ford RJ, Bujak AL, Brar IK, Kemp BE, Raha S, Steinberg GR, Tarnopolsky MA. Exercise-stimulated interleukin-15 is controlled by AMPK and regulates skin metabolism and aging. Aging Cell. 2015 doi: 10.1111/acel.12341. [DOI] [PMC free article] [PubMed] [Google Scholar]
- 13.Ferrari-Lacraz S, Zanelli E, Neuberg M, Donskoy E, Kim YS, Zheng XX, Hancock WW, Maslinski W, Li XC, Strom TB, Moll T. Targeting IL-15 receptor-bearing cells with an antagonist mutant IL-15/Fc protein prevents disease development and progression in murine collagen-induced arthritis. J Immunol. 2004;173:5818–26. doi: 10.4049/jimmunol.173.9.5818. [DOI] [PubMed] [Google Scholar]
- 14.Söderström K, Stein E, Colmenero P, Purath U, Müller-Ladner U, de Matos CT, Tarner IH, Robinson WH, Engleman EG. Natural killer cells trigger osteoclastogenesis and bone destruction in arthritis. Proc Natl Acad Sci U S A. 2010;107:13028–33. doi: 10.1073/pnas.1000546107. [DOI] [PMC free article] [PubMed] [Google Scholar]
- 15.Feng S, Madsen SH, Viller NN, Neutzsky-Wulff AV, Geisler C, Karlsson L, Söderström K. Interleukin-15-activated natural killer cells kill autologous osteoclasts via LFA-1, DNAM-1 and TRAIL, and inhibit osteoclast-mediated bone erosion in vitro. Immunology. 2015;145:367–79. doi: 10.1111/imm.12449. [DOI] [PMC free article] [PubMed] [Google Scholar]
- 16.Djaafar S, Pierroz DD, Chicheportiche R, Zheng XX, Ferrari SL, Ferrari-Lacraz S. Inhibition of T cell-dependent and RANKL-dependent osteoclastogenic processes associated with high levels of bone mass in interleukin-15 receptor-deficient mice. Arthritis Rheum. 2010;62:3300–10. doi: 10.1002/art.27645. [DOI] [PubMed] [Google Scholar]
- 17.Pistilli EE, Devaney JM, Gordish-Dressman H, Bradbury MK, Seip RL, Thompson PD, Angelopoulos TJ, Clarkson PM, Moyna NM, Pescatello LS, Visich PS, Zoeller RF, Gordon PM, Hoffman EP. Interleukin-15 and interleukin-15R alpha SNPs and associations with muscle, bone, and predictors of the metabolic syndrome. Cytokine. 2008;43:45–53. doi: 10.1016/j.cyto.2008.04.008. [DOI] [PMC free article] [PubMed] [Google Scholar]
- 18.Guo Q, Lv SZ, Wu SW, Tian X, Li ZY. Association between single nucleotide polymorphism of IL15RA gene with susceptibility to ossification of the posterior longitudinal ligament of the spine. J Orthop Surg Res. 2014;9:103. doi: 10.1186/s13018-014-0103-6. [DOI] [PMC free article] [PubMed] [Google Scholar]
- 19.Pistilli EE, Bogdanovich S, Garton F, Yang N, Gulbin JP, Conner JD, Anderson BG, Quinn LS, North K, Ahima RS, Khurana TS. Loss of IL-15 receptor α alters the endurance, fatigability, and metabolic characteristics of mouse fast skeletal muscles. J Clin Invest. 2011;121:3120–32. doi: 10.1172/JCI44945. [DOI] [PMC free article] [PubMed] [Google Scholar]
- 20.He Y, Wu X, Khan RS, Kastin AJ, Cornelissen-Guillaume GG, Hsuchou H, Robert B, Halberg F, Pan W. IL-15 receptor deletion results in circadian changes of locomotor and metabolic activity. J Mol Neurosci. 2010;41:315–21. doi: 10.1007/s12031-009-9319-z. [DOI] [PMC free article] [PubMed] [Google Scholar]
- 21.Loro E, Seifert EL, Moffat C, Romero F, Mishra MK, Sun Z, Krajacic P, Anokye-Danso F, Summer RS, Ahima RS, Khurana TS. IL-15Rα is a determinant of muscle fuel utilization, and its loss protects against obesity. Am J Physiol Regul Integr Comp Physiol. 2015;309:R835–44. doi: 10.1152/ajpregu.00505.2014. [DOI] [PMC free article] [PubMed] [Google Scholar]
- 22.Baptista F, Barrigas C, Vieira F, Santa-Clara H, Homens PM, Fragoso I, Teixeira PJ, Sardinha LB. The role of lean body mass and physical activity in bone health in children. J Bone Miner Metab. 2012;30:100–8. doi: 10.1007/s00774-011-0294-4. [DOI] [PubMed] [Google Scholar]
- 23.Huang TH, Lin SC, Chang FL, Hsieh SS, Liu SH, Yang RS. Effects of different exercise modes on mineralization, structure, and biomechanical properties of growing bone. J Appl Physiol (1985) 2003;95:300–7. doi: 10.1152/japplphysiol.01076.2002. [DOI] [PubMed] [Google Scholar]
- 24.Soleimani M, Nadri S. A protocol for isolation and culture of mesenchymal stem cells from mouse bone marrow. Nat Protoc. 2009;4:102–6. doi: 10.1038/nprot.2008.221. [DOI] [PubMed] [Google Scholar]
- 25.Tusher VG, Tibshirani R, Chu G. Significance analysis of microarrays applied to the ionizing radiation response. Proc Natl Acad Sci U S A. 2001;98:5116–21. doi: 10.1073/pnas.091062498. [DOI] [PMC free article] [PubMed] [Google Scholar]
- 26.Wickham H. ggplot2: elegant graphics for data analysis. Vol. 1. Springer; New York: 2009. p. 3. [Google Scholar]
- 27.Zhao S, Guo Y, Sheng Q, Shyr Y. Advanced heat map and clustering analysis using heatmap3. Biomed Res Int. 2014;2014:986048. doi: 10.1155/2014/986048. [DOI] [PMC free article] [PubMed] [Google Scholar]
- 28.Huang daW, Sherman BT, Lempicki RA. Systematic and integrative analysis of large gene lists using DAVID bioinformatics resources. Nat Protoc. 2009;4:44–57. doi: 10.1038/nprot.2008.211. [DOI] [PubMed] [Google Scholar]
- 29.Huang daW, Sherman BT, Lempicki RA. Bioinformatics enrichment tools: paths toward the comprehensive functional analysis of large gene lists. Nucleic Acids Res. 2009;37:1–13. doi: 10.1093/nar/gkn923. [DOI] [PMC free article] [PubMed] [Google Scholar]
- 30.Shannon P, Markiel A, Ozier O, Baliga NS, Wang JT, Ramage D, Amin N, Schwikowski B, Ideker T. Cytoscape: a software environment for integrated models of biomolecular interaction networks. Genome Res. 2003;13:2498–504. doi: 10.1101/gr.1239303. [DOI] [PMC free article] [PubMed] [Google Scholar]
- 31.Janky R, Verfaillie A, Imrichová H, Van de Sande B, Standaert L, Christiaens V, Hulselmans G, Herten K, Naval Sanchez M, Potier D, Svetlichnyy D, Kalender Atak Z, Fiers M, Marine JC, Aerts S. iRegulon: from a gene list to a gene regulatory network using large motif and track collections. PLoS Comput Biol. 2014;10:e1003731. doi: 10.1371/journal.pcbi.1003731. [DOI] [PMC free article] [PubMed] [Google Scholar]
- 32.Soul J, Hardingham TE, Boot-Handford RP, Schwartz JM. PhenomeExpress: a refined network analysis of expression datasets by inclusion of known disease phenotypes. Sci Rep. 2015;5:8117. doi: 10.1038/srep08117. [DOI] [PMC free article] [PubMed] [Google Scholar]
- 33.Nam HK, Liu J, Li Y, Kragor A, Hatch NE. Ectonucleotide pyrophosphatase/phosphodiesterase-1 (ENPP1) protein regulates osteoblast differentiation. J Biol Chem. 2011;286:39059–71. doi: 10.1074/jbc.M111.221689. [DOI] [PMC free article] [PubMed] [Google Scholar]
- 34.Glatt V, Canalis E, Stadmeyer L, Bouxsein ML. Age-related changes in trabecular architecture differ in female and male C57BL/6J mice. J Bone Miner Res. 2007;22:1197–207. doi: 10.1359/jbmr.070507. [DOI] [PubMed] [Google Scholar]
- 35.Knosp WM, Scott V, Bächinger HP, Stadler HS. HOXA13 regulates the expression of bone morphogenetic proteins 2 and 7 to control distal limb morphogenesis. Development. 2004;131:4581–92. doi: 10.1242/dev.01327. [DOI] [PubMed] [Google Scholar]
- 36.Villavicencio-Lorini P, Kuss P, Friedrich J, Haupt J, Farooq M, Türkmen S, Duboule D, Hecht J, Mundlos S. Homeobox genes d11–d13 and a13 control mouse autopod cortical bone and joint formation. J Clin Invest. 2010;120:1994–2004. doi: 10.1172/JCI41554. [DOI] [PMC free article] [PubMed] [Google Scholar]
- 37.Nabavi N, Pustylnik S, Harrison RE. Rab GTPase mediated procollagen trafficking in ascorbic acid stimulated osteoblasts. PLoS One. 2012;7:e46265. doi: 10.1371/journal.pone.0046265. [DOI] [PMC free article] [PubMed] [Google Scholar]
- 38.Kulterer B, Friedl G, Jandrositz A, Sanchez-Cabo F, Prokesch A, Paar C, Scheideler M, Windhager R, Preisegger KH, Trajanoski Z. Gene expression profiling of human mesenchymal stem cells derived from bone marrow during expansion and osteoblast differentiation. BMC Genomics. 2007;8:70. doi: 10.1186/1471-2164-8-70. [DOI] [PMC free article] [PubMed] [Google Scholar]
- 39.Tokuzawa Y, Yagi K, Yamashita Y, Nakachi Y, Nikaido I, Bono H, Ninomiya Y, Kanesaki-Yatsuka Y, Akita M, Motegi H, Wakana S, Noda T, Sablitzky F, Arai S, Kurokawa R, Fukuda T, Katagiri T, Schönbach C, Suda T, Mizuno Y, Okazaki Y. Id4, a new candidate gene for senile osteoporosis, acts as a molecular switch promoting osteoblast differentiation. PLoS Genet. 2010;6:e1001019. doi: 10.1371/journal.pgen.1001019. [DOI] [PMC free article] [PubMed] [Google Scholar]
- 40.Cui W, Cuartas E, Ke J, Zhang Q, Einarsson HB, Sedgwick JD, Li J, Vignery A. CD200 and its receptor, CD200R, modulate bone mass via the differentiation of osteoclasts. Proceedings of the National Academy of Sciences. 2007;104:14436–14441. doi: 10.1073/pnas.0702811104. [DOI] [PMC free article] [PubMed] [Google Scholar]
- 41.Abdelmagid SM, Barbe MF, Rico MC, Salihoglu S, Arango-Hisijara I, Selim AH, Anderson MG, Owen TA, Popoff SN, Safadi FF. Osteoactivin, an anabolic factor that regulates osteoblast differentiation and function. Exp Cell Res. 2008;314:2334–51. doi: 10.1016/j.yexcr.2008.02.006. [DOI] [PubMed] [Google Scholar]
- 42.Safadi FF, Xu J, Smock SL, Rico MC, Owen TA, Popoff SN. Cloning and characterization of osteoactivin, a novel cDNA expressed in osteoblasts. J Cell Biochem. 2001;84:12–26. doi: 10.1002/jcb.1259. [DOI] [PubMed] [Google Scholar]
- 43.Lee HL, Yi T, Woo KM, Ryoo HM, Kim GS, Baek JH. Msx2 mediates the inhibitory action of TNF-alpha on osteoblast differentiation. Exp Mol Med. 2010;42:437–45. doi: 10.3858/emm.2010.42.6.045. [DOI] [PMC free article] [PubMed] [Google Scholar]
- 44.Babij P, Roudier M, Graves T, Han CY, Chhoa M, Li CM, Juan T, Morony S, Grisanti M, Li X, Yu L, Dwyer D, Lloyd DJ, Bass MB, Richards WG, Ebeling C, Amato J, Carlson G. New variants in the Enpp1 and Ptpn6 genes cause low BMD, crystal-related arthropathy, and vascular calcification. J Bone Miner Res. 2009;24:1552–64. doi: 10.1359/jbmr.090417. [DOI] [PubMed] [Google Scholar]
- 45.Koh JM, Oh B, Ha MH, Cho KW, Lee JY, Park BL, Shin HD, Bae MA, Kim HJ, Hong JM, Kim TH, Shin HI, Lee SH, Kim GS, Kim SY, Park EK. Association of IL-15 polymorphisms with bone mineral density in postmenopausal Korean women. Calcif Tissue Int. 2009;85:369–78. doi: 10.1007/s00223-009-9290-2. [DOI] [PubMed] [Google Scholar]
- 46.O’Connell G, Guo G, Stricker J, Quinn LS, Ma A, Pistilli EE. Muscle-specific deletion of exons 2 and 3 of the IL15RA gene in mice: effects on contractile properties of fast and slow muscles. J Appl Physiol (1985) 2015;118:437–48. doi: 10.1152/japplphysiol.00704.2014. [DOI] [PubMed] [Google Scholar]
- 47.Prideaux M, Loveridge N, Pitsillides AA, Farquharson C. Extracellular matrix mineralization promotes E11/gp38 glycoprotein expression and drives osteocytic differentiation. PLoS One. 2012;7:e36786. doi: 10.1371/journal.pone.0036786. [DOI] [PMC free article] [PubMed] [Google Scholar]
- 48.Dallas SL, Prideaux M, Bonewald LF. The osteocyte: an endocrine cell … and more. Endocr Rev. 2013;34:658–90. doi: 10.1210/er.2012-1026. [DOI] [PMC free article] [PubMed] [Google Scholar]
- 49.Olsen SK, Ota N, Kishishita S, Kukimoto-Niino M, Murayama K, Uchiyama H, Toyama M, Terada T, Shirouzu M, Kanagawa O, Yokoyama S. Crystal Structure of the interleukin-15.interleukin-15 receptor alpha complex: insights into trans and cis presentation. J Biol Chem. 2007;282:37191–204. doi: 10.1074/jbc.M706150200. [DOI] [PubMed] [Google Scholar]
- 50.Pontikoglou C, Langonné A, Ba MA, Varin A, Rosset P, Charbord P, Sensébé L, Deschaseaux F. CD200 expression in human cultured bone marrow mesenchymal stem cells is induced by pro-osteogenic and pro-inflammatory cues. J Cell Mol Med. 2016;20:655–65. doi: 10.1111/jcmm.12752. [DOI] [PMC free article] [PubMed] [Google Scholar]
- 51.Belli SI, Goding JW. Biochemical characterization of human PC-1, an enzyme possessing alkaline phosphodiesterase I and nucleotide pyrophosphatase activities. Eur J Biochem. 1994;226:433–43. doi: 10.1111/j.1432-1033.1994.tb20068.x. [DOI] [PubMed] [Google Scholar]
- 52.Goding JW, Grobben B, Slegers H. Physiological and pathophysiological functions of the ecto-nucleotide pyrophosphatase/phosphodiesterase family. Biochimica Et Biophysica Acta (BBA)-Molecular Basis of Disease. 2003;1638:1–19. doi: 10.1016/s0925-4439(03)00058-9. [DOI] [PubMed] [Google Scholar]
- 53.Maddux BA, Sbraccia P, Kumakura S, Sasson S, Youngren J, Fisher A, Spencer S, Grupe A, Henzel W, Stewart TA. Membrane glycoprotein PC-1 and insulin resistance in non-insulin-dependent diabetes mellitus. Nature. 1995;373:448–51. doi: 10.1038/373448a0. [DOI] [PubMed] [Google Scholar]
- 54.Pizzuti A, Frittitta L, Argiolas A, Baratta R, Goldfine ID, Bozzali M, Ercolino T, Scarlato G, Iacoviello L, Vigneri R, Tassi V, Trischitta V. A polymorphism (K121Q) of the human glycoprotein PC-1 gene coding region is strongly associated with insulin resistance. Diabetes. 1999;48:1881–4. doi: 10.2337/diabetes.48.9.1881. [DOI] [PubMed] [Google Scholar]
- 55.Rutsch F, Ruf N, Vaingankar S, Toliat MR, Suk A, Höhne W, Schauer G, Lehmann M, Roscioli T, Schnabel D, Epplen JT, Knisely A, Superti-Furga A, McGill J, Filippone M, Sinaiko AR, Vallance H, Hinrichs B, Smith W, Ferre M, Terkeltaub R, Nürnberg P. Mutations in ENPP1 are associated with ‘idiopathic’ infantile arterial calcification. Nat Genet. 2003;34:379–81. doi: 10.1038/ng1221. [DOI] [PubMed] [Google Scholar]
- 56.Nakamura I, Ikegawa S, Okawa A, Okuda S, Koshizuka Y, Kawaguchi H, Nakamura K, Koyama T, Goto S, Toguchida J, Matsushita M, Ochi T, Takaoka K, Nakamura Y. Association of the human NPPS gene with ossification of the posterior longitudinal ligament of the spine (OPLL) Hum Genet. 1999;104:492–7. doi: 10.1007/s004390050993. [DOI] [PubMed] [Google Scholar]
- 57.Levy-Litan V, Hershkovitz E, Avizov L, Leventhal N, Bercovich D, Chalifa-Caspi V, Manor E, Buriakovsky S, Hadad Y, Goding J, Parvari R. Autosomal-recessive hypophosphatemic rickets is associated with an inactivation mutation in the ENPP1 gene. Am J Hum Genet. 2010;86:273–8. doi: 10.1016/j.ajhg.2010.01.010. [DOI] [PMC free article] [PubMed] [Google Scholar]
- 58.Lorenz-Depiereux B, Schnabel D, Tiosano D, Häusler G, Strom TM. Loss-of-function ENPP1 mutations cause both generalized arterial calcification of infancy and autosomal-recessive hypophosphatemic rickets. Am J Hum Genet. 2010;86:267–72. doi: 10.1016/j.ajhg.2010.01.006. [DOI] [PMC free article] [PubMed] [Google Scholar]
Associated Data
This section collects any data citations, data availability statements, or supplementary materials included in this article.