

Abstract
Objective:
To examine whether gene expression analysis of a large-scale Parkinson disease (PD) patient cohort produces a robust blood-based PD gene signature compared to previous studies that have used relatively small cohorts (≤220 samples).
Methods:
Whole-blood gene expression profiles were collected from a total of 523 individuals. After preprocessing, the data contained 486 gene profiles (n = 205 PD, n = 233 controls, n = 48 other neurodegenerative diseases) that were partitioned into training, validation, and independent test cohorts to identify and validate a gene signature. Batch-effect reduction and cross-validation were performed to ensure signature reliability. Finally, functional and pathway enrichment analyses were applied to the signature to identify PD-associated gene networks.
Results:
A gene signature of 100 probes that mapped to 87 genes, corresponding to 64 upregulated and 23 downregulated genes differentiating between patients with idiopathic PD and controls, was identified with the training cohort and successfully replicated in both an independent validation cohort (area under the curve [AUC] = 0.79, p = 7.13E–6) and a subsequent independent test cohort (AUC = 0.74, p = 4.2E–4). Network analysis of the signature revealed gene enrichment in pathways, including metabolism, oxidation, and ubiquitination/proteasomal activity, and misregulation of mitochondria-localized genes, including downregulation of COX4I1, ATP5A1, and VDAC3.
Conclusions:
We present a large-scale study of PD gene expression profiling. This work identifies a reliable blood-based PD signature and highlights the importance of large-scale patient cohorts in developing potential PD biomarkers.
Parkinson disease (PD) is the second most common neurodegenerative disorder, characterized by dopaminergic neuron loss in the substantia nigra pars compacta leading to the onset of clinical parkinsonian symptoms.1 Identifying biomarkers for PD such as blood-based biomarkers that can easily be obtained for analysis is thus highly attractive.2 α-Synuclein, DJ-1, and uric acid have previously been studied as potential candidate blood-based biomarkers,3 as well as epidermal growth factor and apolipoprotein A1 protein levels as respective biomarkers for PD cognitive performance4 and age at onset.5
Studying blood-based changes in mRNA gene expression presents an additional biomarker strategy for differentiating patients with IPD from healthy controls.6 However, despite substantial work in this field, identifying a reliable and reproducible gene classification for PD has proved difficult. Of note, previous studies used relatively small cohorts, with the largest study previously undertaken using only 220 total samples,7 which may have lacked sufficient power to identify a reliable PD gene signature. Here, we present whole-blood gene expression profiling of a large-scale cohort that generated a robust blood-based signature of 100 probes that mapped to 87 genes, which successfully classified samples as either IPD or healthy control. The genes within our IPD blood-based signature are functionally enriched for pathways, including mitochondrial metabolism and ubiquitination/proteasomal activity, 2 cellular processes previously implicated in PD. Our results demonstrate that a large dataset may be required to identify a blood-based IPD signature and to provide insight into PD pathophysiology.
METHODS
Patient recruitment and clinical assessment.
We recruited 205 patients with IPD and 48 patients with other neurodegenerative diseases (NDDs; 27 patients with Huntington disease, and 21 with multiple system atrophy [MSA], corticobasal degeneration [CBD], progressive supranuclear palsy [PSP], or PD dementia [PDD]) to 2 tertiary referral centers in Europe (Luebeck, Germany, and Paris, France). In addition, 233 healthy controls were recruited, including nonconsanguineous controls from families of patients. All patients and controls from the German referral center were ethnically matched (German/white). All patients and controls from the French referral center were white except the following: 2 Africans, 2 Asians, and 1 English West Indies. Patients underwent rigorous clinical characterization,8,9 which included age at disease onset, Unified Parkinson's Disease Rating Scale score, Hoehn & Yahr score, and Montreal Cognitive Assessment (table e-1 at Neurology.org). Patients who had SPECT data available that showed scans without evidence of dopaminergic deficits were not included in the analysis. All patients in the IPD cohort were treated with dopaminergic medication and met United Kingdom Parkinson's Disease Society Brain Bank Criteria10 except that positive family history was not regarded as an exclusion criterion. Patients who were suspected of having possible secondary causes for parkinsonism such as use of neuroleptic agents were excluded from the study. Patients with IPD were additionally evaluated for atypical signs, and patients meeting criteria for atypical PD syndromes (MSA, CBD, PSP, or PDD) were not included in the IPD cohort, were classified as atypical PD, and were included in the NDD cohort (e-Methods).
Standard protocol approvals, registrations, and patient consents.
We obtained ethics approval at all participating sites, and all patients provided written informed consent.
RESULTS
Identifying a blood-based signature for IPD.
To construct a robust blood-based classifier and gene signature to differentiate between patients with IPD and controls, we collected whole-blood gene expression profiles from 523 individuals. After quality control by preprocessing (figure e-1), the data contained profiles of 486 individuals: 205 patients with IPD, 233 healthy controls, and 48 patients with other NDDs (table e-1). All patients and controls were age matched for analysis. To perform our analysis, we partitioned the samples into 3 learning sets defined by similar age and sex distributions: a training set that contained 140 patients with IPD and 153 controls, a validation set that contained 35 patients with IPD and 40 controls, and a test set that contained 30 IPD, 40 controls, and all 48 NDD samples (table e-2). The training set was used for preprocessing and for testing feature selection and classification algorithms. The validation set was subsequently used as an initial test of the flow and to tune the size of the final gene signature, while the test set was used only once as a final independent validation (figure 1A).
Figure 1. Identification of a blood-based gene signature for IPD.

(A) Overview of the analysis. Training process (left) involved preprocessing steps: removing unexpressed probes and small batches, reducing batch effects with fSVA, and identifying the most differential probes to learn the support vector machine classifier. Samples were partitioned into 3 datasets (DSs; right): training, validation, and test sets. The validation and training sets were used to evaluate the training process, and the validation set was additionally used to tune parameters (e.g., selection of the number of top probes). Finally, a classifier was learned using the data from the training and validation sets, and its performance was evaluated with the test set, which was excluded from all previous stages. (B) Characterization of the identified gene signature. (C) ROC curves for the validation (black line) and independent test (green line) sets. (D) ROC curves for the independent test set divided into either samples from old batches present while learning the classifier (46 samples; red line) or samples from new batches (24 samples; blue line). Values of p and AUC scores are listed below. AUC = area under curve; fSVA = frozen Surrogate Variable Analysis; IPD = idiopathic Parkinson disease; ROC = receiver operating characteristic.
To identify such a classifier, we first filtered out small batches (<10 samples) and probes with low expression across samples (log expression value <6 in at least 80% of samples) because samples were collected from 2 different sites over 5 years (table e-3). We next used frozen Surrogate Variable Analysis (fSVA)11 on the filtered data to reduce batch effects, producing a fixed model that could be used to reduce batch effects in independent samples derived from unknown batches. Using the fSVA-transformed data, we then selected k probes (for signature size k = 10,20…200) with the highest difference in mean expression between patients with IPD and controls, which we denoted as the signature. Using these signature probes, we trained a linear support vector machine classifier and applied it to independent fSVA-transformed samples, producing a probability for each tested sample of being in the IPD class.
To validate the predictive value of our classifier, we performed leave-batch-out cross-validation on the training set by removing a batch from the data and allowing the classifier to identify an IPD signature that was based on the remaining samples. We found that the number of probes k = 30 to 100 achieved results of comparable quality with high accuracy (figure e-2), with a maximal area under curve score obtained for the number of probes k = 50 (area under curve = 0.72). To further confirm the validity of our classifier for differentiating between patients with IPD and controls, we trained the classifier on the entire training set and then tested it on the validation set. When we again tested different numbers of probes (k = 10,20…200), the top performance was achieved for probe number k = 100 (figure 1C, black line). Thus, on the basis of the validation set analysis, we set the signature size k = 100 to establish a signature of 100 probes to use in our IPD classifier.
To create the final signature, we trained the classifier on the union of the training and validation sets and identified a signature of 100 probes that mapped to 87 genes (table e-4). Of these, 64 genes were upregulated and 23 genes were downregulated, providing us with a unique blood-based signature capable of differentiating between patients with IPD and controls (figure 1B).
Validation on an independent test set.
We subsequently tested the 87 gene signature on an independent test set (30 patients with IPD and 40 controls). We again observed high performance on this independent test set in differentiating between patients with IPD and controls (figure 1C, green line).
We further tested the robustness of our signature by splitting the independent test set into samples from old batches that were present while learning the classifier (46 samples) and samples from new batches (24 samples). We observed that our signature differentiated between patients with IPD and controls in these independent test samples derived from either old batches (red line) or new batches (blue line) (figure 1D), further demonstrating the robustness of our 87-gene IPD signature. As expected, the signature reliably predicted an increased IPD probability for samples from the IPD cohort compared to healthy control samples (figure 2).
Figure 2. Gene signature performance on IPD, controls, and other NDDs.
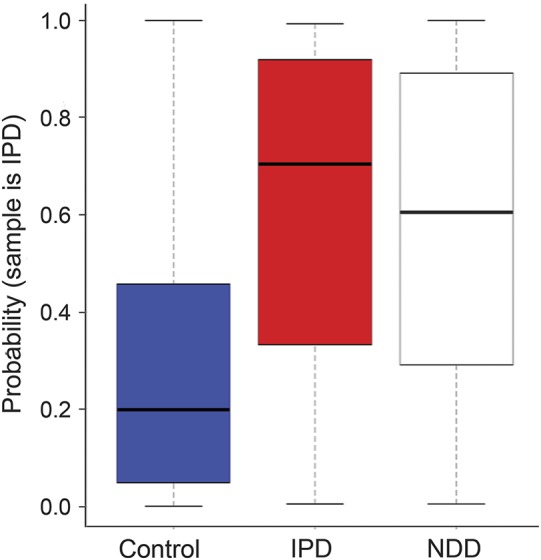
The y-axis is the probability that a sample is classified as PD. Each boxplot summarizes the distribution of probabilities for samples from each cohort. The 2 left boxplots show the results for the IPD (n = 40) and control (n = 30) samples in the test set. The right boxplot shows the results for new participants with other neurodegenerative diseases (n = 48) consisting of HD (n = 27), MSA (n = 9), PSP (n = 8), CBD (n = 2), and PDD (n = 2). Values of p are as follows: IPD vs control, p = 0.0004; NDD vs control, p = 0.0005; and IPD vs NDD, p = 0.58. CBD = corticobasal degeneration; HD = Huntington disease; IPD = idiopathic Parkinson disease; MSA = multiple system atrophy; NDD = neurodegenerative diseases; PDD = Parkinson disease dementia; PSP = progressive supranuclear palsy.
Application to other NDDs.
To examine whether our signature was specific to patients with IPD, we applied our signature to 48 samples with other NDDs from the independent test set (27 patients with Huntington disease, 9 with MSA, 8 with PSP, 2 with CBD, and 2 with PDD). We found that the signature could not robustly differentiate between patients with NDD and controls but produced a weak signal that classified NDD samples as intermediates between IPD and control (figure 2). Our signature was still capable of successfully distinguishing IPD samples from the combined samples of controls and patients with NDD (figure e-3, purple line).
Network analysis of IPD signature.
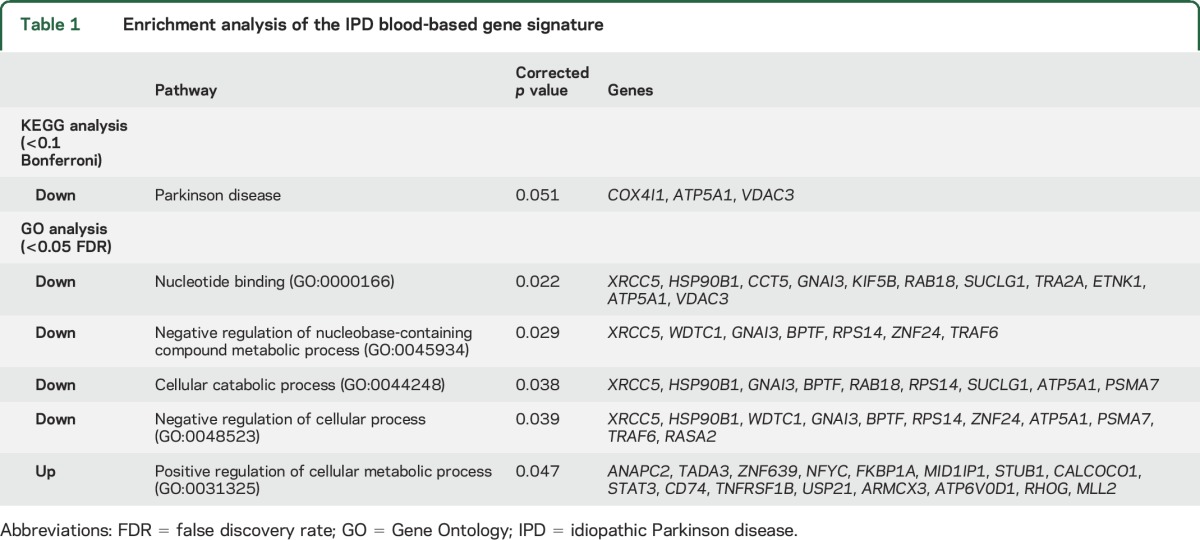
We next examined the cellular pathways associated with the 87 genes in our IPD blood-based signature by examining the functional enrichment of these genes using KEGG pathway analysis and Gene Ontology (GO) terms via EXPANDER.12 Most notably, with the KEGG pathway analysis, the downregulated genes were enriched with genes in the PD pathway (COX4I1 [0.94], ATP5A1 [0.95], and VDAC3 [0.94]). With the use of GO terms, several processes were identified for downregulated genes, including genes related to nucleotide binding, negative regulation of nucleobase-containing compound metabolic process, cellular catabolic process, and negative regulation of cellular process. In contrast, the upregulated genes were enriched for only 1 GO process (positive regulation of cellular metabolic process) (table 1).
Table 1.
Enrichment analysis of the IPD blood-based gene signature
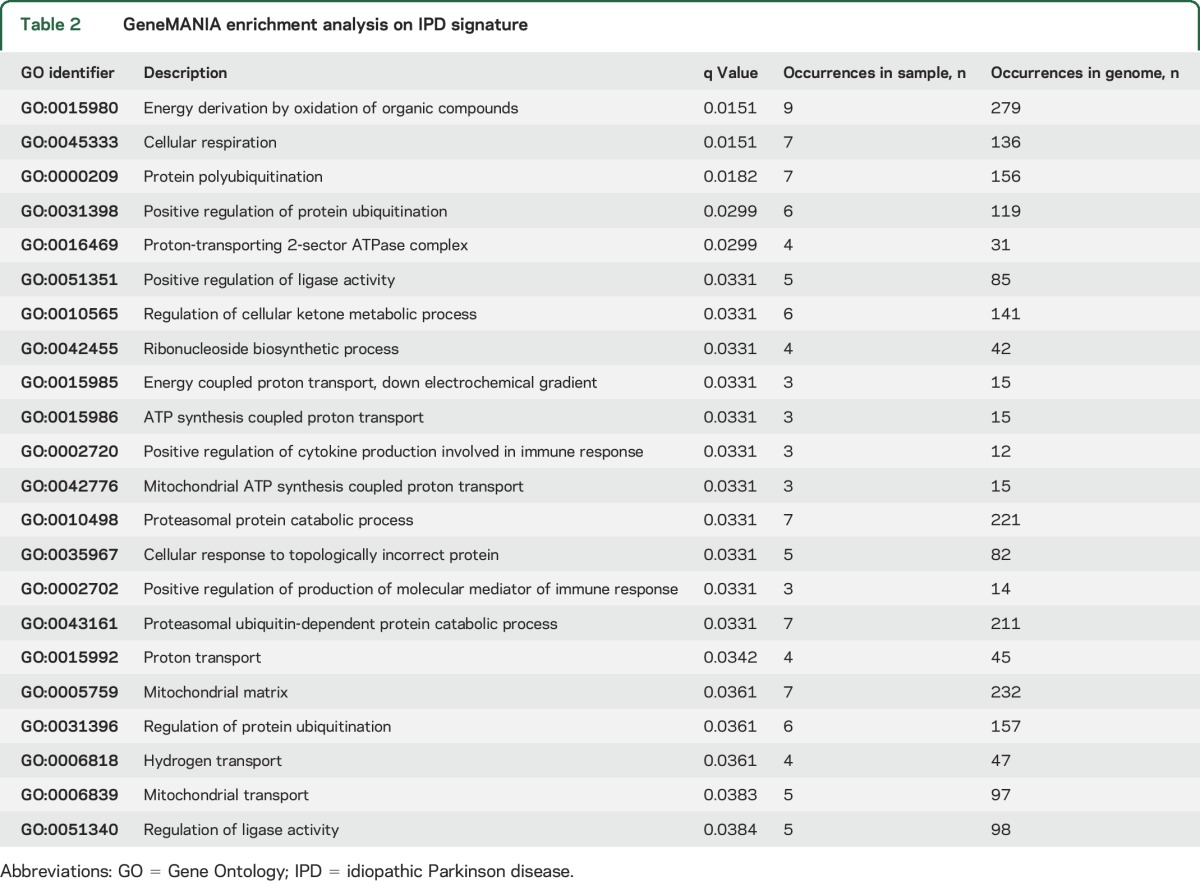
We also used GeneMANIA13 to detect known interactions among the signature genes and identified additional genes connected to the signature genes (figure 3, black and gray nodes, respectively). The interactions identified included protein colocalization (dark blue line), similar protein-protein interaction networks (tan line), and similar pathways (light blue line). Twenty-two different biological functions (q < 0.05) were enriched within our signature genes (table 2), with energy derivation by oxidation of organic compounds the most enriched function. We also identified 3 functions that contained both upregulated and downregulated genes that represented different areas in the network: cellular respiration, protein polyubiquitination, and response to topologically incorrect protein. The diversity of these identified pathways suggests that various cellular processes may be altered in IPD. A larger subset of the genes identified in our IPD blood-based signature were related to metabolism, oxidation, and ubiquitination (table 2), key pathways that have previously been associated with PD pathogenesis.
Figure 3. Functional analysis of IPD signature genes.

GeneMANIA was used to detect known interactions among signature genes. Both upregulated (black rectangles) and downregulated (black hexagons) genes are displayed. Additional genes that are highly connected to the signature are also identified by GeneMANIA (gray nodes). Three main enriched functional groups were detected: cellular respiration (q = 0.015), protein polyubiquitination (q = 0.033), and cellular response to topologically incorrect protein (q = 0.033). The color of the frame around a gene indicates its enriched function, and the lines connecting genes represent colocalization, PPI, or similar pathways (see edge legend). IPD = idiopathic Parkinson disease; PPI = protein-protein interaction.
Table 2.
GeneMANIA enrichment analysis on IPD signature
DISCUSSION
In this study, we present a robust, unbiased blood-based signature differentiating between patients with IPD and controls. Using whole blood gene expression profiles of a large-scale cohort, we successfully identified a signature comprising 87 genes that classified participants into patients with IPD or healthy controls with high performance. Our signature differentiates between patients with IPD and controls in an independent test set not used in the training or validation process, suggesting that our signature may be equally successful in future cohorts.
Previous reports on PD signatures have used various signature sizes. In our study, we chose a signature size of 100 probes, which mapped to 87 genes, because it produced the most reliable signature for differentiating between patients with IPD and controls. In addition, because batch effects may severely influence data analysis and interpretation,14 we both filtered out small batches (<10 samples) and applied fSVA11 to the filtered data to produce a frozen model that reduced batch effects.
Our IPD blood-based 87-gene signature was made up of 64 upregulated and 23 downregulated genes. In addition, network analysis identified enrichment of 22 biological functions using GeneMANIA and 1 upregulated pathway and 4 downregulated pathways using GO terms. These included PD-associated biological pathways such as ubiquitination/proteasomal activity, metabolic processes, and mitochondrial function, suggesting that the use of a larger patient cohort may be beneficial for elucidating cellular mechanisms involved in PD pathophysiology. Genes linked to ubiquitination/proteasomal activity included E3 ubiquitin ligase Traf6 and the proteasome subunit alpha 7 (PSMA7), which were both downregulated. Of note, the ubiquitin proteasome system has been previously implicated in PD pathogenesis,15 and mutations in the E3 ubiquitin ligase Parkin cause familial PD.16 In addition, genes linked to mitochondrial function included 3 mitochondria-localized genes (COX4I1, ATP5A1, and VDAC3), which were also downregulated and classified under the PD pathway by KEGG analysis. COX4I1 is the terminal enzyme of the mitochondrial respiratory chain, while ATP5A1 is a subunit of mitochondrial ATP synthase. VDAC3 encodes a voltage-dependent anion channel located on the outer mitochondrial membrane and has been implicated in recruiting Parkin to depolarized mitochondria for efficient autophagic degradation.17 Indeed, autosomal recessive PD-linked mutations in Parkin, PINK1, and DJ-1 have been linked to defective mitochondrial homeostasis,18 and cellular bioenergetics and mitochondrial electron transport genes are downregulated in laser-captured human dopaminergic neuron and substantia nigra PD transcriptomes,19 suggesting that downregulation of key mitochondrial genes may be an important characteristic of an IPD blood-based signature.
Establishing a reliable and reproducible PD gene signature across different studies has proved to be challenging for the field. Indeed, comparison of signatures from 6 other blood-based PD studies6,7,20–23 shows that the only notable overlap between these previous studies was in the signatures from 2 studies.7,21 Several factors may contribute to the variability between previous blood-based PD gene signatures,6,7,20–31 particularly between those published by different groups.32 These include lack of replication in independent samples from multisite cohorts; lack of standardization in sample collection, processing, gene expression profiling, and bioinformatics analysis; and relatively small changes in gene expression levels, along with low signal-to-noise ratios.2 In addition, samples across studies often derive from heterogeneous PD populations with different genetic backgrounds and varying rates of progression and disease stages. Moreover, batch effects and small cohort sizes further hinder the ability of the field to identify a reliable PD gene signature. Of note, the lack of reproducibility of exact gene signatures has been acknowledged as a prevalent problem across multiple diseases, although dissimilar signatures may produce equally useful predictive classifiers.33–35 We propose that larger cohort sizes for gene signature studies are critical for establishing a reliable PD diagnostic signature and that a comprehensive understanding of the transcriptional landscape in patients with PD may ultimately require thousands of samples and the use of digital expression analysis platforms such as NanoString or RNA-seq. Of note, while our signature was trained to differentiate between PD and control samples, future signatures trained to differentiate between controls and different NDDs, including PD, will have obvious important diagnostic benefits. Ultimately, identifying robust and reliable PD gene expression signatures will be critical for establishing clinically accessible blood-based biomarkers for presymptomatic PD and serving as effective readouts for the efficacy of future presymptomatic therapeutics.
Supplementary Material
ACKNOWLEDGMENT
The authors thank Andre Troiano for collecting data from patients with PD and the DNA and Cell Bank of Institut du Cerveau et de la Moelle épinière for sample storage and preparation.
GLOSSARY
- CBD
corticobasal degeneration
- fSVA
frozen Surrogate Variable Analysis
- GO
Gene Ontology
- IPD
idiopathic Parkinson disease
- MSA
multiple system atrophy
- NDD
neurodegenerative disease
- PD
Parkinson disease
- PDD
Parkinson disease dementia
- PSMA7
proteasome subunit alpha 7
- PSP
progressive supranuclear palsy
Footnotes
Supplemental data at Neurology.org
AUTHOR CONTRIBUTIONS
Ron Shamir: study concept and design, analysis and interpretation of data, drafting/revising the manuscript for content, statistical analysis. Christine Klein: study concept and design, acquisition of data, drafting/revising the manuscript for content. David Amar: analysis and interpretation of data, drafting/revising the manuscript for content, statistical analysis. Eva-Juliane Vollstedt: analysis and interpretation of data, drafting/revising the manuscript for content. Michael Bonin and Marija Usenovic: study concept and design, acquisition of data, analysis and interpretation of data. Yvette C. Wong: analysis and interpretation of data, drafting/revising the manuscript for content. Ales Maver: analysis and interpretation of data. Sven Poths: study concept and design, acquisition of data, analysis and interpretation of data. Hershel Safer: analysis and interpretation of data. Jean-Christophe Corvol and Suzanne Lesage: study concept and design, acquisition of data, analysis and interpretation of data. Ofer Lavi: analysis and interpretation of data. Günther Deuschl and Gregor Kuhlenbaeumer: study concept and design. Heike Pawlack: acquisition of data, analysis and interpretation of data. Igor Ulitsky: analysis and interpretation of data. Meike Kasten: study concept and design, acquisition of data, analysis and interpretation of data, drafting/revising the manuscript for content. Olaf Riess and Alexis Brice: study concept and design, acquisition of data, analysis and interpretation of data. Borut Peterlin and Dimitri Krainc: study concept and design, acquisition of data, analysis and interpretation of data, drafting/revising the manuscript for content.
STUDY FUNDING
Supported by GENEPARK (FP6 and FP7), the Israel Science Foundation (317/13), the Raymond and Beverly Sackler Chair in Bioinformatics, the Hermann and Lilly Schilling Foundation, and DFG (FOR 2488).
DISCLOSURE
The authors report no disclosures relevant to the manuscript. Go to Neurology.org for full disclosures.
REFERENCES
- 1.Kalia LV, Lang AE. Parkinson's disease. Lancet 2015;386:896–912. [DOI] [PubMed] [Google Scholar]
- 2.Chen-Plotkin AS. Unbiased approaches to biomarker discovery in neurodegenerative diseases. Neuron 2014;84:594–607. [DOI] [PMC free article] [PubMed] [Google Scholar]
- 3.Chahine LM, Stern MB, Chen-Plotkin A. Blood-based biomarkers for Parkinson's disease. Parkinsonism Relat Disord 2014;20(suppl 1):S99–S103. [DOI] [PMC free article] [PubMed] [Google Scholar]
- 4.Chen-Plotkin AS, Hu WT, Siderowf A, et al. Plasma epidermal growth factor levels predict cognitive decline in Parkinson disease. Ann Neurol 2011;69:655–663. [DOI] [PMC free article] [PubMed] [Google Scholar]
- 5.Qiang JK, Wong YC, Siderowf A, et al. Plasma apolipoprotein A1 as a biomarker for Parkinson disease. Ann Neurol 2013;74:119–127. [DOI] [PMC free article] [PubMed] [Google Scholar]
- 6.Scherzer CR, Eklund AC, Morse LJ, et al. Molecular markers of early Parkinson's disease based on gene expression in blood. Proc Natl Acad Sci USA 2007;104:955–960. [DOI] [PMC free article] [PubMed] [Google Scholar]
- 7.Grunblatt E, Zehetmayer S, Jacob CP, Muller T, Jost WH, Riederer P. Pilot study: peripheral biomarkers for diagnosing sporadic Parkinson's disease. J Neural Transm (Vienna) 2010;117:1387–1393. [DOI] [PubMed] [Google Scholar]
- 8.Kasten M, Kertelge L, Tadic V, et al. Depression and quality of life in monogenic compared to idiopathic, early-onset Parkinson's disease. Mov Disord 2012;27:754–759. [DOI] [PubMed] [Google Scholar]
- 9.Kertelge L, Bruggemann N, Schmidt A, et al. Impaired sense of smell and color discrimination in monogenic and idiopathic Parkinson's disease. Mov Disord 2010;25:2665–2669. [DOI] [PubMed] [Google Scholar]
- 10.Hughes AJ, Daniel SE, Kilford L, Lees AJ. Accuracy of clinical diagnosis of idiopathic Parkinson's disease: a clinico-pathological study of 100 cases. J Neurol Neurosurg Psychiatry 1992;55:181–184. [DOI] [PMC free article] [PubMed] [Google Scholar]
- 11.Leek JT, Johnson WE, Parker HS, Jaffe AE, Storey JD. The SVA package for removing batch effects and other unwanted variation in high-throughput experiments. Bioinformatics 2012;28:882–883. [DOI] [PMC free article] [PubMed] [Google Scholar]
- 12.Ulitsky I, Maron-Katz A, Shavit S, et al. Expander: from expression microarrays to networks and functions. Nat Protoc 2010;5:303–322. [DOI] [PubMed] [Google Scholar]
- 13.Montojo J, Zuberi K, Rodriguez H, et al. GeneMANIA Cytoscape plugin: fast gene function predictions on the desktop. Bioinformatics 2010;26:2927–2928. [DOI] [PMC free article] [PubMed] [Google Scholar]
- 14.Leek JT, Scharpf RB, Bravo HC, et al. Tackling the widespread and critical impact of batch effects in high-throughput data. Nat Rev Genet 2010;11:733–739. [DOI] [PMC free article] [PubMed] [Google Scholar]
- 15.Cook C, Petrucelli L. A critical evaluation of the ubiquitin-proteasome system in Parkinson's disease. Biochim Biophys Acta 2009;1792:664–675. [DOI] [PMC free article] [PubMed] [Google Scholar]
- 16.Kitada T, Asakawa S, Hattori N, et al. Mutations in the Parkin gene cause autosomal recessive juvenile parkinsonism. Nature 1998;392:605–608. [DOI] [PubMed] [Google Scholar]
- 17.Sun Y, Vashisht AA, Tchieu J, Wohlschlegel JA, Dreier L. Voltage-dependent anion channels (VDACs) recruit Parkin to defective mitochondria to promote mitochondrial autophagy. J Biol Chem 2012;287:40652–40660. [DOI] [PMC free article] [PubMed] [Google Scholar]
- 18.Trempe JF, Fon EA. Structure and function of Parkin, PINK1, and DJ-1, the three musketeers of neuroprotection. Front Neurol 2013;4:38. [DOI] [PMC free article] [PubMed] [Google Scholar]
- 19.Zheng B, Liao Z, Locascio JJ, et al. PGC-1alpha, a potential therapeutic target for early intervention in Parkinson's disease. Sci Translational Med 2010;2:52ra73. [DOI] [PMC free article] [PubMed] [Google Scholar]
- 20.Soreq L, Israel Z, Bergman H, Soreq H. Advanced microarray analysis highlights modified neuro-immune signaling in nucleated blood cells from Parkinson's disease patients. J Neuroimmunol 2008;201-202:227–236. [DOI] [PubMed] [Google Scholar]
- 21.Molochnikov L, Rabey JM, Dobronevsky E, et al. A molecular signature in blood identifies early Parkinson's disease. Mol Neurodegener 2012;7:26. [DOI] [PMC free article] [PubMed] [Google Scholar]
- 22.Shehadeh LA, Yu K, Wang L, et al. SRRM2, a potential blood biomarker revealing high alternative splicing in Parkinson's disease. PLoS One 2010;5:e9104. [DOI] [PMC free article] [PubMed] [Google Scholar]
- 23.Chikina MD, Gerald CP, Li X, et al. Low-variance RNAs identify Parkinson's disease molecular signature in blood. Mov Disord 2015;30:813–821. [DOI] [PMC free article] [PubMed] [Google Scholar]
- 24.Kedmi M, Bar-Shira A, Gurevich T, Giladi N, Orr-Urtreger A. Decreased expression of B cell related genes in leukocytes of women with Parkinson's disease. Mol Neurodegener 2011;6:66. [DOI] [PMC free article] [PubMed] [Google Scholar]
- 25.Mutez E, Larvor L, Lepretre F, et al. Transcriptional profile of Parkinson blood mononuclear cells with LRRK2 mutation. Neurobiol Aging 2011;32:1839–1848. [DOI] [PubMed] [Google Scholar]
- 26.Potashkin JA, Santiago JA, Ravina BM, Watts A, Leontovich AA. Biosignatures for Parkinson's disease and atypical parkinsonian disorders patients. PLoS One 2012;7:e43595. [DOI] [PMC free article] [PubMed] [Google Scholar]
- 27.Soreq L, Bergman H, Israel Z, Soreq H. Exon arrays reveal alternative splicing aberrations in Parkinson's disease leukocytes. Neurodegener Dis 2012;10:203–206. [DOI] [PubMed] [Google Scholar]
- 28.Karlsson MK, Sharma P, Aasly J, et al. Found in transcription: accurate Parkinson's disease classification in peripheral blood. J Parkinsons Dis 2013;3:19–29. [DOI] [PubMed] [Google Scholar]
- 29.Soreq L, Guffanti A, Salomonis N, et al. Long non-coding RNA and alternative splicing modulations in Parkinson's leukocytes identified by RNA sequencing. PLoS Comput Biol 2014;10:e1003517. [DOI] [PMC free article] [PubMed] [Google Scholar]
- 30.Calligaris R, Banica M, Roncaglia P, et al. Blood transcriptomics of drug-naive sporadic Parkinson's disease patients. BMC Genomics 2015;16:876. [DOI] [PMC free article] [PubMed] [Google Scholar]
- 31.Santiago JA, Potashkin JA. Network-based metaanalysis identifies HNF4A and PTBP1 as longitudinally dynamic biomarkers for Parkinson's disease. Proc Natl Acad Sci USA 2015;112:2257–2262. [DOI] [PMC free article] [PubMed] [Google Scholar]
- 32.Santiago JA, Potashkin JA. Current challenges towards the development of a blood test for Parkinson's disease. Diagnostics 2014;4:153–164. [DOI] [PMC free article] [PubMed] [Google Scholar]
- 33.Venet D, Dumont JE, Detours V. Most random gene expression signatures are significantly associated with breast cancer outcome. PLoS Comput Biol 2011;7:e1002240. [DOI] [PMC free article] [PubMed] [Google Scholar]
- 34.Zhang L, Li S, Hao CX, et al. Extracting a few functionally reproducible biomarkers to build robust subnetwork-based classifiers for the diagnosis of cancer. Gene 2013;526:232–238. [DOI] [PubMed] [Google Scholar]
- 35.Ein-Dor L, Zuk O, Domany E. Thousands of samples are needed to generate a robust gene list for predicting outcome in cancer. Proc Natl Acad Sci USA 2006;103:5923–5928. [DOI] [PMC free article] [PubMed] [Google Scholar]
Associated Data
This section collects any data citations, data availability statements, or supplementary materials included in this article.