Abstract
To advance an understanding of cellular regulation and function it is crucial to identify molecular contents in cellular organelles, which accommodate specific biochemical processes. Towards achievement of this goal, we applied micro-Raman-Biomolecular Component Analysis assay for molecular profiling of major organelles in live cells. We used this assay for comparative analysis of proteins 3D conformation and quantification of proteins, RNA and lipids concentrations in nucleoli, endoplasmic reticulum and mitochondria of WI-38 diploid lung fibroblasts and HeLa cancer cells. Obtained data show substantial differences in the concentrations and conformations of proteins in the studied organelles. Moreover, differences in the intra-organellar concentrations of RNA and lipids between these cell lines were found. We report the biological significance of obtained macromolecular profiles and advocate for micro-Raman BCA assay as a valuable proteomics tool.
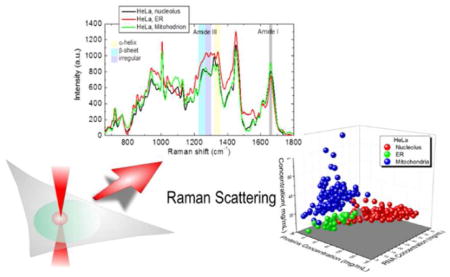
Graphical Abstract

Introduction
A growing number of Raman spectroscopic studies in the biomedical area, aimed at detection of pathogens and diagnostics of metabolic and genetic disorders, such as cancer 1–4, put an ever increasing demand on quantitative biochemical analysis.
Although the sensitivity of Raman spectroscopy is sufficiently high to identify significant cell-to-cell variations existing between different cellular samples, an inherent challenge is biological interpretation and analysis of the obtained data. A traditional approach for spectral processing of Raman data obtained from biological samples involves Principal Component Analysis (PCA) 5–8. However, this method neither provides any precise information about the biochemical variations that produce spectral changes, nor quantitative characteristics of the molecular composition in studied samples. Hence, for extraction of precise information on bimolecular composition of the samples, a more relevant approach is required.
To overcome this limitation, the Biomolecular Component Analysis (BCA) 9–17 was developed. The identification of concentrations of biomolecules in BCA is based on an accurate spectral fit of a model spectrum using a linear summation of the weighted spectra of the basic components into a measured Raman spectrum of biological samples. The spectral weights, or coefficients, which are varied during the fitting procedure, yield directly the concentrations of basic macromolecules. The intensity of Raman scattering response is linearly dependent on the concentration of a particular type of molecules in the probe, which allows for quantitative concentration measurements of these biomolecules in situ. Recent studies of our group show that confocal Raman micro-spectroscopy can be successfully utilized for biochemical analysis of specific intracellular domains, as well as for monitoring the intracellular variations in macromolecular composition in real time 17–19.
Besides Raman micro-spectrometry being noninvasive and thus, allowing nondestructive probing of live cultured cells, the spatial resolution in this technique can be adjusted to the submicron level, enabling molecular profiling of distinct organelles, which regulate the cellular metabolism. Our previous studies indicate that organelle - specific Raman probing can dramatically increase the sensitivity of molecular analysis and highly increase the reproducibility of spectral measurements. Moreover, in recent studies by several groups, it has been suggested that the microRaman approach can greatly advance capabilities of organelle-specific proteomics and lipidomics 20–23. One of the most attractive applications of this approach is probing the molecular content in cancer and normal cell lines. Such data can advance molecular medicine with clinical diagnosis and prognosis at molecular level.
In this study, we have applied microRaman-BCA technique for a comparative analysis of WI-38 normal diploid fibroblasts and the cancer HeLa cells. Our analysis was focused on major organelles including nucleoli, endoplasmic reticulum (ER) and mitochondria. These organelles, are involved in vital cellular processes and play significant roles in cellular metabolism.
Following the microRaman-BCA protocols, the Raman spectra were acquired in the targeted organelles for each cell line. Mean Raman spectra of proteins were obtained for each organelle and a comparative analysis between organelle proteins of HeLa and WI-38 cells was performed. Then the concentrations of proteins, lipids and RNA were calculated. Our data indicate significant differences between the molecular content of organelles of these cell lines. These results suggest major differences in biochemical activities for these organelles in the cancerous and non-cancerous cells. Our study further describes key methodological and bio-analytical approaches for Raman spectroscopy of single organelles.
Experimental
Cell culture and fluorescent staining
Cancer HeLa cells and diploid primary cells WI-38 were grown in glass bottom dishes (Mattek) and cultured in Advanced DMEM (Invitrogen), supplemented with 2.5% fetal calf serum (Sigma), 1% glutamax, 1% Antibiotic Antimycotic Solution (Sigma) at 37 C in a humidified atmosphere with 5% CO2. To label mitochondria and ER, cells were incubated in a medium containing either 500 nM MitoTracker® Green FM (Invitrogen) or 1 DM ER-Tracker™Green (Invitrogen), respectively. Then, the cells were washed with PBS, placed in fresh DMEM and used for Raman measurements. The Raman spectra were acquired from 143 HeLa and 68 WI-38 cells for nucleoli, 110 HeLa and 93 WI-38 cells for mitochondria, 39 HeLa and 39 WI-38 cells for ER.
Raman microspectrometry
The confocal Raman microspectrometer system consists of an inverted Nikon TE200 microscope equipped with single frequency laser diode (Ondax, 638 nm, 120 mW) excitation source, fiber-input MS3501i imaging monochromator/spectrograph (Solar TII), and HS101H – 2048/122-HR2 series CCD (Proscan) cooled down to − 30C. The spectral resolution for the fixed diffraction grating position (wave number interval between ~580 and 1800cm−1) was ~1.5 cm−1. The excitation laser beam from a single frequency laser diode (Ondax, 638 nm) of power ~ 70 mW was focused onto the sample in a spot of diameter ~ 0.8 μm, using a 100X Nikon oil-immersion objective lens with NA = 1.3. A 100 μm pinhole provides for confocal acquisition of the Raman signal, which corresponded to a confocal parameter of ~1.8 μm (in FWHM for λ = 638 nm). A series of three Raman spectra were acquired from each organelles with an accumulation time of 60 s per each spectrum, giving a total spectral integration time of 180 s per organelle. For acquisition of organelle-specific Raman spectra, the organelles were visualized as follows: nucleoli were identified by transmitted light microscopy. For identification of mitochondria and ER locations, fluorescent probes MitoTracker® Green and ER-Tracker™Green were used. For fluorescence signal visualization, our microscope is equipped with a xenon light source (X-CiteTM 120 PC), B2-A Nikon filter cube and MicroPublisher 3.3RTW CCD camera (Q-Imaging). To ensure the absence of vibration, any thermal drift or other motion in our system during experiments, we visually verified the XYZ position of the cell and studied organelle before and after each measurement. As was shown in our previous studies, Raman measurements using excitation laser emitted in the red wavelength range did not produce visible changes in cellular morphology and showed no cytotoxicity by standard cell viability tests 16–19.
Processing of Raman Spectra
The background spectra were modeled by fitting to the five background components, as described in our previous publication 16,17, and then subtracted from the measured Raman spectra. After background subtraction, the procedure of Savitzky–Golay smoothing (2nd polynom order, 13 points smoothing frame) and baseline correction were applied to the Raman spectra.
Biomolecular Component Analysis
For processing of multivariate spectral data obtained from the cell organelles, the BCA method that provides detailed quantitative information on the biochemical constituents was applied. In the BCA approach, the concentrations of RNA, DNA, proteins and lipids are obtained from the measured Raman spectra utilizing a linear combination modeling, as described in details in our previous studies 16,17. The BCA algorithm was developed using the Matlab software; it contains several cycles of fitting the weighted model with the measured spectrum, including the separation of DNA and RNA contributions. We used protein component spectrum, obtained from our previous studies of HeLa cell culture 16 corresponding to 100 mg/mL of bovine serum albumin equivalent concentration. Then the protein spectra were defined more accurately during further steps of BCA (see next section). Preprocessed Raman spectra of extracted DNA, RNA, and lipid droplets from HeLa cells, calibrated to 20 mg/mL of calf thymus DNA, Saccharomyces cerevisiae RNA, and bovine heart lipid extract accordingly, were used as the reference spectra for the DNA, RNA, and lipids components.
Establishing the Protein Raman spectrum of organelle
After preprocessing, all Raman spectra measured in a specific organelle of each cell line were averaged and the BCA software for each averaged spectrum was applied. Then the weighted spectra of RNA, DNA and lipids components were subtracted from averaged spectra. The residual spectra belonging to proteins were normalized to weight unit of proteins (100 mg/mL of bovine serum albumin equivalent concentration). These protein components were used for subsequent BCA cycle and for difference analysis.
Results and Discussion
In our study, we applied microRaman-BCA approach for molecular profiling of cellular organelles. The molecular profiling included the analysis of 3D conformations of proteins as well as in situ measurements of absolute concentrations of proteins, lipids and RNA in the studied organelles.
During the Raman measurements, nucleoli were visualized by characteristic dense appearance in the transmitted light, while ER and mitochondria were detected by using commercial fluorescent probes, as described in Methods. The excitation laser beam was focused on these organelles and Raman spectra were acquired.
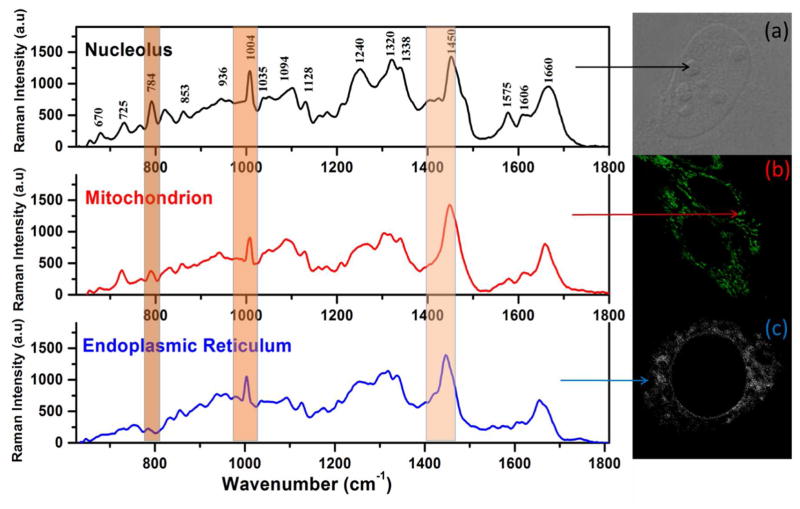
After applying the preprocessing routine, spectra from the different types of organelles demonstrated visible differences. Specifically, the bands at ~ 784cm−1 assigned to the C-C ring breathing vibration of nucleic acids, and at 1004cm−1 assigned to the Phenylalanine aromatic ring in proteins, were the most intense in the nucleoli, followed by ER and mitochondria (Fig. 1). Similarly, the differences in the intensity of another Raman peak at 1450 cm−1 assigned to CH2 stretching in lipids as well as to CH2, and CH3 stretching in proteins 24 are identified in the Raman spectra from different organelles (Fig. 1).
Fig. 1.
Representative preprocessed Raman spectra of different intracellular compartments of HeLa cells and their microscopic images: a) nucleolus; b) mitochondrion; c) endoplasmic reticulum.
At the next step, mean Raman spectra of proteins were obtained for each organelle, and a comparative analysis between organellar proteins of HeLa and WI-38 cells was performed. The BCA method assumes that the nucleolus is composed, mostly of proteins, nucleic acids, and lipid macromolecules, in agreement with conventional biochemical profiling25–28. When DNA, RNA, and lipid weighted model components are subtracted from the averaged Raman spectrum, the remaining spectral profile is assigned to the organellar proteins model component for further analysis, which should allow for identification of differences in organellar proteomes of cancer and normal cell lines.
In contrast to traditional proteomic tools, which involve cell fractioning and organelle isolation with subsequent biochemical analysis, the microRaman BCA allows conformational analysis of organellar proteomes in-situ.
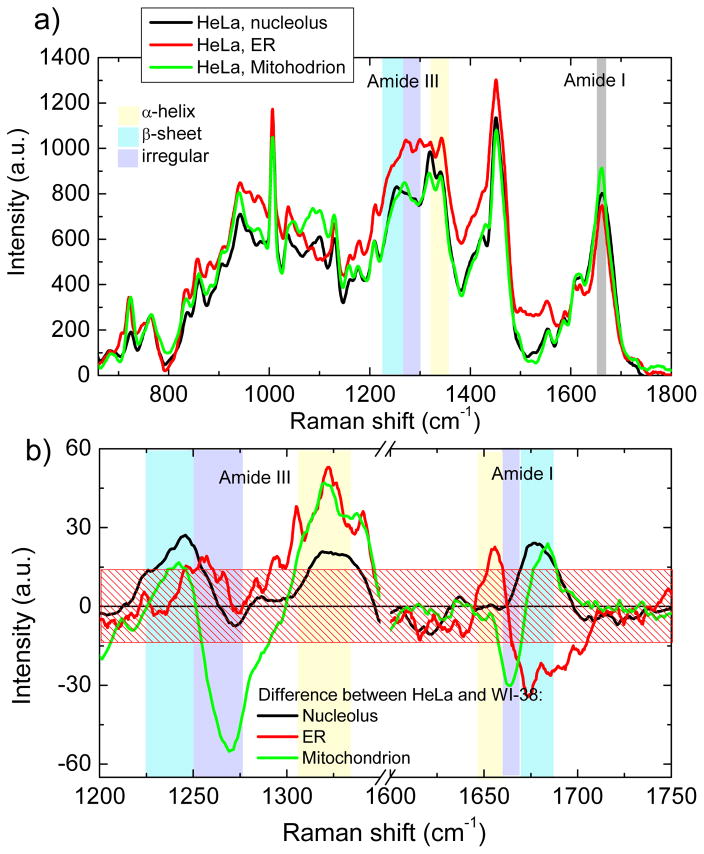
The obtained difference profiles between the averaged protein component spectra of all three organelles between HeLa and WI 38 cells in the spectral ranges of Amide I and Amide III, which reflect conformational structures in protein composition, are presented in Fig. 2.
Fig. 2.
(a) Proteins components of nucleolus (black), ER (red) and mitochondrion (green) in HeLa cells. The wavenumber regions, assigned to different protein conformations are shown as a colored bands. (b) Differential spectra between proteins components of HeLa and WI-38 cells for nucleolus (black), ER (red) and mitochondrion (green) in the Amide I and Amide III wavenumber regions. Standard error, averaged over all spectral range, is shown as a patterned box.
In the Amide-I wavenumber region (1650–1680 cm−1), the difference profiles clearly demonstrate distinctions in the conformations of organelle proteins for cancer and normal cell lines. The positive peak at 1675 cm−1 in the nucleolar difference profile (Fig. 2a) reveals a larger amount of β-sheet and/or irregular structures of nucleolar proteins in HeLa cells as compared to WI-38 cells. The positive peak at 1653 cm−1 falling to the negative peak at 1670 cm−1 in the difference spectrum of ER (Fig. 2b) indicates a larger amounts of the α-helical structure in the ER proteins of HeLa cells and β-sheet conformation of the ER proteome in WI 38 cells. The negative peak at 1665 cm−1 ascending to the positive at 1680 cm−1 for mitochondrial protein difference spectrum (Fig. 2b) points to prevalence in mitochondrial proteins of β-sheet structure in HeLa cells and irregular conformation in WI-38 cells. This conclusion is also confirmed by differences in the wavenumber range assigned to Amide III (1235–1340 cm−1). Higher peak intensity in the area of 1340 cm−1 also could be assigned to higher amount of CH2 sidechains in cytoplasmic proteins of HeLa cells.
At the next step, we applied the BCA to estimate absolute concentrations of proteins, RNA and lipids – macromolecular concentration profiles (MCP)- in the studied organelles. By doing this, we could identify and isolate the spectral contributions of proteins, RNA and lipids to the Raman spectra of the studied organelles and measure their concentration (Materials and Methods). The Raman bands from these types of biomolecules were clearly distinguishable for confident analysis and subsequent molecular concentration profiling. At the same time, BCA did not identify any significant signal from DNA in the studied organelles. This is consistent with the fact that DNA is not present in ER and its concentrations in mitochondria and nucleoli is very low. Hence, we did not investigate the DNA content of organelles in this work.
The isolation of spectral contribution for each type of these biomolecules is illustrated on Fig S1 and S2.
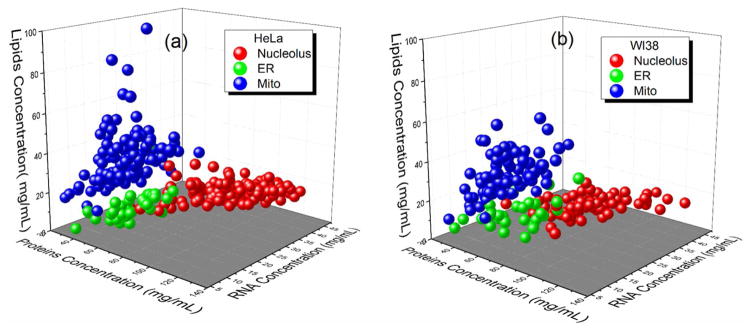
The MCPs obtained for mitochondria, ER and nucleolus in cancer HeLa and normal WI-38 cells were further comparatively analyzed (Fig.3). A statistical analysis of the concentration clusters was carried out by analysis of variance (ANOVA). The level of statistical significance was set at P < 0.05. From pairwise ANOVA follows that the differences between each organellar concentrations are statistically significant for two cell lines, except for RNA in ER and lipids in mitochondrion and ER.
Fig. 3.
3D scatter plots of distribution of RNA, proteins and lipids concentrations in nucleoli, ER and mitochondria of (a) HeLa and (b) WI 38 cell lines.
At the same time, the averaged concentration values for each organelle in HeLa and WI 38 cells were relatively close (Fig 4). Mean concentration values of proteins in HeLa and WI 38 were ~99±13 and ~89±15 mg/ml (~10% difference) in nucleoli, ~64±13 and ~70±14 mg/ml (~8.5% difference) in ER and mitochondria. The corresponding averaged concentration ranges for RNA in studied cell lines were ~32±7 and ~28±7 mg/ml (~12.5% difference) in nucleoli, ~12±4 and ~10±4 mg/ml (~16.5% difference) in mitochondria. For lipids, the averaged concentration in the nucleoli were ~19±4 mg/ml in HeLa cells and 17±4 mg/ml in WI 38 cells (~10.5% difference).
Fig. 4.
Averaged concentrations of proteins (a), RNA (b) and lipids (c) in nucleoli, mitochondria and RE in HeLa and WI-38 cell lines
Further analysis demonstrates that these variations in the molecular composition of the same organelle in different cells are not random. 3D charts show that the MCPs of nucleoli, ER, and mitochondria are clustered into the distinct groups. This clustering was most pronounced in HeLa cells. The margin between the nucleoli and ER/mitochondrion MCPs are easily distinctive in both cell lines. Interestingly, that in WI 38 the overlapping rate between ER and mitochondria MCPs is higher than in the HeLa cell line. It becomes more evident when 3D data sets are presented in different projections (Fig. S3).
Hence, our data represents three layers of information on biomolecular content of organelles.
First, we comparatively analyzed the dominant conformations of proteins into each studied organelle (Fig 2). It is important to emphasize, that each studied organelle contains numerous types of proteins ranging from ~1000 in mitochondria 29, to more than 4500 in nucleolus25, and to over 10 000 protein species (entire HeLa proteome) found in ER30. The BCA results presented here unravel significant differences in the averaged conformations of proteins in ER and mitochondria and nucleoli of WI-38 and HeLa cells. These differences reflect that proteome of studied organelles contain different proteins populations, which could be further analyzed in the context of normal and cancer cells behavior.
Second, we found that the concentrations of proteins, RNA and lipids varies for each cellular organelle (Fig 3). These variations were significant for each cell line.
At the same time, on the average, there were differences between the concentrations of proteins, RNA and lipids into the organelles of WI-38 and HeLa cell lines (Fig.4). The higher concentration of RNA and proteins in the nucleoli of HeLa cells is suggestive of more intense ribosome synthesis than that in WI-38 fibroblasts. Upregulation of ribosome synthesis is essential to drive tumor growth, which has been reported for many types of cancer31. In this regards, our data indicate that an activation of ribosome production involves changes in the molecular composition of nucleoli.
Our analysis of the single-organelle data sets can be summarized as follows:
Proteomes of the same type of organelles in WI-38 and HeLa cells defer in the 3D conformational signatures (Fig. 2). Prevalence of β-sheet in nucleolar and mitochondrion proteomes of HeLa cells was found, while ER proteome in HeLa cells contains larger amount of α-helix.
Cells growing in the same culture exhibit significant variations in the molecular content of organelles. These variations are masked by traditional statistical averaging approaches. At the same time, the single organelle microRaman BCA approach unravels a broad range of differences in the MCPs (Fig. 3).
Each type of the studied organelle contains a characteristic ratio between the proteins, lipids and RNA concentrations.
The biomolecular content in the same organelles of WI-38 and HeLa cells are close, despite the profound differences in the behavior of these cell lines. Notably, the 3D charts demonstrate that MCPs from different organelles in each cell lines occupy distinct clusters with very limited overlap (Fig 4).
We believe that macromolecular profiles of three major cellular organelles in HeLa and WI-38 cells manifests differences in the regulation of essential cellular processes. Increased concentrations of macromolecules in HeLa cells may reflect elevated metabolism common for cancer cells. At the same time, to find and reliably categorize specific cancer-related changes in cellular metabolism, a large number of normal, pre-malignant and malignant cell lines should be comparatively analyzed. In the outcome, Raman profiling of single cellular organelles can offer an independent quantitative biomarkers for cancer diagnostics and cancer biology research.
Conclusion
Here we report on the application of micro-Raman-BCA approach for a comparative analysis of protein conformations prevailing into proteomes of Nucleoli, ER and mitochondria of HeLa and WI-38 cells. Our data quantitatively characterize broad variations in the composition of the cellular organelles in two cell lines. HeLa and WI 38 cell lines were characterized by different composition of organelle proteome, as indicated by different conformation in cancer cells comparing with normal diploid cells. Furthermore, significant differences in the concentrations of biomolecules in these organelles were found. The obtained data demonstrated that the microRaman BCA technique and difference spectroscopy has high potential for cancer cell biology.
Supplementary Material
Acknowledgments
A.N. Kuzmin and A. Pliss were supported by the National Institute of General Medical Sciences of the National Institutes of Health under Award Number R43GM116193. The content is solely the responsibility of the authors and does not necessarily represent the official views of the National Institutes of Health.
Footnotes
Supporting Information Available: Macromolecular profiling of organelles in normal diploid and cancer cells
References
- 1.Chan JW. Journal of Biophotonics. 2013;6:36–48. doi: 10.1002/jbio.201200143. [DOI] [PubMed] [Google Scholar]
- 2.Diem M, Mazur A, Lenau K, Schubert J, Bird B, Miljkovic M, Krafft C, Popp J. Journal of Biophotonics. 2013;6:855–886. doi: 10.1002/jbio.201300131. [DOI] [PubMed] [Google Scholar]
- 3.Kloss S, Rosch P, Pfister W, Kiehntopf M, Popp J. Analytical Chemistry. 2015;87:937–943. doi: 10.1021/ac503373r. [DOI] [PubMed] [Google Scholar]
- 4.Bocklitz TW, Salah FS, Vogler N, Heuke S, Chernavskaia O, Schmidt C, Waldner MJ, Greten FR, Brauer R, Schmitt M, Stallmach A, Petersen I, Popp J. Bmc Cancer. 2016:16. doi: 10.1186/s12885-016-2520-x. [DOI] [PMC free article] [PubMed] [Google Scholar]
- 5.Mahadevan-Jansen A, Mitchell MF, Ramanujam N, Malpica A, Thomsen S, Utzinger U, Richards-Kortum R. Photochem Photobiol. 1998;68:123–132. doi: 10.1562/0031-8655(1998)068<0123:nirsfv>2.3.co;2. [DOI] [PubMed] [Google Scholar]
- 6.Deinum G, Rodriguez D, Romer TJ, Fitzmaurice M, Kramer JR, Feld MS. Appl Spectrosc. 1999;53:938–942. [Google Scholar]
- 7.Hutchings J, Kendall C, Shepherd N, Barr H, Stone N. Journal of Biomedical Optics. 2010;15:0660151–06601510. doi: 10.1117/1.3512244. [DOI] [PubMed] [Google Scholar]
- 8.Kallaway C, Almond LM, Barr H, Wood J, Hutchings J, Kendall C, Stone N. Photodiagn Photodyn. 2013;10:207–219. doi: 10.1016/j.pdpdt.2013.01.008. [DOI] [PubMed] [Google Scholar]
- 9.Buschman HP, Deinum G, Motz JT, Fitzmaurice M, Kramer JR, van der Laarse A, Bruschke AV, Feld MS. Cardiovasc Pathol. 2001;10:69–82. doi: 10.1016/s1054-8807(01)00064-3. [DOI] [PubMed] [Google Scholar]
- 10.Shafer-Peltier KE, Haka AS, Fitzmaurice M, Crowe J, Myles J, Dasari RR, Feld MS. J Raman Spectrosc. 2002;33:552–563. [Google Scholar]
- 11.van de Poll SWE, Kastelijn K, Schut TCB, Strijder C, Pasterkamp G, Puppels GJ, van der Laarse A. Heart. 2003;89:1078–1082. doi: 10.1136/heart.89.9.1078. [DOI] [PMC free article] [PubMed] [Google Scholar]
- 12.Short KW, Carpenter S, Freyer JP, Mourant JR. Biophysical Journal. 2005;88:4274–4288. doi: 10.1529/biophysj.103.038604. [DOI] [PMC free article] [PubMed] [Google Scholar]
- 13.Kunapareddy N, Freyer JP, Mourant JR. J Biomed Opt. 2008;13:054002. doi: 10.1117/1.2978061. [DOI] [PubMed] [Google Scholar]
- 14.Swain RJ, Kemp SJ, Goldstraw P, Tetley TD, Steyens MM. Biophysical Journal. 2010;98:1703–1711. doi: 10.1016/j.bpj.2009.12.4289. [DOI] [PMC free article] [PubMed] [Google Scholar]
- 15.Ong YH, Lim M, Liu Q. Opt Express. 2012;20:22158–22171. doi: 10.1364/OE.20.022158. [DOI] [PubMed] [Google Scholar]
- 16.Kuzmin AN, Pliss A, Prasad PN. Anal Chem. 2014;86:10909–10916. doi: 10.1021/ac503172b. [DOI] [PubMed] [Google Scholar]
- 17.Kuzmin AN, Pliss A, Kachynski AV. J Raman Spectrosc. 2013;44:198–204. [Google Scholar]
- 18.Pliss A, Kuzmin AN, Kachynski AV, Baev A, Berezney R, Prasad PN. Integr Biol (Camb) 2015;7:681–692. doi: 10.1039/c5ib00008d. [DOI] [PubMed] [Google Scholar]
- 19.Pliss A, Kuzmin AN, Kachynski AV, Prasad PN. Biophysical Journal. 2010;99:3483–3491. doi: 10.1016/j.bpj.2010.06.069. [DOI] [PMC free article] [PubMed] [Google Scholar]
- 20.Yadav N, Pliss A, Kuzmin A, Rapali P, Sun L, Prasad P, Chandra D. Cell Death Dis. 2014;5:e1453. doi: 10.1038/cddis.2014.405. [DOI] [PMC free article] [PubMed] [Google Scholar]
- 21.Kuzmin AN, Pliss A, Lim CK, Heo J, Kim S, Rzhevskii A, Gu B, Yong KT, Wen SC, Prasad PN. Sci Rep-Uk. 2016:6. doi: 10.1038/srep28483. [DOI] [PMC free article] [PubMed] [Google Scholar]
- 22.Venkata HNN, Shigeto S. Chem Biol. 2012;19:1373–1380. doi: 10.1016/j.chembiol.2012.08.020. [DOI] [PubMed] [Google Scholar]
- 23.Syed A, Smith EA. Annu Rev Anal Chem (Palo Alto Calif) 2017;10:271–291. doi: 10.1146/annurev-anchem-061516-045317. [DOI] [PubMed] [Google Scholar]
- 24.Zinin PV, Misra A, Kamemoto L, Yu QG, Hu NJ, Sharma SK. J Raman Spectrosc. 2010;41:268–274. [Google Scholar]
- 25.Ahmad Y, Boisvert FM, Gregor P, Cobley A, Lamond AI. Nucleic Acids Res. 2009;37:D181–184. doi: 10.1093/nar/gkn804. [DOI] [PMC free article] [PubMed] [Google Scholar]
- 26.Albi E, Viola Magni MP. Biol Cell. 2004;96:657–667. doi: 10.1016/j.biolcel.2004.05.004. [DOI] [PubMed] [Google Scholar]
- 27.Cave CF, Gahan P. Caryologia. 1970;23:303–312. [Google Scholar]
- 28.Fraschini A, Albi E, Gahan PB, Viola-Magni MP. Histochemistry. 1992;97:225–235. doi: 10.1007/BF00267632. [DOI] [PubMed] [Google Scholar]
- 29.Meisinger C, Sickmann A, Pfanner N. Cell. 2008;134:22–24. doi: 10.1016/j.cell.2008.06.043. [DOI] [PubMed] [Google Scholar]
- 30.Nagaraj N, Wisniewski JR, Geiger T, Cox J, Kircher M, Kelso J, Paabo S, Mann M. Mol Syst Biol. 2011;7:548. doi: 10.1038/msb.2011.81. [DOI] [PMC free article] [PubMed] [Google Scholar]
- 31.Ruggero D, Pandolfi PP. Nat Rev Cancer. 2003;3:179–192. doi: 10.1038/nrc1015. [DOI] [PubMed] [Google Scholar]
Associated Data
This section collects any data citations, data availability statements, or supplementary materials included in this article.


