

SUMMARY
It is increasingly appreciated that alternative splicing plays a key role in generating functional specificity and diversity in cancer. However, the mechanisms by which cancer mutations perturb splicing remain unknown. Here, we developed a network-based strategy, DrAS-Net, to investigate over 2.5 million variants across cancer types and link somatic mutations with cancer-specific splicing events. We identified over 40,000 driver variant candidates and their 80,000 putative splicing targets deregulated in 33 cancer types and inferred their functional impact. Strikingly, tumors with splicing perturbations show reduced expression of immune system-related genes, and increased expression of cell proliferation markers. Tumors harboring different mutations in the same gene often exhibit distinct splicing perturbations. Further stratification of 10,000 patients based on their mutation-splicing relationships identifies subtypes with distinct clinical features, including survival rates. Our work reveals how single nucleotide changes can alter the repertoires of splicing isoforms, providing insights into oncogenic mechanisms for precision medicine.
eTOC BLURB
Li et al. find that DrAS-Net, a network-based method, identifies somatic mutation-mediated alternative splicing (AS) and helps prioritize driver mutations. Distinct target AS profiles help explain cancer heterogeneity and classify cancer patients into subtypes with distinct clinical features.
INTRODUCTION
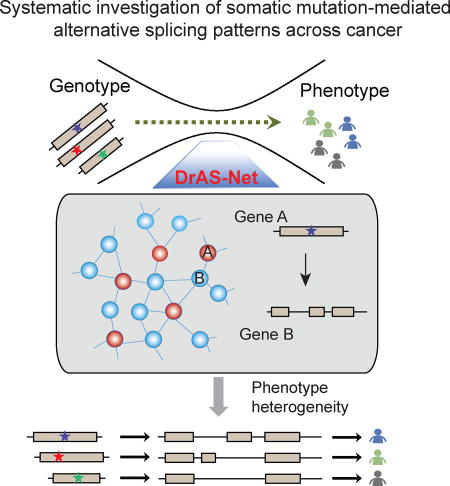
Phenotypic variation and heterogeneity is far more complex in human compared to other species, even though there are similar numbers of genes in the genome. This enigma could be at least partially addressed by studying the extent to which different protein isoforms can be encoded by each genome. It has been increasingly appreciated that alternative splicing is a key factor contributing to protein isoform diversity. In human cancer, for instance, the problem of tumor heterogeneity across patient populations is known to involve alternative splicing. However, the fundamental question of how genomic mutations influence the splicing process leading to cancer is essentially unknown (Figure 1A).
Figure 1. Systematic Characterization of Mutation-Mediated Alternative Splicing Events across 33 Cancer Types.

(A) Alternative splicing (AS) underlies the complexity of genotype-phenotype relationships.
(B) Flowchart of the mutation-mediated alternative splicing (AS) analysis in cancer. Genome-wide mutational profiles of 10,489 samples and AS data from 10,699 samples across 33 types of cancer are integrated into functional networks. Four types of analyses are shown: I) Identification of genome-wide AS alternations in each type of cancer. Differential AS events are identified as cancer-specific splicing compared to controls; II) Prioritization of driver somatic mutations based on the functional networks. The functional importance of mutations is evaluated; III) Proposed mutation-AS model to explain principles of genetic heterogeneity; IV) Clustering analysis based on AS to identify cancer subtypes with distinct clinical features. P, patient.
(C) The average number of AS events per tumor detected in each cancer type from a total of 10,699 samples.
See also Table S1.
Alternative splicing (AS) is a highly regulated process that adds complexity to human transcriptome, proteome and signal transduction networks in the cell (Braunschweig et al., 2014). Over 90% of human protein coding genes produce multiple mRNA isoforms (Wang et al., 2008), thereby AS is one of the main sources of proteomic diversity (Braunschweig et al., 2013). Tissue- and cell-type specific AS patterns have been shown to play critical roles in development and differentiation (Buljan et al., 2012; Ellis et al., 2012; Kalsotra and Cooper, 2011; Zhang et al., 2016). Aberrant AS events have been implicated in complex diseases, including various types of cancer (David and Manley, 2010; Misquitta-Ali et al., 2011; Xu et al., 2014). AS alterations may confer a selective advantage to the tumor, such as cell proliferation, invasion and apoptosis evasion (Dominguez et al., 2016; Oltean and Bates, 2014). The determination of AS deregulation in cancer is therefore of utmost relevance to reveal novel oncogenic mechanisms. Although considerable efforts have been made to study AS alterations in individual cancers, the extent to which aberrant AS perturbations contribute to cancer progression remains largely unknown.
Besides identification of aberrant AS events across cancer types, identifying molecular determinants and mechanisms that perturb AS in cancer is fundamental for the development of cancer-specific biomarkers for prognosis and therapy (Barash et al., 2010; Braunschweig et al., 2013). Lines of evidence have demonstrated that AS alterations in cancer may be caused by changes in expression, amplification and deletions in splicing factors and RNA-binding proteins (Hollander et al., 2016; Raj et al., 2014; Sebestyen et al., 2016; Sveen et al., 2016). Given the complexity of AS events, it is not surprising that they are particularly susceptible to genomic mutations implicated in human cancer (Lu et al., 2012; Maguire et al., 2015; Xing, 2007). Indeed, it has been increasingly appreciated that AS events are influenced by genomic mutations. For instance, genetic variants that affect splicing have been inferred by deep learning algorithms (Wan et al., 2015) and mutations that lead to intron retention have been identified as a pervasive mechanism by which tumor suppressor genes are inactivated in certain cancers (Jung et al., 2015). Nevertheless, the general principles by which somatic mutations lead to AS alterations across diverse cancer types are unknown and have the potential to reveal oncogenic mechanisms in diverse cancers.
Functional networks provide an informative platform to investigate properties of cellular systems (Barabasi and Oltvai, 2004; Vidal et al., 2011). Network-based approaches have been successfully applied to identifying cancer genes (Barabasi et al., 2011; Sonachalam et al., 2012), but the relationships between genomic mutations and global changes in AS are currently enigmatic. It is now clear that patients with the same cancer type have highly heterogeneous genotypes with diverse genomic alterations (Vogelstein et al., 2013; Zhang et al., 2013). Therefore, we urgently need methods to assess the impact of patient-specific mutations on AS events from individual tumors in order to discover personalized driver mutations.
Toward these goals, we developed an integrated, multi-scale framework (hereafter referred to as DrAS-Net; Figure 1B) and performed a large-scale systematic investigation of somatic mutation-mediated AS patterns across 33 types of cancer. Our integrated analysis revealed widespread AS changes across cancer types. Cancer types with similar tissue origins form clusters based on differential AS patterns. By integrating genomic mutations and AS events into functional association networks, we describe a framework to identify patient-specific potential driver mutations that mediate AS alterations in cancer. The identified driver candidates were enriched in cancer hallmark genes, and that cancer subtypes with distinct clinical features could be identified by their AS profiles. In this manner, DrAS-Net provides a valuable approach and resource for detecting candidate driver mutation-mediated AS events in cancer, and helps explain the heterogeneity observed across diverse patient populations.
Results
The alternative splicing landscape across cancer types
The Cancer Genome Atlas (TCGA) RNA sequencing data provide a valuable resource for investigating AS patterns in cancer. We focused on the AS patterns in >10,000 samples across 33 types of cancer. These cancer types were ordered based on their tissue of origin (Figure 1C and Table S1). We identified the frequency of AS events per tumor for each cancer type (Figure 1C). The average number of AS events per tumor varied considerably between cancer types. In our analysis, AS was categorized into seven classes (Figure S1A): exon skipping, alternative donor site, alternative acceptor site, retained intron, mutually exclusive exons, alternative terminator and alternative promoter. We analyzed the distribution of these AS classes across cancer types, and observed that exon skipping was the most frequent class of splice event, while mutually exclusive exons represented a rare class (Figure S1B).
Defects in RNA splicing are an important factor contributing to disease, including cancer. We therefore examined ‘differential AS events’, defined as significantly altered AS events in cancer compared to normal tissues (see details in Methods). We focused on 18 types of cancer, each with more than five normal samples (Wilcoxon rank-sum test, false discovery rate <0.01). After normalization, our analysis showed larger proportion of differential AS events in kidney renal clear cell carcinoma (KIRC, n=5,245) than other cancer types (Figure 2A), probably due to elevated expression of splicing factors during renal carcinogenesis (Piekielko-Witkowska et al., 2010). In contrast, although the number of AS events overall (n=50,342) was the highest in esophageal carcinoma (ESCA), the fewest (n=437) differential AS events were identified, suggesting that most AS events in this cancer might be independent of tumor growth. Moreover, we also found fewer differential AS events in reproductive system cancers, such as prostate adenocarcinoma (PRAD) and uterine corpus endometrial carcinoma (UCEC), than in most of the other cancer types. To further explore the distribution of distinct AS classes among these differential AS events, we observed that exon skipping, alternative promoters, and alternative terminators were among the major classes (Figure S1C), which in total account for 82.86% of the differential AS events (Figure S1D). In contrast, only 0.41% (154/37,723) of the cases belonged to the mutually exclusive exons class in the investigated cancer types (Figure S1D). Together, these results provide evidence for cancer-specific splice isoforms, suggesting widespread splicing perturbations across cancer types.
Figure 2. The Alternative Splicing Landscape in Human Cancer.

(A) Number of detected AS events and differential AS events in each cancer. The red line corresponding to the right y-axis indicates the total number of AS events detected in each cancer type, while the blue bars corresponding to the left y-axis show the number of differential AS events in each cancer (n=18). The numbering of cancer types on the x-axis is the same as Figure 1.
(B) Clustering of cancer types based on the similarity of differential AS patterns. This similarity is computed as the overlap divided by the minimum number of differential AS events between two cancer types. Red and blue colors indicate high and low similarity, respectively. Cancer types of similar tissue origins are grouped together.
(C) Distribution of differential AS events over a wide range of cancer specificity indices. Cancer specificity index is defined as the number of cancer types where a given differential AS occurs; the lower the index, the more specific). Cancer specificity index ranges from 1 (white) to 15 (blue).
(D) ‘Percent spliced in’ (PSI) index distribution of cancer type-specific differential alternative splicing (FGFR1) events in cancer versus normal samples. PSI index indicates how efficiently sequences are spliced into transcripts. Red boxplots indicate PSI distribution in cancer samples while blue boxplots indicate PSI distribution in normal samples.
(E) PSI index distribution of promiscuous differential alternative splicing (LSP1) across multiple cancer types.
(F–H) RNA-seq analysis was performed comparing tumors with versus without differential AS events (pan-cancer analysis), considering tumor type as a covariate. GSEA plots, enrichment scores (ES), and false discovery rates (FDR; q) are shown for representative gene sets depleted in tumors harboring differential AS events.
(I–J) Relationships between the differential AS profiles and cell cycle signature and mutation load predictors reported recently. In the box plots, tumors are divided into those that carry perturbed AS events (green) and those that do not (gray).
See also Figure S1–2 and Table S2.
Cancer types with similar tissue origins share differential AS patterns
Lines of evidence have indicated that cancer types with similar tissue origins share multiple molecular features, such as gene expression, miRNA expression and DNA methylation (Hoadley et al., 2014; Yang et al., 2016b). However, whether cancer types with similar tissue origins exhibit similar AS patterns is unknown. To address this question, we computed a paired similarity score based on differential AS events in each cancer (Figure 2B). Hierarchical clustering analysis indicated that cancer types with similar tissue origins showed similar differential AS patterns, such as KIRC and kidney renal papillary cell carcinoma (KIRP), lung adenocarcinoma (LUAD) and lung squamous cell carcinoma (LUSC), colon adenocarcinoma (COAD) and rectum adenocarcinoma (READ). These data also inform longstanding debates regarding appropriate demarcations of esophageal carcinoma (ESCA) and gastric cancer (STAD) which are clearly separated by differential AS patterns. This result is consistent with a recent study that demonstrated these two cancer types had distinct molecular characteristics in terms of mRNA expression, miRNA expression, DNA methylation and copy number variation (Cancer Genome Atlas Research et al., 2017). Furthermore, cancer types with similar tissue origins also cluster together based on different AS classes (Figure S1E–K). These observations suggest that related mechanisms might operate in cancer types with similar tissue origin.
Specificity and generality of AS events in different cancer types
We next investigated the extent to which differential AS events contributed to cancer specificity. We found that differential AS tended to be highly cancer type-specific, as 41.04% (15,482/37,723) of the differential AS events were detected in only one cancer type (Figure 2C). To further quantify splicing events, we applied the Percent Spliced In (PSI) value (Ryan et al., 2016; Wang et al., 2008), which was defined as the number of reads containing a transcript element divided by the total number of reads, including the AS event. We observed distinct PSI values in tumor samples compared to matched controls. For instance, exon skipping of FGFR1 was detected to be differential in glioblastoma multiforme (GBM), and exhibited high cancer-type specificity (Figure 2D). Alternative splicing of this gene had been demonstrated to be specific in GBM by exon array analysis and FGFR1 can induce GBM radio-resistance (Cheung et al., 2008). These results offered a preclinical proof of concept that targeting FGFR1 might be a new method to GBM therapy. In contrast, our analysis also revealed a small subset of genes that were differentially spliced across multiple cancer types. For example, leukocyte-specific protein 1 (LSP1) is an F-actin binding protein, with mutations implicated in many cancer types. Alternative usage of LSP1 promoter had been demonstrated to play critical roles in myogenesis (Ehrlich and Lacey, 2013). Here, we found that alternative promoter usage of LSP1 occurred in a prevalent manner in 15 types of cancer. Consistently, analysis of the PSI distribution showed lower PSI values in cancer samples compared with normal controls across many cancer types (Figure 2E). These results reveal the existence of AS events that are cancer type-specific and those that are prevalent in diverse cancers. For the benefit of the community, the cancer specificity index as well as the PSI values for AS perturbation events is provided in Supplementary Table S2. This resource can help identify genes and mechanisms that are specific as well as common to different cancers for future studies.
AS perturbation profiles predict immune signatures in cancer
To determine which molecular players were associated with the identified AS alterations in cancer, we searched for cellular signaling pathways in tumors with versus without differential AS events, as shown above (Figure 2A). We compared the gene expression profiles of these tumor samples, and used Gene Set Enrichment Analysis (GSEA) to identify pathways whose expression levels were enriched or depleted in tumor samples with differential AS perturbations (see details in Methods). This analysis was performed across all tumor samples (pan-cancer analysis). Among the pathways up-regulated in tumor samples with AS perturbation were those implicated in DNA replication (adjusted p<0.001, Figure S2A), cell cycle (adjusted p<0.001, Figure S2B) and DNA repair (adjusted p<0.001, Figure S2C). These results suggest that there is increased cell proliferation in tumor samples with perturbed AS events. In contrast, most of the down-regulated pathway signatures were associated with the immune system, such as CD8 T cell receptor pathway (adjusted p=0.002, Figure 2F), chemokine signaling pathway (adjusted p=0.002, Figure 2G) and B cell receptor signaling pathway (adjusted p=0.02, Figure 2H). These observations implicate decreased activity of immune genes in the tumor microenvironment. Moreover, we applied the cell cycle signature score and immune signature score for each tumor sample, which were defined as the average expression level of the genes involved in each signature. We found that the tumor samples with perturbed AS events exhibited significantly higher cell cycle signature score (p=1.96e-10, Wilcoxon rank-sum test, Figure 2I) and lower immune signature score (Figure S2D). These results suggest increased cell proliferation and decreased immune activity in tumors with AS perturbation. Moreover, tumor aneuploidy and mutation load had recently been demonstrated as a possible marker for immune evasion with reduced response to immunotherapy (Davoli et al., 2017). We thus investigated whether AS perturbation in tumor samples correlated with distinct somatic copy number alteration (SCNA) levels. We found that tumor samples with altered AS events had significantly higher chromosome SCNA levels (p=4.2e-4, Wilcoxon rank-sum test, Figure S2E), arm SCNA levels (p=4.6e-4, Wilcoxon rank-sum test, Figure S2F), focal and normalized SCNA levels (p<0.001, Wilcoxon rank-sum test, Figure S2G and S2H), and greater number of mutations (p<2.2e-16, Wilcoxon rank-sum test, Figure 2J). In summary, our results indicate that AS perturbation in cancer provides a predictor of cytotoxic immune cell infiltration, together with other previously described tumor characteristics such as mutation load and aneuploidy. These observations suggest that AS perturbation profiling may help identify cancer patients most likely to respond to immunotherapy.
DrAS-Net: Network-based framework for identifying somatic mutation-mediated AS across cancer types
Our results indicate that there are widespread AS perturbations across cancer types. However, how these AS alterations are determined in cancer is unknown. As splicing changes may be triggered by genetic mutations (Wan et al., 2015), we investigated the extent to which somatic mutations could lead to differential AS of the same or different genomic loci across cancer types. Genes in the cellular system do not function insularly but form functional networks (Cho et al., 2016; Jia and Zhao, 2014). Thus, we postulated that functional association networks could also be leveraged to relate mutations to their consequent effect on AS alterations. To address this, we first investigated the interactions between differential AS genes and highly mutated genes in the context of functional networks (Rolland et al., 2014). We observed that the network neighbors of highly mutated genes (defined as the top 20% of genes in each cancer) were enriched in differential AS genes (in 18 types of cancer for which we had sufficient data). In addition, we obtained similar results for the top 15% and 25% highly mutated genes. These results indicate that mutated genes likely impact the AS alterations of their known interacting partners and suggest that network structure could be used to identify potential regulators of AS events.
We devised a network-based framework to identify mutations that could mediate differential AS events in cancer, referred to as DrAS-Net (Driver mutation-AS interactome Network; Figure 3A and Figure S3A). This model was built upon the idea that gene mutations with functional effects on AS exhibited their impact in the functional association networks. In addition to identifying common somatic mutations that mediate AS in cancer, characterizing personalized genomic mutations in individual cancer patients could reveal new details of complex cancer mechanisms. We therefore identified somatic mutation-mediated AS alterations in functional networks for each cancer sample. Next, a greedy optimization approach was used to detect recurrent mutations that can explain the vast majority of the identified AS alterations in cancer (see details in methods). By applying this method to 33 types of cancer, we identified approximately 60~900 drivers that may determine differential AS events for each cancer type (Figure 3B). The total number of drivers varied considerably between cancer types and was largely consistent with earlier results, with LUSC, LUAD and COAD having higher mutation burdens (Fredriksson et al., 2014). Moreover, we used three independent methods to validate the inferences of the DrAS-Net (Figure S3B–E and Supplementary Note). All these results indicated the network information is valuable for identification of the determinants of AS events.
Figure 3. Identification of Drivers based on Alternative Splicing Perturbations across Cancer Types.

(A) The network-based framework to identify driver mutations and their mediated AS targets. Firstly, mutation (blue) and differential AS (green) matrices are constructed. Next, patient-specific mutation-mediated AS events are identified based functional network structure. All mutation-AS pairs are assembled as a bi-graph and a greedy search method is used to identify driver mutations and AS events.
(B) Number of driver genes identified in each cancer. The light blue bars indicate the number of trans-genes while the light green bars indicate the cis-genes.
(C) Mutation frequency of driver genes and randomly selected genes. P-values (Wilcoxon rank-sum test) less than 0.05 were marked with red stars. Purple boxes indicate the distribution for candidate driver genes, while gray boxes indicate the distribution of background control (random genes).
(D) P-values (log10 transformation, hypergeometric test) for driver gene enrichment analysis for Cancer Census Genes across cancer types.
(E) Enrichment analysis of driver genes for cancer hallmarks. Each column indicates a cancer hallmark-related Gene Ontology (GO) term while each row indicates a type of cancer.
GO terms are ranked based on the hallmarks they belong to. Bigger dots indicate small p-values (hypergeometric test). The ten hallmarks from left to right: self-sufficiency in growth signals; insensitivity to antigrowth signals; evading apoptosis; limitless replicative potential; sustained angiogenesis; tissue invasion and metastasis; genome instability and mutation; tumor-promoting inflammation; evading immune detection; and reprogramming energy metabolism.
The numbering of cancer types (B through E) is the same as in Figure 1.
Network-based model identifies driver genes enriched in cancer-related functions
To investigate whether the network-based method could identify driver genes that were functionally related to cancer, we explored multiple functional features of these genes. So far, the most widely adopted method to identify driver genes is to search for frequently mutated genes within one cancer type (Gonzalez-Perez et al., 2013; Wei et al., 2011). Although driver genes identified in our analysis were not the most mutated genes, we observed that the mutation frequencies of driver genes were significantly higher than those of randomly selected genes in most (75.8%; 25/33) cancer types (Figure 3C, Wilcoxon rank-sum test p-value<0.05). In addition, the mutation frequencies of driver genes were higher in UCEC and SKCM than other cancer types, which may be explained by the higher mutation burden (Kandoth et al., 2013). We next assessed the functional relevance of these driver genes in cancer by examining the Cancer Gene Census (CGC), a database that catalogues genes for which mutations have been causally implicated in cancer (Forbes et al., 2015). The candidate driver genes identified here were significantly enriched in CGC genes (Figure 3D, hypergeometric test p-value<0.05 in 84.8% or 28/33 cancer types). Moreover, network analysis revealed that interacting neighbors of candidate driver genes were also more enriched in CGC genes than expected by chance (Wilcoxon rank-sum test p-value<0.05 for all cancer types).
To further explore their roles in cancer, we performed functional enrichment analysis of candidate driver genes for cancer hallmarks (Figure 3E). This analysis revealed that one or more hallmarks were enriched across different cancer types. Insensitivity to antigrowth signals and evading apoptosis were enriched in almost all cancer types and reprogramming energy metabolism was also enriched in a significant fraction (11/33) of cancer types. Cancer cells with defects in the antigrowth signaling pathway (such as the RB1 and E2F transcription factor mutations identified here) are missing a critical ‘gatekeeper’ of cell cycle progression, thus cancer cells keep growing and dividing (Hanahan and Weinberg, 2011). Altogether, these results indicate that the network-based method that makes use of both the cancer specific mutation and AS data could identify candidate driver genes that are likely to play a functional role in cancer (Table S3). Moreover, we found the identified driver candidate mutations had higher Combined Annotation–Dependent Depletion (CADD) scores, higher conservation and depleted in protein domains, but were likely to locate in disorder regions and linear motifs (Figure S3F–J and Supplemental Note). To investigate whether these mutations led to specific alternative splicing outcomes, we transfected HEK293T cells with plasmids encoding for either wild-type genes or identified mutants. Our results suggest that different genetic mutations likely influence distinctly different AS events in cancer (Figure S3K and Supplemental Note).
Phenotypic heterogeneity explained by somatic mutation-mediated AS
Mutations in the same genes are often associated with multiple clinically distinct phenotypes, including different types of cancer. We observed that some mutated genes could influence different AS events across different cancer types (Figure 4A). To investigate how mutations in the same genes can cause different types of cancer or different subtypes of the same cancer, we proposed two models for explaining this heterogeneity: Different mutations of the same genes could influence distinct AS events in different patients of the same or different cancer types (model-1 and model-2, respectively, in Figure 4B). To determine if the models were responsible for cancer heterogeneity, we compared the similarity in mutation-AS associations between each pair of cancer samples, for both cis (same gene) and trans (different genes) configurations. We observed that about 99.4% of the mutation-AS pairs were grouped to different mutations-different AS events within the same cancer type (Figure 4C), while 99.2% when comparing different cancer types (Figure 4D) (Wilcoxon rank-sum test p<2.2e-16). Together, our results indicate that different driver candidate mutations are likely to influence distinct AS perturbations, accounting for different cancer phenotypes.
Figure 4. Somatic Mutation-Mediated Alternative Splicing Helps Explain Genetic Heterogeneity.

(A) Frequency of mutated gene-AS gene pairs across cancer types. The lower the cancer specificity index, the more cancer type-specific. Higher specificity index indicates a more spread-out pan-cancer manner. The majority of pairs are cancer specific while a small subset is found in multiple cancer types.
(B) The proposed models to explain genetic heterogeneity in the same cancer type or across cancer types. Model-1: different mutations in the same gene affect distinct alternative splicing events in cancer patients of the same cancer type. Model-2: different mutations in the same gene affect distinct alternative splicing events in cancer patients across different cancer types. (C and D) Fraction of different types of mutation-AS pairs. DM, different mutations; SA, same AS event; DA, different AS events. Violin plots show the proportion of DM-SA and DM-DA in the same cancer type (C) or across distinct cancer types (D). Statistical differences are calculated by Wilcoxon rank-sum test (***, p<1.0e-32).
(E) The number of cis-AS events compared to 1,000 random selections of protein pairs of the same number to evaluate statistical significance.
(F) cis-AS example showing mutations in IKZF1 mediating its own AS. The panel shows the exon structure and two representative AS events influenced by two mutations in the same gene.
(G) P-values (log10 transformation, hypergeometric test) for driver gene enrichment analysis for RNA-binding proteins across cancer types. The numbering of cancer types is the same as in Figure 1.
(H) Proportion of RBP binding target genes identified by CLIP-seq experiments, for the differential AS gene group versus the group of other genes.
(I) trans-AS example showing mutations in the RBP gene EIF4E2 influencing the AS events of EIF4ENIF1 in breast invasive carcinoma (BRCA). The panel shows the exon structure of the target gene EIF4ENIF1 and two representative AS events in EIF4ENIF1 influenced by two EIF4E2 mutations.
(J) Structural and functional features of the EIF4ENIF1 alternative splicing. The structure of EIF4ENIF1 is from the PDB database. The lost regions are marked with orange color. The possible functional consequences are shown on the right panel.
See also Figure S4.
To determine the extent to which somatic mutations influence AS perturbations in cancer, we first focused on the cis-AS events identified in our study. We found approximately 3.68% of differential AS events to be in the cis configuration across all cancer types. This proportion was significantly higher than randomly selected pairs (p<0.001, randomization test, Figure 4E), suggesting that AS events are likely to be influenced by mutations in the same gene. For instance, IKAROS, encoded by the IKZF1 gene, is a pivotal transcription factor that plays important roles in cancer. We found that several somatic mutations in IKZF1 could influence the AS pattern in cis. In total, five mutations modulated the exon 7–9 skipping while four mutations influenced the exon-6 skipping in multiple cancer types. Specifically, the mutation A79T influenced an AS event (exon 7–9 skipping) in LUAD, resulting in the loss of the Zinc finger type 2–4 domains. Another mutation G43E led to the exon-6 skipping in LUSC, which caused the loss of the Zinc finger type-1 domain (Figure 4F). Moreover, the patient with exons 7–9 skipping showed a shorter survival rate. These results suggest that somatic mutations could likely affect the AS profile of the same gene (cis configuration), and different mutations of the same gene may result in distinct cis-AS alterations.
It is known that RNA-binding proteins (RBPs) could act in trans to trigger specific AS changes in other genes in several cancer types (Brooks et al., 2015; Sebestyen et al., 2016). We obtained 1,348 genes encoding known and predicted RBPs from one of the previous studies (Sebestyen et al., 2016). Our analysis showed that the identified driver genes in our study were significantly enriched in RBPs (Figure 4G, hypergeometric test p-value<0.05 for 81.2% or 27/33 cancer types), pointing to the possible role of these driver genes in AS regulation in cancer. Moreover, we integrated the eCLIP-Seq and shRNA-Seq datasets to uncover the genome wide RBP-binding profile (Sundararaman et al., 2016; Van Nostrand et al., 2016). We found that the mutation-perturbed AS genes we identified were more likely to be RBP targets than non-perturbed genes (Figure 4H, p<2.2e-16, Fisher’s exact test).
Our results have provided insights into possible protein-level effects of differential splicing in cancer, and have identified perturbations of different types of protein modules that are known to mediate crucial functions. For example, EIF4ENIF1 (also known as 4E-T) has been demonstrated to play critical roles in cancer (Martinez et al., 2015) and alternative splicing of this gene could promote pathological angiogenesis (Chang et al., 2014). Here, we found that aberrant splicing in EIF4ENIF1 was likely influenced by mutations in the RBP gene EIF4E2 in breast cancer (Figure 4I). In cancer patients, different EIF4E2 mutations tended to affect distinct AS events in EIF4ENIF1. For instance, one of the patients harbored the R202Q mutation, which likely mediated the skipping of exons 6–7 of EIF4ENIF1. Loss of these exons caused the elimination of the EIF4ENIF1 nuclear localization signal motif, which is known to impair the nucleocytoplasmic shuttling of EIF4ENIF1 protein as well as the coupled nuclear import of EIF4E (Dostie et al., 2000). Therefore this AS event results in the loss of important EIF4E nuclear functions (Strudwick and Borden, 2002) (Figure 4J). In another patient, the EIF4E2 mutation W148L was identified to influence the skipping of exon 12 of EIF4ENIF1, resulting in the loss of residues 505–527 which do not encompass any known functional sites of the protein. Intriguingly, we found that these different AS perturbations were associated with distinct survival rates, with the former patient shorter than the latter one. The former patient was in stage II while the latter one was stage I. These results suggest that different mutations result in distinct phenotypes likely by modulating different AS events. Besides the loss of signal motifs by AS perturbation, we also observed in other patients that aberrant splicing might cause loss of signal transduction domains, non-domain functional regions, or catalytic domains in cancer (Figure S4). Together, our results that link single nucleotide mutations to AS events can provide mechanistic insights into how mutations can result in cancer progression. It also suggests that the identification of AS profiles mediated by patient-specific mutations could be a valuable strategy and resource to help explain the phenotypic heterogeneity in the same or different cancer types.
Mutation-mediated AS identifies cancer subtypes associated with distinct survival rates
To explore the prognosis potential of AS events, we first divided the tumor samples into discovery set and validation set. The Cox regression model was trained using the discovery dataset and the trained model was validated in validation set (Figure 5A). The AS events identified by DrAS-Net that with concordance index larger than 0.5 and p-value less than 0.05 were identified as clinical associated AS events (Figure S5A). Next, we grouped cancer samples based on these AS events using consensus clustering (Wilkerson and Hayes, 2010). In total, we found that a considerable fraction (36.4%; 12/33) of cancer types can be grouped into subtypes with distinct survival rates. In addition, we randomly grouped samples into the same number of subtypes as consensus clustering, and then the survival rates were compared with log-rank test. As a result, we also observed the p-values were significantly less than those of random conditions in most cancer types (p-values<0.05; Figure 5B). These results indicate that the driver AS events may be promising biomarkers in these cancer types.
Figure 5. Alternative Splicing Perturbation Reveals Cancer Subtypes with Distinct Clinical Features.

(A) The workflow to discover the clinical associated AS events. The tumor samples in each cancer type were divided into discovery set and validation set. Cox regression model was trained using the discovery set and validated in the remaining samples. AS events with concordance index greater than 0.5 and p-value less than 0.05 were identified as clinical associated.
(B) The survival differences of different cancer subtypes revealed by alternative splicing clustering analysis. The cancer samples are randomly divided into the same number of subtypes as revealed by AS clustering, and the survival difference p-values are calculated by log-rank test. −log10(p) values are plotted as boxplots. The log-rank p values obtained in real conditions are marked with red dots. The numbering of cancer types is the same as in Figure 1.
(C) Consensus clustering of LIHC patients (n=371) based on the mutation-mediated AS events. The color intensity indicates the consistency (ranging from 0 to 1, from light to dark blue) for each pair of samples that are clustered together in 100 times of sampling.
(D) Kaplan-Meier plot of survival for five subtypes in LIHC. The survival difference among five clusters is calculated by log-rank test (p=4.61e-3).
(E) Overlap of mutated genes that mediate AS events in five subtypes. The top enriched functional terms by the mutated genes are marked.
(F) Consensus clustering of LGG patients (n=514) based on the mutation-mediated AS events. The color intensity indicates the consistency (ranging from 0 to 1, from light to dark blue) for each pair of samples that are clustered together in 100 times of sampling.
(G) Kaplan-Meier plot of survival for five subtypes in LIHC. The survival difference among five clusters is calculated by two-sided log-rank test (p<2.2e-16).
For example, this analysis revealed five subtypes in liver hepatocellular carcinoma (LIHC, n=371) (Figure 5C and Figure S5B–C). Patients of the same subtype were distributed among different tumor stages (Figure S5D), indicating that the AS-based classification is independent from tumor stage. A recent large-scale study found that a high body mass index (BMI) was associated with an increase in liver cancer risk (Campbell et al., 2016). We thus explored whether cancer patients within different subtypes had distinct weight profiles. We observed that patients in the subtype-2 group had significantly higher weight than other subtypes (Figure S5E). Strikingly, there was a significant difference in the overall survival of patients among these subtypes (Figure 5D, log-rank test p-value=4.61e-3). Specifically, patients in the subtype-1 and subtype-3 groups were with shorter survival time. Next, we investigated whether these AS events in each subtype were driven by distinct mutated genes. As shown in Figure 5E, we observed only four mutated genes were shared in these five subtypes. Functional enrichment analysis also suggested that these mutated genes of different subtypes were enriched in different functions, such as genes in cluster-1 were enriched in TNF signaling pathway whereas mutated genes in cluster-3 were enriched in Viral carcinogenesis (Table S4). As another validation, we also clustered LGG (n=514) samples based on mutation-mediated AS events. Clustering analysis revealed five subtypes (Figure 5F) with significantly different survival patterns (Figure 5G, log-rank test p-value<2.2e-16). Moreover, we found that these distinct subtypes with distinct age of onset (Figure S5H) and with mutated genes enriched in different pathways (Figure S5I). Furthermore, our results suggest that profiling AS events is an important strategy for subtype stratification, which is independent of gene expression deregulation in cancer (Figure S5J–K). Taken together, our data reveal critical driver mutations, important clinical and biological trends associated with AS in cancer, and suggest putative molecular mechanism for mutation-mediated regulation of specific AS events.
DrAS-Net interface: A user-friendly online tool to explore mutation-AS relationships in cancer
To facilitate researchers to apply the principles described in this work on any mutation or AS of interest, we have developed a comprehensive and interactive web resource in DrAS-Net (http://www.bio-bigdata.com/dras_net/; and Table S5). The features provided in the resource, which will be continuously updated, should serve as a guide for biologists interested in identifying the genetic determinants of splicing specificity for various applications (for example, RNA editing and pleotropic studies) and understanding the consequences of mutations (for example, driver mutations and natural variation) in cancer patients and healthy individuals.
Discussion
In this study, we have performed a systematic characterization of AS across various cancer types, and reveal widespread AS perturbations in human cancers. Importantly, cancer types with similar tissue origins share common differential AS patterns. Although the majority of AS events are cancer type-specific (such as FGFR1), some genes (such as LSP1 and KRT222) show consistent AS alterations across various types of cancer. This points to the existence of cancer-specific and general mechanisms that might contribute to disease progression. Strikingly, we have found that tumors with aberrant splicing isoforms tend to exhibit decreased expression levels of immune system-related genes, and increased expression levels of cell cycle marker genes. This provides potential immune markers and promising targets for immunotherapy in diverse cancer types. Together, the comprehensive AS perturbation landscape identified here provides a valuable resource for further mechanistic and functional studies for the research community (Table S5).
Given the widespread AS perturbations in cancer, it is important to determine how these AS events are mediated. Previous studies have suggested AS alterations in cancer may be caused by changes in expression, amplification and deletions in splicing factors and RNA-binding proteins (Oltean and Bates, 2014; Sebestyen et al., 2016). Another possibility is alteration in DNA methylation and chromatin modifications, which has been observed to be responsible for AS aberration (Lev Maor et al., 2015). Moreover, some case studies have demonstrated that the AS events are influenced by genomic mutations. But how somatic mutations mediate AS events on a pan-cancer scale was unknown. Here, we developed a network-based framework, DrAS-Net, to identify to what extent the observed AS perturbations are regulated by somatic mutations. The application of our method to 33 types of cancer reveals mutation-AS functional associations for each cancer patient. In contrast to frequency-based approaches, network-based methods can detect moderately or even rarely mutated genes with functional relevance. In addition, identifying patient-specific driver mutations and the AS events they influence can provide mechanistic insights and enables a more personalized approach for cancer treatment.
We provide insights into possible functional consequences of losing crucial protein modules (catalytic domains, signaling domains, functional regions and short linear motifs) due to differential AS events in cancer that are mediated by somatic mutations (Figure 4 and Figure S4). These results indicate that deregulation of AS may rewire cellular networks or signaling pathways in cancer. Recently, Yang et al. investigated the interaction profiles of different isoforms and proposed a central role for alternative splicing in network organization in different tissues of healthy individuals (Yang et al., 2016a). However, the drivers of this reorganization, i.e. how interaction networks or signaling pathways are perturbed in specific cancer patients remains to be discovered in the future. In this context, our study reveals that mutation-mediated AS events can serve as valuable biomarkers for cancer subtype stratification. Further analyses in LIHC and LGG demonstrate that these AS subtypes have distinct survival rates. In addition, compared with transcriptome-based cancer subtypes, we found that these AS-based subtypes are not driven by gene expression. These observations suggest that subtype-specific AS events are an independent and informative measure for cancer subtyping. Based on the observation that AS events in each cancer subtype are influenced by distinct mutations, we have proposed two models to help interpret the phenotypic heterogeneity. Many of the identified mutation-AS events occur in a patient-specific manner, indicating that somatic mutations are likely an important component in determining patient-specific splicing perturbation and tumorigenesis. Furthermore, our finding that cancer patients with AS perturbations exhibit reduced immune signature, has provided insights into strategies for potential immunotherapy. For instance, differential AS profiles of specific membrane proteins in cancer can be exploited for defining epitopes for CAR T cell development and design for cancer therapy.
In summary, we have systematically characterized the widespread AS perturbations across cancer types and presented a patient-specific mutation-AS network analysis method to prioritize cancer driver genes and mutations. Our method and results presented here will be useful for investigators who explore cancer genes through rapidly emerging next-generation sequencing applications in cancer research and personalized medicine. We hope that the resource that we provide in this study will serve as an inspiration for several future investigations in diverse cancer types.
Experimental Procedures
Further details and an outline of resources used in this work can be found in Supplemental Experimental Procedures.
Construction of DrAS-Net (Driver mutation-AS interactome Network)
We developed an integrated analysis framework to identify the mutation-mediated AS in cancer. This approach relates genomic mutations to AS patterns, informed by known interactions between genes. Firstly, the genomic mutations in 10,489 samples across 33 types of cancer were downloaded from TCGA website. For each cancer, we transformed these mutations into a gene-patient matrix, M(i, j), which represents a binary matrix to indicate whether the mutations were observed in a specific patient.
Next, the AS datasets in each cancer were converted to another gene-patient matrix, AS(i, J). This matrix indicates whether the AS of gene i in patient j is different from the population-level PSI distribution for that gene. Whether an AS event in a specific sample is defined as differential, we followed the following rules:
where Q3 and Q1 were the 75th and 25th percentiles of PSI distribution across all cancer samples. We hypothesized that if the mutated genes in a patient can affect the AS of other genes, they should have some functional links in known functional networks. Thus, for each patient Pk, we identified the gene pair gi-gj that satisfied the following three rules: gi is mutated; gj exhibits differential AS and gi and gj interact according to known PPI. Here, a systematic unbiased map of ~14,000 high-quality human functional interaction was used in our analyses (Rolland et al., 2014). Then we integrated all the gene pairs in each patient and constructed the mutation mediated AS network in each cancer. In addition, these pairs were divided into cis- and trans-regulation. If the same gene is mutated and also with different AS in the same patient, we considered this as cis-regulations otherwise as trans-regulation.
After assembling all the mutated gene-AS associations in each patient, we constructed a bipartite network for each cancer. Next, we prioritized the mutated genes by identifying genes with the largest extent of AS disruption in cancer. The mutated genes in each bipartite network were ranked by degree (the number of mis-spliced events they mediate), and then for each iteration, we calculated the saturation index (S) of perturbed AS events, defined by the obtained mutation-mediated AS events divided by the total number of perturbed AS events in cancer. We chose a mutated gene that covered the largest number of perturbed AS events. The greedy algorithm was stopped when all the AS events were covered. Then the mutations in the identified genes in the corresponding sample were assembled as driver mutations in each cancer. This prioritization was only applied to trans-regulations. All the cis-regulated mutations were added to the driver list (Figure S3A). We developed a web interface to host the DrAS-Net (http://www.bio-bigdata.com/dras_net/index.jsp), which includes a summary of the features in DrAS-Net, describing mutation–induced splicing perturbation profiles in cancer. These features allow users to investigate various aspects of splicing specificity and patient mutation-specific perturbation information across all human cancer types. The R scripts to perform this process can be accessed from GitHub (https://github.com/lyshaerbin/DrASNet).
Supplementary Material
#C: the number of cancer samples with AS; #N: the number of normal samples with AS; #M: the number of samples with somatic mutations; #Mut: the number of mutations in each cancer.
(S0) The top ten common differential alternative splicing events and the most significant differential alternative splicing events in each cancer type.
(S1–S18) List of differential alternative splicing events in 18 types of cancer.
Each row indicates a Gene Ontology term and each column indicates one type of cancer, the values are the p-values of hypergeometric test. ‘NA’ indicates there are fewer than three overlaps between the genes of interest and the functional term.
(A) LIHC cancer subtypes; (B) UCEC cancer subtypes. #Gene: Number of genes annotated in each pathway; C: Total number of genes in each pathway; rawP: P-values of hypergeometric test; adjP: BH-corrected p-values.
(S1–S33) for 33 types of cancer. Sample: TCGA samples; ASgene: genes with alternative splicing; mutgene: Mutated gene; chr: the chromosome where the mutation occurs; start: mutation start position in the genome; end: mutation end position in the genome; mutation type: mutation type; AS ID: the AS ID in the TCGASplice database; ref: wild allele of the mutation; mut: mutant allele; mutAA: the protein changes associated with the mutation; AS_type: alternative splicing classes; exons: the altered exon for this AS event; mode: gain or loss of sequence for a given AS event.
HIGHLIGHTS.
Analysis of somatic mutation-mediated alternative splicing helps prioritize driver mutations
Network-based method links single nucleotide changes to splicing alterations in each cancer patient.
Alternative splicing profiles classify cancer patients into subtypes with distinct clinical features
Somatic mutation-mediated alternative splicing helps explain cancer heterogeneity
Acknowledgments
This work was supported by the Cancer Prevention and Research Institute of Texas (CPRIT) New Investigator Grant RR160021, the University of Texas System Rising STARs award, the NIH/NCI award number P30CA016672 and the University Center Foundation via the Institutional Research Grant program at the University of Texas MD Anderson Cancer Center (to N.S.). We also acknowledge support from the Medical Research Council of the UK (MC_U105185859; M.M.B., R.P.) and the EMBO Long Term Fellowship (ALTF 702-2015; R.P.). M.M.B. is a Lister Institute Research Prize Fellow. J.C.-H. is funded by a Canadian Institutes of Health Research (CIHR) postdoctoral fellowship. M.T. is a Canada Research Chair in Systems and Synthetic Biology, and is supported by a CIHR grant (MOP-126129), the Canadian Cancer Society Research Institute (703906), the National Institutes of Health (R01RR024031), and by an award from the Ministère de l’enseignement supérieur, de la recherche, de la science et de la technologie du Québec through Génome Québec. We are grateful to contributions from TCGA Research Network and TCGASpliceSeq Analysis Working Group. We thank the high-performance computing core facility for computing, and the Department of Scientific Publications at MD Anderson for editorial assistance.
Footnotes
Publisher's Disclaimer: This is a PDF file of an unedited manuscript that has been accepted for publication. As a service to our customers we are providing this early version of the manuscript. The manuscript will undergo copyediting, typesetting, and review of the resulting proof before it is published in its final citable form. Please note that during the production process errors may be discovered which could affect the content, and all legal disclaimers that apply to the journal pertain.
Supplemental Information includes Supplemental notes, Supplemental Experimental Procedures, five figures, and five tables and can be found with this article online.
AUTHOR CONTRIBUTIONS
S.Y. and N.S. conceived of the project. Y.L., S.Y., R.P. and D.J.M. designed and performed the research, with contributions from J.X., X.H., J.C.-H., B.T., D.S., L.H., X.J.. M.R., M.T., S.-Y.L., M.M.B. and X.J. provided constructive feedback. S.Y., M.M.B. and N.S. supervised research and provided critical advice on the study. Y.L., N.S., S.Y. and M.M.B. wrote the manuscript, with input from other co-authors.
COMPETING FINANCIAL INTERESTS
The authors declare no competing financial interests.
References
- Barabasi AL, Gulbahce N, Loscalzo J. Network medicine: a network-based approach to human disease. Nature reviews. Genetics. 2011;12:56–68. doi: 10.1038/nrg2918. [DOI] [PMC free article] [PubMed] [Google Scholar]
- Barabasi AL, Oltvai ZN. Network biology: understanding the cell’s functional organization. Nature reviews. Genetics. 2004;5:101–113. doi: 10.1038/nrg1272. [DOI] [PubMed] [Google Scholar]
- Barash Y, Calarco JA, Gao W, Pan Q, Wang X, Shai O, Blencowe BJ, Frey BJ. Deciphering the splicing code. Nature. 2010;465:53–59. doi: 10.1038/nature09000. [DOI] [PubMed] [Google Scholar]
- Braunschweig U, Barbosa-Morais NL, Pan Q, Nachman EN, Alipanahi B, Gonatopoulos-Pournatzis T, Frey B, Irimia M, Blencowe BJ. Widespread intron retention in mammals functionally tunes transcriptomes. Genome research. 2014;24:1774–1786. doi: 10.1101/gr.177790.114. [DOI] [PMC free article] [PubMed] [Google Scholar]
- Braunschweig U, Gueroussov S, Plocik AM, Graveley BR, Blencowe BJ. Dynamic integration of splicing within gene regulatory pathways. Cell. 2013;152:1252–1269. doi: 10.1016/j.cell.2013.02.034. [DOI] [PMC free article] [PubMed] [Google Scholar]
- Brooks AN, Duff MO, May G, Yang L, Bolisetty M, Landolin J, Wan K, Sandler J, Booth BW, Celniker SE, et al. Regulation of alternative splicing in Drosophila by 56 RNA binding proteins. Genome research. 2015;25:1771–1780. doi: 10.1101/gr.192518.115. [DOI] [PMC free article] [PubMed] [Google Scholar]
- Buljan M, Chalancon G, Eustermann S, Wagner GP, Fuxreiter M, Bateman A, Babu MM. Tissue-specific splicing of disordered segments that embed binding motifs rewires protein interaction networks. Molecular cell. 2012;46:871–883. doi: 10.1016/j.molcel.2012.05.039. [DOI] [PMC free article] [PubMed] [Google Scholar]
- Campbell PT, Newton CC, Freedman ND, Koshiol J, Alavanja MC, Beane Freeman LE, Buring JE, Chan AT, Chong DQ, Datta M, et al. Body Mass Index, Waist Circumference, Diabetes, and Risk of Liver Cancer for U.S. Adults. Cancer research. 2016;76:6076–6083. doi: 10.1158/0008-5472.CAN-16-0787. [DOI] [PMC free article] [PubMed] [Google Scholar]
- Cancer Genome Atlas Research, N., Analysis Working Group. Asan U, Agency BCC, Brigham Women’s H, Broad I, Brown U, Case Western Reserve U, Dana-Farber Cancer I, Duke U et al. Integrated genomic characterization of oesophageal carcinoma. Nature 2017 [Google Scholar]
- Chang SH, Elemento O, Zhang J, Zhuang ZW, Simons M, Hla T. ELAVL1 regulates alternative splicing of eIF4E transporter to promote postnatal angiogenesis. Proceedings of the National Academy of Sciences of the United States of America. 2014;111:18309–18314. doi: 10.1073/pnas.1412172111. [DOI] [PMC free article] [PubMed] [Google Scholar]
- Cheung HC, Baggerly KA, Tsavachidis S, Bachinski LL, Neubauer VL, Nixon TJ, Aldape KD, Cote GJ, Krahe R. Global analysis of aberrant pre-mRNA splicing in glioblastoma using exon expression arrays. BMC genomics. 2008;9:216. doi: 10.1186/1471-2164-9-216. [DOI] [PMC free article] [PubMed] [Google Scholar]
- Cho A, Shim JE, Kim E, Supek F, Lehner B, Lee I. MUFFINN: cancer gene discovery via network analysis of somatic mutation data. Genome biology. 2016;17:129. doi: 10.1186/s13059-016-0989-x. [DOI] [PMC free article] [PubMed] [Google Scholar]
- David CJ, Manley JL. Alternative pre-mRNA splicing regulation in cancer: pathways and programs unhinged. Genes & development. 2010;24:2343–2364. doi: 10.1101/gad.1973010. [DOI] [PMC free article] [PubMed] [Google Scholar]
- Davoli T, Uno H, Wooten EC, Elledge SJ. Tumor aneuploidy correlates with markers of immune evasion and with reduced response to immunotherapy. Science. 2017;355 doi: 10.1126/science.aaf8399. [DOI] [PMC free article] [PubMed] [Google Scholar]
- Dominguez D, Tsai YH, Weatheritt R, Wang Y, Blencowe BJ, Wang Z. An extensive program of periodic alternative splicing linked to cell cycle progression. eLife. 2016;5 doi: 10.7554/eLife.10288. [DOI] [PMC free article] [PubMed] [Google Scholar]
- Dostie J, Ferraiuolo M, Pause A, Adam SA, Sonenberg N. A novel shuttling protein, 4E-T, mediates the nuclear import of the mRNA 5’ cap-binding protein, eIF4E. The EMBO journal. 2000;19:3142–3156. doi: 10.1093/emboj/19.12.3142. [DOI] [PMC free article] [PubMed] [Google Scholar]
- Ehrlich M, Lacey M. DNA methylation and differentiation: silencing, upregulation and modulation of gene expression. Epigenomics. 2013;5:553–568. doi: 10.2217/epi.13.43. [DOI] [PMC free article] [PubMed] [Google Scholar]
- Ellis JD, Barrios-Rodiles M, Colak R, Irimia M, Kim T, Calarco JA, Wang X, Pan Q, O’Hanlon D, Kim PM, et al. Tissue-specific alternative splicing remodels protein-protein interaction networks. Molecular cell. 2012;46:884–892. doi: 10.1016/j.molcel.2012.05.037. [DOI] [PubMed] [Google Scholar]
- Forbes SA, Beare D, Gunasekaran P, Leung K, Bindal N, Boutselakis H, Ding M, Bamford S, Cole C, Ward S, et al. COSMIC: exploring the world’s knowledge of somatic mutations in human cancer. Nucleic acids research. 2015;43:D805–811. doi: 10.1093/nar/gku1075. [DOI] [PMC free article] [PubMed] [Google Scholar]
- Fredriksson NJ, Ny L, Nilsson JA, Larsson E. Systematic analysis of noncoding somatic mutations and gene expression alterations across 14 tumor types. Nature genetics. 2014;46:1258–1263. doi: 10.1038/ng.3141. [DOI] [PubMed] [Google Scholar]
- Gonzalez-Perez A, Mustonen V, Reva B, Ritchie GR, Creixell P, Karchin R, Vazquez M, Fink JL, Kassahn KS, Pearson JV, et al. Computational approaches to identify functional genetic variants in cancer genomes. Nature methods. 2013;10:723–729. doi: 10.1038/nmeth.2562. [DOI] [PMC free article] [PubMed] [Google Scholar]
- Hanahan D, Weinberg RA. Hallmarks of cancer: the next generation. Cell. 2011;144:646–674. doi: 10.1016/j.cell.2011.02.013. [DOI] [PubMed] [Google Scholar]
- Hoadley KA, Yau C, Wolf DM, Cherniack AD, Tamborero D, Ng S, Leiserson MD, Niu B, McLellan MD, Uzunangelov V, et al. Multiplatform analysis of 12 cancer types reveals molecular classification within and across tissues of origin. Cell. 2014;158:929–944. doi: 10.1016/j.cell.2014.06.049. [DOI] [PMC free article] [PubMed] [Google Scholar]
- Hollander D, Donyo M, Atias N, Mekahel K, Melamed Z, Yannai S, Lev-Maor G, Shilo A, Schwartz S, Barshack I, et al. A network-based analysis of colon cancer splicing changes reveals a tumorigenesis-favoring regulatory pathway emanating from ELK1. Genome research. 2016;26:541–553. doi: 10.1101/gr.193169.115. [DOI] [PMC free article] [PubMed] [Google Scholar]
- Jia P, Zhao Z. VarWalker: personalized mutation network analysis of putative cancer genes from next-generation sequencing data. PLoS computational biology. 2014;10:e1003460. doi: 10.1371/journal.pcbi.1003460. [DOI] [PMC free article] [PubMed] [Google Scholar]
- Jung H, Lee D, Lee J, Park D, Kim YJ, Park WY, Hong D, Park PJ, Lee E. Intron retention is a widespread mechanism of tumor-suppressor inactivation. Nature genetics. 2015;47:1242–1248. doi: 10.1038/ng.3414. [DOI] [PubMed] [Google Scholar]
- Kalsotra A, Cooper TA. Functional consequences of developmentally regulated alternative splicing. Nature reviews. Genetics. 2011;12:715–729. doi: 10.1038/nrg3052. [DOI] [PMC free article] [PubMed] [Google Scholar]
- Kandoth C, McLellan MD, Vandin F, Ye K, Niu B, Lu C, Xie M, Zhang Q, McMichael JF, Wyczalkowski MA, et al. Mutational landscape and significance across 12 major cancer types. Nature. 2013;502:333–339. doi: 10.1038/nature12634. [DOI] [PMC free article] [PubMed] [Google Scholar]
- Lev Maor G, Yearim A, Ast G. The alternative role of DNA methylation in splicing regulation. Trends in genetics : TIG. 2015;31:274–280. doi: 10.1016/j.tig.2015.03.002. [DOI] [PubMed] [Google Scholar]
- Lu ZX, Jiang P, Xing Y. Genetic variation of pre-mRNA alternative splicing in human populations. Wiley interdisciplinary reviews. RNA. 2012;3:581–592. doi: 10.1002/wrna.120. [DOI] [PMC free article] [PubMed] [Google Scholar]
- Maguire SL, Leonidou A, Wai P, Marchio C, Ng CK, Sapino A, Salomon AV, Reis-Filho JS, Weigelt B, Natrajan RC. SF3B1 mutations constitute a novel therapeutic target in breast cancer. The Journal of pathology. 2015;235:571–580. doi: 10.1002/path.4483. [DOI] [PMC free article] [PubMed] [Google Scholar]
- Martinez A, Sese M, Losa JH, Robichaud N, Sonenberg N, Aasen T, Ramon YCS. Phosphorylation of eIF4E Confers Resistance to Cellular Stress and DNA-Damaging Agents through an Interaction with 4E-T: A Rationale for Novel Therapeutic Approaches. PloS one. 2015;10:e0123352. doi: 10.1371/journal.pone.0123352. [DOI] [PMC free article] [PubMed] [Google Scholar]
- Misquitta-Ali CM, Cheng E, O’Hanlon D, Liu N, McGlade CJ, Tsao MS, Blencowe BJ. Global profiling and molecular characterization of alternative splicing events misregulated in lung cancer. Molecular and cellular biology. 2011;31:138–150. doi: 10.1128/MCB.00709-10. [DOI] [PMC free article] [PubMed] [Google Scholar]
- Oltean S, Bates DO. Hallmarks of alternative splicing in cancer. Oncogene. 2014;33:5311–5318. doi: 10.1038/onc.2013.533. [DOI] [PubMed] [Google Scholar]
- Piekielko-Witkowska A, Wiszomirska H, Wojcicka A, Poplawski P, Boguslawska J, Tanski Z, Nauman A. Disturbed expression of splicing factors in renal cancer affects alternative splicing of apoptosis regulators, oncogenes, and tumor suppressors. PloS one. 2010;5:e13690. doi: 10.1371/journal.pone.0013690. [DOI] [PMC free article] [PubMed] [Google Scholar]
- Raj B, Irimia M, Braunschweig U, Sterne-Weiler T, O’Hanlon D, Lin ZY, Chen GI, Easton LE, Ule J, Gingras AC, et al. A global regulatory mechanism for activating an exon network required for neurogenesis. Molecular cell. 2014;56:90–103. doi: 10.1016/j.molcel.2014.08.011. [DOI] [PMC free article] [PubMed] [Google Scholar]
- Rolland T, Tasan M, Charloteaux B, Pevzner SJ, Zhong Q, Sahni N, Yi S, Lemmens I, Fontanillo C, Mosca R, et al. A proteome-scale map of the human interactome network. Cell. 2014;159:1212–1226. doi: 10.1016/j.cell.2014.10.050. [DOI] [PMC free article] [PubMed] [Google Scholar]
- Ryan M, Wong WC, Brown R, Akbani R, Su X, Broom B, Melott J, Weinstein J. TCGASpliceSeq a compendium of alternative mRNA splicing in cancer. Nucleic acids research. 2016;44:D1018–1022. doi: 10.1093/nar/gkv1288. [DOI] [PMC free article] [PubMed] [Google Scholar]
- Sebestyen E, Singh B, Minana B, Pages A, Mateo F, Pujana MA, Valcarcel J, Eyras E. Large-scale analysis of genome and transcriptome alterations in multiple tumors unveils novel cancer-relevant splicing networks. Genome research. 2016;26:732–744. doi: 10.1101/gr.199935.115. [DOI] [PMC free article] [PubMed] [Google Scholar]
- Sonachalam M, Shen J, Huang H, Wu X. Systems biology approach to identify gene network signatures for colorectal cancer. Frontiers in genetics. 2012;3:80. doi: 10.3389/fgene.2012.00080. [DOI] [PMC free article] [PubMed] [Google Scholar]
- Strudwick S, Borden KL. The emerging roles of translation factor eIF4E in the nucleus. Differentiation; research in biological diversity. 2002;70:10–22. doi: 10.1046/j.1432-0436.2002.700102.x. [DOI] [PubMed] [Google Scholar]
- Sundararaman B, Zhan L, Blue SM, Stanton R, Elkins K, Olson S, Wei X, Van Nostrand EL, Pratt GA, Huelga SC, et al. Resources for the Comprehensive Discovery of Functional RNA Elements. Molecular cell. 2016;61:903–913. doi: 10.1016/j.molcel.2016.02.012. [DOI] [PMC free article] [PubMed] [Google Scholar]
- Sveen A, Kilpinen S, Ruusulehto A, Lothe RA, Skotheim RI. Aberrant RNA splicing in cancer; expression changes and driver mutations of splicing factor genes. Oncogene. 2016;35:2413–2427. doi: 10.1038/onc.2015.318. [DOI] [PubMed] [Google Scholar]
- Van Nostrand EL, Pratt GA, Shishkin AA, Gelboin-Burkhart C, Fang MY, Sundararaman B, Blue SM, Nguyen TB, Surka C, Elkins K, et al. Robust transcriptome-wide discovery of RNA-binding protein binding sites with enhanced CLIP (eCLIP) Nature methods. 2016;13:508–514. doi: 10.1038/nmeth.3810. [DOI] [PMC free article] [PubMed] [Google Scholar]
- Vidal M, Cusick ME, Barabasi AL. Interactome networks and human disease. Cell. 2011;144:986–998. doi: 10.1016/j.cell.2011.02.016. [DOI] [PMC free article] [PubMed] [Google Scholar]
- Vogelstein B, Papadopoulos N, Velculescu VE, Zhou S, Diaz LA, Jr, Kinzler KW. Cancer genome landscapes. Science. 2013;339:1546–1558. doi: 10.1126/science.1235122. [DOI] [PMC free article] [PubMed] [Google Scholar]
- Wan C, Borgeson B, Phanse S, Tu F, Drew K, Clark G, Xiong X, Kagan O, Kwan J, Bezginov A, et al. Panorama of ancient metazoan macromolecular complexes. Nature. 2015;525:339–344. doi: 10.1038/nature14877. [DOI] [PMC free article] [PubMed] [Google Scholar]
- Wang ET, Sandberg R, Luo S, Khrebtukova I, Zhang L, Mayr C, Kingsmore SF, Schroth GP, Burge CB. Alternative isoform regulation in human tissue transcriptomes. Nature. 2008;456:470–476. doi: 10.1038/nature07509. [DOI] [PMC free article] [PubMed] [Google Scholar]
- Wei X, Walia V, Lin JC, Teer JK, Prickett TD, Gartner J, Davis S, Program NCS, Stemke-Hale K, Davies MA, et al. Exome sequencing identifies GRIN2A as frequently mutated in melanoma. Nature genetics. 2011;43:442–446. doi: 10.1038/ng.810. [DOI] [PMC free article] [PubMed] [Google Scholar]
- Wilkerson MD, Hayes DN. ConsensusClusterPlus: a class discovery tool with confidence assessments and item tracking. Bioinformatics. 2010;26:1572–1573. doi: 10.1093/bioinformatics/btq170. [DOI] [PMC free article] [PubMed] [Google Scholar]
- Xing Y. Genomic analysis of RNA alternative splicing in cancers. Frontiers in bioscience : a journal and virtual library. 2007;12:4034–4041. doi: 10.2741/2369. [DOI] [PubMed] [Google Scholar]
- Xu Y, Gao XD, Lee JH, Huang H, Tan H, Ahn J, Reinke LM, Peter ME, Feng Y, Gius D, et al. Cell type-restricted activity of hnRNPM promotes breast cancer metastasis via regulating alternative splicing. Genes & development. 2014;28:1191–1203. doi: 10.1101/gad.241968.114. [DOI] [PMC free article] [PubMed] [Google Scholar]
- Yang X, Coulombe-Huntington J, Kang S, Sheynkman GM, Hao T, Richardson A, Sun S, Yang F, Shen YA, Murray RR, et al. Widespread Expansion of Protein Interaction Capabilities by Alternative Splicing. Cell. 2016a;164:805–817. doi: 10.1016/j.cell.2016.01.029. [DOI] [PMC free article] [PubMed] [Google Scholar]
- Yang X, Gao L, Zhang S. Comparative pan-cancer DNA methylation analysis reveals cancer common and specific patterns. Briefings in bioinformatics. 2016b doi: 10.1093/bib/bbw063. [DOI] [PubMed] [Google Scholar]
- Zhang J, Grubor V, Love CL, Banerjee A, Richards KL, Mieczkowski PA, Dunphy C, Choi W, Au WY, Srivastava G, et al. Genetic heterogeneity of diffuse large B-cell lymphoma. Proceedings of the National Academy of Sciences of the United States of America. 2013;110:1398–1403. doi: 10.1073/pnas.1205299110. [DOI] [PMC free article] [PubMed] [Google Scholar]
- Zhang X, Chen MH, Wu X, Kodani A, Fan J, Doan R, Ozawa M, Ma J, Yoshida N, Reiter JF, et al. Cell-Type-Specific Alternative Splicing Governs Cell Fate in the Developing Cerebral Cortex. Cell. 2016;166:1147–1162. e1115. doi: 10.1016/j.cell.2016.07.025. [DOI] [PMC free article] [PubMed] [Google Scholar]
Associated Data
This section collects any data citations, data availability statements, or supplementary materials included in this article.
Supplementary Materials
#C: the number of cancer samples with AS; #N: the number of normal samples with AS; #M: the number of samples with somatic mutations; #Mut: the number of mutations in each cancer.
(S0) The top ten common differential alternative splicing events and the most significant differential alternative splicing events in each cancer type.
(S1–S18) List of differential alternative splicing events in 18 types of cancer.
Each row indicates a Gene Ontology term and each column indicates one type of cancer, the values are the p-values of hypergeometric test. ‘NA’ indicates there are fewer than three overlaps between the genes of interest and the functional term.
(A) LIHC cancer subtypes; (B) UCEC cancer subtypes. #Gene: Number of genes annotated in each pathway; C: Total number of genes in each pathway; rawP: P-values of hypergeometric test; adjP: BH-corrected p-values.
(S1–S33) for 33 types of cancer. Sample: TCGA samples; ASgene: genes with alternative splicing; mutgene: Mutated gene; chr: the chromosome where the mutation occurs; start: mutation start position in the genome; end: mutation end position in the genome; mutation type: mutation type; AS ID: the AS ID in the TCGASplice database; ref: wild allele of the mutation; mut: mutant allele; mutAA: the protein changes associated with the mutation; AS_type: alternative splicing classes; exons: the altered exon for this AS event; mode: gain or loss of sequence for a given AS event.