

SUMMARY
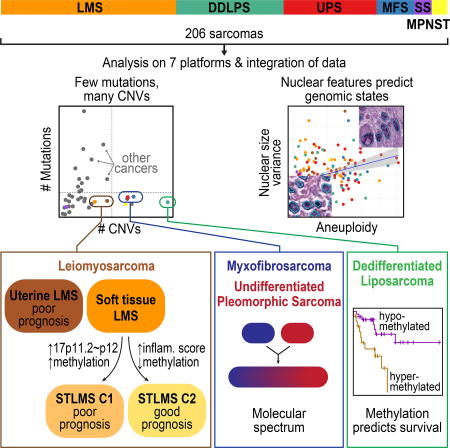
Sarcomas are a broad family of mesenchymal malignancies exhibiting remarkable histologic diversity. We describe the multi-platform molecular landscape of 206 adult soft tissue sarcomas representing 6 major types. Along with novel insights into the biology of individual sarcoma types, we report three overarching findings: 1) unlike most epithelial malignancies, these sarcomas (excepting synovial sarcoma) are characterized predominantly by copy number changes, with low mutational loads and only a few genes (TP53, ATRX, RB1) highly recurrently mutated across sarcoma types, 2) within sarcoma types, genomic and regulomic diversity of driver pathways defines molecular subtypes associated with patient outcome, and 3) the immune microenvironment, inferred from DNA methylation and mRNA profiles, associates with outcome and may inform clinical trials of immune checkpoint inhibitors. Overall, this large-scale analysis reveals previously unappreciated sarcoma type-specific changes in copy number, methylation, RNA, and protein, providing insights into refining sarcoma therapy and relationships to other cancer types.
ETOC
Genetic analysis of soft tissue sarcomas shows that they are characterized predominantly by copy number changes and offers insights into the immune microenviroment to inform clinical trials of checkpoint inhibitors.
INTRODUCTION
Adult soft tissue sarcomas (henceforth referred to collectively as sarcomas) are diverse mesenchymal malignancies that account for about 1% of adult solid tumors. Many are highly aggressive, accounting for a disproportionate share of cancer mortality among young adults (ages 20–39, in SEER data, seer.cancer.gov). Sarcomas are typically classified according to the normal mesenchymal tissue they most resemble. They comprise more than 70 types that differ in pathologic and clinical features. Sarcomas fall into two broad genetic groups: those with simple karyotypes harboring specific genetic alterations (translocations, activating mutations), and those with complex karyotypes (Taylor et al., 2011a). For The Cancer Genome Atlas (TCGA) sarcoma analysis, we focused on 6 major adult soft tissue sarcomas, including 5 with complex karyotypes: 1) dedifferentiated liposarcoma (DDLPS), an undifferentiated sarcoma usually arising in association with well-differentiated liposarcoma and characterized by 12q13~15 amplification; 2) leiomyosarcoma (LMS), showing smooth muscle differentiation, arising in both gynecologic (ULMS) and soft tissue (STLMS) sites; 3) undifferentiated pleomorphic sarcoma (UPS), lacking any defined line of differentiation; 4) myxofibrosarcoma (MFS), showing fibroblastic differentiation with myxoid stroma; 5) malignant peripheral nerve sheath tumor (MPNST), which arises in peripheral nerves. The sixth type was a simple-karyotype sarcoma, synovial sarcoma (SS), defined by the translocation t(X;18)(p11;q11). We integrated genome-scale analyses of mRNA, microRNA (miRNA), protein, and alterations of DNA sequence, methylation, and copy number to understand the genomic diversity of oncogenic drivers, to refine clinical risk stratification, and to identify potential therapeutic targets.
RESULTS AND DISCUSSION
Samples and Clinicopathologic Data
We studied 206 sarcomas with diagnoses confirmed by expert pathology review: 80 LMS (53 STLMS and 27 ULMS), 50 DDLPS, 44 UPS, 17 MFS, 10 SS, and 5 MPNST (Figure 1A, S1A). Clinical and pathologic data are summarized in Figure 1A and Table S1. The median age at diagnosis was 60 years (range 20–90). Sarcomas were mostly intermediate to high grade (93%), and 84% arose in deep soft tissue (or uterine and visceral sites).
Figure 1. Landscape of Genomic Alterations in 206 Sarcomas.

(A) Integrated plot of clinical and molecular features for all samples, ordered by sarcoma type. From top to bottom panels indicate: frequency of mutations per Mb; mutational signatures, indicating type of substitution; patient sex; sarcoma grade; number of whole genome doublings; Number of unbalanced genomic segments; tumor site; sarcoma type; cluster from iCluster analysis; significantly mutated genes, defined by false discovery rate (FDR) of <0.05 as computed by MuSiC2; TRIO or SS18-SSX gene fusions; frequent focal somatic copy number alterations including gains (pink), amplification (red), shallow deletion (pale blue) or deep deletion (dark blue). The key to the color coding of sarcomas and mutation types is at the bottom. See also Figure S1 and Table S1.
(B) Median numbers of unbalanced copy number segments vs nonsynonymous somatic mutations in each TCGA cohort. Sarcoma types are color-coded.
Pan-Sarcoma Molecular Analysis
Adult soft tissue sarcomas harbor frequent copy number alterations
Mutational profiles and genomic alterations in the 6 sarcoma types are summarized in Figure 1A and Table S1. Unsupervised cluster analysis of somatic copy number alterations (SCNAs) divided cases into 6 major clusters; C2 with relatively few unbalanced segments, consisting mostly of DDLPS and SS; C3, consisting mostly of DDLPS with complex copy number alterations; C4 and C5, dominated by LMS; and C1 and C6 consisting mostly of UPS and MFS (Figure S1B).
SCNAs frequently affected the MDM2-p53 and the p16-CDK4-RB1 pathways. MDM2 amplification was present in all DDLPS by definition, and deep deletions (as defined in Methods) of TP53 were found in 9% of LMS, 16% of UPS, and 12% of MFS. In the RB pathway, deep deletions of RB1 were detected in 14% of LMS, 16% of UPS, and 24% of MFS; deep deletions of CDKN2A (p16) were found in 8% of LMS, 20% of UPS, and 18% of MFS. RB pathway alterations in DDLPS included CDK4 amplification in 86% and CDKN2A deep deletion in 2%. Overall, the complex karyotype sarcomas were characterized by frequent SCNAs compared to most other TCGA tumor types (Figures 1B, S1C & D). DDLPS showed the highest frequency of SCNAs of any tumor type, due to its highly recurrent focal amplifications at 12q13~15. In contrast, SS displayed very few SCNAs or mutations.
Analyses for fusion transcripts identified either SS18-SSX1 or SS18-SSX2 fusions in all SS cases. We also found recurrent fusions of TRIO to TERT (n=3) or to other genes (n=2) (Figure 1A), as recently reported (Delespaul et al., 2017). Cases with TRIO-TERT fusions had the highest TERT expression across all sarcomas (Figure S1E).
Adult soft tissue sarcomas have low somatic mutation burdens
The overall somatic mutation burden in these 206 sarcomas was low (average 1.06 per Mb; Figures 1A&B; S1D&S2A). We applied MuSiC analysis (Dees et al., 2012) to whole-exome sequencing (WES) data to identify significantly mutated genes (SMGs), i.e. genes with a statistically higher-than-expected mutation prevalence across the entire cohort (FDR<0.05). This identified only 3 SMGs: TP53, ATRX, and RB1 (Figure 1A). TP53 mutations were most prevalent in LMS (40 of 80). RB1 mutations were seen in LMS, UPS, and MFS.
We surveyed known cancer genes for potential driver mutations and found that 138 sarcomas (67%) contained at least one variant in a gene known to be involved in cancer progression, though few of these were known cancer hotspots (Figure 2A). Potentially functional mutations included truncating mutations in NF1 (n=3), NF2 (1), and PRKDC (4), a gene involved in telomere stabilization and critical for double-strand break repair (Figure 2B). As ATRX, TP53, and PRKDC mutations may disrupt telomere maintenance, we inferred telomere lengths from WES data using TelSeq (Ding et al., 2014). Outlier analysis identified telomere lengthening in 24 cases, mostly LMS and UPS/MFS (Table S2), with no association with TP53 or PRKCD mutation. In UPS/MFS, long telomeres were associated with ATRX deletion or mutation (p=0.013), as recently reported (Liau et al., 2015).
Figure 2. Mutational Landscape of Sarcomas.

(A) Mutations in significantly mutated genes in sarcoma and selected known oncogenes and tumor suppressors. Only genes with recurrent or truncating mutations are shown.
(B) Mutation and indel profiles for TP53, ATRX, RB1, NF1, and PRKCD, color-coded by sarcoma type. Splice site mutations are indicated as involving the donor site (exon number + nucleotide position of mutation, e.g. e3+1) or acceptor site (exon – nucleotide position of mutation). See also Figure S2 and Table S2.
Assessment of mutational processes in samples with low mutation burden is a significant challenge. To alleviate this limitation, we used a two-step procedure. First we used de novo signature discovery in 205 WES and 37 whole-genome sequencing (WGS) samples to identify the mutational processes in the cohort (Figure S2B). This process identified predominant signatures similar to COSMIC 1, 3, 5, and 13 (http://cancer.sanger.ac.uk/cosmic/signatures), with the exception of the two tumors with the highest mutational burden, in which the COSMIC6 mismatch repair signature predominated (Figure S2B), and which respectively showed frameshift mutation in MSH6 and low MSH2 expression (Figure S2C). The second step used established COSMIC signature profiles 1, 3, 5, and 13 to quantify the mutational signatures in the WES data (Figure 3A). Of the mutations, 90% were attributable to COSMIC5 (53%) and COSMIC1 (37%). COSMIC2 and 13 (evidence of APOBEC mutagenesis) were modestly elevated in DDLPS and MPNST compared to other types (p<10−6 by Kruskal- Wallis; Figure 3B). COSMIC1 and COSMIC5 are clock-like mutational processes, occurring continuously over a patient’s lifetime (Alexandrov et al., 2015), and we found their contributions to the mutational profiles to be correlated with age at diagnosis in DDLPS (Pearson correlation 0.38, p=0.006), MFS (Pearson correlation 0.52, p=0.04), and STLMS (Pearson correlation 0.43, p=0.001; Figure S2D). Thus, sarcomas have a low mutation burden, and the mutations present in some sarcomas predominately reflect age-related C>T mutations at CpG dinucleotides, and thus likely represent passenger mutations.
Figure 3. Mutational Signatures, Genomic Complexity, and Integrated Analysis in Sarcoma.

(A) Top, signature activities (number of mutations) and bottom, normalized signature activities, projected onto 3 mutational processes, COSMIC1, COSMIC5, and APOBEC (COSMIC2 and 13). Tumors are ordered by overall mutation frequency; not shown are the 2 hypermutated samples (AB32 and A9HT).
(B) Left, activities of COSMIC1, COSMIC5, and APOBEC signatures by sarcoma type. Right, normalized signature activity.
(C) Variance in nuclear area according to the number of genome doublings in each tumor.
(D) Representative nuclear area analyses for sarcomas with whole genome doublings of 0, 1, and 2. See also Figure S2E, F.
(E) Unsupervised iCluster analysis, which integrated DNA copy number, DNA methylation, and expression of mRNA and miRNA. Color coding of tumor characteristics is at the bottom. Cluster C1 comprised 64 LMS and 1 UPS, including 10 low-grade LMS, and was relatively hypermethylated. Cluster C2 and C3 comprised 49/50 DDLPS and 35 other sarcomas. C4 comprised all 10 SS and one MPNST, and C5 comprised a mix of high-grade sarcomas, with the majority (34/56) being UPS/MFS. See also Figures S3 and S4 and Table S3.
Genomic correlates of computational morphometrics
To determine if genomic complexity is reflected in nuclear pleomorphism (i.e. highly variable nuclear area), a common feature of complex karyotype sarcomas, we used automated computational analysis of whole-slide digital pathology images, to calculate a nuclear pleomorphism score as the variance of nuclear area for each patient (Figure S2E). Increased nuclear pleomorphism correlated significantly with multiple measures of genomic complexity: number of whole genome doublings (p=0.003, ANOVA; Figure 3C, D), subclonal genome fraction (p=4e–6), and aneuploidy score based on the number of arms with gains or losses (p=5e–6, Pearson correlation) (Figure S2F). Our findings provide a genomic basis for this common observation in cancer histopathology, and support the further development of computational approaches to digital pathology to understand additional aspects of tumor morphology.
Integrated clustering analyses of sarcomas
Unsupervised analysis using the cross-platform iCluster analysis (Figure 3E) demonstrated that SS was the most distinct sarcoma across all platforms. iCluster placed all SS cases into cluster C4, whose discriminatory features included partial or complete loss of chromosome 3p in 5 cases (45%), high expression of FGFR3 (p=7e–20) and miR-183 (p=2e–25), and methylation of the PDE4A promoter (p=1e–06) (Table S3). While SS lacked recurrent mutations, it had relatively uniform and unique patterns of DNA methylation, miRNA expression, and gene expression (Figures S3A–C, S4A), consistent with the proposed central role of t(X;18)(p11;q11), which results in an SS18- SSX fusion protein that disrupts epigenetic regulation (Kadoch and Crabtree, 2013). The distinct patterns of SS mRNA expression are illustrated in a schematic 2-D tumor “map” visualization of high-dimensional mRNA expression data (Figure S4B), where distances in the map approximate the similarities between the samples in the original high-dimensional space. The map shows both SS and LMS as spatially distinct clusters from other sarcomas.
iCluster C1 was dominated by LMS, 64 of 65 cases (98%), and was distinguished from other sarcomas largely by genes linked to myogenic differentiation, including high expression of MYLK, MYH11, ACTG2, miR-143, and miR-145 (all p<5e–39) (Figures S3B&C, S4A). An association with grade was also noted, with iCluster C1 and C2 containing 11 of the 14 low-grade sarcomas (FNCLCC grade 1) compared to 3 in C3 and none in C4–5 (p=0.011). However, this effect may be driven by iCluster separation by histologic type, as 12 of the 14 low-grade sarcomas were LMS, which was enriched in C1.
Additional differences between LMS and other sarcomas were found in protein expression, as shown by the LMS-enriched RPPA cluster C1 (in which 48 of 53 samples were LMS; Figure S4C) that showed significantly lower inferred activity of the apoptosis pathway (p=1.03e–9), and higher hormone receptor (ER/PR) levels and inferred PI3K/AKT pathway activity (p=1.5e–8 and p=1.02e–9, respectively) (Figure S4D).
Genomic and Molecular Landscapes of Specific Sarcomas
Five sarcoma types had sufficient numbers of samples for detailed analyses of molecular and prognostic subsets, as summarized below. These analyses of prognostic subsets should be regarded as hypothesis-generating.
DDLPS: Integrated analyses suggest novel prognostic subsets
We first analyzed SCNAs in DDLPS. Then, given the lack of good biomarkers for aggressive DDLPS, we sought prognostic subsets based on SCNA and DNA methylation data.
Our 50 DDLPS were defined by 12q13~15 amplifications, including highly recurrent copy number gains or amplification of MDM2 (100% of our samples), CDK4 (92%), and HMGA2 (76%), as previously reported (Barretina et al., 2010) as well as FRS2 (96%) and NAV3 (60%). Other frequent SCNAs involved genes reported to inhibit adipocyte differentiation: JUN (42%) (Mariani et al., 2007), DDIT3 (32%) (Fawcett et al., 1996), PTPRQ (46%) (Jung et al., 2009), YAP1 (16%) (Seo et al., 2013), and CEBPA (24%) (Taylor et al., 2011b) (Figure 4A, B, Table S4). All 5 genes showed correlations between copy number and mRNA level (p≤0.001; Table S4B). PTPRQ amplification tended to be mutually exclusive with JUN amplification (p=0.026), with only 1 tumor (2%) having amplification of both genes (Figure 4B). Recurrent deletions (Figure 4A) included ATRX (10% deep; 20% shallow), NF1 (6% deep; 22% shallow), and CDKN2A (2% deep; 42% shallow). Given that ATRX may be required for response to CDK4 inhibitors (Kovatcheva et al., 2015) and 30% of DDLPS have ATRX deletions, ATRX alterations may represent an important correlative biomarker in future clinical trials of CDK4 inhibitors in DDLPS.
Figure 4. Dedifferentiated Liposarcoma (DDLPS).

(A) Recurrent focal copy-number alterations in the 50 DDLPS samples by GISTIC 2.0 analysis. Green line indicates the significance threshold (FDR 0.25) for focally amplified and deleted regions. See also Table S5.
(B) Alterations of genes involved in inhibition of adipose differentiation. The frequency of copy-number alterations in DDLPS is shown for each of the 3 SCNA clusters, and the heatmap shows gene expression.
(C) Methylation clusters from unsupervised consensus clustering of DNA methylation data in DDLPS. Within methylation clusters, samples are ordered by SCNA cluster and genome doubling.
(D) DSS in clusters defined by copy number and DNA methylation. See also figure S4.
To define potentially prognostic subsets of DDLPS, we performed unsupervised clustering of SCNA and DNA methylation data. The SCNA data yielded 3 distinct clusters; clusters K1 (JUN amplified) and K2 (TERT amplified and chromosomally unstable) had worse disease-specific survival (DSS) than K3 (6q25.1-amplified, with fewer unbalanced segments than K2 [mean 384 vs 531; p=0.02]) (Figure S5A). The JUN amplification in K1 could contribute to the group's poor prognosis, given that JUN overexpression in DDLPS increases migration and invasion (Sioletic et al., 2014) and that JUN inhibits adipocyte differentiation via repression of CEBPβ (Mariani et al., 2007). Thus, JUN could be an attractive therapeutic target as agents for its inhibition become available.
Unsupervised consensus clustering of DNA methylation data defined two clusters: hypomethylated (Meth1) and hypermethylated (Meth2) (Figure 4C). Meth2 had more genome doublings (p=0.002) and lower leukocyte fraction (p=0.0007), and correlated with worse DSS (HR=4.4; p=0.002). Meth2 also had higher inferred content of Th2 cells (Figure S5B), a finding linked to poor outcomes in other cancers (De Monte et al., 2011).
Integrating the SCNA and methylation clusters, we partitioned the DDLPS samples into the favorable K3 vs the unfavorable K1+K2 SCNA clusters, and subdivided the latter into hypermethylated vs hypomethylated cases. The 3 groups differed significantly in DSS (p=0.001; Figure 4D); DSS was longest in the K3 group and shortest in the hypermethylated K1+K2 group, which showed the lowest inferred fraction of immature dendritic cells (iDC: p=0.004) (Bindea et al., 2013) (Figure S5C). While they require validation, these findings may: reflect the impact of genomic alterations and immune microenvironment on behavior of DDLPS, suggest consideration of different treatments for the groups, and provide a rationale for developing SCNAs and methylation as biomarkers in DDLPS.
LMS: ULMS and STLMS are molecularly distinct
Here, we first examined similarities and differences between LMS and other sarcomas, then between ULMS and STLMS. We then defined iCluster subtypes and pathway activities, and explored how the findings could influence treatment approaches.
As described above, in integrated and individual platform analyses, ULMS and LMS were generally more similar to each other than to other sarcomas. Pathway-level alterations included elevated PI3K/AKT signaling (p=4e–06), a known feature of LMS (Gibault et al., 2012), and low apoptosis score (p=1e–05) (Figure S6A). We found deletions of the tumor suppressors TP53 (9% deep and 60% shallow deletions), RB1 (14% deep, 78% shallow), and PTEN (13% deep, 68% shallow) (Figure 5A) and mutations of TP53 in 50%, RB1 in 15%, and PTEN in 5% of samples (Figure 5B). Other shared features of LMS were elevated miR-143 and miR-145 expression, low mRNA expression of inflammatory response genes, and low leukocyte fraction by methylation analysis.
Figure 5. Leiomyosarcoma (LMS).

(A) Recurrent focal copy-number alterations in the 80 LMS samples by GISTIC 2.0 analysis. Green line indicates the significance threshold (FDR 0.25) for focally amplified and deleted regions.
(B) Molecular landscape of LMS. ULMS was enriched for tumors in iCluster C1, mRNA C2, methylation C3, and SCNA C3 (characterized by genomic instability). STLMS was enriched for the other 2 SCNA clusters: C2 (characterized by chromosome 17p11~12 gains) and SCNA C1 (genomically quiet). FDR values next to gene mutations were computed by MuSiC2. See also Table S6 and Figure S6.
(C) iCluster analysis of STLMS, demonstrating hypomethylation of C2 relative to C1. Heat maps display the most variable distinguishing factors between clusters. See also Table S6.
(D) Kaplan-Meier analysis of STLMS iCluster C1 vs C2. Median DSS was 6.7 years for C1 and was not reached for C2.
(E) Recurrent AKT pathway alterations in LMS. Top, pathway diagrams and percentage of alterations (mutation, SCNA, and/or relative change in mRNA level) in ULMS and STLMS iClusterC1 and C2. Bottom: specific alterations for each gene.
In LMS, 12 miRNAs were associated with recurrence-free survival (RFS) (adjusted p<0.05; Table S5). The miRNA most highly associated with RFS was miR-181b-5p (univariate HR 8.03; adjusted p<0.0001; Figure S6B). Although high miR-181b (>571 RPM) was more common in ULMS than in STLMS (26% vs 6%; p=0.027), it emerged as an independent predictor of RFS (HR 7.4, 95% confidence interval 3.1–17.8, p=9e-6) in a multivariate model including LMS subtype and tumor size. miR-181b expression has been reported to promote proliferation and migration of vascular smooth muscle via the PI3K pathway (Li et al., 2015); however, we found that high miR-181b-5p was associated with low expression of its predicted PI3K pathway targets AKT3 and MTOR (p<0.006, Wilcoxon test), suggesting that a different mechanism may account for the predicted contribution of miR-181b-5p to aggressive behavior in LMS.
Despite their overall similarity and lack of discriminatory SCNAs, ULMS and STLMS had significantly different methylation and mRNA expression signatures, with ULMS showing a higher DNA damage response score (p=0.005), and hypomethylation of ESR1 target genes, while STLMS had a more prominent HIF1α signaling signature (p=6e-05) (Figure S6A, C).
iCluster analysis of all LMS defined two distinct clusters, one highly associated with ULMS and the other with STLMS (Figure 5B; tumors that were exceptions to clustering by site are listed in Table S6). Considering STLMS alone, iCluster analysis defined two subgroups, C1 and C2 (Figure 5C). C1 had worse recurrence-free survival (RFS; p=0.0002) and DSS (p=0.008; Figure 5D). Thus, our findings are consistent with prior reports of LMS having 3 mRNA expression subtypes, i.e. a mostly uterine type and two mostly soft tissue types with very different prognoses (Beck et al., 2010; Guo et al., 2015).
The STLMS iCluster groups had molecular features that could contribute to prognostic differences. Compared with C2, C1 was hypermethylated and showed higher expression of IGF1R and factors involved in cell cycle control (CCNE2), DNA replication (MCM2), and DNA repair (FANCI) (all with adjusted p≤0.03) (Table S6). C1 also showed more frequent mutations of RB1 (p=0.04) and amplification of 17p11.2-p12 (q=0.022; Figure S6D), a known alteration in LMS (Perot et al., 2009) that notably includes MYOCD, encoding myocardin, a transcription factor involved in smooth muscle differentiation. MYOCD was highly amplified in 10 iCluster C1 cases (40%), independent of LMS type, tumor site, size, or grade. Both the STLMS C1 cluster and ULMS were enriched for PTEN deletion, mutation, or downregulation and for amplification or overexpression of AKT pathway members. Taken together, 46/55 (84%) of ULMS and STLMS iCluster C1 tumors contained alterations in the AKT pathway compared to 11/25 (44%) of STLMS iCluster C2 (p=1e–04; Figure 5E). The hypomethylated C2 STLMS displayed prominent signatures of inflammatory cells, including NK cells (p=0.004) and mast cells (p=0.044).
The predicted differences between ULMS and STLMS in hormonal responsiveness and stress response, e.g. through HIF1α and DNA damage pathways, support the use of different management approaches for the two, consistent with current treatment guidelines (Koh et al., 2015). In LMS as a whole, aberrant PI3K-AKT-MTOR signaling may be crucial, given recurrent deletion/mutation of PTEN along with frequent amplification and upregulation of IGF1R, AKT, RICTOR, and MTOR (Figure 5E) and high AKT pathway scores by RPPA. Indeed, MTOR inhibitors such as everolimus and temsirolimus have shown some clinical efficacy in LMS (Italiano et al., 2011) (Schwartz et al., 2013), albeit diminished by their indirect upregulation of AKT. Newer TORC1/TORC2 inhibitors and dual PI3K/MTOR inhibitors may overcome this limitation and offer more effective therapy for LMS patients.
UPS and MFS: Molecular Data Support a Single Entity with a Phenotypic Spectrum
Historically, MFS was considered a subset of UPS (“myxoid malignant fibrous histiocytoma”), but more recently MFS and UPS have been classified as distinct clinical entities based on their different clinicopathologic features (Fletcher et al., 2013). MFS has prominent myxoid stroma and is often lower grade and prone to local relapse, while UPS is generally higher grade, more cellular, and prone to distant metastasis and shorter survival.
We found MFS and UPS to be largely indistinguishable across multiple platforms (Figure 6A), the only exception being a small cluster within UPS with distinct mRNA, methylation, and PARADIGM profiles. However, this lack of clear distinction between MFS and UPS could be explained if our MFS tissues had underrepresentation of “classic” low-grade MFS areas and overrepresentation of the high-grade, UPS-like areas that can evolve within an MFS (Figure S6E). On reviewing the frozen tissue submitted for TCGA analysis, we found substantial numbers of nonclassic MFS samples (11; 65%) including high-grade epithelioid MFS (5; 29%), and these high-grade samples may have contributed to molecular similarity between MFS and UPS.
Figure 6. Undifferentiated Pleomorphic Sarcoma (UPS) and Myxofibrosarcoma (MFS).

(A) Integrated molecular profile of MFS and UPS, showing clusters from unsupervised analyses and recurrent gene mutations. FDRs next to gene mutations were computed by MuSiC2.
(B) Molecular classification of UPS/MFS by myxoid stromal content of frozen tumor sample. Unsupervised clustering was performed on genes differentially expressed (q<0.05) between groups defined by extent of myxoid stroma (none, 1–49% of the tissue, ≥50% of the tissue). “Classic” cases of MFS (n=6) and UPS (n=20) on frozen material are indicated. See also Figure S6E.
(C) SCNAs in MFS and UPS. VGLL3 amplification and RB1 deletion are shown at the top.
(D) Hippo pathway activation. The boxplots show YAP1 and VGLL3 target gene expression signature (Helias-Rodzewicz et al., 2010).
(E) Multivariable miRNA prognostic classifier for DSS. We performed a penalized regression analysis using all miRNAs and tumor size in the 54 UPS/MFS samples with outcome data. The samples were split into high and low groups based on model score, minimizing the log-rank p-value. P value shown is corrected for multiple testing. See also Figure S6F.
Because the principal morphological distinction between MFS and UPS is the amount of myxoid stroma, we asked whether genes associated with myxoid stroma could better discriminate MFS and UPS. We identified genes that were differentially expressed based on the proportion of histologic myxoid component (0, <50%, and ≥50%). Unsupervised clustering of UPS/MFS based on this gene set (Figure 6B) segregated MFS from UPS, whether or not they had classic morphology, with matrix-associated genes being more highly expressed in MFS. Overall, our molecular data indicate that these two sarcomas are not distinct entities, but rather fall along a single spectrum, as in the original nomenclature for these tumors. Thus, cases will be encountered across a continuum in terms of myxoid component, expression of matrix-related genes, grade, and clinical behavior. Given the molecular similarities, common systemic treatment approaches may be appropriate.
Taking UPS/MFS as a single spectrum of disease, we then evaluated SCNAs across the combined set of samples (Figure 6C), finding high-level amplification of CCNE1 in 10%, VGLL3 in 11%, and YAP1 in 3%, as previously reported (Helias-Rodzewicz et al., 2010). VGLL3 and YAP1 are TEAD cofactors in the Hippo signaling pathway that induce proliferation. Copy number gains of VGLL3 and YAP1 correlated with gene expression (not shown), and a YAP1/VGLL3 target gene signature (Helias-Rodzewicz et al., 2010) was strongly expressed in UPS/MFS (p=1e–24; Figure 6D). Thus, a subset of UPS/MFS may be driven by the Hippo pathway, for which inhibitors are becoming available.
Multivariable analysis of miRNAs and tumor size in UPS/MFS identified 7 miRNAs that together with tumor size were associated with metastasis-free survival (p=2e–08; Figure S6F), and 7 that together with tumor size were associated with DSS (p=3e–6; Figure 6E); both sets of miRNAs included miR-100-5p and miR-194-5p. Notably, among the miRNAs, downregulation of miR-22, which has also been reported as a poor prognostic factor in another complex karyotype sarcoma, osteosarcoma (Wang et al., 2015), had the strongest association with poor DSS.
Immune Microenvironment Signatures
Among the variable genes in the pan-sarcoma unsupervised clustering of the mRNA data were 203 genes involved in immune response and inflammation (Figure 7A). To better define the immune cell infiltrates, we assigned each sarcoma type an immune infiltration score for various immune cells based on their gene expression signatures (Bindea et al., 2013) (Figure 7B). Cases with high or low immune infiltration scores typically showed coordinate increases or decreases in multiple inflammatory cell types, rather than changes in a single cell type.
Figure 7. Specific Types of Immune Infiltration Show Associations with Survival Outcomes.

(A) Clusters identified by unsupervised clustering of the 2038 most variably expressed genes across 206 samples. Heat map shows expression; the gray wedge marks 203 genes with immune-related and inflammatory-related GO terms. The bar graph (right) shows the Benjamini-Hochberg adjusted P values for enrichment for the specific ontologies listed, as defined by the DAVID algorithm.
(B) Unsupervised cluster analysis of tumors by calculated immune infiltration scores. The analysis defines a subset of DDLPS, LMS, MFS and UPS with high immune infiltrates (right).
(C) Selected Kaplan-Meier curves for DSS by histology and immune class. The graphs show the patients in the top third vs bottom third for the immune scores indicated.
(D) Significant DSS associations (p<0.05) for high immune score by histology. See also Figure S7.
UPS/MFS and DDPLS had the highest median macrophage scores among sarcoma types; DDLPS had highest CD8 score, and STLMS had highest PD-L1 score (Figure S7A), which was significantly higher than in ULMS (p=4e–5). Across different tumors, PD-L1 mRNA level correlated with the copy number of its gene (CD274) (r=0.42, adjusted p=4e–10), but not with PD-1 score. Immune signatures in each sarcoma type were validated using publically available RNA-seq data from 113 sarcomas (Lesluyes et al., 2016). Median immune signatures in LMS, MFS, and SS were strongly correlated between the two studies (Spearman coefficients 0.908, p=8e–09; 0.819, p=9e-06; and 0.858, p=4e-08, respectively) (Figure S7B). This approach was not well suited to validation in DDLPS and UPS (as the immune subtypes all had median scores around zero in both series), but the distribution of scores was similar between cohorts (Figure S7C).
We compared DSS of patients with tumors in the top versus bottom third of immune infiltrate scores (Figure 7C & D). NK cells were the only immune cell type to correlate significantly with DSS in multiple sarcoma types. For UPS/MFS, DCs and iDCs correlated with improved DSS, suggesting a role for antigen presentation in the immunologic response to these tumors. The impact of immune infiltration scores on DSS differed in STLMS and ULMS (Figure 7D). In DDLPS, an elevated Th2 signature was associated with shorter DSS (Figure 7D).
Expression of known druggable immune microenvironment markers was then assessed. We found differential expression based on sarcoma type of B7-H3, TGFB1, and TIM3 (p=1.6e–15, p=9.8e–11, and p=2.9e–14, respectively by Kruskal-Wallis test; Figure S7D), among other markers, with median expression highest in DDLPS, UPS, and MFS.
Taken together, these data suggest that the immune microenvironment differentially affects outcome in different sarcoma types, and can contribute positively or negatively to DSS. Moreover, expression of immune microenvironment markers differs by sarcoma type and may affect response to immune checkpoint inhibitors. Such findings are of particular interest given the promising results of the SARC028 trial of a PD-1 inhibitor, in which 40% of UPS cases showed responses (Burgess et al., 2017). Our study suggests that these immunotherapy agents should be specifically explored in MFS as well.
CONCLUSIONS
This multi-platform genome-wide dataset provides the most comprehensive database of DDLPS, MFS, UPS, and LMS genomic and epigenomic alterations to date. The depth and breadth of alterations reveals the decidedly heterogeneous nature of adult soft tissue sarcomas and highlights their presumed dependence on SCNAs, rather than targetable activating point mutations. In both integrated and platform-specific analyses, the one fusion-associated sarcoma type in the study (SS) was the most dissimilar to other sarcomas, but the analyses also revealed distinct differences among LMS and the other complex karyotype sarcomas. Salient differences include MDM2, CDK4, JUN, and TERT amplifications in DDLPS; MYOCD amplification, PTEN mutations/deletions, and AKT, IGF1R, and MTOR pathway activation in LMS; and VGLL3 amplification and Hippo pathway activation in UPS/MFS. Across the sarcoma types (though less so in DDLPS), deletions were more prominent than amplifications, and relevant mutations in tumor suppressors substantially more frequent than those in oncogenes. Moreover, genomic analyses defined prognostically distinct subsets of cases among DDLPS and STLMS that could both improve risk stratification and guide new therapeutic strategies. Immune cell infiltration in the tumor microenvironment was commonly detected in genomically complex DDLPS, LMS, UPS, and MFS and was highly associated with clinical outcome. Given the abovementioned efficacy of PD-1 blockade in some UPS, the nature of the immune cell types recruited may serve as an important determinant of response to PD-1 blockade. This study provides a detailed genomic landscape of multiple sarcoma types now available for further mining by the sarcoma research community to improve our understanding of sarcomagenesis, and hopefully leading to new therapeutic approaches for these deadly diseases.
STAR Methods
CONTACT FOR REAGENT AND RESOURCE SHARING
Further information and requests for resources and reagents should be directed to and will be fulfilled by the Lead Contact, Alexander Lazar (alazar@mdanderson.org).
EXPERIMENTAL MODEL AND SUBJECT DETAILS
Human Subjects
TCGA Project Management has collected necessary human subjects documentation to ensure the project complies with 45-CFR-46 (the “Common Rule”). The program has obtained documentation from every contributing clinical site to verify that Institutional Review Board (IRB) approval has been obtained to participate in TCGA. Such documented approval may include one or more of the following:
An IRB-approved protocol with Informed Consent specific to TCGA or a substantially similar program. In the latter case, if the protocol was not TCGA-specific, the clinical site PI provided a further finding from the IRB that the already-approved protocol is sufficient to participate in TCGA.
A TCGA-specific IRB waiver has been granted.
A TCGA-specific letter that the IRB considers one of the exemptions in 45-CFR- 46 applicable. The two most common exemptions cited were are that the research fall under 46.102(f)(2) or 46.101(b)(4). Both exempt requirements for informed consent because the received data and material do not contain directly identifiable private information.
A TCGA-specific letter that the IRB does not consider the use of these data and materials to be human subjects research. The was most common for collections in which the donors were deceased.
Specimens were collected retrospectively. Selection of adult sarcoma types for the TCGA SARC study was predicated on the ability to accrue sufficient numbers of cases, and select tumors for which it would be possible to extract high-quality nucleic acids for analysis. Thus, the study was designed to focus on common adult sarcoma types, including samples from patients diagnosed with one of the following sarcoma types: dedifferentiated liposarcoma (DDLPS); leiomyosarcoma (LMS) of gynecologic (ULMS) or soft tissue (STLMS) origin; undifferentiated pleomorphic sarcoma (UPS), also known as malignant fibrous histiocytoma (MFH) (pleomorphic MFH, giant cell MFH, inflammatory MFH, and UPS not otherwise specified); malignant peripheral nerve sheath tumor (MPNST); desmoid-type fibromatosis; myxofibrosarcoma (MFS); and synovial sarcoma (SS) (monophasic, biphasic, or poorly differentiated). Patients were ineligible if they had a history of systemic chemotherapy for sarcoma or if their tumor had undergone prior radiotherapy, thus adult sarcomas commonly treated with neoadjuvant therapy were not considered for this study. Due to the difficulty in extracting sufficient DNA and RNA yields, well-differentiated liposarcoma was not considered for inclusion. All tumors were primary, with the exception of DDLPS, for which recurrent liposarcomas (n=4) were allowed if the tumor represented the first instance of DDLPS in that patient.
In total, samples for 437 cases were received at the TCGA Biospecimen Core Resource (BCR), and 206 of them remained in the study set after QC and Pathology review (see METHOD DETAILS below).
The clinical data collected included patient age, sex, race, ethnicity, height, weight, tumor anatomic location, tumor clinical dimensions, tumor pathology dimensions, clinical and pathologic AJCC staging (7th edition), history of prior cancers, synchronous cancers, and subsequent cancers (including distant metastasis, local recurrence, or second primary cancers), genetic testing if done, date of treatments, vital status, date of death, disease-specific survival, recurrence-free survival, and date of last contact. Descriptive clinical and pathologic data are summarized in Table S1.
Because the selected cases were not consecutive, analyses of association with clinical outcome are considered hypothesis-generating and require confirmation.
Samples were submitted to the BCR from 32 centers (Analytical Biological Services, Inc.; Asterand, Inc.; Baylor College of Medicine (two contributing sites); Brigham and Women's Hospital; Cedars-Sinai Medical Center; Cleveland Clinic; Cureline, Inc.; Emory University; Fox Chase Cancer Center; Hartford Hospital; International Genomics Consortium; ILSbio, LLC; Maine Medical Center; MD Anderson Cancer Center; Memorial Sloan Kettering Cancer Center; Moffitt Cancer Center; Montefiore Medical Center; Mount Sinai School of Medicine; Ontario Institute for Cancer Research (Ottawa); St. Joseph's Hospital and Medical Center (Phoenix, AZ); University of California, Davis; University of Iowa; University of Kansas Medical Center; University of Minnesota; University of New Mexico; University of North Carolina; University of Pittsburgh; University of Washington; Vanderbilt University; and Washington University) under IRB-approved protocols as described above. Primary tumor samples and matched germline control DNA (blood or blood components, including DNA extracted at the submitting site; non-neoplastic solid tissue) were obtained from patients who had received no prior treatment for their disease (chemotherapy or radiotherapy). Specimens were shipped overnight to the Biospecimen Core Resource using a cryoport that maintained an average temperature of less than −180°C.
High-resolution digital slide images (200x or 400x magnification) were prepared at the BCR, and were taken from both the frozen section slides created at the BCR from tissue submitted for analysis and representative H&E-stained slides submitted from the tissue source sites from diagnostic formalin-fixed, paraffin-embedded (FFPE) tumor tissue. In total, one to 6 digital slides were generated from each case.
METHOD DETAILS
Biospecimens and Quality Control
Frozen section quality control
Frozen sections were assessed for quality, using tumor and normal specimens from a frozen section slide prepared by the BCR. The percent tumor nuclei, percent necrosis, and other pathology annotations were assessed (see Pathology Review section, below), and normal samples were confirmed to be free of tumor. Tumor samples with ≥60% tumor nuclei and ≤20% necrosis were submitted for nucleic acid extraction.
Sample processing
DNA and RNA were extracted and quality was assessed at the central BCR. RNA and DNA were extracted from tumor using a modification of the DNA/RNA AllPrep kit (Qiagen). The flow-through from the Qiagen DNA column was processed using a mirVana miRNA Isolation Kit (Ambion). This latter step generated RNA preparations that included RNA <200 nt suitable for miRNA analysis. DNA was extracted from blood using the QiaAmp DNA Blood Midi kit (Qiagen).
RNA samples were quantified by measuring Abs260 with a UV spectrophotometer and DNA quantified by PicoGreen assay. DNA specimens were resolved by 1% agarose gel electrophoresis to confirm high molecular weight fragments. A custom Sequenom SNP panel or the AmpFISTR Identifiler (Applied Biosystems) was utilized to verify, for each case, that tumor DNA and germline DNA were derived from the same patient. Five hundred nanograms of each tumor and germline DNA were sent to Qiagen (Hilden, Germany) for REPLI-g whole-genome amplification using a 100 µg reaction scale. RNA was analyzed via the RNA6000 Nano assay (Agilent) for determination of an RNA Integrity Number (RIN), and only analytes with a RIN ≥7.0 were included in this study. Only cases yielding a minimum of 6.9 µg of tumor DNA, 5.15 µg RNA, and 4.9 µg of germline DNA were included in this study.
For cases that had sufficient residual tumor tissue following extraction of nucleic acids, a 10- to 20-mg portion of snap-frozen tumor was submitted to MD Anderson for reverse phase protein array (RPPA) analysis. This portion was adjacent to the tissue used for molecular sequencing and characterization.
Sample qualification
The BCR received tumor samples with germline controls from a total of 437 cases, of which 176 were disqualified at the BCR. Twenty-two were disqualified during prescreening at the BCR for not meeting study entry requirements or could not otherwise be processed. The other 154 disqualified cases did not pass quality control checks at the BCR, including 7 cases for insufficient tumor nuclei (<60%), 1 for excessive necrosis (>20%), 1 for unacceptable diagnosis, 93 for RNA integrity scores of <7.0, 48 for insufficient nucleic acid yields, and 4 for not having genotypically matched tumor and germline samples. The 261 cases that qualified were sent for further genomic analysis. Of these 261 cases, an additional 24 failed further QC during annotation or processing and were removed from the final cohort, including 4 that failed SNP QC, 5 that failed genotype concordance, 5 that had thousands of putative artifacts, 2 for which mRNA libraries could not be generated, 1 for which miRNA could not be characterized, 4 for history of unacceptable prior treatment, 2 not meeting study protocol after further annotation, and 1 for which no primary tumor was available. The final set of 237 cases was subjected to further expert pathology review (see below).
Pathology review
A consensus panel of 6 pathologists reviewed and scored the images for 237 sarcomas utilized for molecular analysis after all QC exclusions. The number of slides available for review from each case ranged from 1–6. Pathology reports were reviewed for tumor site, depth, reported immunohistochemical studies and/or molecular diagnostics. All cases diagnosed as DDLPS were required to have evidence of increased chromosome 12q15 copy number, confirmed by copy number analysis. LMS were required to have unequivocal histologic or immunophenotypic evidence of smooth muscle differentiation.
Consensus review in real-time via screen sharing and conference calls was required for all cases in which expert review was discrepant from the submitting diagnosis, cases where diagnosis was challenging based on available materials, and for all MFS. The initial round of consensus reviewed 52 cases. A second round of consensus pathology review occurred to re-evaluate 28 cases with outlier molecular signatures and confirm consistency of diagnosis of UPS and MFS.
Subsequently all cases of MFS and UPS were re-evaluated by one pathologist and scored for percent myxoid stroma and presence of classic histologic features on the frozen tissue submitted for molecular analyses. Classic low-grade MFS histology was defined as having the following features: prominent myxoid stroma with curvilinear vessels, low cellularity, variable nuclear atypia, and multinodular architecture. Classic UPS was defined as having enlarged, markedly pleomorphic nuclei, a fascicular to storiform to solid growth pattern, and scant stroma. Cases which had foci of myxoid stroma without characteristic architecture or cellular features were not considered to be classic MFS, but were still scored for percent of frozen tumor with myxoid background.
After review, 31 of the 237 cases were excluded from further analysis (Figures S1A, S4B), including 2 desmoid tumors (excluded for insufficient number of cases), and 6 tumors of types not included in the study criteria (giant cell tumor of bone, pleomorphic liposarcoma, myxoid liposarcoma, PEComa, atypical intradermal smooth muscle tumor, and pleomorphic dermal sarcoma). Five cases were excluded as not being sarcoma, including 3 probable melanomas (Figure S1A). Seventeen cases were excluded as being of uncertain classification based on available images and reports, and one DDLPS was excluded for being infiltrated by chronic lymphocytic lymphoma (CLL). Of the 206 cases considered to represent an acceptable type for study, 20 were reclassified from the initial diagnosis to a different type, based on histologic appearance, presence or absence of focal chromosome 12q~15 amplification, and expression of muscle markers (Figure S1A).
Sarcoma grade was calculated using the system of the Fédération Nationale des Centres de Lutte Contre le Cancer (FNCLCC). Mitotic counts and percent tumor necrosis were extracted from pathology reports, where available, or estimated on digital images otherwise. Cases were staged according to the American Joint Committee on Cancer (AJCC) 7th edition staging system.
Copy Number Analysis
SNP-based copy number analysis
Affymetrix SNP 6.0 arrays were used to hybridize genomic DNA from each tumor and normal sample using standard protocols at the Genome Analysis Platform of the Broad Institute (McCarroll et al., 2008). Briefly, from raw CEL files, Birdseed was used to infer preliminary copy number at each probe locus (Korn et al., 2008). For each tumor, tangent normalization was applied to estimate genome-wide copy number. Tangent normalization is based on the observation that the linear combination of all normal samples that are most similar to the tumor tends to match the noise profile of the tumor better than any set of individual normal samples; this linear combination is therefore used to divide the tumor signals (Cancer Genome Atlas Research Network, 2011) (http://www.broadinstitute.org/cancer/cga/copynumber_pipeline). Individual copynumber estimates then underwent segmentation using Circular Binary Segmentation (Olshen et al., 2004), during which regions corresponding to germline copy number alterations were removed. Ziggurat Deconstruction was then applied to assign a length and amplitude to each identified copy number change, in a way that accounts for different copy number values inferred across the locus from the heterogeneous cell population (Mermel et al., 2011). Allelic copy number, whole genome doubling, subclonality, purity, and ploidy estimates were calculated using the ABSOLUTE algorithm (Carter et al., 2012). For samples with ABSOLUTE-corrected copy number, CBS-derived segmented copy number values were re-centered using the In Silico Admixture Removal (ISAR) procedure (Zack et al., 2013). Significant focal copy number alterations across all sarcomas and within each sarcoma type were identified from ISAR-corrected segmented data using GISTIC 2.0.22 (Mermel et al., 2011). Allelic copy number derived from ABSOLUTE was used along with relative copy number to determine regions of loss of heterozygosity and homozygous deletions.
Focal amplification & shallow & deep deletion
For each tumor the median copy-ratio for each chromosome arm is calculated. A +2 is calculated as a value that is higher than the maximum of these arm values. A −2 is a value less than the minimum of these values. A +1 or −1 (shallow amplifications and deletions respectively) corresponds to alterations between 0.1 relative copy number and the thresholds for deep alterations (Mermel et al., 2011). Values of −2 (deep deletion) track with deletions to less than one half the baseline ploidy or homozygous deletions. Values of +2 represent amplification above chromosome arm–level gains and track with focal amplifications. To validate these definitions, we compared GISTIC 2.0 calls of shallow or deep deletion or other copy number status for CDKN2A and NF1 with manually curated ABSOLUTE calls for homozygous or heterozygous deletion or other copy number status. For each gene, there was significant correlation between deep deletion and homozygous deletion, shallow deletion and heterozygous deletion, and “other” categories, chi-squared p<0.0001.
Copy number–based cluster analysis
Tumors were clustered based on thresholded copy number at recurring alteration peaks from GISTIC analysis (all_lesions.conf_99.txt file). Clustering was done in R based on Manhattan distance using Ward's method.
Assessment of ATRX copy number alterations
The copy number alteration (more specifically deletion) of ATRX was assessed independently using two methods, SNP6.0 arrays (see SNP-based copy number analysis, above) and VarScan 2 (Koboldt et al., 2012). In VarScan 2, the tumor and its matching normal whole-exome BAM files were assessed simultaneously using a heuristic approach to detect sequence variants. Copy number changes were assigned after normalization of read depths of the two BAM files. The copy number alteration was validated by comparing the outputs of both methods while taking into consideration the purity of the samples. A sample was considered to have copy number deletion in ATRX when the outputs from both methods gave <1.79 in the locus or part of the locus and when GISTIC2.0 indicated a deletion status.
DNA Sequencing and Analysis
Whole exome and whole genome sequencing
Whole exome sequencing and, in a subset of cases, whole genome sequencing were performed at Washington University. Dual-indexed Illumina libraries were constructed according to standard protocols. Unique, 6bp molecular barcodes were used to identify individual samples. Exome capture enrichment was performed with pooled libraries using Nimblegen SeqCap EZ Human Exome v3.0. Samples were subsequently sequenced on Illumina HiSeq 2000 instruments. The pool size varied, but was generally 8–10. Each pool was sequenced across 2 lanes. A total of 518 tumor and normal aliquots from 255 cases were sequenced to a minimum average target depth of 20x across 80% of target regions. The 206 cases in the final cohort were utilized for downstream analysis. 40 exome-sequenced cases were selected for additional whole genome sequencing (WGS) and 37 were retained for downstream analysis (18 DDLPS, 8 STLMS, 10 ULMS, and one UPS). WGS was performed using Illumina HiSeq 2000 for the initial 70 aliquots and HiSeq X Ten instrument for the final 13 aliquots.
Validation of somatic mutations
A second set of dual-indexed Illumina libraries was constructed according to standard protocols using the original DNA aliquots when sufficient genomic DNA was available (n=197 samples). These were pooled, then enriched by performing hybrid capture using 120-mer custom capture oligos (Integrated DNA Technologies [IDT]). The target regions for somatic indels and point mutations were defined as a 100-bp region surrounding the mutation site. For probes designed in repetitive regions, those having >5 mismatches to similar sequences in the human genome were discarded. Sequence data were generated on Illumina HiSeq 2500 instruments. Among the 197 samples with custom capture validation data from the second library, 90.8% (9557/10522) of reported mutations were confirmed.
In order to identify TERT promoter mutations and presence of cancer –related viruses, original source material from the second set of libraries was also pooled and hybridized to 120-mer IDT probes targeting the TERT promoter mutation hotspots and cancer-related viruses. Sequence data for the TERT promoter and cancer-related viruses were generated using Illumina MiSeq instruments.
Target and probe bed files for all capture sets were submitted to CGHub and are available at http://genome.wustl.edu/pub/custom_capture/.
Read alignment
Each lane or sub-lane of data for whole genome, exome and custom capture validation sequencing was aligned with bwa v0.5.9 (Li and Durbin, 2009) to GRCh37-lite. Defaults were used in both bwa aln and bwa sampe (or bwa samse if appropriate) with the exception that for bwa aln we used four threads (-t 4) and bwa's built in quality-based read trimming (-q 5). ReadGroup entries were added to resulting SAM files using Samtools add-read-group-tag. This SAM file was then converted to a BAM file using Samtools v0.1.16, name sorted (samtools sort -n), mate pairings assigned (samtoolsfixmate), resorted by position (samtools sort), and indexed using Samtools index-bam.
Read duplication marking and merging
Reads from multiple lanes, but the same sequencing library, were merged, if necessary, using Picard v1.46 MergeSamFiles and duplicates were then marked per library using Picard MarkDuplicates v1.46. Lastly, each per-library BAM with duplicates marked was merged together to generate a single BAM file for the sample. MergeSamFiles was run with SORT_ORDER=coordinate and MERGE_SEQUENCE_DICTIONARIES=true parameters. For both tools, ASSUME_SORTED=true and VALIDATION_STRINGENCY=SILENT were specified. All other parameters were set to defaults. Samtoolsflagstat was run on each BAM file generated (per-lane, per-library, and final merged).
Multicenter mutation calling
Mutations were called by four production or analysis centers within the TCGA network; Washington University, Broad Institute, UC Santa Cruz (UCSC), and Canada’s Michael Smith Genome Sciences Centre, BC Cancer Agency (BCGSC). Filtered calls from the 4 callers utilized by Washington University (described below) were merged using joinx v1.9 (joinx sort --unique --stable). Germline dbSNP sites reported by the 1000 Genomes Projects were filtered if the minor allele fraction was greater than zero. In addition, for the normal BAM, we removed putative variants with fewer than 8x coverage of the reference allele or greater than 1 somatic variant supporting read or 1% variant allele frequency. For the tumor exome BAM, we required a minimum of 2 supporting read and a somatic variant allele frequency of 5%. Additional novel somatic mutation calls submitted by the Broad Institute, BCGSC, and UCSC to the TCGA Data Coordinating Center were downloaded and filtered to remove known, common germline dbSNP sites. Remaining variants were annotated using Gencode 19 transcripts from Ensembl release 74, and non-coding sites were removed. Read counts were generated for all remaining novel putative variants, and said variants were incorporated into the final mutation annotation format (MAF) if they met the same minimum coverage, maximum coverage, and variant allele frequency requirements described below. A separate MAF was delivered for the somatic mutations called in whole-genome sequence data; it used the same alignment and detection parameters described for exome analysis with no restriction for coverage or protein translational effect.
Single-nucleotide variant and indel callers
Single-nucleotide variant (SNV) calling and analytic pipelines were performed as follows in an institution-specific manner:
Washington University: Single-nucleotide variant (SNV) callers included: Samtools v0.1.16 (Li et al., 2009) (samtools pileup --cv -A -B), SomaticSniper v1.0.4 (Larson et al., 2012) (bam-somaticsniper -F vcf -G -L -q 1 -Q 15), Strelka v0.4.6.2 (Saunders et al., 2012) (with default parameters except for setting is SkipDepthFilters = 1), and VarScan v2.2.6 (Koboldt et al., 2012) (--min-coverage 3 --min-var-freq 0.08 --p-value 0.10 -- somatic-p-value 0.05 --strand-filter 1).
The Washington University analytic strategy was as follows: First, Samtools calls were retained if they met all of the following rules, inspired by the mapping short DNA sequencing reads and calling variants using the mapping quality scores (MAQ) software algorithm (Li et al., 2008):
Site is greater than 10 bp from a predicted indel of quality 50 or greater
The maximum mapping quality at the site is ≥ 40
Fewer than 3 SNV calls in a 10 bp window around the site
Site is covered by at least 3 reads and fewer than 1,000,000,000 reads
Consensus quality ≥ 20
SNP quality ≥ 20
After these filters were applied, Samtools and SomaticSniper calls were unioned using joinx v1.9 (https://github.com/genome/joinx; joinx sort --stable --unique). The resulting merged set of variants were additionally filtered to remove likely false positives (Larson et al., 2012; Li et al., 2009). Bam-readcount v0.4 (https://github.com/genome/bam-readcount) with a minimum base quality of 15 (-b 15) was used to generate metrics, and sites were retained based on the following requirements:
Minimum variant base frequency at the site of 5%
Percent of reads supporting the variant on the plus strand ≥ 1% and ≤99% (variants failing these criteria are filtered only if the reads supporting the reference do not show a similar bias)
Minimum variant base count of 4
Variant falls within the middle 90% of the aligned portion of the read
Maximum difference between the quality sum of mismatching bases in reads supporting the variant and reads supporting the reference of 50
Maximum mapping quality difference between reads supporting the variant and reads supporting the reference of 30
Maximum difference in aligned read length between reads supporting the variant base and reads supporting the reference base of 25
Minimum average distance to the effective 3’ end of the read for variant supporting reads of 20% of the sequenced read length
Maximum length of a flanking homopolymer run of the variant base of 5
After this filtering, the SomaticSniper/Samtools calls were additionally filtered to high confidence variants by retaining only those sites where:
The average mapping quality of reads supporting the variant allele was ≥ 40
The SomaticScore of the call was ≥ 40.
VarScan calls were retained if they met the following criteria:
VarScan reported a somatic p-value ≤ 0.07
VarScan reported a normal frequency ≤ 5%
VarScan reported a tumor frequency ≥ 10%
VarScan reported ≥ 2 reads supporting the variant.
VarScan variants passing these criteria were then filtered for likely false positives using bam-readcount v0.4 and identical criteria as described above for SomaticSniper. Fully filtered calls as described above for SomaticSniper and VarScan were then merged with calls from Strelka using joinx v1.9 (joinx sort --stable --unique) to generate the final callset.
Indels were detected using four methods: Genome Analysis Toolkit (GATK) 1.0.5336 (McKenna et al., 2010) (-T IndelGenotyperV2 --somatic --window_size 300 -et NO_ET), retaining only those which were called as somatic; Pindel v0.2.2 (Ye et al., 2009) (-w 10; with a config file generated to pass both tumor and normal BAM files set to an insert size of 400); Strelka v0.4.6.2 (with default parameters except for setting isSkipDepthFilters = 1); and VarScan v2.2.6 (--min-coverage 3 --min-var-freq 0.08 --pvalue 0.10 --somatic-p-value 0.05 --strand-filter 1).
Pindel calls were retained if:
They had no support in the normal data
More reads were reported by Pindel than reported by Samtools at the indel position or if the number of supporting reads from Pindel was ≥ 8% of the total depth at the position reported by Samtools
Samtools reported a depth less than 10 at the region and Pindel reported more indel supporting reads than reads mapped with gaps at the site of the call
A Fisher's exact test p-value ≤ 0.15 was returned when comparing the normal to the tumor in number of reads with gapped alignments versus reads without.
VarScan indel calls were retained if VarScan reported all of the following:
A somatic p-value ≤ 0.07
A normal frequency ≤ 5%
A tumor frequency ≥ 10%
≥ 2 reads supporting the variant.
Broad Institute
To avoid mix-ups between tumor and normal samples, as well as cross-contamination between tumor samples, alignments were first subjected to quality control using ContEst (Cibulskis et al., 2011). The MuTect algorithm version 1.1.6 (Cibulskis et al., 2013) was used to generate somatic mutation calls, which were subsequently filtered as previously described (Costello et al., 2013) to remove any spurious calls due to shearing-induced generation of 8-oxoguanine. Indels were identified using the indelocator algorithm. Details and tools are available at www.broadinstitute.org/cancer/cga. Functional annotation of mutations was performed with Oncotator (Ramos et al., 2015) using Gencode V18.
UCSC
Single-nucleotide somatic mutations were identified by RADIA (RNA AND DNA Integrated Analysis), a method that combines the patient-matched normal and tumor DNA whole exome sequencing (WES) with the tumor RNA sequencing (RNA-Seq) for somatic mutation detection (Radenbaugh et al., 2014), software available at: https://github.com/aradenbaugh/radia/. The inclusion of the RNA-Seq data in RADIA increases the power to detect somatic mutations, especially at low DNA allelic frequencies. By integrating the DNA and RNA, we can rescue some mutations that would be missed by traditional mutation calling algorithms that examine only the DNA. RADIA classifies somatic mutations into 3 categories depending on the read support from the DNA and RNA: 1) DNA calls – mutations that had high support in the DNA, 2) RNA Confirmation calls – mutations that had high support in both the DNA and RNA, 3) RNA Rescue calls – mutations that had high support in the RNA and weak support in the DNA. Here RADIA identified 32,573 DNA mutations, 5,785 RNA Confirmation mutations, and 843 RNA Rescue mutations.
BCGSC
Strelka (Saunders et al., 2012) (v1.0.6) was used to identify somatic single-nucleotide variants and short insertions and deletions from the TCGA SARC exome dataset. All parameters were set to defaults, with the exception of "isSkipDepthFilters", which was set to 1 in order to skip depth filtration, given the higher coverage in exome datasets. We analyzed 259 pairs of libraries. When a blood sample was available, it served as the matched normal specimen; otherwise, the matched normal tissue was used. The variants were subsequently annotated using SnpEff (Cingolani et al., 2012), and the COSMIC (v61) (Forbes et al., 2010) and dbSNP (v137) (Smigielski et al., 2000) databases.
Identification of significantly mutated genes
The entire set of 206 sarcomas and those sarcoma types with greater than 15 samples (LMS, DDLPS, UPS, and MFS) were separately analyzed for significantly mutated gene (SMG) detection. Variants from the MAF (described previously) were used to define the region of interest (ROI) file. Coverage for each sample over an ROI was collected using the corresponding tumor/normal bam file. MAF files for each cancer type and a MAF combining all available samples were created. Mitochondrial and RNA genes were removed from this analysis. We performed MuSiC2 (https://github.com/ding-lab/MuSiC2) frequency-based SMG identification (Dees et al., 2012). SMGs were defined as genes significantly mutated with FDR < 0.05 using a convolutions test.
Identification of driver mutations
Due to the smaller sample sizes per cohort and the lower mutation frequency of somatic point mutations and indels in sarcoma, we expanded our analysis to identify additional mutations in putative cancer genes. A collection of 624 cancer genes (Niu et al., 2016) was used to identify possible driver mutations in individual cases.
Assessment of telomere length
Sequencing reads containing (TTAGGG)7 repeats were classified as telomeric based on previously reported results (Ding et al., 2014), and TelSeq was used to estimate the telomere length (Ding et al., 2014). The telomeric reads were quantified, and the telomere lengths of tumor and its matching normal were estimated separately as a function of sequencing depth. Reliability of telomeric content estimated from WES was confirmed by high concordance with telomeric length inferred from 31 cases with available and compatible whole-genome sequencing (WGS) files (Pearson correlation: 0.79). To validate TelSeq results, we also assessed telomere length from exome data by an independent method (written in-house). The outputs from both TelSeq and the inhouse method were log2 transformed and subsequently compared. The results were in high concordance with each other (Pearson correlation = 0.98).
To assess telomere length in the sarcomas, we performed a Gaussian Mixture Clustering guided by optimal Bayesian information criterion value on the log2 ratio of tumor telomere length using mclust package in R (Yeung et al., 2001). Based on the clustering result, we identified three groups: 1) samples with gain in telomere length, 2) samples with loss in telomere length, and 3) samples with no change in telomere length.
The association of ATRX and TP53 mutations/deletions with telomere length of different sarcoma subtypes was assessed with Student’s T-tests. Multiple regression analysis was also performed to look for association of several differentially expressed genes with changes in telomere length. Variables included in the multiple regression analysis were: ATRX mutation/deletion status, TP53 mutation status, and expression levels of ATRX, TP53, HNRNPC, APEX1, NPM1, RPS17, and SEC11C.
Mutation Signature Analysis
De-novo signature discovery in WES samples
To systematically explore mutational processes operating in 205 SARC WES samples (excluding one sample with ultraviolet signature), we first performed a de-novo signature extraction using a Bayesian variant of the non-negative matrix factorization (Bayesian NMF) (Kasar et al., 2015).
De-novo signature discovery in WGS samples
The lack of power due to a low mutation rate in WES samples (~57 mutation per tumor) was a significant challenge in the de-novo signature discovery. Therefore, we performed a separate signature discovery in 37 WGS samples (~5010 mutations per tumor) to examine additional processes that had only a minor contribution in WES. The resulting WGS signatures were then projected onto coding regions to distinguish mutational signatures similar to those observed in WES samples and from novel signatures.
Inference of signature activity
De-novo signature discovery in both WES and WGS samples identified four major mutational processes: COSMIC1, spontaneous cytosine deamination; COSMIC5, unknown etiology; COSMIC6, microsatellite instability (MSI); and COSMIC2/13, APOBEC. Based on this de-novo signature analysis we performed a projection approach to infer sample-specific activities of those mutational processes. We first removed two putative MSI samples to minimize possible contamination and interference among signatures, and we utilized a variant of NMF to enable a forced de-convolution of mutational processes in 203 WES samples. More specifically, the projection was done by minimizing the Kulbeck-Leibler divergence while we froze the signature-loading matrix, W (96 × 4), comprised of the column vectors corresponding to normalized signature profiles of COSMIC1, COSMIC5, and COSMIC2 and 13, and while we iteratively updated the activity-loading matrix H (4 × 203) to best approximate the mutation count matrix, X (96 × 203). The resulting row vectors in H represents a deconvoluted signature activity across samples (Figure 3A). We validated the accuracy of the projection approach by examining the correlation between (1) the inferred activity of COSMIC2 and 13 (APOBEC) in WES samples determined from the projection approach and (2) the combined activity of SIG.WGS.2 and SIG.WGS.4 determined from the denovo signature discovery for 37 WGS samples (Pearson correlation = 0.7 and P < 10−6).
mRNA Analysis
mRNA library construction and processing
One µg of total RNA was converted to mRNA libraries using the Illumina mRNA TruSeq kit (RS-122-2001 or RS-122-2002) following the manufacturer’s directions. Libraries were sequenced 48×7×48 bp on the Illumina HiSeq 2000 as previously described (Cancer Genome Atlas Research Network, 2012). FASTQ files were generated by CASAVA. RNA reads were aligned to the hg19 genome assembly using MapSplice 0.7.5 (Wang et al., 2010). Gene expression was quantified for the transcript models corresponding to the TCGA GAF2.1 (https://gdc-api.nci.nih.gov/v0/data/a0bb9765-3f03-485b-839d-7dce4a9bcfeb) using RSEM (Li and Dewey, 2011), and gene expression was normalized within-sample to a fixed upper quartile.
Fusion gene alignments were determined using MapSplice (Wang et al., 2010). For further details on this procedure, refer to Description file at the Data Coordinating Center data portal under the V2_MapSpliceRSEM workflow (https://gdcapi.nci.nih.gov/legacy/data/e34a93ee-d3c4-44c7-8bfa-0c19c6df0866). Putative TRIO fusions were selected from discordant paired end reads in which the non-TRIO end mapped to an identified gene. BAM files and expression data can be found at the Genomic Data Commons (https://gdc-portal.nci.nih.gov/legacy-archive/).
mRNA expression–based cluster analysis
To understand the mRNA abundance relationships between tumors, we performed hierarchical clustering on variable genes. Genes were first filtered by removing all genes that had < 90% expression data greater than zero across all tumors. Expression values were log2-transformed, followed by median centering for each gene across all tumors and for all genes within each tumor, respectively. Genes were further filtered to 2,038 by selecting genes with a standard deviation across all tumors ≥ 2. These genes were used for clustering using ConsensusClusterPlus on R (v2.12.2) with 1,000 permutations (Wilkerson and Hayes, 2010). Options included maxK=10, pItem=1, pFeature=0.9, clusterAlg=”hc”, distance=”pearson”, and a seed value of 123.456. Clusters were selected based on the change in area under the cumulative distribution function curve, with the number of clusters selected being the minimum value that would capture most of the information. Gene ontologies were generated using DAVID (Huang da et al., 2009).
Calculation of immune infiltration score
Immune infiltration scores were based on the gene groups previously identified (Bindea et al., 2013) . To determine an immune infiltration score for each tumor, the mRNA abundances scored for genes that comprised each group were first individually median-centered across all tumors. Secondly, for each tumor, the median-centered values of every gene within an immune class were averaged together to yield the reported scores. Survival curves were generated by taking cases representing the top and bottom 33% of scores in each immune class for each histology and plotting disease-specific survival using in-house scripts.
Validation of immune infiltration scores
In order to validate the sarcoma-specific immune infiltration scores identified in our cohort, we repeated our analysis using RNA-seq data from a publically available dataset including 42 UPS, 36 LMS, 18 DDLPS, 15 MFS, and 2 SS (Lesluyes et al., 2016). Only fresh frozen tissue samples were included in the analysis. As with our cohort, median immune infiltration scores were calculated for each of the 24 immune signatures across all sarcoma histologies. For each sarcoma type, a scatterplot was generated where the median immune infiltration score for each immune signature served as the x- or y- axis for our data and the Lesluyes et al. data, respectively, and the Spearman correlation coefficient was calculated.
Correlation of UPS/MFS morphology with mRNA
Percent myxoid component (described above in Pathology Review) was used to group UPS and MFS samples into three classes: no myxoid stroma (class 0), 1–49% myxoid stroma (class 1), or 50–100% myxoid stroma (class 2). A multiclass analysis (Tusher et al., 2001) was performed to identify differentially expressed genes between the classes; this identified 589 genes with a q value < 0.05. These differentially expressed genes were then used to perform unsupervised cluster analysis of all of the UPS/MFS tumors.
HIF1α target gene expression signature
HIF1α a target gene expression signature in LMS was calculated as the negative mean expression of genes down-regulated by HIF1A knockdown minus the mean expression of genes up-regulated by HIF1A knockdown (Elvidge et al., 2006).
Yap1/ VGLL3 target gene expression signature
Yap1/VGLL3 target gene signature in UPS/MFS was calculated as the difference in median expression of up- and down- regulated genes (Helias-Rodzewicz et al., 2010).
Sarcoma tumor map
A tumor map was constructed from the mRNA expression results for the soft tissue sarcomas. The Tumor Map represents a dimensionality reduction and visualization method for high-dimensional data. It allows viewing and browsing relationships between high-dimensional heterogeneous samples in a two-dimensional map, analogous to exploring geographical maps in the Google Maps web application. Samples were arranged in a two-dimensional space and then associated to hexagons in a regular hexagonal grid. The relative distances in the map approximated the relative similarities between the samples in the original high-dimensional space. Samples found to have similar profiles were placed near each other in the map. Samples that were less similar were placed farther away from each other. Given that such relations are preserved, clusters of samples that appear as “islands” in the map indicate groups of samples that share expression features.
To build the sarcoma map (Figure S4B), we used mRNA expression RNA-Seq data for 259 samples: the 206 in the final analysis; the 22 cases with mRNA expression data which had been sent for genomic analysis but failed QC during annotation; and the 31 cases excluded in pathology review (Figure S1A). We computed pair-wise Spearman correlation for each pair of mRNA expression profiles in the sarcoma cohort to obtain a pair-wise similarity matrix (259 samples by 259 samples). To build the map layout, the closest neighborhood of 6 samples was selected for each sample from the similarity matrix. We represented the local neighborhoods as a sparse graph where the nodes are the samples, and an edge links any two samples if one of them is among the top 6 neighbors of the other. The magnitude of the similarity was used as the edge weight. An X-Y position in the two-dimensional plane was calculated from the graph using a spring-embedded graph layout algorithm implemented in the OpenOrd (formerly DrL) toolbox (Martin et al., 2011). The spring-embedded layout algorithm treated edges as springs and allowed the springs to oscillate for a fixed amount of time with the energy inversely proportional to the edge weights. Under these conditions, springs with large weights do not oscillate much, causing those vertices to stay together. However, springs with small weights oscillate more and end up farther away from each other. This method allowed the construction of a two-dimensional spatial layout of the graph with clusters of samples forming clique-like hub sub-structures. Our method then associated each of the nodes with a fixed location a two-dimensional hexagonal grid. Each hexagon-shaped cell in the grid was assigned no more than one vertex, and some were assigned none, representing “empty space” in the map. If multiple vertices contested for the same grid cell, a random vertex selection was made and placed into the cell; and the other competing vertices were assigned to neighboring empty cells using a greedy strategy, snapping around the original cell in a spiral-like manner.
miRNA Analysis
MicroRNA libraries and sequencing
We generated microRNA sequence (miRNA-seq) data using methods described previously (Chu et al., 2016). Briefly, reads were aligned to the GRCh37/hg19 reference human genome, and read count abundance was annotated with miRBase v16 stemloops and mature strands. While the read counts included only exact-match read alignments, .bam files at CGHub (cghub.ucsc.edu) (Wilks et al., 2014) included all sequence reads. We used miRBase v20 to assign 5p and 3p mature strand (miR) names to MIMAT accession IDs.
Cluster analysis of miRNA mature strands
To identify subtypes within the various sarcoma cohorts, we used unsupervised hierarchical clustering with pheatmap v1.0.2 in R. The input was a reads-per-million (RPM) data matrix for the 303 (top 25%) miRBase v16 5p or 3p mature strands that had the largest variances across the cohort. We transformed each row of the matrix by log10(RPM + 1), then used pheatmap to scale the rows. We used Ward.D2 for the clustering method with Pearson correlation and Euclidean as the distance measures for clustering the columns and rows, respectively.
We first conducted this analysis on the full pan-sarcoma set and found that the LMS samples drove the top most variable miRNAs and in turn, the clustering solution (Figure S3C). In order to better identify subtypes within the nonLMS samples, we chose the top 25% most variable miRs within the nonLMS set and reclustered using only these nonLMS samples.
Differentially abundant microRNAs
We identified miRs that were differentially abundant using unpaired two-class SAM analyses (samr v2.0) (Li and Tibshirani, 2013) with an RPM input matrix and a false discovery rate (FDR) threshold of 0.05.
miR targeting
We assessed potential miRNA-gene targeting for all tumor samples by calculating miRmRNA Spearman correlations with MatrixEQTL v2.1.1 (Shabalin, 2012), using genelevel normalized abundance RNA-seq (RSEM) data. We calculated correlations with a P-value threshold of 0.05, then filtered the anticorrelations at FDR<0.05. We extracted miR-gene pairs that corresponded to functional validation publications (luciferase reporter, qPCR, Western blot) reported by miRTarBase V6.0 (Hsu et al., 2014).
Prognostic miRNAs
We identified miRs that were associated with relapse-free survival (RFS), metastasisfree (MFS) and disease-specific survival (DSS) in UPS/MFS, DDLPS, and LMS sample sets. To do this, we used Cutoff Finder to determine, for each miR with mean > 50 RPM, the optimal expression value that would stratify samples into the two groups with the smallest Kaplan-Meier log-rank p-value (Budczies et al., 2012). We adjusted the p-values for maximal selection based on formula 1 (Faraggi and Simon, 1996; Gaujoux and Seoighe, 2010), and then adjusted those p-values using Benjamini-Hochberg multiple testing correction.
As a complementary analysis we created multivariable models which incorporated several miRNAs, as well as tumor size, to further refine prognostication. Specifically, we used a LASSO penalized regression approach (R package: glmnet; family=cox; alpha=1) to identify sets of miRs and coefficients that together would best predict RFS and DSS in each of the histology types. Once each sample was assigned a score based on the linear model, we ran cutoff finder to determine the optimal segregation of groups and applied the same maximal selection correction to the minimum log-rank p-value as above.
Within LMS, miRNA-181b, tumor size, and site (ULMS vs STLMS) were analyzed as predictors of RFS in a multivariable Cox regression model using the coxph function from the survival package in R. miR-181b expression was dichotomized at the cutoff defined by Cutoff Finder as described above. Tumor size was dichotomized at the median.
DNA Methylation Analysis
Sample preparation and hybridization
The Illumina Infinium HM450 array (Bibikova et al., 2011) was used to assay the 206 TCGA sarcoma samples using standard protocols. Briefly, genomic DNA (1 µg) for each sample was treated with sodium bisulfite, recovered using the Zymo EZ DNA methylation kit (Zymo Research, Irvine, CA) according to the manufacturer’s specifications, and eluted in 18 µl volume. After passing quality control, bisulfite-converted DNA samples were whole-genome amplified, fragmented enzymatically, hybridized overnight to BeadChips, then subjected to locus-specific base extension with labeled nucleotides (Cy3 and Cy5). BeadArrays were scanned and the raw data imported into custom programs in R computing language for pre-processing and calculation of DNA methylation beta value for each probe and sample. Quality control and probe exclusions were done using standard protocols as previously described (Cancer Genome Atlas Research Network, 2014).
DNA methylation based cluster analysis
We carried out an unsupervised consensus clustering as implemented in the Bioconductor package ConsensusClusterPlus, with Euclidean distance and partitioning around medoids (PAM). Consensus clustering was applied to the DNA methylation data from the entire cohort, using the most variable 1% of CpG probes. DNA methylation–based subtypes were identified using a robust 5-group partition of the samples obtained using the most variable CpG loci on the Illumina Infinium HM450 array (Figure S3B). Fisher’s exact test was used to test for associations of methylation clusters with mRNA expression clusters and significantly mutated genes.
Estimation of leukocyte fraction
We estimated leukocyte fraction in each tumor by calculating the leukocyte signature from methylation results as described (Carter et al., 2012). As a source of leukocyte methylation level, we used DNA methylation data of peripheral blood mononuclear cells (PBMC) from six healthy donors (Reinius et al., 2012) (GSE35069).
RPPA analysis
RPPA experiments and data processing
Protein was extracted from frozen tumor tissue using RPPA lysis buffer (1% Triton X-100, 50 mmol/L Hepes (pH 7.4), 150 mmol/L NaCl, 1.5 mmol/L MgCl2, 1 mmol/L EGTA, 100 mmol/L NaF, 10 mmol/L NaPPi, 10% glycerol, 1 mmol/L phenylmethylsulfonyl fluoride, 1 mmol/L Na3VO4, and 10 µg/mL aprotinin) and Precellys homogenization. RPPA was performed as described previously (Hu et al., 2007; Tibes et al., 2006). Tumor lysates were adjusted to 1 µg/µL concentration as assessed by bicinchoninic acid assay and boiled with 1% SDS. Tumor lysates were manually serially diluted five times, each a two-fold dilution in lysis buffer. An Aushon Biosystems 2470 arrayer (Burlington, MA) printed 1,056 samples on nitrocellulose-coated slides (Grace Bio- Labs). Slides were probed with 192 validated primary antibodies (Table S7) followed by corresponding secondary antibodies (goat anti-rabbit IgG, goat anti-mouse IgG, or rabbit anti-goat IgG). Signal was captured using a Dako Cytomation-catalyzed system and DAB colorimetric reaction. Slides were scanned in a CanoScan 9000F. Spot intensities were analyzed and quantified using Array-Pro Analyzer (Media Cybernetics Washington DC) to generate spot signal intensities (Level 1 data). The software SuperCurveGUI (Hu et al., 2007), available at http://bioinformatics.mdanderson.org/Software/supercurve/, was used to estimate the EC50 values of the proteins in each dilution series (in log2 scale). Briefly, a fitted curve ("supercurve") was plotted with the signal intensities on the Y-axis and the relative log2 concentration of each protein on the X-axis using the non-parametric, monotone increasing B-spline model (Tibes et al., 2006). During the process, the raw spot intensity data were adjusted to correct spatial bias before model fitting. A QC metric was returned for each slide to help determine the quality of the slide: if the score was less than 0.8 on a 0–1 scale, the slide was dropped. In most cases, the staining was repeated to obtain a high-quality score. If more than one slide was stained for an antibody, the slide with the highest QC score was used for analysis (Level 2 data). Protein measurements were corrected for loading as described (Gonzalez-Angulo et al., 2011; Hu et al., 2007) using median centering across antibodies (Level 3 data). The analysis included 192 antibodies and 173 sarcoma samples: 46 DDLPS, 60 LMS, 5 MPNST, 15 MFS, 6 SS, and 41 UPS. Final selection of antibodies was also driven by the availability of high-quality antibodies that consistently pass a strict validation process as previously described (Hennessy et al., 2010). These antibodies were assessed for specificity, quantification, and sensitivity (dynamic range) in their application for protein extracts from cultured cells or tumor tissue. Antibodies were labeled as validated and used with caution based on the degree of validation by criteria previously described (Hennessy et al., 2010).
RPPA arrays were quantitated and processed (including normalization and load controlling) as described previously, using MicroVigene (VigeneTech, Inc., Carlisle, MA) and the R package SuperCurve (version-1.3), available at http://bioinformatics.mdanderson.org/main/SuperCurve:Overview (Hu et al., 2007; Tibes et al., 2006). Raw data (level 1), SuperCurve nonparametric model fitting on a single array (level 2), and loading-corrected data (level 3) were deposited at the Data Coordinating Center.
Data normalization
We performed median centering across all the antibodies for each sample to correct for sample loading differences. Those differences arise because protein concentrations are not uniformly distributed per unit volume. That may be due to several factors, such as differences in protein concentrations of large and small cells, differences in the amount of proteins per cell, or heterogeneity of the cells comprising the samples. By observing the expression levels across many different proteins in a sample, we can estimate differences in the total amount of protein in that sample vs other samples. Subtracting the median protein expression level forces the median value to become zero, allowing us to compare protein expressions across samples.
RPPA consensus clustering
173 samples (Figure S4C) with RPPA data were assessed. Pearson correlation was used as distance metric and Ward's method was used as a linkage algorithm in the clustering analysis. We identified five robust sample clusters, with most of the LMS samples clustering together in Cluster1 and the other histologic types being distributed between the rest of the clusters. The clusters and their protein expression patterns can be viewed through the next-generation clustered heat map (NGCHM) pipeline developed at the University of Texas MD Anderson Cancer Center. To illustrate the role of cell signaling networks in sarcoma, we calculated twelve pathway and process scores (apoptosis, cell cycle, DNA damage response, EMT, hormone receptor, hormone signaling (breast), P13K/AKT, RAS/MAPK, RTK, TSC/MTOR, breast reactive and core reactive) based on a previously described method (Akbani et al., 2014) (Figure S4D).
iCluster
Integrative clustering using iCluster
In the investigation of subgroups within sarcoma, we integrated various molecular platforms by using iCluster, which formulates the problem of subgroup discovery as a joint multivariate regression of multiple data types with reference to a set of common latent variables that represent the underlying tumor subtypes (Mo et al., 2013; Shen et al., 2009). The optimal combination of clusters was determined minimizing a Bayesian information criterion.
Data processing
As input to iCluster, we used four molecular platforms: DNA copy number, DNA methylation, mRNA expression, and miRNA expression. Data were pre-processed using the following procedures. Copy number alteration data was derived from CBS segmented data from the Affymetrix SNP6.0 array platform, and further reduced to a set of ~4000 non-redundant regions as described (Mo et al., 2013). For the methylation data (Illumina Infinium 450k arrays), the median absolute deviation was employed to select the top 4000 most variable CpG sites after beta-mixture quantile normalization (Pidsley et al., 2013). We removed methylation probes with >20% or more missing data and those corresponding to SNP and autosomal chromosomes. For mRNA and miRNA sequence data, we excluded genes with low expression (based on median-normalized counts). Variance filtering led to 4000 mRNAs and a variable number of miRNAs for clustering. mRNA and miRNA expression features were log2 transformed, normalized, and scaled before inputting to iCluster.
iCoMut
Interactive visualization and exploration
Within a single graphic iCoMut (firebrowse.org/awg/sarc) was used to create graphics that display the comprehensive analysis profile computed by Firehose (see next subsection); this enables readers to quickly infer co-occurring or mutually exclusive events for the sarcoma cohort, plotted on a common X axis of sample IDs, across a pipeline of approximately 100 individual analysis tasks spanning 10 data modalities. iCoMut was used to create interactive figures that allow panels to be moved, sorted, searched, and even extended with new data. These interactive figures are hosted on FireBrowse (http://firebrowse.org).
Data aggregation and analysis in Firehose began in the Broad Institute GDAC Firehose, an automated, high-throughput analysis pipeline designed to systematize analyses from The Cancer Genome Atlas. Firehose first normalized clinical annotations and molecular sample data, in the form of one file per sample, into analysis-ready aggregates (a single file with many samples) that can be immediately fed into scientific codes with no further processing. These data packages were documented in detailed sample reports and released to the public (gdac.broadinstitute.org/runs/sampleReports/latest), then fed into the analysis workflow (gdac.broadinstitute.org/Analyses-DAG.html). Primary analyses were automatically performed for every data type of every cohort, such as: significance assessment of mutations with MutSig and copy number alterations with GISTIC; functional analysis with Mutation Assessor; analysis of mutagenesis by APOBEC cytidine deaminases; miR, mRNA, and protein expression cluster assignments using both consensus hierarchical and consensus NMF methods; and pathway analyses with PARADIGM and GSEA. Statistical associations were automatically generated between many of these results, and to the entire suite of clinical variables (e.g. survival) available for the given cohort. q-values corresponding to FDR for individual gene mutations were computed by Mutsig2CV (Lawrence et al., 2013). All results were integrated and made publicly available as: (a) online HTML reports citable in the literature by DOIs (gdac.broadinstitute.org/runs/analyses__latest/reports), (b) the firebrowse.org portal and APIs (firebrowse.org/api-docs) and (c) visual exploration tools such as IGV, the UCSC Genome Browser and cBioPortal. In the context of this paper, Firehose served as firstpass analysis mechanism for the Sarcoma Analysis Working Group. In subsequent passes, custom data were integrated from outside the Firehose automated data flow, including the more accurate cluster and pathway analysis results manually curated by the Analysis Working Group.
Analysis feature matrix
As an intermediate step to rendering the iCoMut figure in FireBrowse, Firehose saved major analysis findings to a feature table (firebrowse.org/apidocs/#!/Analyses/FeatureTable), which was then processed and converted into JSON to populate each of the panels in the interactive display.
Regulome Explorer
Integrated analysis & interactive exploration
To gain greater insight into the development and progression of sarcomas, we integrated all of the data types produced by TCGA and described in this paper into a single “feature matrix.” From this single heterogeneous dataset, significant pairwise associations were inferred using statistical analysis and can be visually explored in a genomic context using Regulome Explorer, an interactive web application (http://explorer.cancerregulome.org). In addition to associations that are inferred directly from the TCGA data, additional sources of information and tools were integrated into the visualization for more extensive exploration (e.g., NCBI Gene, miRBase, the UCSC Genome Browser, etc.).
Feature matrix construction
A feature matrix was constructed using all available clinical, sample, and molecular data for 206 unique patient/tumor samples. The clinical information includes features such as age and tumor size; while the sample information includes features derived from molecular data such as single-platform cluster assignments. The molecular data includes mRNA and microRNA expression levels (Illumina HiSeq data), protein levels (RPPA data), copy number alterations (derived from segmented Affymetrix SNP data as well as GISTIC regions of interest and arm-level values), DNA methylation levels (Illumina Infinium Methylation 450k array), and somatic mutations. For mRNA expression data, gene-level RSEM values from RNA-seq were log2 transformed and filtered to remove low-variability genes (bottom 25% removed, based on interdecile range). For miRNA expression data, the summed and normalized microRNA quantification files were log2 transformed and filtered to remove low-variability microRNAs (bottom 25% removed, based on interdecile range). For methylation data, probes were filtered to remove the bottom 25% based on interdecile range. For somatic mutations, several binary mutation features indicating the presence or absence of a mutation in each sample were generated. Mutation types considered were synonymous, missense, nonsense, and frameshift. Protein domains (InterPro) including any of these mutation types were annotated as such, with nonsense and frameshift annotations being propagated to all subsequent protein domains.
Pairwise statistical significance
Statistical association among the diverse data types in this study was evaluated by comparing pairs of features in the feature matrix. Hypothesis testing was performed by testing against null models (i.e. absence of association), yielding a p-value. P-values for the association between and among clinical and molecular data types were computed according to the nature of the data levels for each pair: categorical vs categorical (Fisher’s exact test in the case of a 2×2 table, otherwise chi-square test); categorical vs continuous (Kruskal-Wallis test) or continuous vs continuous (probability of a given Spearman correlation value). Ranked data values were used in each case. To account for multiple-testing bias, the p-values were adjusted using the Bonferroni correction.
Regulome Explorer allows the user to interactively explore significant associations between various types of features – associations between molecular features (like miRNA expression and gene expression), associations between molecular features and derived numeric features (like immune infiltration scores), and associations between molecular features and categorical features such as clinical features or clusters derived from prior analysis (like iCluster).
PARADIGM
Integrated pathway analysis
Integration of copy number, mRNA expression, and pathway interaction data was performed on the 206 SARC samples using the PARADIGM software (Sedgewick et al., 2013). Briefly, this procedure infers integrated pathway levels for genes, complexes, and processes using pathway interactions and genomic and functional genomic data from each patient sample. Expression and gene copy number data were obtained from Firehose. One was added to all expression values, which were then log2-transformed and median-centered across samples for each gene. The log2-transformed, median-centered mRNA data were rank-transformed based on the global ranking across all samples and all genes, then discretized (+1 for values with ranks in the highest tertile, −1 for values with ranks in the lowest tertile, and 0 otherwise) prior to PARADIGM analysis.
Pathways were obtained in BioPax Level 3 format and included the NCIPID and BioCarta databases from http://pid.nci.nih.gov and the Reactome database from http://reactome.org. Gene identifiers were unified by UniProt ID then converted to Human Genome Nomenclature Committee’s HUGO symbols using mappings provided by the committee (http://www.genenames.org/). Altogether, 1524 pathways were obtained. Interactions from all of these sources were then combined into a merged Superimposed Pathway (SuperPathway). Genes, complexes, and abstract processes (e.g. “cell cycle” and “apoptosis”) were retained and henceforth referred to collectively as pathway features. The resulting pathway structure contained a total of 19504 features, representing 7369 proteins, 9354 complexes, 2092 protein families, 82 RNAs, 15 miRNAs, and 592 abstract processes.
The PARADIGM algorithm inferred an integrated pathway level (IPL) for each pathway feature; the IPL reflects the log likelihood of the probability that each pathway feature is activated (vs inactivated). PARADIGM IPLs of the 19,504 features within the SuperPathway are available on the genomic data commons (GDC; (https://portal.gdc.cancer.gov/). An initial minimum variation filter (at least 1 sample with absolute activity > 0.05) was applied, resulting in 15502 concepts (5898 proteins, 7307 complexes, 1916 families, 12 RNAs, 15 miRNAs and 354 abstract processes) with relative activities showing distinguishable variation across tumors.
Clustering of PARADIGM inferred pathways
Consensus clustering of the 206 SARC samples was based on the 3916 most varying features (i.e. IPLs with variance within the highest quartile) so as to identify new subgroups on the basis of shared patterns of pathway inference. Consensus clustering was implemented with the ConsensusClusterPlus package in R (Wilkerson and Hayes, 2010). Specifically, median-centered IPLs were used to compute the squared Euclidean distance between samples, and this metric was used as the input to the ConsensusClusterPlus algorithm. Hierarchical clustering using the Ward’s minimum variance method (i.e. ward inner linkage option) with 80% subsampling was performed over 1000 iterations, and the final consensus matrix was clustered using average linkage. The number of clusters was selected by considering the relative change in the area under the empirical cumulative distribution function curve as well as the average pairwise item-consensus within consensus clusters. We selected a cluster number of 5, as further separation provided minimal change and decreased the within-cluster consensus. In addition, consensus clusterings within LMS (n=80), DDLPS (n=50), and MFS together with UPS (n=61) were similarly performed.
Pathway features distinguishing each PARADIGM clusters (vs all others) were identified using the t-test and Wilcoxon Rank sum test with Benjamini-Hochberg FDR correction. Only features deemed significant (FDR-corrected p<0.05) by both tests and showing an absolute difference in group means > 0.05 were considered. Interconnectivity between these pathway biomarkers within the PARADIGM SuperPathway was assessed, and regulatory hubs with ≥ 10 differentially activated downstream targets were selected and displayed in a heatmap using the heatmap.plus package in R.
Differential pathway features in sarcoma
IPLs differentially activated between leiomyosarcoma (n=80) and other sarcomas (n=126) were identified using the t-test and Wilcoxon Rank Sum test with Benjamini-Hochberg FDR correction. Only features deemed significant (FDR-corrected p<0.05) by both tests and showing an absolute difference in group means > 0.05 were selected. Sub-networks linking differentially activated features through regulatory interactions within the PARADIGM SuperPathway structure were constructed and visualized using Cytoscape, and regulatory hubs with ≥ 10 differentially activated downstream targets were identified.
IPLs differentially activated between STLMS (n=53) and ULMS (n=27) were identified and features selected by the same method as above. Differentially activated IPLs were then filtered by connectivity within the SuperPathway, such that only interconnected features were retained. Pathway constituents of the PARADIGM SuperPathway enriched among these selected features were assessed using the EASE score with Benjamini-Hochberg FDR correction, and sub-networks linking differentially activated features through regulatory interactions were constructed and visualized using Cytoscape.
Quantitation of Nuclear Pleomorphism
Computational histologic analysis
Slide images were reviewed prior to analysis to remove those images containing scanning or preparation artifacts, or a significant proportion of tumor-infiltrating lymphocytes. A total of 63 images were removed from this portion of the analysis for these reasons. Slide images were analyzed at 20X objective resolution. Images scanned natively at 40X magnification were resized to 20X using a bicubic interpolation. In total, over 500,000,000 cell nuclei were scored. Color was normalized to a standard H&E image using Reinhard color normalization that maps the LAB color space statistics of each image to the standard to improve the analysis consistency. Normalized color images were unmixed using color deconvolution to digitally separate the hematoxylin (nuclear) and eosin stains. Nuclear regions were identified by applying morphological reconstruction to the hematoxylin image, and a watershed transformation was applied to separate closely packed nuclei. The area of each nucleus was then measured in pixels and the area of each nucleus in each slide recorded. A histogram of nuclear areas was created for each patient with 100 bins of 12 pixels each. Statistical moments of these histograms were calculated to capture the mean, variance, negative skew, and kurtosis of nuclear areas for each patient.
Histologic-genomic analysis
Several statistics were calculated for measures of pleomorphism against genomic features, using copy number data from SNP array–based methods (see SNP-based copy number analysis, above). Specifically, ploidy, subclonal genome fraction (which measures the fraction of tumor genome that is not part of the "plurality" clone, and therefore is a reflection of increasing genomic complexity), and genome doublings were calculated using the ABSOLUTE algorithm (Carter et al., 2012), and the number of unbalanced copy number segments was defined as the total number of copy number segments with a log2 segment mean ≤ −0.1 or ≥ 0.1 (level 3 seg file after ISAR-correction [see section 2.1]).
To determine the alternative aneuploidy score [aneuploidy score’] (number of events) for each sample, the ABSOLUTE algorithm was first used to determine the likeliest ploidy and absolute total copy number of each segment in the genome. Each segment was designated as amplified, deleted, or neutral based on whether its copy number was greater than, smaller than, or equal to the sample’s ploidy (rounded to the nearest integer) respectively. For amplifications and deletions separately (collectively “alterations”), segments were joined until either the entire chromosome was considered altered, or more than 20% of the genomic length between the start and ends were not altered in the same direction; e.g. >20% deleted or neutral for joining amplification segments. Alternative aneuploidy score [aneuploidy score’](number of events) is calculated as the fewest possible arm- or chromosome-level events that could have led from diploidy to the current allelic copy number state, including whole genome doubling events.
Statistical significance for correlations with histologic measures was calculated using the Pearson’s correlation, and statistical significance for comparisons between tumors with different numbers of whole genome doubling was calculated using ANOVA.
QUANTIFICATION AND STATISTICAL ANALYSIS
Quantification details and statistical analysis methods for each of the various data platforms and for integrated analyses are described in detail and referenced in their respective Method Details subsections.
DATA AND SOFTWARE AVAILABILITY
The raw data for TCGA SARC individual platforms, including DNA exome sequence, RNA expression sequence, miRNA expression sequence, DNA methylation beta values, SNP array (copy number data), and RPPA proteomics data, as well as clinical data are archived and publically available in the Genomic Data Commons (https://gdc.cancer.gov). Digital pathology images are also available at the Cancer Digital Slide Archive (http://cancer.digitalslidearchive.net/).
Software used for the analyses for each of the data platforms and integrated analyses are described and referenced in the individual Method Details subsections and are listed in the Key Resource Table.
ADDITIONAL RESOURCES
The TCGA SARC resource website is available at https://tcga-data.nci.nih.gov/docs/publications/sarc_2017/
Interactive tools for exploring the TCGA data have been developed by the Broad Institute (http://firebrowse.org, including the iCoMut visualization tool http://firebrowse.org/awg/sarc/iCoMut/?cohort=SARC), Memorial Sloan Kettering Cancer Center (http://www.cbioportal.org/), the Institute for Systems Biology (http://explorer.canccerregulome.org), and The University of Texas MD Anderson Cancer Center (http://bioinformatics.mdanderson.org/tcgambatch/)
Supplementary Material
(A) mRNA expression profile distinguishes LMS from other sarcoma types. Unsupervised pansarcoma mRNA expression clustering of the most variable genes across 206 sarcomas (2,038 genes; standard deviation ≥ 2.0) yielded 3 stable clusters. From left to right: Cluster 3, composed almost entirely of LMS tumors and having a unique expression profile; Cluster 1, predominantly DDLPS, SS, and MPNST; Cluster 2, predominantly DDLPS, UPS and MFS. A subset of genes, largely associated with inflammatory signatures, did not correlate with histology and were either ubiquitously on or off, with low expression in cluster 1 and high in cluster 2 (see also Figure 7A).
(B) Projection of 237 soft tissue sarcomas on a 2-D tumor “map” visualization of high-dimensional mRNA expression data. We also mapped the 31 cases that pathology review excluded from the final analysis (black dots) and cases that failed TCGA QC (gray dots). The excluded cases largely clustered with the included cases, consistent with their largely mesenchymal origin, despite some being of uncertain or inappropriate type. Among the included sarcomas, leiomyosarcomas (STLMS and ULMS) clustered together (lower right), while synovial sarcomas also formed a distinct cluster (left). The remaining sarcomas largely clustered together (as was seen in other platforms) with mixing of DDLPS, UPS and MFS. UPS appeared to separate into two major groups, one of which was more similar to DDLPS, and the second was more similar to MFS.
(C) Correlation of RPPA protein expression profiles with histologic type. Unsupervised pansarcoma cluster analysis on RPPA data from 173 samples analyzed with 192 antibodies yielded 5 stable clusters that showed statistically significant association with leukocyte fraction and histologic type (chi-square p-values shown). The annotation bars shown above the heatmap were not used for clustering. Cluster 1 (at left) contained predominantly leiomyosarcoma, while clusters 2–5 each contained a mixture of sarcoma types.
(D) Scores for therapeutically and prognostically relevant pathways commonly activated in malignancy were correlated with sarcoma RPPA clusters. The box plots show pathway scores for each of the 5 RPPA clusters. P-values are based on the ANOVA test for differences across the clusters. Relative to the other clusters, C1 (LMS-predominate, light blue) demonstrated high PI3K/AKT pathway and low apoptosis and RTK pathways. C4 (dark green) was characterized by high apoptosis, RTK, and DNA damage response pathways. In addition, C3 (light green, including all SS and MPNST) exhibited high hormone signaling and low PI3K/AKT, RAS/MAPK, breast reactive, and core reactive pathways, whereas C5 (gold, UPS/DDLPS) was high in apoptosis and EMT pathways and low in cell cycle and TSC/MTOR pathway activation.
(A) Results of cluster analyses. Shown are tumor histology, copy number alteration clustering, DNA methylation clustering, mRNA clustering, miRNA clustering excluding LMS samples, RPPA (protein) clustering, PARADIGM integrative clustering (copy number, mRNA expression, and pathway interaction data), and iCluster integrative clustering (DNA copy number, DNA methylation, mRNA expression, and miRNA expression). Individual tumors are shown in the same order as in Figure 1A. The displayed miRNA clustering excluded the LMS samples because (as can be seen in Panel C) they differed very strongly from other tumor types. As miRNA clustering was based on the 25% most variable miRNAs between samples, LMS could not be included since its markedly different miRNA expression profile relative to the other sarcomas overly limited the ability of the model to reliably cluster the remaining tumors.
(B) DNA methylation signatures in sarcoma. Left, unsupervised clustering of the 206 sarcomas based on DNA methylation, performed using the most variable CpG loci on the Illumina Infinium HM450 array. From left to right, the clusters are: M1, mixed DDLPS, UPS, MFS, and STLMS with high leukocyte fraction, 5-yr OS 54%; M2, synovial sarcoma with 5-year OS <24%; M3, predominantly STLMS, with good outcomes and 5-year OS 61%; M4, UPS/MFS with 5-year OS 0%; and M5, ULMS and DDLPS with poor outcomes and 5-year OS <33%. Right, leukocyte fraction by methylation cluster.
(C) miRNA signatures in sarcoma. Left panel: unsupervised hierarchical clustering using the top 25% most variable miRNAs across all 206 sarcomas. The analysis yielded 2 distinct clusters with very high concordance with LMS and nonLMS types, demonstrating that LMS (both uterine and soft tissue) have a very distinct miRNA profile from the other TCGA sarcoma types. Right panel: Cluster analysis of the 126 nonLMS samples, using the top 25% most variable miRNAs within the nonLMS types (DDLPS, MFS, MPNST, SS, and UPS). This resulted in a 3-cluster solution that was highly concordant with histology type: UPS/MFS, synovial, and DDLPS.
(A) Unsupervised clustering of DDLPS samples based on copy number alterations. Upper left panel, unsupervised clustering of the 50 DDLPS by copy number (GISTIC2.0 analysis from AffySNP 6.0) showed three main copy number clusters. Lower left panel, SCNA frequency plots for each of the three clusters, displaying the percentage of cases in the cohort using GISTIC 2.0 thresholded copy number assignment +2 (amplification) or -2 (deep deletion). Green lines mark the arbitrary threshold frequency of 5%. Red arrows mark each cluster's prominent SCNAs and the genes contained in them: the 6q25.1 amplification containing UST and SASH1 in K3, the 1p32.1 amplification containing JUN in K1, and 1q24.3 (DNM3, MIR214) and 5p15.33 (TERT) amplifications in K2. Fisher’s test was used to compare differences in rates of occurrence across different clusters, and the reported q-values were obtained after Benjamini-Hochberg correction for multiple hypotheses. Upper right panel, disease-specific survival according to copy number cluster. Lower right panels, expression of TERT and JUN in each copy number cluster.
(B) Graphs showing the association of highly methylated Meth2 cluster with poor DSS, low leukocyte fraction, and increased Th2 cells.
(C) Boxplot showing immature dendritic cell score in DDLPS by integrated copy number and methylation clusters.
(A) Pathway activation in LMS. The plots show RPPA pathway scores calculated for the 173 tumors for which RPPA results are available. LMS, compared with other sarcoma types, had higher AKT score (p=4e–06), higher hormone receptor score (p=0.00015), and lower apoptosis score (p=1e–05; p values are t-test, all LMS vs all other sarcomas). The difference in AKT score was largely driven by STLMS, and difference in hormone response scores was largely driven by ULMS; the higher AKT response score in ULMS and hormone response score in STLMS compared to other sarcoma types were not significant (p=0.09 and p=0.068, respectively, Tukey test). Apoptosis scores were lower in both STLMS and ULMS compared to other sarcomas (p<0.0001, Tukey test).
(B) Prognostic value of miR-181b-5p. Kaplan-Meier curve for RFS is shown for patients with tumors having miR-181b-5p abundance above and below the optimized cutoff (Budczies et al., 2012). The p value shown was adjusted for the cutoff finder and multiple testing.
(C) DNA damage and hypoxia response scores in ULMS and STLMS. First panel, HIF1α mRNA expression in STLMS relative to ULMS (t-test, p=9e–06). Second panel, HIF1α target gene expression signature (mRNA) correlated with HIF1α expression and was higher in STLMS (t-test p=6e–05). Third panel, RPPA DNA damage response score was higher in ULMS (t-test p=0.005).
(D) Thresholded copy number frequency analysis (GISTIC) of STLMS iCluster C1 vs C2. Fisher’s test was used to compare differences in rates of occurrence across different clusters, and q-values were obtained after Benjamini-Hochberg correction for multiple hypotheses. Arrow indicates a focal region (17p11.2 to 17p12) with significantly different copy number between C1 and C2 (q-value: 0.022). Genes from this locus include SLC5A10, FAM83G, GRAP, LOC388436, LOC79999, GRAPL, EPN2, EPN2- IT1, EPN2-AS1, B9D1, MIR1180, MAPK7, MFAP4, MYOCD, LOC101928418, LOC100128006, and ARHGAP44.
(E) Histologic spectrum of UPS/MFS. Top left panel, classic area of low-grade MFS. Top right panel, MFS showing transition from classic low grade to high-grade UPS-like morphology. Lower left panel, high-grade area of MFS histologically indistinguishable from classic UPS. Lower right panel, classic UPS. All images were captured at 200x magnification (TCGA digital slide scans, Aperio Imagescope. Scale bar, 200 µm).
(F) Multivariable miRNA prognostic classifier for metastasis-free survival. We performed a LASSO penalized regression analysis using all miRNAs and tumor size in 54 UPS/MFS samples to identify sets of miRNAs and coefficients that would best predict metastasis-free survival. The samples were split into high and low groups based on their model score at a cutpoint that minimized the log-rank p-value. P value shown is corrected for multiple testing.
(A) Box plots showing the distribution of selected immune signatures by histology. Macrophage score: p<0.008 for UPS/MFS or DDLPS vs other sarcomas in all pairwise comparisons. CD8: p<0.005 for DDLPS vs other sarcoma types in all pairwise comparisons. PD-L1: p<0.032 for STMLS vs other sarcomas in all pairwise combinations.
(B) Validation of immune scores in LMS, MFS, and SS. Scatterplots show the median immune infiltration score for each immune signature with TCGA data displayed on the xaxis and the validation data from Lesluyes et al. displayed on the y-axis. The Spearman correlation coefficient is shown for each.
(C) Validation of CD8, NK and TH2 immune scores for DDLPS and UPS. Plots show scores for each individual tumor in the Lesluyes et al. cohort or the TCGA cohort, demonstrating similar distribution of scores between the data sets. (D) Expression of three druggable immune targets in tumors ordered by sarcoma type. Expression of each differed significantly among the sarcoma types (p=1.6e–15 for B7- H3, 9.8e–11 for TGFB1, and 2.9e–14 for TIM3 by Kruskal-Wallis test).
Methods S1. Author Contributions and Affiliations
Table S7. RPPA antibody list. Related to STAR Methods RPPA analysis.
Table S1. Characteristics of patients in the study. Related to Figure 1.
Table S3. Features significantly contributing to discrimination of the 5 clusters in the iCluster analysis of all sarcoma samples. Related to Figure 3E.
Table S4. Copy number gains detected by GISTIC analysis of dedifferentiated liposarcoma. Related to Figure 4A,B.
Table S5. miRNAs associated with survival in LMS. Related to Figure S6B
Table S6. iCluster characteristics of LMS as a whole and of STLMS. Related to Figure 5B and 5C.
(A) Schematic of classification following expert pathology review of 237 submitted sarcoma samples, illustrating the challenge of accurate diagnosis in sarcoma pathology, and the need for central pathology review in large scale multi-institutional studies such as TCGA. Thirty-one cases (grey boxes) were excluded from final analysis, including 5 tumors which were not sarcomas; 8 which were considered to be tumors of inappropriate type (including the two desmoid tumors, which were excluded from final analysis due to insufficient case numbers); 17 tumors for which a definite classification could not be made based on the available material for review; and one DDLPS which was infiltrated by chronic lymphocytic lymphoma. A further 20 sarcomas were reclassified from one included type of sarcoma to another, as indicated by lines.
(B) Copy number alterations in sarcoma. The 206 sarcomas were subjected to unsupervised hierarchical clustering based on significantly amplified or deleted regions across the genome (as determined by GISTIC 2.0), resulting in six distinct genomic clusters. From left to right: DDLPS CIN, a group consisting almost exclusively of DDLPS, with hallmark amplicons in chromosome 12q and also various other SCNAs across the genome; quiet, which contains all but one of the synovial sarcomas as well as genomically stable DDLPS and other copy-number–quiet tumors; LMS quiet, characterized by chromosomal or arm-level deletions but relatively few other SCNAs; LMS CIN, LMS with more chromosomal instability than those in LMS quiet; UPS/MFS 1, a highly chromosomally unstable group enriched for UPS and MFS; and UPS/MFS 2, another group enriched for UPS and MFS. UPS/MFS 1 and 2 are distinguished by different frequencies of SCNAs, including more RB1 focal deletions in UPS/MFS1 and more chromosome 8p and 9p deletions in UPS/MFS 2.
(C) Number of unbalanced segments for each tumor plotted for each TCGA cohort and for each sarcoma histologic type included in the sarcoma TCGA. Sarcoma types are boxed.
(D) Number of nonsynonymous somatic mutations versus number of unbalanced segments mapped for each individual sarcoma case (color coded by histologic type) and, for comparison, a randomly chosen 10% of all other TCGA specimens.
(E) TERT expression plotted against TERT copy number alterations. Mutations and identified TRIO-TERT fusions are indicated.
(A) Types of somatic mutations detected by whole-exome sequencing of the 206 sarcomas. In total, 11,096 somatic mutations were detected, including 10,437 point mutations and 659 insertions/deletions (indels). Point mutations included 2624 silent, 7130 missense, 442 nonsense, 17 read-through, and 224 splice-site mutations.
(B) De-novo mutational signatures identified using a Bayesian variant of non-negative matrix factorization (Kasar et al., 2015). Top, signatures extracted from 205 WES samples, identifying two major mutational processes. The first signature (SIG.WES1), characterized by a broad spectrum of base substitutions, is most similar to the COSMIC5 signature (http://cancer.sanger.ac.uk/cosmic/signatures) (cosine similarity = 0.8). The second signature (SIG.WES2) had dominant C>T mutations at CpG dinucleotide sites; this signature is most similar to COSMIC1 (cosine similarity = 0.93) and COSMIC6 (cosine similarity = 0.85). COSMIC1 is caused by spontaneous cytosine deamination. COSMIC6 is associated with defective DNA mismatch repair and is present in microsatellite-unstable tumors. This signature was high in two tumors with the highest mutation burden (TCGA-DX-AB32 and TCGA-3B-A9HT), explaining 80% of all mutations in these two samples, compared with 9% of mutations in the remaining samples. Bottom, de-novo mutational signatures in coding regions extracted from 37 WGS samples. Two signatures (SIG.WGS1 and SIG.WGS3) were similar to those observed in WES samples. The additional signatures were SIG.WGS2, characteristic of dominant C>T mutations at TCW (W=A/T) contexts, and SIG.WGS4, with C>G mutations at TCW contexts. These two signatures were most similar to COSMIC2 (cosine similarity = 0.73) and COSMIC13 (cosine similarity = 0.79), respectively, which are attributed to the mutagenesis of the AID/APOBEC family of cytidine deaminases, indicating a minor role of APOBEC mutagenesis in SARC tumors in addition to COSMIC1 and 5.
(C) Scatter plots of the signature activity: number of mutations assigned to SIG.WES2 in panel B (with a pseudocount of one added to permit log transformation) vs mRNA levels of MSH6 (top) and MSH2 (bottom) measured by log2(fold change against median across tumors). The boxes highlight the two hyper-mutant, putative microsatellite instability (MSI) samples, AB32 and A9HT. AB32 had a frameshift mutation in MSH6. A9HT had no mutations in detected in the DNA mismatch repair genes MLH1, MSH2, MSH3, or MSH6, but had the lowest MSH2 expression and had a significant enrichment of 1-base insertions and deletions (14% vs mean 3% in remaining samples).
(D) Pearson correlation between age at diagnosis and the combined activity of COSMIC1 and COSMIC5 signatures across 203 WES samples, by sarcoma type. Correlation coefficients and p-values are as follows: All sarcoma 0.34, p<0.00001; DDLPS 0.38, p=0.006; MFS 0.52, p=0.04; MPNST −0.38, p=0.53; SS 0.45, p=0.2; STLMS 0.43, p=0.001; ULMS 0.35, p=0.07; UPS −0.02, p=0.9.
(E) Analysis of nuclear area. Image analysis algorithms were used to measure the sizes of over 500,000,000 cell nuclei in digitized sarcoma tissues. Distributions of nuclear area shown here are from a UPS (TCGA-DX-A8BM – red) and a synovial sarcoma 45 (TCGA-DX-A7EQ – blue). The UPS contained larger and more heterogeneous nuclei, as can be seen from the longer area distribution tail.
(F) The variance measure of nuclear area was significantly associated with subclonal genome fraction (left) and with an aneuploidy score based on the number of arms with gains or losses (Aneuploidy score’) (right), by Pearson correlation.
Highlights.
-
*
Multiplatform genetic analysis of 206 sarcomas of 6 types shows their diversity
-
*
Sarcomas harbor many more copy number alterations than most other cancer types
-
*
Inferred immune microenvironment associates with outcome in multiple sarcoma types
-
*
Computed histologic nuclear pleomorphism correlates with aneuploidy estimates
Acknowledgments
We thank the patients and families who contributed to this study. This project is supported by the following NIH grants: U54 HG003273, U54 HG003067, U54 HG003079, U24 CA143799, U24 CA143835, U24 CA143840, U24 CA143843, U24 CA143845, U24 CA143848, U24 CA143858, U24 CA143866, U24 CA143867, U24 CA143882, U24 CA143883, U24 CA144025, and P30 CA016672. Andrew Cherniack and Matthew Meyerson receive funding from Bayer AG.
Footnotes
Publisher's Disclaimer: This is a PDF file of an unedited manuscript that has been accepted for publication. As a service to our customers we are providing this early version of the manuscript. The manuscript will undergo copyediting, typesetting, and review of the resulting proof before it is published in its final form. Please note that during the production process errors may be discovered which could affect the content, and all legal disclaimers that apply to the journal pertain.
AUTHOR CONTRIBUTIONS
The Cancer Genome Atlas Network contributed collectively to this study. Biospecimens were provided by the tissue source sites and processed by the Biospecimen Core Resource. Data generation and analyses were performed by the Genome Sequencing Centers, Cancer Genome Characterization Centers, and Denome Data Analysis Centers. All data were released through the Data Coordinating Center. The NCI and NHGRI project teams coordinated project activities. For a complete description of the contributions of each author, as well as their affiliations, please refer to Methods S1. We also acknowledge the following TCGA investigators of the Sarcoma Analysis Working Group who contributed substantially to the project: Project coordinator: IF; Data coordinator: FSV; Analysis coordinators: IF, FSV; Manuscript coordinators: EGD, JEN; Project chairs: EGD, L Ding, ML, AJL, S Singer, BAVT; Pathology subgroup: EGD, LAD, JLH, AJL, BPR, MVDR; Clinical subgroup: L Baker, GDD, JEGO, AJL, LI, TML, CPR, RFR, S Singer; Mutation and SMG analysis: MHB, QG, MW, WW; Copy-number: ADC, JS; mRNA: IJD, AJH, KAH; miRNA: R Bowlby, AGR; Methylation: L Danilova; Mutational signature: JK; Computational histologic-genomics: LADC, DHG, AJL, JS; Whole genome: JK, MDM, WW; Whole exome: JK, MDM; EMT: L Byers, L Diao, J Wang; RPPA: RA, AMH, J Roszik; Immune signatures: IJD, AJH, KAH; Integrative analysis: JA, EML, YN, AP, FSV, RS; iCoMut: DIH, MSN; iCluster: ED, RS; PARADIGM: CB, CY; Regulome explorer: LI; Manuscript writing committee: EGD, L Ding, ML, AJL, JEN, FSV, S Singer, BAVT; Manuscript review: L Baker, L Byers, ADC, LADC, L Cope, IJD, LED, LAD, ED, AKG, JEGO, DNH, AJH, KAH, DBH, JLH, LI, JK, RGM, REP, RFR, AGR, BPR, JS, JNW, WW.
References
- Akbani R, Ng PK, Werner HM, Shahmoradgoli M, Zhang F, Ju Z, Liu W, Yang JY, Yoshihara K, Li J, et al. A pan-cancer proteomic perspective on The Cancer Genome Atlas. Nat. Commun. 2014;5:3887. doi: 10.1038/ncomms4887. [DOI] [PMC free article] [PubMed] [Google Scholar]
- Alexandrov LB, Jones PH, Wedge DC, Sale JE, Campbell PJ, Nik-Zainal S, Stratton MR. Clock-like mutational processes in human somatic cells. Nat. Genet. 2015;47:1402–1407. doi: 10.1038/ng.3441. [DOI] [PMC free article] [PubMed] [Google Scholar]
- Barretina J, Taylor BS, Banerji S, Ramos AH, Lagos-Quintana M, Decarolis PL, Shah K, Socci ND, Weir BA, Ho A, et al. Subtype-specific genomic alterations define new targets for soft-tissue sarcoma therapy. Nat. Genet. 2010;42:715–721. doi: 10.1038/ng.619. [DOI] [PMC free article] [PubMed] [Google Scholar]
- Beck AH, Lee CH, Witten DM, Gleason BC, Edris B, Espinosa I, Zhu S, Li R, Montgomery KD, Marinelli RJ, et al. Discovery of molecular subtypes in leiomyosarcoma through integrative molecular profiling. Oncogene. 2010;29:845–854. doi: 10.1038/onc.2009.381. [DOI] [PMC free article] [PubMed] [Google Scholar]
- Bibikova M, Barnes B, Tsan C, Ho V, Klotzle B, Le JM, Delano D, Zhang L, Schroth GP, Gunderson KL, et al. High density DNA methylation array with single CpG site resolution. Genomics. 2011;98:288–295. doi: 10.1016/j.ygeno.2011.07.007. [DOI] [PubMed] [Google Scholar]
- Bindea G, Mlecnik B, Tosolini M, Kirilovsky A, Waldner M, Obenauf AC, Angell H, Fredriksen T, Lafontaine L, Berger A, et al. Spatiotemporal dynamics of intratumoral immune cells reveal the immune landscape in human cancer. Immunity. 2013;39:782–795. doi: 10.1016/j.immuni.2013.10.003. [DOI] [PubMed] [Google Scholar]
- Budczies J, Klauschen F, Sinn BV, Gyorffy B, Schmitt WD, Darb-Esfahani S, Denkert C. Cutoff Finder: a comprehensive and straightforward Web application enabling rapid biomarker cutoff optimization. PLoS One. 2012;7:e51862. doi: 10.1371/journal.pone.0051862. [DOI] [PMC free article] [PubMed] [Google Scholar]
- Burgess M, Bolejack V, Van T, BA, Schuetze S, Hu J, D'Angelo S, Attia S, Riedel R, Priebat D, Movva S, et al. Pembrolizumab in advanced soft tissue and bone sarcomas: results of SARC028, a multicentre, single arm, phase 2 trial. Lancet Oncol. 2017 doi: 10.1016/S1470-2045(17)30624-1. in press. [DOI] [PMC free article] [PubMed] [Google Scholar]
- Cancer Genome Atlas Research Network. Integrated genomic analyses of ovarian carcinoma. Nature. 2011;474:609–615. doi: 10.1038/nature10166. [DOI] [PMC free article] [PubMed] [Google Scholar]
- Cancer Genome Atlas Research Network. Comprehensive genomic characterization of squamous cell lung cancers. Nature. 2012;489:519–525. doi: 10.1038/nature11404. [DOI] [PMC free article] [PubMed] [Google Scholar]
- Cancer Genome Atlas Research Network. Comprehensive molecular profiling of lung adenocarcinoma. Nature. 2014;511:543–550. doi: 10.1038/nature13385. [DOI] [PMC free article] [PubMed] [Google Scholar]
- Carter SL, Cibulskis K, Helman E, McKenna A, Shen H, Zack T, Laird PW, Onofrio RC, Winckler W, Weir BA, et al. Absolute quantification of somatic DNA alterations in human cancer. Nat. Biotechnol. 2012;30:413–421. doi: 10.1038/nbt.2203. [DOI] [PMC free article] [PubMed] [Google Scholar]
- Chu A, Robertson G, Brooks D, Mungall AJ, Birol I, Coope R, Ma Y, Jones S, Marra MA. Large-scale profiling of microRNAs for The Cancer Genome Atlas. Nucleic Acids Res. 2016;44:e3. doi: 10.1093/nar/gkv808. [DOI] [PMC free article] [PubMed] [Google Scholar]
- Cibulskis K, Lawrence MS, Carter SL, Sivachenko A, Jaffe D, Sougnez C, Gabriel S, Meyerson M, Lander ES, Getz G. Sensitive detection of somatic point mutations in impure and heterogeneous cancer samples. Nat. Biotechnol. 2013;31:213–219. doi: 10.1038/nbt.2514. [DOI] [PMC free article] [PubMed] [Google Scholar]
- Cibulskis K, McKenna A, Fennell T, Banks E, DePristo M, Getz G. ContEst: estimating cross-contamination of human samples in next-generation sequencing data. Bioinformatics. 2011;27:2601–2602. doi: 10.1093/bioinformatics/btr446. [DOI] [PMC free article] [PubMed] [Google Scholar]
- Cingolani P, Platts A, Wang le L, Coon M, Nguyen T, Wang L, Land SJ, Lu X, Ruden DM. A program for annotating and predicting the effects of single nucleotide polymorphisms, SnpEff: SNPs in the genome of Drosophila melanogaster strain w1118; iso-2; iso-3. Fly (Austin) 2012;6:80–92. doi: 10.4161/fly.19695. [DOI] [PMC free article] [PubMed] [Google Scholar]
- Costello M, Pugh TJ, Fennell TJ, Stewart C, Lichtenstein L, Meldrim JC, Fostel JL, Friedrich DC, Perrin D, Dionne D, et al. Discovery and characterization of artifactual mutations in deep coverage targeted capture sequencing data due to oxidative DNA damage during sample preparation. Nucleic Acids Res. 2013;41:e67. doi: 10.1093/nar/gks1443. [DOI] [PMC free article] [PubMed] [Google Scholar]
- De Monte L, Reni M, Tassi E, Clavenna D, Papa I, Recalde H, Braga M, Di Carlo V, Doglioni C, Protti MP. Intratumor T helper type 2 cell infiltrate correlates with cancer-associated fibroblast thymic stromal lymphopoietin production and reduced survival in pancreatic cancer. J. Exp. Med. 2011;208:469–478. doi: 10.1084/jem.20101876. [DOI] [PMC free article] [PubMed] [Google Scholar]
- Dees ND, Zhang Q, Kandoth C, Wendl MC, Schierding W, Koboldt DC, Mooney TB, Callaway MB, Dooling D, Mardis ER, et al. MuSiC: identifying mutational significance in cancer genomes. Genome Res. 2012;22:1589–1598. doi: 10.1101/gr.134635.111. [DOI] [PMC free article] [PubMed] [Google Scholar]
- Delespaul L, Lesluyes T, Perot G, Brulard C, Lartigue L, Baud J, Lagarde P, Le Guellec S, Neuville A, Terrier P, et al. Recurrent TRIO Fusion in Nontranslocation-Related Sarcomas. Clin. Cancer Res. 2017;23:857–867. doi: 10.1158/1078-0432.CCR-16-0290. [DOI] [PubMed] [Google Scholar]
- Ding Z, Mangino M, Aviv A, Spector T, Durbin R. Estimating telomere length from whole genome sequence data. Nucleic Acids Res. 2014;42:e75. doi: 10.1093/nar/gku181. [DOI] [PMC free article] [PubMed] [Google Scholar]
- Elvidge GP, Glenny L, Appelhoff RJ, Ratcliffe PJ, Ragoussis J, Gleadle JM. Concordant regulation of gene expression by hypoxia and 2-oxoglutarate-dependent dioxygenase inhibition: the role of HIF-1alpha, HIF-2alpha, and other pathways. J. Biol. Chem. 2006;281:15215–15226. doi: 10.1074/jbc.M511408200. [DOI] [PubMed] [Google Scholar]
- Faraggi D, Simon R. A simulation study of cross-validation for selecting an optimal cutpoint in univariate survival analysis. Stat. Med. 1996;15:2203–2213. doi: 10.1002/(SICI)1097-0258(19961030)15:20<2203::AID-SIM357>3.0.CO;2-G. [DOI] [PubMed] [Google Scholar]
- Fawcett TW, Eastman HB, Martindale JL, Holbrook NJ. Physical and functional association between GADD153 and CCAAT/enhancer-binding protein beta during cellular stress. J. Biol. Chem. 1996;271:14285–14289. doi: 10.1074/jbc.271.24.14285. [DOI] [PubMed] [Google Scholar]
- Fletcher CDM, Bridge J, Hogendoorn PCW, Mertens F, editors. WHO Classification of Tumours of Soft Tissue and Bone. Geneva: WHO Press; 2013. [Google Scholar]
- Forbes SA, Tang G, Bindal N, Bamford S, Dawson E, Cole C, Kok CY, Jia M, Ewing R, Menzies A, et al. COSMIC (the Catalogue of Somatic Mutations in Cancer): a resource to investigate acquired mutations in human cancer. Nucleic Acids Res. 2010;38:D652–657. doi: 10.1093/nar/gkp995. [DOI] [PMC free article] [PubMed] [Google Scholar]
- Gaujoux R, Seoighe C. A flexible R package for nonnegative matrix factorization. BMC Bioinformatics. 2010;11:367. doi: 10.1186/1471-2105-11-367. [DOI] [PMC free article] [PubMed] [Google Scholar]
- Gibault L, Ferreira C, Perot G, Audebourg A, Chibon F, Bonnin S, Lagarde P, Vacher-Lavenu MC, Terrier P, Coindre JM, et al. From PTEN loss of expression to RICTOR role in smooth muscle differentiation: complex involvement of the mTOR pathway in leiomyosarcomas and pleomorphic sarcomas. Mod. Pathol. 2012;25:197–211. doi: 10.1038/modpathol.2011.163. [DOI] [PubMed] [Google Scholar]
- Gonzalez-Angulo AM, Hennessy BT, Meric-Bernstam F, Sahin A, Liu W, Ju Z, Carey MS, Myhre S, Speers C, Deng L, et al. Functional proteomics can define prognosis and predict pathologic complete response in patients with breast cancer. Clin. Proteomics. 2011;8:11. doi: 10.1186/1559-0275-8-11. [DOI] [PMC free article] [PubMed] [Google Scholar]
- Guo X, Jo VY, Mills AM, Zhu SX, Lee CH, Espinosa I, Nucci MR, Varma S, Forgo E, Hastie T, et al. Clinically Relevant Molecular Subtypes in Leiomyosarcoma. Clin Cancer Res. 2015;21:3501–3511. doi: 10.1158/1078-0432.CCR-14-3141. [DOI] [PMC free article] [PubMed] [Google Scholar]
- Helias-Rodzewicz Z, Perot G, Chibon F, Ferreira C, Lagarde P, Terrier P, Coindre JM, Aurias A. YAP1 and VGLL3, encoding two cofactors of TEAD transcription factors, are amplified and overexpressed in a subset of soft tissue sarcomas. Genes Chromosomes Cancer. 2010;49:1161–1171. doi: 10.1002/gcc.20825. [DOI] [PubMed] [Google Scholar]
- Hennessy BT, Lu Y, Gonzalez-Angulo AM, Carey MS, Myhre S, Ju Z, Davies MA, Liu W, Coombes K, Meric-Bernstam F, et al. A Technical Assessment of the Utility of Reverse Phase Protein Arrays for the Study of the Functional Proteome in Non-microdissected Human Breast Cancers. Clin. Proteomics. 2010;6:129–151. doi: 10.1007/s12014-010-9055-y. [DOI] [PMC free article] [PubMed] [Google Scholar]
- Hsu SD, Tseng YT, Shrestha S, Lin YL, Khaleel A, Chou CH, Chu CF, Huang HY, Lin CM, Ho SY, et al. miRTarBase update 2014: an information resource for experimentally validated miRNA-target interactions. Nucleic Acids Res. 2014;42:D78–85. doi: 10.1093/nar/gkt1266. [DOI] [PMC free article] [PubMed] [Google Scholar]
- Hu J, He X, Baggerly KA, Coombes KR, Hennessy BT, Mills GB. Non-parametric quantification of protein lysate arrays. Bioinformatics. 2007;23:1986–1994. doi: 10.1093/bioinformatics/btm283. [DOI] [PubMed] [Google Scholar]
- Huang da W, Sherman BT, Lempicki RA. Systematic and integrative analysis of large gene lists using DAVID bioinformatics resources. Nat. Protoc. 2009;4:44–57. doi: 10.1038/nprot.2008.211. [DOI] [PubMed] [Google Scholar]
- Italiano A, Kind M, Stoeckle E, Jones N, Coindre JM, Bui B. Temsirolimus in advanced leiomyosarcomas: patterns of response and correlation with the activation of the mammalian target of rapamycin pathway. Anticancer Drugs. 2011;22:463–467. doi: 10.1097/CAD.0b013e3283442074. [DOI] [PubMed] [Google Scholar]
- Jung H, Kim WK, Kim DH, Cho YS, Kim SJ, Park SG, Park BC, Lim HM, Bae KH, Lee SC. Involvement of PTP-RQ in differentiation during adipogenesis of human mesenchymal stem cells. Biochem. Biophys. Res. Commun. 2009;383:252–257. doi: 10.1016/j.bbrc.2009.04.001. [DOI] [PubMed] [Google Scholar]
- Kadoch C, Crabtree GR. Reversible disruption of mSWI/SNF (BAF) complexes by the SS18-SSX oncogenic fusion in synovial sarcoma. Cell. 2013;153:71–85. doi: 10.1016/j.cell.2013.02.036. [DOI] [PMC free article] [PubMed] [Google Scholar]
- Kasar S, Kim J, Improgo R, Tiao G, Polak P, Haradhvala N, Lawrence MS, Kiezun A, Fernandes SM, Bahl S, et al. Whole-genome sequencing reveals activation-induced cytidine deaminase signatures during indolent chronic lymphocytic leukaemia evolution. Nat. Commun. 2015;6:8866. doi: 10.1038/ncomms9866. [DOI] [PMC free article] [PubMed] [Google Scholar]
- Koboldt DC, Zhang Q, Larson DE, Shen D, McLellan MD, Lin L, Miller CA, Mardis ER, Ding L, Wilson RK. VarScan 2: somatic mutation and copy number alteration discovery in cancer by exome sequencing. Genome Res. 2012;22:568–576. doi: 10.1101/gr.129684.111. [DOI] [PMC free article] [PubMed] [Google Scholar]
- Koh WJ, Greer BE, Abu-Rustum NR, Apte SM, Campos SM, Cho KR, Chu C, Cohn D, Crispens MA, Dizon DS, et al. Uterine Sarcoma, Version 1.2016: Featured Updates to the NCCN Guidelines. J Natl Compr Canc Netw. 2015;13:1321–1331. doi: 10.6004/jnccn.2015.0162. [DOI] [PubMed] [Google Scholar]
- Korn JM, Kuruvilla FG, McCarroll SA, Wysoker A, Nemesh J, Cawley S, Hubbell E, Veitch J, Collins PJ, Darvishi K, et al. Integrated genotype calling and association analysis of SNPs, common copy number polymorphisms and rare CNVs. Nat Genet. 2008;40:1253–1260. doi: 10.1038/ng.237. [DOI] [PMC free article] [PubMed] [Google Scholar]
- Kovatcheva M, Liu DD, Dickson MA, Klein ME, O'Connor R, Wilder FO, Socci ND, Tap WD, Schwartz GK, Singer S, et al. MDM2 turnover and expression of ATRX determine the choice between quiescence and senescence in response to CDK4 inhibition. Oncotarget. 2015;6:8226–8243. doi: 10.18632/oncotarget.3364. [DOI] [PMC free article] [PubMed] [Google Scholar]
- Larson DE, Harris CC, Chen K, Koboldt DC, Abbott TE, Dooling DJ, Ley TJ, Mardis ER, Wilson RK, Ding L. SomaticSniper: identification of somatic point mutations in whole genome sequencing data. Bioinformatics. 2012;28:311–317. doi: 10.1093/bioinformatics/btr665. [DOI] [PMC free article] [PubMed] [Google Scholar]
- Lawrence MS, Stojanov P, Polak P, Kryukov GV, Cibulskis K, Sivachenko A, Carter SL, Stewart C, Mermel CH, Roberts SA, et al. Mutational heterogeneity in cancer and the search for new cancer-associated genes. Nature. 2013;499:214–218. doi: 10.1038/nature12213. [DOI] [PMC free article] [PubMed] [Google Scholar]
- Lesluyes T, Perot G, Largeau MR, Brulard C, Lagarde P, Dapremont V, Lucchesi C, Neuville A, Terrier P, Vince-Ranchere D, et al. RNA sequencing validation of the Complexity INdex in SARComas prognostic signature. Eur J Cancer. 2016;57:104–111. doi: 10.1016/j.ejca.2015.12.027. [DOI] [PubMed] [Google Scholar]
- Li B, Dewey CN. RSEM: accurate transcript quantification from RNA-Seq data with or without a reference genome. BMC Bioinformatics. 2011;12:323. doi: 10.1186/1471-2105-12-323. [DOI] [PMC free article] [PubMed] [Google Scholar]
- Li H, Durbin R. Fast and accurate short read alignment with Burrows-Wheeler transform. Bioinformatics. 2009;25:1754–1760. doi: 10.1093/bioinformatics/btp324. [DOI] [PMC free article] [PubMed] [Google Scholar]
- Li H, Handsaker B, Wysoker A, Fennell T, Ruan J, Homer N, Marth G, Abecasis G, Durbin R. The Sequence Alignment/Map format and SAMtools. Bioinformatics. 2009;25:2078–2079. doi: 10.1093/bioinformatics/btp352. [DOI] [PMC free article] [PubMed] [Google Scholar]
- Li H, Ruan J, Durbin R. Mapping short DNA sequencing reads and calling variants using mapping quality scores. Genome Res. 2008;18:1851–1858. doi: 10.1101/gr.078212.108. [DOI] [PMC free article] [PubMed] [Google Scholar]
- Li J, Tibshirani R. Finding consistent patterns: a nonparametric approach for identifying differential expression in RNA-Seq data. Stat Methods Med Res. 2013;22:519–536. doi: 10.1177/0962280211428386. [DOI] [PMC free article] [PubMed] [Google Scholar]
- Li TJ, Chen YL, Gua CJ, Xue SJ, Ma SM, Li XD. MicroRNA 181b promotes vascular smooth muscle cells proliferation through activation of PI3K and MAPK pathways. Int J Clin Exp Pathol. 2015;8:10375–10384. [PMC free article] [PubMed] [Google Scholar]
- Liau JY, Lee JC, Tsai JH, Yang CY, Liu TL, Ke ZL, Hsu HH, Jeng YM. Comprehensive screening of alternative lengthening of telomeres phenotype and loss of ATRX expression in sarcomas. Mod Pathol. 2015;28:1545–1554. doi: 10.1038/modpathol.2015.114. [DOI] [PubMed] [Google Scholar]
- Mariani O, Brennetot C, Coindre JM, Gruel N, Ganem C, Delattre O, Stern MH, Aurias A. JUN oncogene amplification and overexpression block adipocytic differentiation in highly aggressive sarcomas. Cancer Cell. 2007;11:361–374. doi: 10.1016/j.ccr.2007.02.007. [DOI] [PubMed] [Google Scholar]
- Martin S, Brown WM, Klavans R, Boyack KW. OpenOrd: An open-source toolbox for large graph layout. Paper presented at: Visualization and Data Analysis.2011. [Google Scholar]
- McKenna A, Hanna M, Banks E, Sivachenko A, Cibulskis K, Kernytsky A, Garimella K, Altshuler D, Gabriel S, Daly M, et al. The Genome Analysis Toolkit: a MapReduce framework for analyzing next-generation DNA sequencing data. Genome Res. 2010;20:1297–1303. doi: 10.1101/gr.107524.110. [DOI] [PMC free article] [PubMed] [Google Scholar]
- Mermel CH, Schumacher SE, Hill B, Meyerson ML, Beroukhim R, Getz G. GISTIC2.0 facilitates sensitive and confident localization of the targets of focal somatic copy-number alteration in human cancers. Genome Biol. 2011;12:R41. doi: 10.1186/gb-2011-12-4-r41. [DOI] [PMC free article] [PubMed] [Google Scholar]
- Mo Q, Wang S, Seshan VE, Olshen AB, Schultz N, Sander C, Powers RS, Ladanyi M, Shen R. Pattern discovery and cancer gene identification in integrated cancer genomic data. Proc Natl Acad Sci U S A. 2013;110:4245–4250. doi: 10.1073/pnas.1208949110. [DOI] [PMC free article] [PubMed] [Google Scholar]
- Niu B, Scott AD, Sengupta S, Bailey MH, Batra P, Ning J, Wyczalkowski MA, Liang W-W, Zhang Q, McLellan MD. Protein-structure-guided discovery of functional mutations across 19 cancer types. Nat Genet. 2016;48:827–837. doi: 10.1038/ng.3586. [DOI] [PMC free article] [PubMed] [Google Scholar]
- Olshen AB, Venkatraman ES, Lucito R, Wigler M. Circular binary segmentation for the analysis of array-based DNA copy number data. Biostatistics. 2004;5:557–572. doi: 10.1093/biostatistics/kxh008. [DOI] [PubMed] [Google Scholar]
- Perot G, Derre J, Coindre JM, Tirode F, Lucchesi C, Mariani O, Gibault L, Guillou L, Terrier P, Aurias A. Strong smooth muscle differentiation is dependent on myocardin gene amplification in most human retroperitoneal leiomyosarcomas. Cancer Res. 2009;69:2269–2278. doi: 10.1158/0008-5472.CAN-08-1443. [DOI] [PubMed] [Google Scholar]
- Pidsley R, CC YW, Volta M, Lunnon K, Mill J, Schalkwyk LC. A data-driven approach to preprocessing Illumina 450K methylation array data. BMC Genomics. 2013;14:293. doi: 10.1186/1471-2164-14-293. [DOI] [PMC free article] [PubMed] [Google Scholar]
- Radenbaugh AJ, Ma S, Ewing A, Stuart JM, Collisson EA, Zhu J, Haussler D. RADIA: RNA and DNA integrated analysis for somatic mutation detection. PLoS One. 2014;9:e111516. doi: 10.1371/journal.pone.0111516. [DOI] [PMC free article] [PubMed] [Google Scholar]
- Ramos AH, Lichtenstein L, Gupta M, Lawrence MS, Pugh TJ, Saksena G, Meyerson M, Getz G. Oncotator: cancer variant annotation tool. Hum Mutat. 2015;36:E2423–2429. doi: 10.1002/humu.22771. [DOI] [PMC free article] [PubMed] [Google Scholar]
- Reinius LE, Acevedo N, Joerink M, Pershagen G, Dahlen SE, Greco D, Soderhall C, Scheynius A, Kere J. Differential DNA methylation in purified human blood cells: implications for cell lineage and studies on disease susceptibility. PLoS One. 2012;7:e41361. doi: 10.1371/journal.pone.0041361. [DOI] [PMC free article] [PubMed] [Google Scholar]
- Saunders CT, Wong WS, Swamy S, Becq J, Murray LJ, Cheetham RK. Strelka: accurate somatic small-variant calling from sequenced tumor-normal sample pairs. Bioinformatics. 2012;28:1811–1817. doi: 10.1093/bioinformatics/bts271. [DOI] [PubMed] [Google Scholar]
- Schwartz GK, Tap WD, Qin LX, Livingston MB, Undevia SD, Chmielowski B, Agulnik M, Schuetze SM, Reed DR, Okuno SH, et al. Cixutumumab and temsirolimus for patients with bone and soft-tissue sarcoma: a multicentre, open-label, phase 2 trial. Lancet Oncol. 2013;14:371–382. doi: 10.1016/S1470-2045(13)70049-4. [DOI] [PMC free article] [PubMed] [Google Scholar]
- Sedgewick AJ, Benz SC, Rabizadeh S, Soon-Shiong P, Vaske CJ. Learning subgroup-specific regulatory interactions and regulator independence with PARADIGM. Bioinformatics. 2013;29:i62–70. doi: 10.1093/bioinformatics/btt229. [DOI] [PMC free article] [PubMed] [Google Scholar]
- Seo E, Basu-Roy U, Gunaratne PH, Coarfa C, Lim DS, Basilico C, Mansukhani A. SOX2 regulates YAP1 to maintain stemness and determine cell fate in the osteo-adipo lineage. Cell Rep. 2013;3:2075–2087. doi: 10.1016/j.celrep.2013.05.029. [DOI] [PMC free article] [PubMed] [Google Scholar]
- Shabalin AA. Matrix eQTL: ultra fast eQTL analysis via large matrix operations. Bioinformatics. 2012;28:1353–1358. doi: 10.1093/bioinformatics/bts163. [DOI] [PMC free article] [PubMed] [Google Scholar]
- Shen R, Olshen AB, Ladanyi M. Integrative clustering of multiple genomic data types using a joint latent variable model with application to breast and lung cancer subtype analysis. Bioinformatics. 2009;25:2906–2912. doi: 10.1093/bioinformatics/btp543. [DOI] [PMC free article] [PubMed] [Google Scholar]
- Sioletic S, Czaplinski J, Hu L, Fletcher JA, Fletcher CD, Wagner AJ, Loda M, Demetri GD, Sicinska ET, Snyder EL. c-Jun promotes cell migration and drives expression of the motility factor ENPP2 in soft tissue sarcomas. J Pathol. 2014;234:190–202. doi: 10.1002/path.4379. [DOI] [PMC free article] [PubMed] [Google Scholar]
- Smigielski EM, Sirotkin K, Ward M, Sherry ST. dbSNP: a database of single nucleotide polymorphisms. Nucleic Acids Res. 2000;28:352–355. doi: 10.1093/nar/28.1.352. [DOI] [PMC free article] [PubMed] [Google Scholar]
- Taylor BS, Barretina J, Maki RG, Antonescu CR, Singer S, Ladanyi M. Advances in sarcoma genomics and new therapeutic targets. Nat Rev Cancer. 2011a;11:541–557. doi: 10.1038/nrc3087. [DOI] [PMC free article] [PubMed] [Google Scholar]
- Taylor BS, DeCarolis PL, Angeles CV, Brenet F, Schultz N, Antonescu CR, Scandura JM, Sander C, Viale AJ, Socci ND, et al. Frequent alterations and epigenetic silencing of differentiation pathway genes in structurally rearranged liposarcomas. Cancer Discov. 2011b;1:587–597. doi: 10.1158/2159-8290.CD-11-0181. [DOI] [PMC free article] [PubMed] [Google Scholar]
- Tibes R, Qiu Y, Lu Y, Hennessy B, Andreeff M, Mills GB, Kornblau SM. Reverse phase protein array: validation of a novel proteomic technology and utility for analysis of primary leukemia specimens and hematopoietic stem cells. Mol Cancer Ther. 2006;5:2512–2521. doi: 10.1158/1535-7163.MCT-06-0334. [DOI] [PubMed] [Google Scholar]
- Tusher VG, Tibshirani R, Chu G. Significance analysis of microarrays applied to the ionizing radiation response. Proc Natl Acad Sci U S A. 2001;98:5116–5121. doi: 10.1073/pnas.091062498. [DOI] [PMC free article] [PubMed] [Google Scholar]
- Wang G, Shen N, Cheng L, Lin J, Li K. Downregulation of miR-22 acts as an unfavorable prognostic biomarker in osteosarcoma. Tumour Biol. 2015;36:7891–7895. doi: 10.1007/s13277-015-3379-1. [DOI] [PubMed] [Google Scholar]
- Wang K, Singh D, Zeng Z, Coleman SJ, Huang Y, Savich GL, He X, Mieczkowski P, Grimm SA, Perou CM, et al. MapSplice: accurate mapping of RNA-seq reads for splice junction discovery. Nucleic Acids Res. 2010;38:e178. doi: 10.1093/nar/gkq622. [DOI] [PMC free article] [PubMed] [Google Scholar]
- Wilkerson MD, Hayes DN. ConsensusClusterPlus: a class discovery tool with confidence assessments and item tracking. Bioinformatics. 2010;26:1572–1573. doi: 10.1093/bioinformatics/btq170. [DOI] [PMC free article] [PubMed] [Google Scholar]
- Wilks C, Cline MS, Weiler E, Diehkans M, Craft B, Martin C, Murphy D, Pierce H, Black J, Nelson D, et al. The Cancer Genomics Hub (CGHub): overcoming cancer through the power of torrential data. Database (Oxford) 2014;2014 doi: 10.1093/database/bau093. [DOI] [PMC free article] [PubMed] [Google Scholar]
- Ye K, Schulz MH, Long Q, Apweiler R, Ning Z. Pindel: a pattern growth approach to detect break points of large deletions and medium sized insertions from paired-end short reads. Bioinformatics. 2009;25:2865–2871. doi: 10.1093/bioinformatics/btp394. [DOI] [PMC free article] [PubMed] [Google Scholar]
- Yeung KY, Fraley C, Murua A, Raftery AE, Ruzzo WL. Model-based clustering and data transformations for gene expression data. Bioinformatics. 2001;17:977–987. doi: 10.1093/bioinformatics/17.10.977. [DOI] [PubMed] [Google Scholar]
- Zack TI, Schumacher SE, Carter SL, Cherniack AD, Saksena G, Tabak B, Lawrence MS, Zhsng CZ, Wala J, Mermel CH, et al. Pan-cancer patterns of somatic copy number alteration. Nat Genet. 2013;45:1134–1140. doi: 10.1038/ng.2760. [DOI] [PMC free article] [PubMed] [Google Scholar]
Associated Data
This section collects any data citations, data availability statements, or supplementary materials included in this article.
Supplementary Materials
(A) mRNA expression profile distinguishes LMS from other sarcoma types. Unsupervised pansarcoma mRNA expression clustering of the most variable genes across 206 sarcomas (2,038 genes; standard deviation ≥ 2.0) yielded 3 stable clusters. From left to right: Cluster 3, composed almost entirely of LMS tumors and having a unique expression profile; Cluster 1, predominantly DDLPS, SS, and MPNST; Cluster 2, predominantly DDLPS, UPS and MFS. A subset of genes, largely associated with inflammatory signatures, did not correlate with histology and were either ubiquitously on or off, with low expression in cluster 1 and high in cluster 2 (see also Figure 7A).
(B) Projection of 237 soft tissue sarcomas on a 2-D tumor “map” visualization of high-dimensional mRNA expression data. We also mapped the 31 cases that pathology review excluded from the final analysis (black dots) and cases that failed TCGA QC (gray dots). The excluded cases largely clustered with the included cases, consistent with their largely mesenchymal origin, despite some being of uncertain or inappropriate type. Among the included sarcomas, leiomyosarcomas (STLMS and ULMS) clustered together (lower right), while synovial sarcomas also formed a distinct cluster (left). The remaining sarcomas largely clustered together (as was seen in other platforms) with mixing of DDLPS, UPS and MFS. UPS appeared to separate into two major groups, one of which was more similar to DDLPS, and the second was more similar to MFS.
(C) Correlation of RPPA protein expression profiles with histologic type. Unsupervised pansarcoma cluster analysis on RPPA data from 173 samples analyzed with 192 antibodies yielded 5 stable clusters that showed statistically significant association with leukocyte fraction and histologic type (chi-square p-values shown). The annotation bars shown above the heatmap were not used for clustering. Cluster 1 (at left) contained predominantly leiomyosarcoma, while clusters 2–5 each contained a mixture of sarcoma types.
(D) Scores for therapeutically and prognostically relevant pathways commonly activated in malignancy were correlated with sarcoma RPPA clusters. The box plots show pathway scores for each of the 5 RPPA clusters. P-values are based on the ANOVA test for differences across the clusters. Relative to the other clusters, C1 (LMS-predominate, light blue) demonstrated high PI3K/AKT pathway and low apoptosis and RTK pathways. C4 (dark green) was characterized by high apoptosis, RTK, and DNA damage response pathways. In addition, C3 (light green, including all SS and MPNST) exhibited high hormone signaling and low PI3K/AKT, RAS/MAPK, breast reactive, and core reactive pathways, whereas C5 (gold, UPS/DDLPS) was high in apoptosis and EMT pathways and low in cell cycle and TSC/MTOR pathway activation.
(A) Results of cluster analyses. Shown are tumor histology, copy number alteration clustering, DNA methylation clustering, mRNA clustering, miRNA clustering excluding LMS samples, RPPA (protein) clustering, PARADIGM integrative clustering (copy number, mRNA expression, and pathway interaction data), and iCluster integrative clustering (DNA copy number, DNA methylation, mRNA expression, and miRNA expression). Individual tumors are shown in the same order as in Figure 1A. The displayed miRNA clustering excluded the LMS samples because (as can be seen in Panel C) they differed very strongly from other tumor types. As miRNA clustering was based on the 25% most variable miRNAs between samples, LMS could not be included since its markedly different miRNA expression profile relative to the other sarcomas overly limited the ability of the model to reliably cluster the remaining tumors.
(B) DNA methylation signatures in sarcoma. Left, unsupervised clustering of the 206 sarcomas based on DNA methylation, performed using the most variable CpG loci on the Illumina Infinium HM450 array. From left to right, the clusters are: M1, mixed DDLPS, UPS, MFS, and STLMS with high leukocyte fraction, 5-yr OS 54%; M2, synovial sarcoma with 5-year OS <24%; M3, predominantly STLMS, with good outcomes and 5-year OS 61%; M4, UPS/MFS with 5-year OS 0%; and M5, ULMS and DDLPS with poor outcomes and 5-year OS <33%. Right, leukocyte fraction by methylation cluster.
(C) miRNA signatures in sarcoma. Left panel: unsupervised hierarchical clustering using the top 25% most variable miRNAs across all 206 sarcomas. The analysis yielded 2 distinct clusters with very high concordance with LMS and nonLMS types, demonstrating that LMS (both uterine and soft tissue) have a very distinct miRNA profile from the other TCGA sarcoma types. Right panel: Cluster analysis of the 126 nonLMS samples, using the top 25% most variable miRNAs within the nonLMS types (DDLPS, MFS, MPNST, SS, and UPS). This resulted in a 3-cluster solution that was highly concordant with histology type: UPS/MFS, synovial, and DDLPS.
(A) Unsupervised clustering of DDLPS samples based on copy number alterations. Upper left panel, unsupervised clustering of the 50 DDLPS by copy number (GISTIC2.0 analysis from AffySNP 6.0) showed three main copy number clusters. Lower left panel, SCNA frequency plots for each of the three clusters, displaying the percentage of cases in the cohort using GISTIC 2.0 thresholded copy number assignment +2 (amplification) or -2 (deep deletion). Green lines mark the arbitrary threshold frequency of 5%. Red arrows mark each cluster's prominent SCNAs and the genes contained in them: the 6q25.1 amplification containing UST and SASH1 in K3, the 1p32.1 amplification containing JUN in K1, and 1q24.3 (DNM3, MIR214) and 5p15.33 (TERT) amplifications in K2. Fisher’s test was used to compare differences in rates of occurrence across different clusters, and the reported q-values were obtained after Benjamini-Hochberg correction for multiple hypotheses. Upper right panel, disease-specific survival according to copy number cluster. Lower right panels, expression of TERT and JUN in each copy number cluster.
(B) Graphs showing the association of highly methylated Meth2 cluster with poor DSS, low leukocyte fraction, and increased Th2 cells.
(C) Boxplot showing immature dendritic cell score in DDLPS by integrated copy number and methylation clusters.
(A) Pathway activation in LMS. The plots show RPPA pathway scores calculated for the 173 tumors for which RPPA results are available. LMS, compared with other sarcoma types, had higher AKT score (p=4e–06), higher hormone receptor score (p=0.00015), and lower apoptosis score (p=1e–05; p values are t-test, all LMS vs all other sarcomas). The difference in AKT score was largely driven by STLMS, and difference in hormone response scores was largely driven by ULMS; the higher AKT response score in ULMS and hormone response score in STLMS compared to other sarcoma types were not significant (p=0.09 and p=0.068, respectively, Tukey test). Apoptosis scores were lower in both STLMS and ULMS compared to other sarcomas (p<0.0001, Tukey test).
(B) Prognostic value of miR-181b-5p. Kaplan-Meier curve for RFS is shown for patients with tumors having miR-181b-5p abundance above and below the optimized cutoff (Budczies et al., 2012). The p value shown was adjusted for the cutoff finder and multiple testing.
(C) DNA damage and hypoxia response scores in ULMS and STLMS. First panel, HIF1α mRNA expression in STLMS relative to ULMS (t-test, p=9e–06). Second panel, HIF1α target gene expression signature (mRNA) correlated with HIF1α expression and was higher in STLMS (t-test p=6e–05). Third panel, RPPA DNA damage response score was higher in ULMS (t-test p=0.005).
(D) Thresholded copy number frequency analysis (GISTIC) of STLMS iCluster C1 vs C2. Fisher’s test was used to compare differences in rates of occurrence across different clusters, and q-values were obtained after Benjamini-Hochberg correction for multiple hypotheses. Arrow indicates a focal region (17p11.2 to 17p12) with significantly different copy number between C1 and C2 (q-value: 0.022). Genes from this locus include SLC5A10, FAM83G, GRAP, LOC388436, LOC79999, GRAPL, EPN2, EPN2- IT1, EPN2-AS1, B9D1, MIR1180, MAPK7, MFAP4, MYOCD, LOC101928418, LOC100128006, and ARHGAP44.
(E) Histologic spectrum of UPS/MFS. Top left panel, classic area of low-grade MFS. Top right panel, MFS showing transition from classic low grade to high-grade UPS-like morphology. Lower left panel, high-grade area of MFS histologically indistinguishable from classic UPS. Lower right panel, classic UPS. All images were captured at 200x magnification (TCGA digital slide scans, Aperio Imagescope. Scale bar, 200 µm).
(F) Multivariable miRNA prognostic classifier for metastasis-free survival. We performed a LASSO penalized regression analysis using all miRNAs and tumor size in 54 UPS/MFS samples to identify sets of miRNAs and coefficients that would best predict metastasis-free survival. The samples were split into high and low groups based on their model score at a cutpoint that minimized the log-rank p-value. P value shown is corrected for multiple testing.
(A) Box plots showing the distribution of selected immune signatures by histology. Macrophage score: p<0.008 for UPS/MFS or DDLPS vs other sarcomas in all pairwise comparisons. CD8: p<0.005 for DDLPS vs other sarcoma types in all pairwise comparisons. PD-L1: p<0.032 for STMLS vs other sarcomas in all pairwise combinations.
(B) Validation of immune scores in LMS, MFS, and SS. Scatterplots show the median immune infiltration score for each immune signature with TCGA data displayed on the xaxis and the validation data from Lesluyes et al. displayed on the y-axis. The Spearman correlation coefficient is shown for each.
(C) Validation of CD8, NK and TH2 immune scores for DDLPS and UPS. Plots show scores for each individual tumor in the Lesluyes et al. cohort or the TCGA cohort, demonstrating similar distribution of scores between the data sets. (D) Expression of three druggable immune targets in tumors ordered by sarcoma type. Expression of each differed significantly among the sarcoma types (p=1.6e–15 for B7- H3, 9.8e–11 for TGFB1, and 2.9e–14 for TIM3 by Kruskal-Wallis test).
Methods S1. Author Contributions and Affiliations
Table S7. RPPA antibody list. Related to STAR Methods RPPA analysis.
Table S1. Characteristics of patients in the study. Related to Figure 1.
Table S3. Features significantly contributing to discrimination of the 5 clusters in the iCluster analysis of all sarcoma samples. Related to Figure 3E.
Table S4. Copy number gains detected by GISTIC analysis of dedifferentiated liposarcoma. Related to Figure 4A,B.
Table S5. miRNAs associated with survival in LMS. Related to Figure S6B
Table S6. iCluster characteristics of LMS as a whole and of STLMS. Related to Figure 5B and 5C.
(A) Schematic of classification following expert pathology review of 237 submitted sarcoma samples, illustrating the challenge of accurate diagnosis in sarcoma pathology, and the need for central pathology review in large scale multi-institutional studies such as TCGA. Thirty-one cases (grey boxes) were excluded from final analysis, including 5 tumors which were not sarcomas; 8 which were considered to be tumors of inappropriate type (including the two desmoid tumors, which were excluded from final analysis due to insufficient case numbers); 17 tumors for which a definite classification could not be made based on the available material for review; and one DDLPS which was infiltrated by chronic lymphocytic lymphoma. A further 20 sarcomas were reclassified from one included type of sarcoma to another, as indicated by lines.
(B) Copy number alterations in sarcoma. The 206 sarcomas were subjected to unsupervised hierarchical clustering based on significantly amplified or deleted regions across the genome (as determined by GISTIC 2.0), resulting in six distinct genomic clusters. From left to right: DDLPS CIN, a group consisting almost exclusively of DDLPS, with hallmark amplicons in chromosome 12q and also various other SCNAs across the genome; quiet, which contains all but one of the synovial sarcomas as well as genomically stable DDLPS and other copy-number–quiet tumors; LMS quiet, characterized by chromosomal or arm-level deletions but relatively few other SCNAs; LMS CIN, LMS with more chromosomal instability than those in LMS quiet; UPS/MFS 1, a highly chromosomally unstable group enriched for UPS and MFS; and UPS/MFS 2, another group enriched for UPS and MFS. UPS/MFS 1 and 2 are distinguished by different frequencies of SCNAs, including more RB1 focal deletions in UPS/MFS1 and more chromosome 8p and 9p deletions in UPS/MFS 2.
(C) Number of unbalanced segments for each tumor plotted for each TCGA cohort and for each sarcoma histologic type included in the sarcoma TCGA. Sarcoma types are boxed.
(D) Number of nonsynonymous somatic mutations versus number of unbalanced segments mapped for each individual sarcoma case (color coded by histologic type) and, for comparison, a randomly chosen 10% of all other TCGA specimens.
(E) TERT expression plotted against TERT copy number alterations. Mutations and identified TRIO-TERT fusions are indicated.
(A) Types of somatic mutations detected by whole-exome sequencing of the 206 sarcomas. In total, 11,096 somatic mutations were detected, including 10,437 point mutations and 659 insertions/deletions (indels). Point mutations included 2624 silent, 7130 missense, 442 nonsense, 17 read-through, and 224 splice-site mutations.
(B) De-novo mutational signatures identified using a Bayesian variant of non-negative matrix factorization (Kasar et al., 2015). Top, signatures extracted from 205 WES samples, identifying two major mutational processes. The first signature (SIG.WES1), characterized by a broad spectrum of base substitutions, is most similar to the COSMIC5 signature (http://cancer.sanger.ac.uk/cosmic/signatures) (cosine similarity = 0.8). The second signature (SIG.WES2) had dominant C>T mutations at CpG dinucleotide sites; this signature is most similar to COSMIC1 (cosine similarity = 0.93) and COSMIC6 (cosine similarity = 0.85). COSMIC1 is caused by spontaneous cytosine deamination. COSMIC6 is associated with defective DNA mismatch repair and is present in microsatellite-unstable tumors. This signature was high in two tumors with the highest mutation burden (TCGA-DX-AB32 and TCGA-3B-A9HT), explaining 80% of all mutations in these two samples, compared with 9% of mutations in the remaining samples. Bottom, de-novo mutational signatures in coding regions extracted from 37 WGS samples. Two signatures (SIG.WGS1 and SIG.WGS3) were similar to those observed in WES samples. The additional signatures were SIG.WGS2, characteristic of dominant C>T mutations at TCW (W=A/T) contexts, and SIG.WGS4, with C>G mutations at TCW contexts. These two signatures were most similar to COSMIC2 (cosine similarity = 0.73) and COSMIC13 (cosine similarity = 0.79), respectively, which are attributed to the mutagenesis of the AID/APOBEC family of cytidine deaminases, indicating a minor role of APOBEC mutagenesis in SARC tumors in addition to COSMIC1 and 5.
(C) Scatter plots of the signature activity: number of mutations assigned to SIG.WES2 in panel B (with a pseudocount of one added to permit log transformation) vs mRNA levels of MSH6 (top) and MSH2 (bottom) measured by log2(fold change against median across tumors). The boxes highlight the two hyper-mutant, putative microsatellite instability (MSI) samples, AB32 and A9HT. AB32 had a frameshift mutation in MSH6. A9HT had no mutations in detected in the DNA mismatch repair genes MLH1, MSH2, MSH3, or MSH6, but had the lowest MSH2 expression and had a significant enrichment of 1-base insertions and deletions (14% vs mean 3% in remaining samples).
(D) Pearson correlation between age at diagnosis and the combined activity of COSMIC1 and COSMIC5 signatures across 203 WES samples, by sarcoma type. Correlation coefficients and p-values are as follows: All sarcoma 0.34, p<0.00001; DDLPS 0.38, p=0.006; MFS 0.52, p=0.04; MPNST −0.38, p=0.53; SS 0.45, p=0.2; STLMS 0.43, p=0.001; ULMS 0.35, p=0.07; UPS −0.02, p=0.9.
(E) Analysis of nuclear area. Image analysis algorithms were used to measure the sizes of over 500,000,000 cell nuclei in digitized sarcoma tissues. Distributions of nuclear area shown here are from a UPS (TCGA-DX-A8BM – red) and a synovial sarcoma 45 (TCGA-DX-A7EQ – blue). The UPS contained larger and more heterogeneous nuclei, as can be seen from the longer area distribution tail.
(F) The variance measure of nuclear area was significantly associated with subclonal genome fraction (left) and with an aneuploidy score based on the number of arms with gains or losses (Aneuploidy score’) (right), by Pearson correlation.