

Abstract
Translational control during cell division determines when cells start a new cell cycle, how fast they complete it, the number of successive divisions, and how cells coordinate proliferation with available nutrients. The translational efficiencies of mRNAs in cells progressing synchronously through the mitotic cell cycle, while preserving the coupling of cell division with cell growth, remain uninvestigated. We now report comprehensive ribosome profiling of a yeast cell size series from the time of cell birth, to identify mRNAs under periodic translational control. The data reveal coordinate translational activation of mRNAs encoding lipogenic enzymes late in the cell cycle including Acc1p, the rate‐limiting enzyme acetyl‐CoA carboxylase. An upstream open reading frame (uORF) confers the translational control of ACC1 and adjusts Acc1p protein levels in different nutrients. The ACC1 uORF is relevant for cell division because its ablation delays cell cycle progression, reduces cell size, and suppresses the replicative longevity of cells lacking the Sch9p protein kinase regulator of ribosome biogenesis. These findings establish an unexpected relationship between lipogenesis and protein synthesis in mitotic cell divisions.
Keywords: ACC1, cell size, mitosis, translation, upstream open reading frame
Subject Categories: Cell Cycle, Metabolism, Protein Biosynthesis & Quality Control
Introduction
Proliferating cells balance their increase in mass and size with their division (Turner et al, 2012; Polymenis & Aramayo, 2015; Schmoller & Skotheim, 2015). For the most part, cell growth drives cell cycle progression and not the other way around (Hartwell & Unger, 1977; Johnston et al, 1977; Pringle & Hartwell, 1981). In multiple organisms, it has been known for decades that a critical rate of protein synthesis is required for cell cycle progression (Polymenis & Aramayo, 2015). Proteins account for a substantial fraction of macromolecular mass in cells, ranging from 33 to 44% of all macromolecules in the budding yeast Saccharomyces cerevisiae (Lange & Heijnen, 2001). An increase in protein synthesis is considered a definitive hallmark of cell growth (Mitchison, 1971a). Indeed, in growing and dividing yeast cells the rates of protein synthesis and increase in volume are similar to each other, both increasing exponentially in the cell cycle (Shulman et al, 1973; Elliott & McLaughlin, 1978; Elliott et al, 1979; Di Talia et al, 2007). Consequently, the larger the cells become, the more proteins they produce.
Although bulk protein synthesis appears to be proportional to cell size in yeast, this relationship does not necessarily extend to all individual proteins (Schmoller & Skotheim, 2015; Schmoller et al, 2015). Genetic or chemical blocks in protein synthesis cause a uniform and specific cell cycle arrest, usually in the G1 phase, arguing that synthesis of specific proteins is disproportionately sensitive to protein synthesis limitations (Brooks, 1977; Rossow et al, 1979; Moore, 1988; Polymenis & Aramayo, 2015). Recent models also propose that the differential dependence on cell size for the synthesis of specific proteins underlies the coupling of cell growth with division (Schmoller & Skotheim, 2015; Schmoller et al, 2015). Identifying those proteins as cells progress through the cell cycle holds the promise of explaining molecularly how cells couple their growth with their division.
The rate of synthesis of any given protein depends not only on the concentration but also on the translational efficiency of its mRNA. Discrepancies between the two parameters are evidence of translational control. Systematic, thorough studies have defined transcript abundance through the cell cycle in budding yeast (Cho et al, 1998; Spellman et al, 1998). To our knowledge, however, there are no reports of proteins whose levels oscillate due to cell cycle‐dependent translational control in yeast. It is necessary to have quantitative information about the rate of synthesis of each protein in the cell cycle to uncover the molecular basis of protein synthesis requirements for cell division. Ribosome profiling relies on deep sequencing of ribosome‐protected mRNA fragments (Ingolia et al, 2012; Brar & Weissman, 2015). This methodology has been transformative in identifying translational targets on a genomewide scale (Ingolia et al, 2009). Recent ribosome‐profiling studies reported extensive cell cycle‐dependent translational control of hundreds of mRNAs in animal cells. In these experiments, either chemically induced cell cycle arrest was employed to generate synchronous cultures (Stumpf et al, 2013; Park et al, 2016) or selective cyclin‐dependent kinase (Cdk) inhibitors were used for synchrony in mitosis (Tanenbaum et al, 2015). However, it is important to emphasize that, no matter how selective the arrest may be, cells arrested in the cell cycle continue growing, and the normal coordination of cell growth with division ceases (Pringle & Hartwell, 1981), often leading to arrest‐specific results (Ly et al, 2015). Since protein synthesis is an integral component of cellular growth, to interrogate properly translational control in cell division, measurements of translational efficiency in the cell cycle should be made in cells that are actively growing, synchronously progressing in the cell cycle, and having to meet their growth requirements for cell division.
Here, we queried with ribosome‐profiling non‐arrested, synchronous cell populations obtained by centrifugal elutriation. We generated a cell size series from the time of cell birth, identifying with high confidence mRNAs under periodic translational control in synchronous but unperturbed cells. Our results for the first time identify mRNAs under cell cycle‐dependent translational control in cells that must meet their growth requirements and reveal fundamental links between lipogenesis and protein synthesis during cell division.
Results
Synchronization and sample collection
To minimize arrest‐related artifacts (Creanor & Mitchison, 1979; Ly et al, 2015), we used centrifugal elutriation to isolate growing, highly synchronous, unbudded, early G1 cell populations. Note that in yeast initiation of DNA replication is coupled to the formation of a bud (Hartwell & Unger, 1977; Johnston et al, 1977; Pringle & Hartwell, 1981). We scored the elutriated cultures over time microscopically, recording the percentage of budded cells. We also recorded cell size with a channelyzer, a particle counter that directly measures the volume of cells. Ribosome profiling requires ≥ 2E+09 yeast cells per sample to generate both the ribosome footprint and mRNA libraries. Such cell numbers cannot be collected in a typical time‐series experiment, because only a small minority of the total cell population is in the elutriated early G1 fraction. Instead, we allowed the entire cell population of each elutriated fraction to progress in the cell cycle until it reached a given cell size, at which point the sample was harvested. Elutriated cells of the same size were then pooled together until enough cells per sample were obtained. This pool of same‐size cells defined one experimental replicate (e.g., Sample01A; see Appendix File S1). We harvested cells at 5 fl cell size increments, soon after their birth (40 fl), until the end of the cell cycle (75 fl). In total, we generated three independent experimental replicates for each cell size (Fig 1A). From the data shown in Fig 1B using the standard diploid BY4743 strain (see Appendix Table S2, listing all the strains in this study), we obtained a calculated critical size (at which 50% of the cells are budded) of 61.3 fl. This value is indistinguishable from our published critical size value of 61.5 fl from typical time‐series elutriations for the same strain and growth conditions (He et al, 2014). Moreover, our transcript reads for CLN1 and CLN2, encoding G1/S cyclins whose transcription peaks in late G1 (Spellman et al, 1998; Bloom & Cross, 2007), peak at 55 and 60 fl (Fig 1C). On the other hand, transcription of the G2/M cyclin CLB2 peaks later in the cell cycle, in cells ≥ 65 fl (Fig 1C). Therefore, both morphological (i.e., budding) and molecular (i.e., transcript profile) markers strongly suggested that we obtained un‐arrested, synchronous, cycling cells for ribosome profiling.
Figure 1. Generating cell size series of synchronous, dividing cells for ribosome profiling.
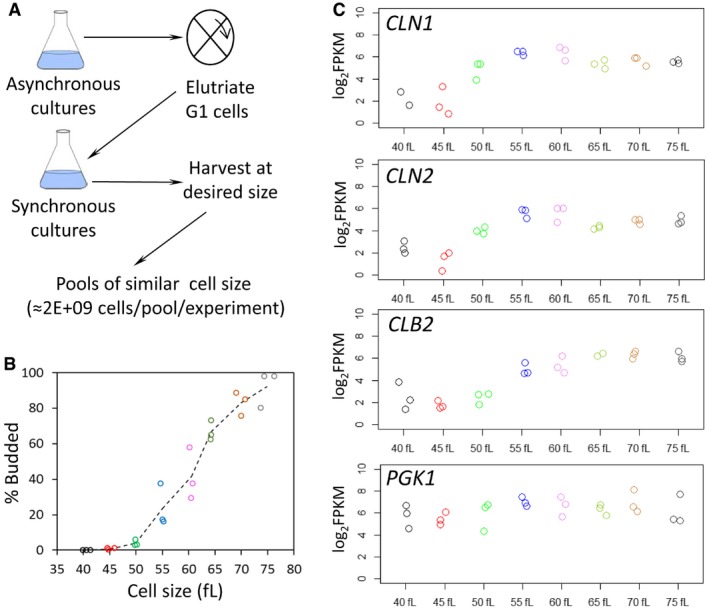
- Schematic overview of our approach.
- From the individual pools of Saccharomyces cerevisiae cells we used for ribosome profiling, the weighted average of the cell size of each pool is shown on the x‐axis (in fl) and their corresponding budding index on the y‐axis (% Budded). Pools of similar cell size are indicated with the same color.
- The log2‐transformed normalized (FPKMs) reads of representative transcripts that peak at G1/S (cyclins CLN1 and CLN2), G2 (cyclin CLB2), or are constitutively expressed (PGK1), are shown for each cell size pool.
Transcriptional control of ribosome biogenesis in the cell cycle
Before looking at differences of translational efficiency, we examined on a genomewide scale the transcriptional profile of our cell size series. There has been only one previous study in budding yeast that reported transcript abundance through the cell cycle using synchronous, elutriated cells. It was part of the landmark paper by Spellman et al (1998), which also included datasets from several arrest‐and‐release strategies (Cho et al, 1998; Spellman et al, 1998). The Spellman elutriation dataset was from cells growing with ethanol as a carbon source (Spellman et al, 1998) while ours with glucose. The Spellman study identified 800 core cell cycle‐regulated transcripts, but that list was constructed without the input from their elutriation dataset (Spellman et al, 1998), and subsequent studies indicated that the elutriation dataset was qualitatively different from the others and less prone to artifacts (Shedden & Cooper, 2002). We therefore compared our elutriation transcript dataset with that of Spellman and colleagues, to identify mRNAs subject to cell cycle‐dependent transcription in cells that are cycling in balance with cell growth.
We noticed that 144 transcripts were identified as periodic both in ours and in Spellman's elutriations, but they were not included in the Spellman “core” cell cycle set (Fig 2A). The transcripts were in two main clusters, one peaking in G1 and the other in G2/M (Fig 2B). In the G2/M cluster, we noted the presence of CLB3, encoding a mitotic cyclin, and of CDC3 and CDC11, encoding septin proteins required for cytokinesis (see Fig 2 and Dataset 2 within the Source Data for this figure). We also noticed the presence of FAA2 and ELO2 among the transcripts of this cluster. Faa2p is an acyl‐CoA synthase that activates fatty acids by thioesterification with coenzyme A while Elo2p elongates fatty acids for sphingolipid biosynthesis (Klug & Daum, 2014). Other transcripts encoding gene products with roles in lipid and membrane transactions are also known to peak late in the cell cycle (Spellman et al, 1998). The increased mitotic expression at the transcriptional level of these enzymes is noteworthy in the context of the translational upregulation of fatty acid biosynthetic enzymes late in the cell cycle, which we describe in the next section. Otherwise, the G2/M cluster may be enriched for transcripts encoding gene products with mitochondrial roles (Fig 2B, top). On the other hand, the G1 cluster is highly enriched in transcripts encoding gene products involved in ribosome biogenesis (GO:0042254, Fig 2B, bottom). These data argue strongly for cell cycle‐dependent transcription in the G1 phase associated with ribosome biogenesis. Periodic transcription of ribosome biogenesis genes has been reported in fission yeast (Oliva et al, 2005). It was postulated that globally increasing ribosome biogenesis may contribute to the “sizer” acting at the commitment step, which in fission yeast is in G2 phase (Oliva et al, 2005). Our similar findings from budding yeast point to a conserved transcriptional activation of ribosome biogenesis before cells commit to a new round of cell division. Lastly, periodic transcription of ribosome biogenesis genes was not seen in numerous arrest‐and‐release methods (Cho et al, 1998; Spellman et al, 1998), underscoring the significance of using un‐arrested cells to query the role of protein synthesis in synchronous cells that must meet their growth requirements for division.
Figure 2. Transcription of genes involved in ribosome biogenesis peaks in the G1 phase.
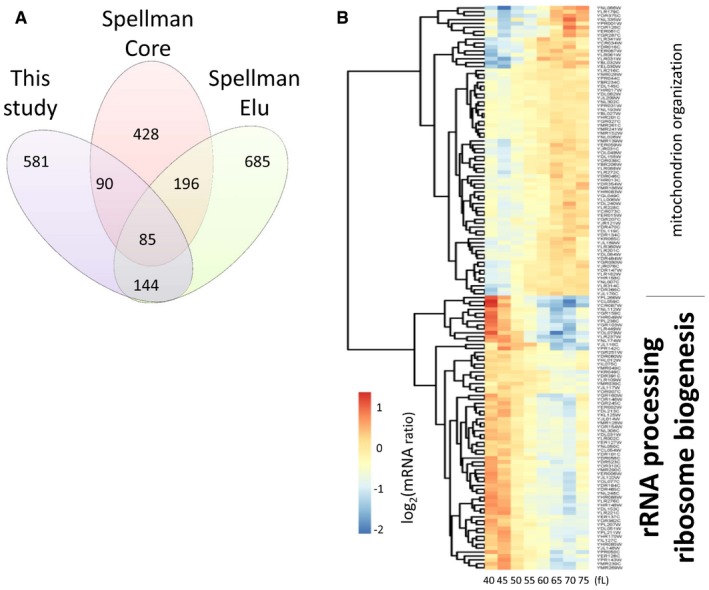
- Venn diagram showing the number of cell cycle‐regulated transcripts in the following datasets: The “Spellman Core” dataset was defined by Spellman et al (1998), based on an “aggregate CDC score” from multiple experiments that did not include the elutriation dataset that Spellman and colleagues performed (Spellman et al, 1998). The “Spellman Elu” dataset includes all the cell cycle‐regulated transcripts we identified by analyzing the microarray elutriation experiment of Spellman et al (1998), as we described in the Materials and Methods. Our dataset (Dataset 1 within the Source Data for this figure), “This study”, from the elutriations shown in Fig 1 was analyzed exactly as the “Spellman Elu” set.
- Heatmap of the mRNA levels of the 144 genes (Dataset 2 within the Source Data for this figure) in common between the “Spellman Elu” and “This study” datasets. The enriched Gene Ontology terms highlighted on top (P = 0.001), or bottom (P = 6.0E‐23), were calculated with the DAVID software tool (Huang et al, 2007), or the YeastMine platform (Balakrishnan et al, 2012), respectively.
Source data are available online for this figure.
mRNAs with periodic translational efficiency in the mitotic cell cycle
To identify specific mRNAs under translational control, we looked for unexpected discrepancies between the signals obtained from ribosome profiling and those obtained from transcriptional profiling at each locus along the cell cycle. The translational efficiencies we report here are based only on the relative density of ribosomes averaged across the entire length of each ORF. Hence, our results are not influenced by documented experimental biases on the local, codon‐level distribution of ribosomes on a given mRNA (Brar & Weissman, 2015; Hussmann et al, 2015; Ingolia, 2016). We used two freely available statistical packages, babel (Olshen et al, 2013) and anota (Larsson et al, 2011), and focused on targets identified by both packages to minimize the likelihood of identifying false positives. This strategy yielded 55 mRNA targets (see Fig 3A and Dataset 8 in the Source Data for this figure; and Materials and Methods). To recognize mRNAs under periodic translational control from this mRNA set, we followed the procedure we described above (see Fig 2 and Materials and Methods), except that the initial input values for the genes we examined were the ratio of the ribosome footprint values over their corresponding mRNA values. This analysis pinpointed 17 mRNAs under periodic translational control in cycling, non‐arrested cells (Fig 3B). A detailed description of the sequencing data for these 17 loci is in Appendix File S1. Regarding mRNA features that may mediate translational control of these 17 mRNAs, we noted that there is information in the literature for the 5′‐ and 3′‐ends of 14 of them (see Appendix Table S3). Their median 5′‐leader and 3′‐leader lengths were 89 and 163 nucleotides, respectively. These values appear longer than the average lengths of 68 and 91 nucleotides for the 5′‐ and 3′‐ends, respectively, of yeast transcripts reported previously (David et al, 2006).
Figure 3. Transcripts under periodic translation control in dividing cells.
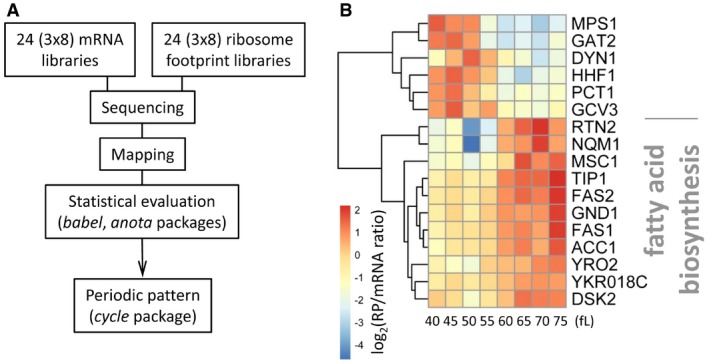
- Schematic of the workflow that identified 17 mRNAs under periodic translational control (see Materials and Methods). Datasets 3 and 4 within the Source Data for this figure are the input data for the mRNA and ribosome footprints used for the babel package, while Dataset 6 (within the Source Data for this figure) was used as input for the anota package. Datasets 5 and 7 (within the Source Data for this figure) were the output of the babel and anota packages, respectively. Dataset 8 (within the Source Data for this figure) is the set of genes identified in common by the babel and anota packages.
- Heatmap of the 17 mRNAs under periodic translational control in synchronous elutriated cultures of wild‐type, diploid cells (BY4743 background). The data were hierarchically clustered and displayed with the pheatmap R package, as described in Materials and Methods and in Fig 2. The enriched (P = 7.6E‐5) Gene Ontology term highlighted was calculated with Holm–Bonferroni test correction, from the YeastMine platform (Balakrishnan et al, 2012).
Source data are available online for this figure.
To prioritize mRNAs for further study, we looked for gene ontology enrichment. Long‐chain fatty acid biosynthesis (GO:0042759) was an unexpected, but a clear group. ACC1, FAS1, and FAS2 all showed translational activation in G2/M (Fig 3B). Acc1p is acetyl‐CoA carboxylase, the rate‐limiting enzyme in lipid biogenesis (Hasslacher et al, 1993; Wei & Tong, 2015). Acc1p provides malonyl‐CoA building units to fatty acid synthase, encoded by FAS1,2, and to the similar enzymes of the fatty acid elongases, encoded by ELO1‐3 (Tehlivets et al, 2007; Klug & Daum, 2014). We also noted that the translational efficiency of PCT1 peaks in G1 (Fig 3B). Pct1p is choline phosphate cytidylyltransferase (Tsukagoshi et al, 1987), the rate‐limiting enzyme for synthesis of phosphatidylcholine (Fagone & Jackowski, 2013). For the remainder of this report, we focus on the G2/M upregulation of the expression of Acc1p, Fas1p, and Fas2p, involved in de novo fatty acid synthesis.
Translational control increases the levels of lipid biogenesis enzymes late in the cell cycle
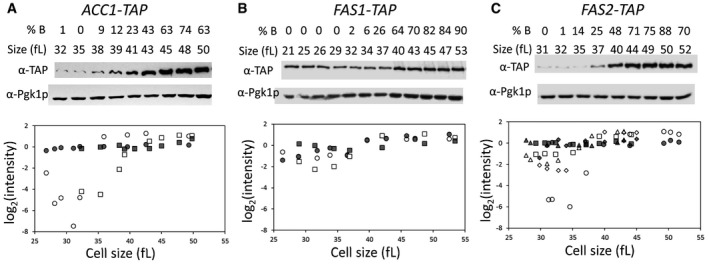
We did not observe any evidence of cell cycle‐dependent periodicity in the abundance of ACC1, FAS1, or FAS2 mRNAs (see Fig EV1). To our knowledge, the steady‐state levels of the corresponding proteins have not been evaluated in the cell cycle. We monitored protein abundance of acetyl‐CoA carboxylase (ACC1/Acc1p) and β and α subunits of fatty acid synthase (FAS1/Fas1p and FAS2/Fas2p, respectively). For these experiments, we used strains carrying alleles encoding C‐terminal, TAP fusions of the corresponding proteins (see Materials and Methods and Appendix Table S2). These strains were viable and proliferated at rates similar to the rates of their wild‐type counterparts. We monitored protein levels throughout the cell cycle in synchronous, elutriated cells (Fig 4). Late in the cell cycle, the levels of all three proteins peaked, but more so for Acc1p‐TAP (> 20‐fold; Fig 4A) compared to Fas1p‐TAP (≈threefold; Fig 4B) and Fas2p‐TAP (≈5‐ to 10‐fold; Fig 4C). The mitotic peak of Acc1p‐TAP levels was not due to trivial reasons arising from some artifact of elutriation, because when cells were allowed to re‐enter a second cell cycle Acc1p‐TAP levels dropped substantially in the subsequent G1 phase (Appendix Fig S1). All these data, together with the evidence from ribosome profiling (Fig 3), suggest that the expression of key enzymes for de novo lipid biogenesis, Acc1p in particular, is cell cycle regulated and that this control is exercised at least in part at the translational level.
Figure EV1. Transcript abundance of ACC1,FAS1, and FAS2 in the cell cycle.
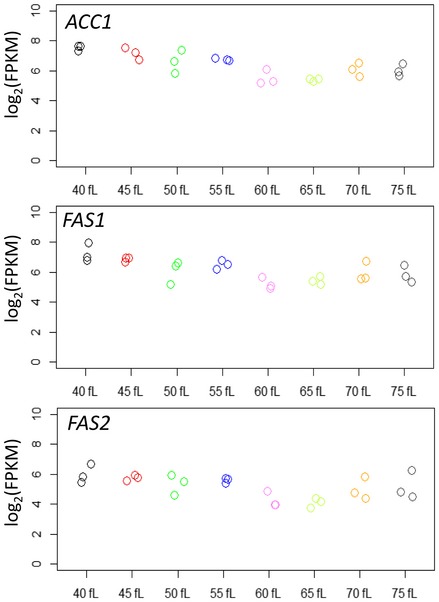
The log2‐transformed normalized (FPKMs) reads of the indicated transcripts are shown for each cell size pool, as described in Fig 1.
Figure 4. Protein abundance of Acc1p, Fas1p, and Fas2p in the cell cycle.
-
A–CEarly G1 daughter cells of cells carrying C‐terminal TAP‐tagged alleles of ACC1 (A), FAS1 (B), or FAS2 (C) at their endogenous chromosomal locations were collected by elutriation and allowed to progress synchronously in the cell cycle. At the indicated cell sizes (fl) and budding index (% B), the abundance of the proteins shown was queried by immunoblotting (see Materials and Methods). Representative images of the immunoblots are shown on top, with the cells size (in fl) and the percentage of budded cells (% B) shown in each case. The graphs at the bottom display the band intensities for each independent experiment (indicated with different open symbols; see Source Data for the corresponding immunoblots), plotted on the y‐axis as the log2 values of their expressed ratios (see Materials and Methods), against the corresponding cell size (x‐axis). Experiment‐matched loading controls (filled symbols) were also quantified and shown in parallel.
Source data are available online for this figure.
A upstream open reading frame (uORF) mediates the translational control of ACC1 in response to nutrients and in the cell cycle
Next, we sought to identify cis elements in the corresponding mRNAs that could alter translational efficiency. Within the long 5′‐leader of ACC1, there is a short uORF (Cvijovic et al, 2007), encoding the tripeptide MCL, starting at position −341 (Fig 5A and Appendix Fig S2). The uORF is conserved, albeit with synonymous substitutions, in the Saccharomyces species S. mikatae, S. paradoxus, and S. bayanus (Appendix Fig S2). These species and S. cerevisiae belong to the sensu stricto Saccharomyces genus, with an evolutionary separation of 10–20 Myr, allowing for recognition of conserved regulatory elements (Kellis et al, 2003). We also noticed that ribosome footprint reads were present at the ACC1 uORF and in higher numbers during the G1 phase of the cell cycle (Appendix Fig S3). Given the strong periodic abundance of Acc1p‐TAP in the cell cycle (Fig 4A), the presence of a conserved uORF in the ACC1 mRNA (Appendix Fig S2), and the apparent ribosome occupancy of the uORF in the cell cycle (Appendix Fig S3), we decided to examine the translational control of ACC1 further.
Figure 5. The ACC1 uORF adjusts Acc1p levels in a nutrient‐dependent manner and reduces the amplitude of the cell cycle‐dependent oscillation of Acc1p.
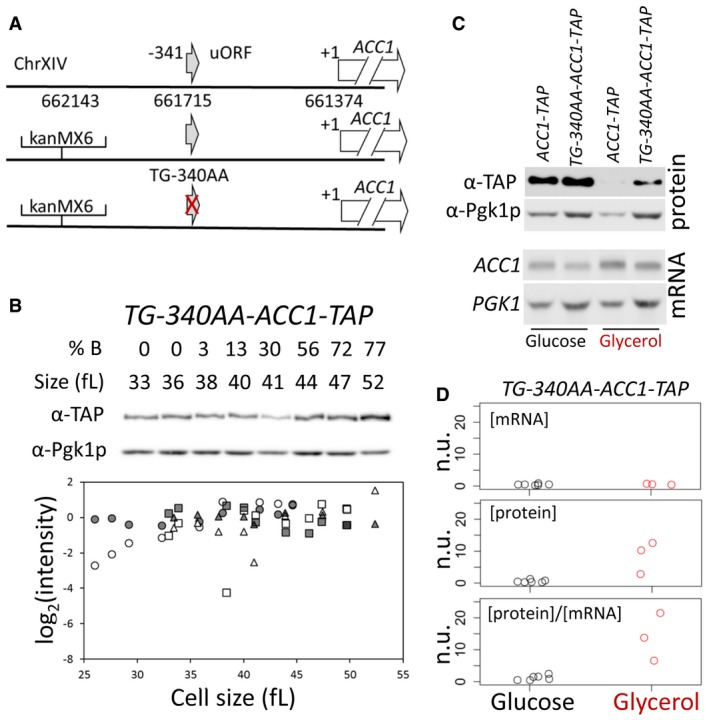
- Schematic of the modifications we introduced to test the role of the uORF present 340 nucleotides upstream of the main ACC1 ORF. The red cross indicates the ablation of the uORF.
- The abundance of Acc1p‐TAP was monitored in a strain that lacks the ACC1 uORF (TG‐340AA‐ACC1‐TAP), constructed as described in Materials and Methods. Samples were collected by elutriation and allowed to progress synchronously in the cell cycle, exactly as described in Fig 4. The corresponding mRNA levels are shown in Fig EV2. Experiment‐matched loading controls (filled symbols) were also quantified and shown in parallel.
- Steady‐state ACC1 mRNA and Acc1p protein levels were measured in rich undefined media, differing in the carbon source (2% glucose or 3% glycerol) from the indicated strains carrying C‐terminal TAP‐tagged alleles of ACC1 at their endogenous chromosomal locations.
- Strip charts depicting the relative abundance of ACC1 mRNA and protein from cells that lack the ACC1 uORF (TG‐340AA‐ACC1‐TAP), quantified from independent experiments done as in (C). To obtain the normalized units (n.u.) on the y‐axis, we first normalized for loading against the corresponding PGK1 and Pgk1p values from the same samples. We then expressed these values as ratios against the corresponding values of wild‐type ACC1‐TAP cells, in which the ACC1 uORF is in place, from experiments run and analyzed in parallel.
Source data are available online for this figure.
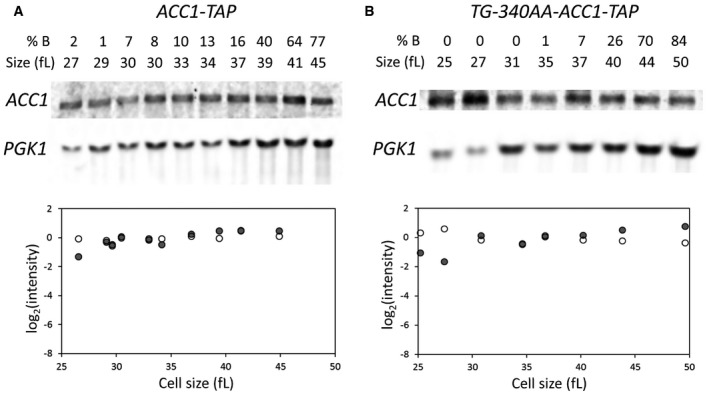
We mutated the start codon of the uORF in the ACC1 locus (Fig 5A). To examine whether the uORF influences expression of the downstream main ACC1 ORF, we also generated a uORF mutant strain encoding a C‐terminal, TAP fusion of ACC1 (see Materials and Methods; and Appendix Table S2). First, we monitored Acc1p‐TAP levels in the ACC1 uORF mutant strain using synchronous elutriated cultures. The amplitude of the periodicity in Acc1p‐TAP levels in wild‐type cells was reduced significantly in the ACC1 uORF mutant (Fig 5B). The ACC1 mRNA levels for the wild‐type and the ACC1 uORF mutant strains did not show any periodic behavior in the cell cycle (Fig EV2). These results suggest that, at least in part, the uORF modulates the translational efficiency of ACC1 in the cell cycle. To evaluate whether the uORF is involved in the nutrient‐dependent control of Acc1p synthesis, we also examined ACC1‐TAP mRNA (Fig 5C, bottom) and Acc1p‐TAP steady‐state levels (Fig 5C, top) in media with rich (2% glucose) or poor (3% glycerol) carbon source. Remarkably, in poor medium, with 3% glycerol as the carbon source, in the ACC1 uORF mutant the levels of Acc1p‐TAP protein relative to the levels of the ACC1‐TAP mRNA were > 10‐fold higher than in the same cells cultured in rich medium, with 2% glucose as the carbon source (Fig 5C and D). Hence, the uORF of the ACC1 mRNA also modulates the levels of Acc1p in a nutrient‐dependent manner. The uORF disproportionately inhibits synthesis of Acc1p in poor media. In the Discussion, we describe how a classic kinetic model of translation explains this behavior (Lodish, 1974). Overall, the evidence we collected shows that the uORF of ACC1 contributes to the translational control of ACC1 in the cell cycle and in response to nutrients. Our experiments monitoring protein abundance of wild‐type Acc1p, Fas1p, Fas2p in the cell cycle (see Fig 4) report on steady‐state levels of the proteins in question, which can be affected by both the rate of their synthesis and degradation. In the case of Acc1p‐TAP, however, since both the wild‐type and the uORF mutant strain express the same Acc1p‐TAP protein, differences in the levels of Acc1p‐TAP between these strains in the cell cycle and in different nutrients are due to differential synthesis and not a result of altered protein stability.
Figure EV2. The ACC1 mRNA does not oscillate in the cell cycle in strains carrying C‐terminal TAP‐tagged alleles of ACC1 at their endogenous chromosomal locations.
-
A, BSamples were collected by elutriation and allowed to progress synchronously in the cell cycle. At the indicated cell sizes, the abundance of the indicated mRNAs was queried and quantified as described in Materials and Methods.
Source data are available online for this figure.
Cells carrying temperature‐sensitive, loss‐of‐function alleles of ACC1 arrest in G2/M at their restrictive temperature (Schneiter et al, 1996; Al‐Feel et al, 2003). On the other hand, to our knowledge, cell cycle effects upon over‐expression of ACC1 have not been examined. In glycerol‐containing media, when Acc1p levels are elevated in cells lacking the ACC1 uORF (Fig 5), the mean (37.1 ± 0.6 fl vs. 42.9 ± 1.4 fl, n = 6) and birth (16.2 ± 0.6 fl vs. 19.1 ± 0.3 fl, n = 6) size of ACC1 uORF mutant cells were significantly smaller compared to wild‐type cells (Fig 6A; P = 0.002165, using the non‐parametric Wilcoxon rank sum test). ACC1 uORF mutant cells also had a longer doubling time, T d (Fig 6A). However, the DNA content of the ACC1 uORF mutant was not significantly different from that of wild‐type cells in this glycerol‐containing medium (Fig 6B). Hence, the longer cell cycle time of the ACC1 uORF mutant arises from an increase in the duration of the G1 and G2/M cell cycle phases. We have previously documented this phenotype in a genomewide survey of deletion mutants (Hoose et al, 2012), such as cells lacking Erg6p, a sterol methyl transferase that regulates membrane dynamics (Gaber et al, 1989). To look at the G1 phase in more detail, we examined synchronous cultures obtained by elutriation. We found that the critical size, at which cells commit to a new round of cell division at START, was reduced in ACC1 uORF mutant cells (Fig 6, top). However, there was also a decrease in the rate of size increase for the ACC1 uORF mutant (Fig 6C, bottom). As a result, the absolute length of the G1 phase was ≈30% longer than the length of the G1 phase of wild‐type cells in these conditions, because cells lacking the ACC1 uORF are born smaller and increase in size slower. The prolongation of the G1 phase of ACC1 uORF mutant cells in glycerol was matched with a proportional increase of non‐G1 cell cycle phases, due to their lower rate that they increase in size, accounting for their longer cell cycle time.
Figure 6. Cells lacking the uORF upstream of ACC1 proliferate slower and are smaller in glycerol media.
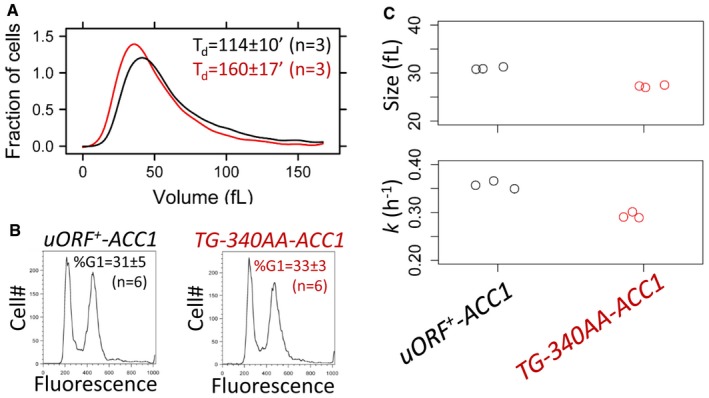
- Representative size histograms of the wild‐type (shown in black) and TG‐340AA‐ACC1 (shown in red) cell populations cultured in YPGlycerol medium was measured using a channelyzer. Cell numbers are plotted on the y‐axis, and the x‐axis indicates cell volume (in fl). The average doubling time (T d) of the same cultures (n = 3) is shown in each case (average ± s.d.).
- Representative DNA content histograms of wild‐type (shown in black) and TG‐340AA‐ACC1 (shown in red) cell populations cultured in YPGlycerol were obtained with flow cytometry. Cell numbers are plotted on the y‐axis, and the x‐axis indicates fluorescence per cell. The average percentage of cells with a G1 DNA content (%G1) of the same samples (n = 6) is shown in each case (average ± s.d.).
- Strip charts showing the critical size (top) and specific rate of size increase (bottom) of the indicated strains obtained from elutriated synchronous cell populations growing in YPGlycerol medium.
Since Acc1p activity is thought to be rate limiting for lipid biogenesis, we also examined if two major sinks of cellular lipids, neutral lipid droplets and phospholipids (PLs), were affected in the ACC1 uORF mutant. It was recently reported that storage of neutral lipids in lipid droplets fuels mitotic exit (Yang et al, 2016). In rich medium with glucose as a carbon source, and consistent with the report from Yang et al (2016), we observed that levels of neutral lipids increased in wild‐type cells synchronized in mitosis compared to exponentially proliferating cells (Fig EV3A and C; P = 0.00999, comparing the uORF + ‐ACC1 “Log” sample with the “20′” after mitotic release sample with the non‐parametric Kruskal and Wallis one‐way analysis of variance by ranks, followed by the post hoc Nemenyi test for pairwise multiple comparisons, implemented with the PMCMR R language package). In ACC1 uORF mutant cells, the levels of neutral lipids were already high in exponentially growing cells (Fig EV3B and C; P = 7.5E‐06, comparing the “Log” samples of uORF + ‐ACC1 and TG‐340AA‐ACC1 cells, analyzed as in the previous example). Furthermore, levels of neutral lipids did not increase further in mitosis in ACC1 uORF mutant cells (Fig EV3B and C). On the other hand, total phospholipid pools were indistinguishable between wild‐type and ACC1 uORF mutant cells (Fig EV3D). In exponentially proliferating cultures in poor medium, with glycerol as a carbon source, the ACC1 uORF mutant also had higher levels of neutral lipids (Fig EV4A–C; P = 6.794E‐12, using the non‐parametric Wilcoxon rank sum test). In glycerol medium, the ACC1 uORF mutant also did not accumulate higher levels of phospholipids (Fig EV4D). Overall, these results argue that de‐repressing the translational control of ACC1 increases the flux toward neutral lipid storage.
Figure EV3. Lipid droplet and phospholipid content of ACC1 uORF mutant cells in the cell cycle.
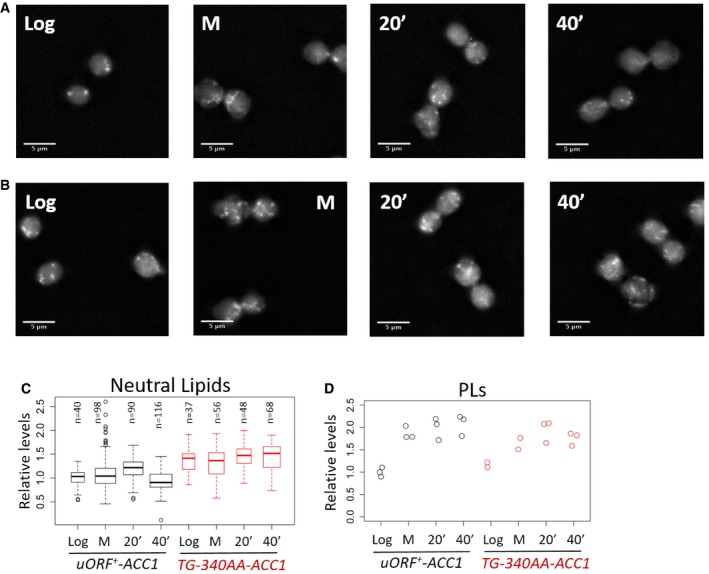
- Representative images to visualize neutral lipids using fluorescence microscopy of wild‐type (uORF + ‐ACC1) cells stained with Nile Red as described in Materials and Methods. The images were taken from cells grown in rich, glucose‐containing medium at the following states: proliferating exponentially (Log); arrested in mitosis with nocodazole (M); and 20 or 40 min after they were released from the arrest (20′ or 40′).
- Images of ACC1 uORF mutant cells (TG‐340AA‐ACC1), obtained as in (A).
- Quantification of the lipid droplet (Neutral Lipids) staining from (A and B), displayed with box‐plots, normalized for the values of the “Log uORF + ‐ACC1” sample. The median and the inter‐quartile range are indicated, along with the number of cells examined in each case. The whiskers extend to 1.5 times the interquartile range.
- Strip charts showing the quantification of total phospholipid (PLs) content from the same cell populations shown in (A–C), normalized for the values of the “Log uORF + ‐ACC1” sample.
Figure EV4. Lipid droplet and phospholipid content of ACC1 uORF mutant cells in glycerol medium.
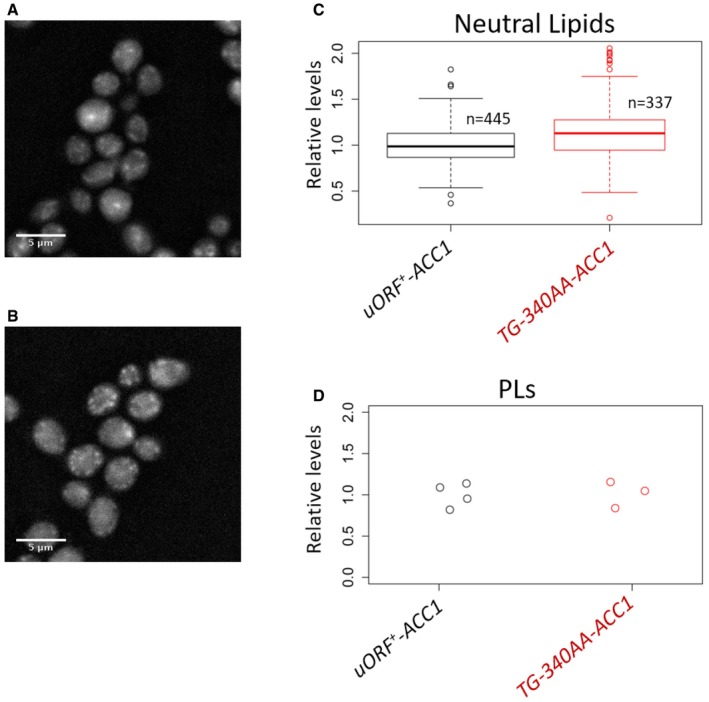
-
A, BRepresentative images to visualize lipid droplets using fluorescence microscopy of wild‐type (A) or ACC1 uORF mutant cells (B) proliferating exponentially in poor medium, with glycerol as carbon source. In all microscope images, 5 μm scale bars are indicated.
-
CQuantification of the lipid droplet (Neutral Lipids) staining from (A and B), displayed with box‐plots, normalized for the values of the “uORF + ‐ACC1” sample. The median and the inter‐quartile range are indicated, along with the number of cells examined in each case. The whiskers extend to 1.5 times the interquartile range.
-
DStrip chart showing the quantification of total phospholipid (PLs) content from the same cell populations shown in (A–C), normalized for the values of the “uORF + ‐ACC1” sample.
Mutating the ACC1 uORF suppresses the increased replicative longevity of sch9Δ mutants
Dysregulation of translation is considered a proximal cause of replicative aging in yeast (Kaeberlein & Qkennedy, 2011; Janssens et al, 2015). Mutations in ribosome biogenesis constitute a large class of pro‐longevity mutations in yeast and other species (Kaeberlein et al, 2005; Steffen et al, 2008, 2012; Kaeberlein & Qkennedy, 2011; McCormick et al, 2015). Hence, we reasoned that replicative life span (i.e., the number of times a yeast cell can divide) may be a functional readout that is sensitive to the dynamic translational control of ACC1. We examined the replicative life span of the ACC1 uORF mutant strain, alone and in the context of the prototypical long‐lived mutants of the target or rapamycin (TOR) pathway, since this pathway also controls ribosome biogenesis and initiation of translation (Kaeberlein & Qkennedy, 2011; Loewith & Hall, 2011; Polymenis & Aramayo, 2015). The Sch9p kinase is a direct target of the Tor1p kinase complex (Urban et al, 2007; Loewith & Hall, 2011; Oliveira et al, 2015). Sch9p is also a key effector of lipid metabolism and fatty acid starvation in a role that appears to be, at least in part, independent of Tor1p (Pultz et al, 2012; Swinnen et al, 2014b). The ACC1 uORF mutant allele had no effect on replicative life span on its own (Fig 7A and B). Importantly, the ACC1 uORF mutation suppressed significantly the long mean life span of sch9Δ cells (Fig 7A), but to a much lesser extent the long life span of tor1∆ cells (Fig 7B). These data show that upon loss of Sch9p, control of ACC1 modulates the number of divisions mother cells undergo before they die. Hence, this is a case of a mutation in a translational control element affecting longevity.
Figure 7. Mutating the uORF upstream of ACC1 suppresses replicative longevity conferred by loss of SCH9 .
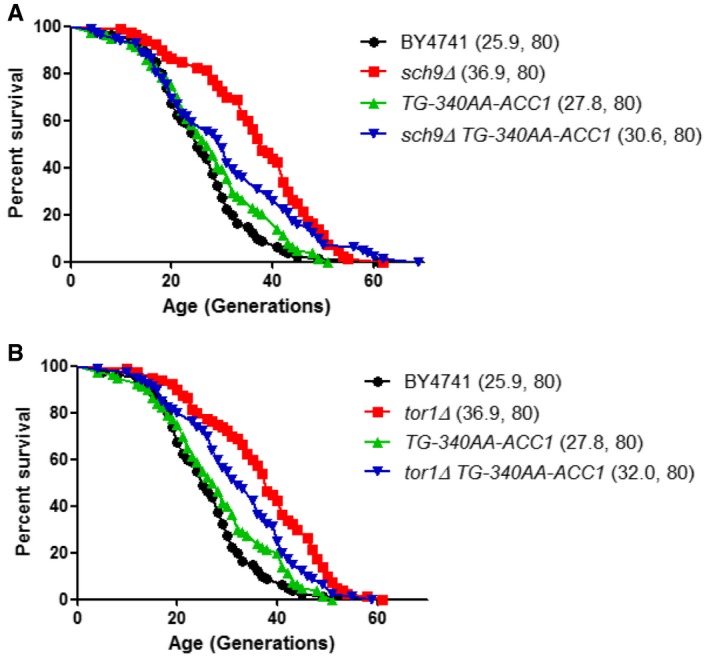
-
A, BSurvival curves in the MATa BY4741 background of the indicated strains lacking SCH9 (A) or TOR1 (B), alone or in combination with the ACC1 uORF mutation (TG‐340AA‐ACC1). Mean life spans are shown in parentheses, along with the number of cells assayed in each case.
Discussion
Herein, we apply ribosome‐profiling technology to probe the role of translational control as cells progress through an unperturbed cell cycle. These experiments produce the first systematic survey, in any system, of translational control in the cell cycle from un‐arrested cells that maintain the normal coupling of cell growth with cell division. Unexpectedly, of the periodically controlled mRNAs identified in the ribosome‐profiling regime, lipid biosynthesis showed the most significant ontology enrichment. Specifically, translational efficiency of ACC1, FAS1, and FAS2 mRNAs increased in G2/M, and this was reflected in the corresponding protein levels. In the case of ACC1, where the effect was most pronounced, the data indicate that the translational efficiency of ACC1 is regulated in the cell cycle and also in response to nutrient availability. These data form the first concrete evidence of a periodic increase in lipogenic enzyme levels late in the cell cycle.
Translation of the ACC1 mRNA is subject to cis‐acting control where a uORF encoded in the 5′‐leader of the message mediates nutrient‐dependent control of Acc1p acetyl‐CoA carboxylase levels. We interpret this regulatory circuit through the classic kinetic model of translation proposed by Lodish (Lodish, 1974). That is, under conditions of low ribosome content, the presence of the uORF disproportionately reduces the number of ribosomes that reach the main ACC1 ORF, thereby reducing the efficiency of Acc1p translation (Fig EV5). Reciprocally, under conditions of high ribosome content, Acc1p production is enhanced. While this simple model satisfactorily accounts for our results concerning ACC1 translational control as a function of carbon source, that mechanism, at least in its simplest form, requires cell cycle‐dependent changes in the concentration of active initiating ribosomes for realizing periodic translational control of ACC1. There are no data that speak to this issue, however. Therefore, one must also consider alternative layers of regulation involving mRNA‐specific interacting factors. In that regard, the long 5′‐leader of the ACC1 mRNA is predicted to exhibit substantial secondary structure that could play a role in regulating periodic control of ACC1 translation efficiency (see Appendix Table S3).
Figure EV5. Model for the nutrient‐dependent control of Acc1p levels mediated by the uORF .
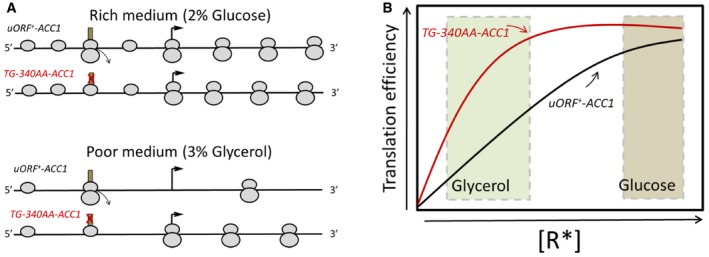
- Top: In rich media with high ribosome content, the uORF does not significantly inhibit the number of scanning ribosomes that initiate from the main ACC1 ORF. Bottom: In poor media with lower ribosome content, the uORF reduces the number of scanning ribosomes that are able to reach the main, downstream AUG, thereby disproportionately reducing Acc1p synthesis.
- The expected translational efficiency of the wild‐type ACC1 mRNA (shown in black) and the mutant lacking the uORF (shown in red) is depicted as a function of the concentration of active initiating ribosomes, R*, in the cell, adapted from the standard theoretical calculations of Lodish (1974).
Our findings have large implications for cell cycle progression in that translational control may connect two fundamental aspects of cell growth—that is, increases in volume and surface with synthesis of proteins and lipids. This idea of coordinate regulation of protein and lipid synthesis is consistent with the previous demonstration that death from fatty acid starvation in yeast and other fungi is delayed upon inhibition of protein synthesis (Henry, 1973). Moreover, in human cells, de novo lipogenesis attributed to increased activity of acetyl‐CoA carboxylase is deemed essential for mitotic exit (Scaglia et al, 2014). Enhanced synthesis of lipids late in the cell cycle has a strong rationale as cells exiting mitosis experience a sudden increase in surface area with a calculated magnitude as high as 40% for spherical cells (Mitchison, 1971b), and such a surface increase is estimated to be ca. 5–10% of the total cell surface for yeast (Powell et al, 2003). This scale imposes a significant demand for new lipids. We noted, however, that despite the increase storage of neutral lipids in the ACC1 uORF mutant (Fig EV4), these cells are smaller than their wild‐type counterparts are (Fig 6).
More specialized roles for cell cycle‐regulated lipid synthesis cannot be discounted. This is especially true in eukaryotic cells that exhibit a complex set of intracellular membrane systems. Of these, maintenance and dynamics of the nuclear envelope through the cell cycle may be particularly important (Schneiter et al, 1996). Lipid biogenesis is critical for nuclear membrane expansion during the closed mitosis that many fungal species undergo—including S. cerevisiae (Santos‐Rosa et al, 2005; Walters et al, 2012, 2014; Witkin et al, 2012; Siniossoglou, 2013). A requirement for membrane growth in yeast as cells enter mitosis has also recently been reported (Anastasia et al, 2012; McCusker & Kellogg, 2012; Schuldt, 2012). Although it is not clear whether the phenomenon of mitotic swelling observed in a variety of animal cells requires a burst of de novo lipid synthesis during mitosis (Son et al, 2015; Zlotek‐Zlotkiewicz et al, 2015), translational control of rate‐determining lipid biosynthetic enzymes provides an attractive mechanism for achieving such an end.
Lastly, the significance of translational control of specific mRNA targets in growing cells extends beyond the strict boundaries of cell cycle studies. Dysregulation of translation is linked to aging, and ribosomal perturbations promote longevity in yeast and animals (Kaeberlein et al, 2005; Hansen et al, 2007; Steffen et al, 2008, 2012; Kaeberlein & Qkennedy, 2011; Janssens et al, 2015; McCormick et al, 2015). However, our understanding of the mRNA targets of translational control responsible for the increased longevity is incomplete. It is an intriguing possibility that translational control impinges on both cell cycle progression and life span via common mechanisms. Consistent with this notion, a moderate delay early in the cell cycle observed in long‐lived mutants has predictive value for identifying effective interventions that extend life span in multiple organisms (He et al, 2014). In that regard, the AGC kinase Sch9p is a key regulator of ribosome biogenesis (Jorgensen et al, 2004; Loewith & Hall, 2011) and is required for proper cell cycle progression (Toda et al, 1988; Jorgensen et al, 2004; Soma et al, 2014), and loss of Sch9p extends life span (Kaeberlein et al, 2005). Our finding that the ACC1 uORF mutant allele partially suppressed the longevity of sch9∆ cells was particularly interesting given that Sch9p also regulates lipid metabolism (Huang et al, 2012; Pultz et al, 2012; Swinnen et al, 2014a,b). We suggest that ACC1 is one of the elusive mRNA targets of translational control that impinge on longevity. A progressive decline in the properly assembled, active fraction of the protein synthesis machinery in old yeast cells is proposed as a major cause of replicative aging (Janssens et al, 2015). It is possible that in aged ACC1 uORF mutant cells, synthesis of Acc1p is dysregulated in a manner analogous to that observed in glycerol‐grown cells. Reversal of the signature longevity of sch9∆ cells by mutation of the ACC1 uORF is consistent with such a model. Taken together, the data reported herein link lipid biogenesis, protein synthesis, and cell division and add important new concepts to the emerging role of membrane dynamics in the cell cycle. The periodic translational control characteristic of cells for which growth and cell division remain coupled now defines a platform from which mRNA‐specific mechanisms that underlie these processes can be experimentally approached.
Materials and Methods
Strains
All S. cerevisiae strains that we used in this study are shown in the Appendix Table S2. Unless indicated otherwise, the medium was YPD (1% w/v yeast extract, 2% w/v peptone, 2% w/v dextrose). For the experiments in Figs 5, 6, and EV4, dextrose was substituted with glycerol (3% w/v), as indicated. Selective media were prepared as described in Kaiser et al (1994).
To modify the ACC1 5′‐leader, we first inserted a kanMX6 cassette upstream, at position ChrXIV:662143 with PCR‐mediated methodology (Longtine et al, 1998), using primers XIV662193‐F1 and XIV662093‐R1 (see Appendix Table S1). The resulting strain (YL01; see Appendix Table S2) was genotyped by PCR for the presence of the cassette at the expected location, using primers that flank the insertion (XIV662374‐FWD and XIV661552‐REV; see Appendix Table S2). Genomic DNA from strain YL01 was then used as a template in a PCR with a forward primer further upstream (XIV662374‐FWD) and a reverse primer (ACC1‐(TG‐340AA)‐REV) that introduces the TG‐340→AA substitutions that mutate the start codon of the ACC1 uORF. The resulting PCR product was used to transform the diploid wild‐type strain BY4743, yielding heterozygous transformants (strain SCMSP232; see Appendix Table S2), verified by PCR (with primers XIV661899‐FWD and XIV661552‐REV; see Appendix Table S1) followed by restriction digest, since the TG‐340→AA substitutions also eliminate an NspI restriction site normally present at that position. Strain SCMSP232 was then sporulated, and tetrads were dissected. A MATa haploid segregant (SCMSP233‐C) of SCMSP232 was genotyped as above by PCR and restriction digestion, and its genomic DNA in the region was also sequenced to ensure the presence of the TG‐340→AA mutation and the absence of any other changes. For protein surveillance of Acc1p, we introduced in frame sequences encoding a C‐terminal TAP epitope at the 5′‐end of the ACC1 ORF in strains YL01 and SCMSP233‐C, using the methodology described in Puig et al (2001), with primers ACC1‐CTAP‐FWD and ACC1‐CTAP‐REV (see Appendix Table S1). The resulting strains (SCMSP234 and SCMSP236) expressed a protein of the expected size based on immunoblotting (see Figs 4 and 5), and their generation time did not differ significantly from the generation time of their parental strains (YL01 and SCMSP233‐C, respectively). The tor1∆ and sch9∆ strains we used for the life span experiments shown in Fig 7 have been described elsewhere (McCormick et al, 2015). These strains were crossed with SCMSP233‐C and sporulated, and tetrads were dissected to generate the double‐mutant strains shown in Fig 7.
Elutriation
For each elutriation experiment in YPD (1% w/v yeast extract, 2% w/v peptone, 2% w/v dextrose), a 250 ml culture was allowed to reach a cell density of 1–5E+07 cells/ml. For the diploid strains used in the ribosome‐profiling experiments, the culture was then loaded at a pump speed of 50 ml/min onto a large elutriator chamber (40 ml) spinning at 3,200 rpm (Beckman J‐6M/E centrifuge). For other experiments with haploid strains, the cultures were loaded at a pump speed of 35 ml/min onto the elutriator chamber. The centrifuge temperature was 25°C during all the centrifugation steps. For typical time‐series experiments with synchronous elutriated cultures (e.g., see Fig 4), we isolated the first, early G1 daughter fraction and monitored it at regular intervals afterward as it progressed in the cell cycle, as we have described elsewhere (Bogomolnaya et al, 2004; Hoose et al, 2012; Pathak et al, 2004). For the elutriations in Fig 6, the medium was YPGlycerol (1% w/v yeast extract, 2% w/v peptone, 3% w/v glycerol).
For the ribosome‐profiling elutriation experiments, four to six fractions of daughter cells were elutriated at 1,024 g centrifuge speed and pump speeds progressively increasing from 55 ml/min to 65 ml/min, using 250 ml of media for each fraction. Each elutriated fraction was collected in flasks on ice and kept separate from other fractions. The elutriated cells of each fraction were recovered by centrifugation at 4,000 g for 10 min and re‐suspended in fresh pre‐warmed YPD medium, at a cell density of ≈3E+07 cells/ml. More than 95% of the cells in each fraction were unbudded. The starting cell size of the different elutriated fractions typically ranged from 35 to 50 fl. The cells from each elutriated fraction were then placed in a 30°C incubator and allowed to reach the desired cell size, from 40 to 75 fl, measured with a Beckman Z2 channelyzer. At that point, the budding index of the culture was recorded, and cycloheximide (Sigma‐Aldrich, Cat#: C7698) was added at 100 μg/ml. Although cycloheximide has been reported to affect the specific codons at which ribosomes arrest (Hussmann et al, 2015), it is not thought to affect transcript‐wide measurements of ribosome density, which is the output we queried in this study.
The cells were then harvested by centrifugation at 4,000 g for 5 min, and the cell pellet was stored at −80°C. This procedure was repeated until ≥ 2E+09 cells were collected for each of the cell sizes shown in Fig 1. Before library construction, the frozen pellets of cells of similar size were combined into pools. The weighted average values of cell size and budding index for each of the three pools that correspond to a given cell size are shown in Fig 1B.
Library construction
One‐third of each of the 24 pools was used for mRNA libraries, while the remaining two‐thirds were used for the corresponding ribosome footprint libraries. For the mRNA libraries, we first isolated total RNA using the RNeasy kit (Qiagen, Cat#: 74104), which was then used to isolate poly(A)+ RNA with the Oligotex kit (Qiagen, Cat#: 70022). The purified mRNA from each sample was then used with the ScriptSeq v2 RNA‐Seq library preparation kit (Illumina, Cat#: SSV21124), exactly according to the manufacturer's instructions. In the final PCR amplification of the libraries, the forward primer was the one included in the ScriptSeq v2 RNA‐Seq kit, while the reverse index PCR primers used for the mRNA libraries were primers 1 through 8, from the ScriptSeq Set 1 (Illumina, Cat#: RSBC10948). All other primers were ordered from Integrated DNA Technologies, and they are listed in Appendix Table S1.
For the ribosome footprint libraries, the cell extracts were prepared as follows: The cell pellets were in 1.5 ml screw‐cap microcentrifuge tubes, and they were washed once with 1 ml ice‐cold DEPC‐treated water and centrifuged at 13,000 g for 1 min, and the supernatant was aspirated. To each tube, we added 0.25‐ml glass beads (425–600 μm; Sigma‐Aldrich, Cat#: G9268) and 0.4 ml ice‐cold lysis buffer, which is described in Ingolia et al (2012). The cells were broken by vortexing at full speed eight times, for 15 s each time. The samples were placed in ice for at least 30 s between each vortexing. The extracts were clarified by centrifugation at 5,000 g for 5 min, at 4°C. The supernatant was clarified in a second centrifugation, at 13,000 g for 10 min, at 4°C. All subsequent steps for the ribosome footprint libraries were performed as described in Ingolia et al (2012), except step 7, where we used 1.875 μl of RNase I (100 U/μl) per reaction. For all gel extractions, we used the overnight protocol described in Ingolia et al (2012). Depletion of rRNA was done as described in Ingolia et al (2012), with the biotinylated oligonucleotides shown in Appendix Table S1. In the final PCR amplification and barcode addition step, we amplified each library for 12 cycles.
Sequencing
Sample libraries were sequenced using the Illumina HiSeq 2500 in High Output mode. Sequence cluster identification, quality pre‐filtering, base calling, and uncertainty assessment were done in real time using Illumina's HCS 2.2.58 and RTA 1.18.64 software with default parameter settings. Sequencer .bcl basecall files were de‐multiplexed, allowing a 1 bp mismatch, and formatted into .fastq files using bcl2fastq 2.17.1.14 script configureBclToFastq.pl. Cutadapt 1.8 was used to identify reads that contained > 5 bp of sequence adaptor and binned but not processed to remove adaptor.
Sequence alignment
From raw reads (50 nt), we removed sequencing artifacts and adaptors. Reads carrying “N's” located in the first position were trimmed. Those located in the middle of the read were truncated at that position. Reads were then filtered by size (≥ 12 nt). We retained reads with a FASTQ Quality Score ≥ 20. Lastly, reads were subjected to a second round of size filtering, retaining reads that were ≥ 18 nt. We systematically tested different mapping conditions and parameters, to be described elsewhere. We used a GTF‐genome‐annotation‐guided file to direct the mapping using a splice‐aware program like TopHat (Langmead et al, 2009a; Trapnell et al, 2009; Kim & Osalzberg, 2011; Kim et al, 2013). Optimal mapping was obtained by directing TopHat to invoke Bowtie (as opposed to Bowtie2) for mapping (Langmead et al, 2009a,b; Trapnell et al, 2009; Langmead & Zsalzberg, 2012). Reads were then assembled using Cufflinks (Trapnell et al, 2010, 2013; Roberts et al, 2011a,b). After merging the assemblies with CuffMerge, we used CuffDiff to calculate and compare levels of transcripts. In addition, these results were verified by independently running a custom‐modified RSEM, a package that is capable of providing a posterior mean and 95% credibility interval estimates for expression levels (Li & Dewey, 2011). Finally, we used CummeRbund, an R package, to visualize results from CuffDiff experiments. When needed, resulting alignment BAM files were sorted and indexed using the SAM Tools (Li et al, 2009; Li, 2011a,b) and visualized using Integrative Genome Browser (IGV) (Robinson et al, 2011; Thorvaldsdottir et al, 2013). All the sequencing libraries, for mRNA and ribosome footprints, are listed in Appendix File S1. All raw sequencing data from each library have been deposited (GEO: GSE81932), under their corresponding names are listed in Appendix File S1.
Periodic expression analysis
For the mRNA sequencing results, the normalized transcript reads (FPKM values from the RSEM output, see above) for each gene and point along the cell size series were averaged across the three separate experiments. These average values were then divided by the mean across the entire cell size series for each transcript, yielding expressed ratio values for each transcript and cell size point. We then used the log2‐transformations of these ratio values as input (see Fig 2 and Dataset 1 within the Source Data for this figure; also deposited in GEO:GSE81932) for the R package cycle (Futschik & Herzel, 2008). The following steps are described in detail by Futschik in the vignette that accompanies the cycle package in the R repository. First, we set a threshold filter of 0.25, excluding 190 transcripts with > 25% of the measurements of the cell size series missing, from 6,713 transcripts analyzed. Second, we replaced the remaining missing values with the average of the > 75% of the measurements that were present. Third, we used the “standardize” function of the package, so that the values have a mean value of zero and a standard deviation of one, for the calculation of Fourier scores. Next, we run the Fourier transformation function without the autocorrelation exclusion. We used the cell size increase as a reference for setting the period of the Fourier function. In our experiments, we looked at samples that increased 35 fl in size, from 40 to 75 fl. However, since we did not monitor cells as they re‐entered G1 in the next cell cycle, we set the period of the oscillation to a 50‐fl size interval for Fourier score calculations. The Fourier function also calculates the false discovery rate (FDR) based on comparisons with the scores obtained for the background data. To maximize the accuracy of these calculations, we set the number of background datasets to N = 10,000. Lastly, we set the FDR threshold to < 0.05. We also analyzed with the cycle package as described above the microarray dataset from elutriation reported by Spellman et al (1998).
To cluster and display the data from the 144 transcripts that we identified in common with (Spellman et al, 1998), we used the pheatmap R package with unsupervised hierarchical clustering (Fig 2). Gene ontology enrichments and the associated P‐values were from the DAVID software package (Huang et al, 2007) or from the YeastMine platform (Balakrishnan et al, 2012), as indicated in each case.
Statistical analyses of ribosome‐profiling data
The babel (Olshen et al, 2013) and anota (Larsson et al, 2011) R language packages were used as we describe below. In all analyses, we excluded mRNA transcripts or ribosome footprints with > 25% of the measurements of the cell size series missing. For the babel package, we used raw counts for the mRNA and ribosome footprint reads (see Fig 3 and Datasets 3 and 4 within the Source Data for this figure; also deposited in GEO:GSE81932). The permutation for the calculations (nreps) was set to 10 million, and the cutoff for the minimum number of mRNA counts (min.rna) for a given gene to be included in the analysis was set to 10. From 3,291 loci that passed the above cutoffs, we identified 459 (see Fig 3 and Dataset 5 within the Source Data for this figure; also deposited in GEO:GSE81932) for which the babel output had a P‐value < 0.05 and a FDR value < 0.2. These were targets that were translationally regulated within one or more cell size points. For the anota package, we used normalized reads (FPKM values from the RSEM output, see Fig 3 and Dataset 6 within the Source Data for this figure; also deposited in GEO:GSE81932), which were log2‐transformed. The anota outputs for each cell size identified all putative mRNAs under translational control (P‐value < 0.05) at that particular cell size, which were then combined from all cell size points to yield 579 targets that were translationally regulated at one or more cell size points (see Fig 3 and Dataset 7 within the Source Data for this figure; also deposited in GEO:GSE81932). Note that the anota package incorporates analysis of partial variance, which eliminates spurious correlations arising from the possibility that translational efficiency scores may correlate with cytoplasmic mRNA abundance instead of true translational efficiency (Larsson et al, 2011). We then compared the babel and anota outputs, to identify 55 targets (see Fig 3 and Dataset 8 within the Source Data for this figure; also deposited in GEO:GSE81932) identified by both packages.
To identify periodic translational control (see Fig 3), we used the R language cycle package as described above, except that the initial input values for the genes we examined were the ratio of the ribosome footprint values over their corresponding mRNA values. In all cases, from the raw data, there was a clear preponderance of 27‐ to 30‐nt‐long reads (see Appendix File S1), characteristic of true ribosome footprints (Ingolia et al, 2014).
Cell size and DNA content analysis
We measured cell size with a Beckman Z2 channelyzer. We recorded the geometric mean of the cell size of the population, using the AccuComp software package of the instrument. Calculations of the specific rate of size increase, k, in synchronous cultures (e.g., see Fig 6) assumed an exponential pattern of growth, as we have described elsewhere (Hoose et al, 2012). We have described in detail elsewhere the methodology for measuring birth size (Hoose et al, 2012; Truong et al, 2013), DNA content (Hoose et al, 2012), and budding index (Zettel et al, 2003; Guo et al, 2004). DNA content measurements with flow cytometry were done at the cytometry core facility of the Texas A&M College of Veterinary Medicine. Display of the relevant data with strip charts (e.g., see Figs 5 and 6) was done using the R package lattice.
Protein surveillance
Protein extracts for immunoblots were made with the sodium hydroxide extraction method (Kushnirov, 2000). The extracts were run on 6% SDS–PAGE gels. For detection of proteins of interest on immunoblots, we used an anti‐Pgk1p antibody (Novex by Life Technologies, Cat#: 459250) at a 1:1,000 dilution to detect Pgk1p, and the peroxidase‐anti‐peroxidase (PAP) soluble complex (Sigma, Cat#: P1291) at a 1:1,000 dilution to detect TAP‐tagged proteins. HRP‐conjugated secondary antibodies and chemiluminescence reagents were from Thermo Scientific and used at the dilutions recommended by the manufacturer. Detection of the proteins was either by exposure of the blot to X‐ray film and developing on a SRX 101A film processor (SourceOne Healthcare) or digital acquisition using an Amersham™ Imager 600 (GE Healthcare). Images were processed with the “Subtract Background” tool and band intensities quantified using the “Measure” tool to obtain a mean intensity for each band, using the ImageJ software package (Schneider et al, 2012). The area measured was kept constant for a particular sample series for each blot analyzed.
RNA surveillance
RNA was extracted using the hot acidic phenol method (Collart & Oliviero, 2001). Cells were re‐suspended in 0.4 ml of TES buffer (10 mM Tris, pH 7.5; 10 mM EDTA, and 0.5% SDS) with 0.1 ml of glass beads. Then, 0.4 ml of acid phenol, pH 4.5, was added (Ambion, Cat#: AM9720) and samples were heated at 65°C for 30 min with occasional vortexing at 10‐s intervals. The samples were centrifuged for 5 min at 13,000 g. The aqueous layer was transferred to a new tube containing 1 ml of cold 100% ethanol with 40 μl of 3 M sodium acetate and incubated overnight at 4°C. The next day, samples were centrifuged at 13,000 g for 20 min at 4°C, washed with 80% ethanol, and centrifuged again for 5 min at 13,000 g. The pellet was resuspended in 25 μl H2O. The amount of RNA in each sample was quantified with a spectrophotometer. From the asynchronous cultures, we loaded ≈20 μg per sample, while for the samples from synchronous cultures obtained by elutriation we loaded ≈10 μg per sample. Samples were electrophoresed in formaldehyde gels (1% w/v agarose), run at 100 V in buffer containing 20 mM MOPS, 5 mM sodium acetate, 1 mM EDTA, 0.74% v/v formaldehyde, pH 7.0. Transfer to a nylon membrane was performed according to the manufacturer's instructions (Amersham Hybond‐N+, Cat#: RPN303B).
DNA probes used to detect ACC1 and PGK1 were generated with PCR using genomic DNA as template and the primers listed in Appendix Table S1. The probes were purified and labeled according to the instructions of the North2South™ Biotin Random Prime Labeling Kit (ThermoFisher Scientific, Cat#: 17075). Hybridization and detection were performed using a North2South™ Chemiluminescent Hybridization and Detection Kit (ThermoFisher Scientific, Cat#: 17097) according to the manufacturer's instructions. Hybridization and the initial wash steps were carried out in a hybridization oven at 58°C. Blots were imaged using an Amersham™ Imager 600 (GE Healthcare). Bands were quantified in the same manner as that for the immunoblots (see above).
Sample collection for lipid analysis
Overnight cultures of the specified strains were grown at 30°C, with shaking, in standard YPD medium with the addition of DMSO to a final concentration of 1% v/v. The following morning the overnight cultures were verified to have an OD600 < 0.6. Cells were then filter collected and resuspended in 160 ml of fresh YPD media, pre‐warmed to 30°C. Cell density was measured using a Coulter Counter and verified to be 6.8E+6 cells/ml and 7.0E+6 cells/ml for the wild‐type (SCMSP234) and ACC1 uORF mutant (SCMSP236) strains, respectively. Samples were collected for lipid extraction (4 ml of culture) and for Nile Red staining. To arrest cells in mitosis, nocodazole (Sigma, Cat#: M1404) was added to 15 μg/ml from a 1.5 mg/ml stock in DMSO and the cells were placed in an incubator at 30°C, with shaking, until ≈93–94% of cells had arrested with a large‐budded morphology. Cells were released from mitotic arrest by filter‐washing with five volumes of pre‐warmed YPD containing 1% v/v DMSO and resuspended in fresh pre‐warmed YPD containing 1% v/v DMSO at a volume identical to the flask volume just prior to washing. Additional samples were taken at 20 and 40 min after release from mitosis. For lipid extraction, the cells pellets were washed once in ice‐cold water and frozen at −80°C, until further processing.
For the experiments shown in Fig EV4, cells were processed as above, except that they were grown in standard YPGlycerol at 30°C, with shaking, until their density reached ≈1E+7 cells/ml.
Neutral lipid quantification
To determine neutral lipid content, samples were processed as described previously (Rostron et al, 2015). Cells were viewed on a Nikon Ti‐E inverted microscope with a CFI Plan Apo lambda DM 100× objective, and Prior Scientific Lumen 200 Illumination system, C‐FL UV‐2E/C DAPI and C‐FL GFP HC HISN Zero Shift filter cubes, and a CoolSNAP HQ2 monochrome camera. Exposure times for the DAPI and GFP channels were 700 ms and 1 s, respectively. All images were captured with NIS Elements Advanced Research (version 4.10) and processed with ImageJ 1.5Oi.
The fluorescent images captured with the GFP filter were all processed in the same manner in ImageJ, using the process “Subtract Background” with a radius equal to 30. A plug‐in to ImageJ, the Cell Magic Wand Tool, was used to select cells for quantification using the phase contrast images. This selection was overlaid on the image from the same field with the GFP filter. The “Measure” function was then used to quantify the intensity of the selected cells. Small buds were left out of the quantification. Cells and their corresponding buds were quantified as two different “cells” by the cell selector tool.
Lipid extraction and phospholipid assay
Lipid extraction was based on the Folch method (Folch et al, 1957). Washed and frozen cell pellets collected during the experiments described in Figs EV3 and EV4 were processed as follows. Cells were re‐suspended in 50 μl of water. 400 μl of glass, acid‐washed beads, and 1 ml of a chloroform/methanol mixture (2:1) were added to each sample. Samples were vortexed at room temperature two times for 3 min each time, with cooling on ice between the vortexing. Cells were centrifuged at 13,000 g to collect the beads and cell debris at the bottom of the tube. The liquid layer (≈1 ml) was transferred to a new tube; 0.2 volumes of 0.9% w/v NaCl was added to each sample, vortexed for 5 s, and centrifuged at 300 g in a microcentrifuge to separate the two phases. The upper phase was vacuum aspirated and discarded. The interface was washed twice with a methanol/water mixture (1:1) by adding 500 μl of the mixture and carefully removing without mixing the phases of the preparation. Chloroform was removed from the remaining lipid‐containing phase by evaporating overnight under air and then heating at 80°C to remove any residual chloroform.
A modified colorimetric assay was used to determine phospholipid concentrations in the chloroform extracted lipid fraction (Sigal et al, 2007), with the following modifications. The acid solution was added directed to the air‐dried lipid samples in a glass tube, and phosphate standards were prepared by adding 25 μl of stock solutions to give a phosphate range from 0 to 250 nmol phosphate per standard sample tube.
Replicative life span assays
All replicative life span experiments were carried out on standard YPD plates as described elsewhere (Steffen et al, 2009).
Data availability
All the sequencing data and datasets reported in this paper are available from the Gene Expression Omnibus (accession number GSE81932).
Author contributions
Methodology: HMB, RP, CH, CDJ, VAB, BKK, RA, and MP; Software: RP and RA; Formal Analysis: HMB, RP, CH, NM, BKK, RA, and MP; Investigation: HMB, RP, CH, NM, RM, JH, YL, RA, and MP; Resources: CDJ, BKK, RA, and MP; Data Curation: HMB, CH, RP, RA, BKK, and MP; Writing—Original Draft: MP, Writing—Review and Editing: HMB, RP, CH, NM, JH, VAB, BKK, RA, and MP; Visualization: HMB, RP, CH, NM, BKK, RA, and MP; Supervision: BKK, RA, and MP; Funding Acquisition: BKK, RA, and MP.
Conflict of interest
The authors declare that they have no conflict of interest.
Supporting information
Appendix
Expanded View Figures PDF
Source Data for Expanded View
Review Process File
Source Data for Figure 2
Source Data for Figure 3
Source Data for Figure 4
Source Data for Figure 5
Acknowledgements
We thank Dr. Matt Sachs (Texas A&M University) for advice on ribosome profiling. We thank Drs. Matthias E. Futschik (University of Algarve), and Ola Larsson (Karolinska Institute), for their help in using the R language packages cycle, and anota, respectively. We also thank Dr. Jennifer Herman (Texas A&M University) for the use of the fluorescence microscope in her laboratory. MP was supported from the Genomics Initiative of Texas A&M University (grant 14194) and the NIH (grant GM123139). RA was supported from the NIH (grant GM123139). BKK was supported from the NIH (grants AG043080 and GM123139), and he is a senior scholar of the Ellison Medical Foundation. VAB was supported from the NIH (grant GM44530) and the Robert A. Welch Foundation (BE‐0017).
The EMBO Journal (2017) 36: 487–502
References
- Al‐Feel W, DeMar JC, Wakil SJ (2003) A Saccharomyces cerevisiae mutant strain defective in acetyl‐CoA carboxylase arrests at the G2/M phase of the cell cycle. Proc Natl Acad Sci USA 100: 3095–3100 [DOI] [PMC free article] [PubMed] [Google Scholar]
- Anastasia SD, Nguyen DL, Thai V, Meloy M, MacDonough T, Kellogg DR (2012) A link between mitotic entry and membrane growth suggests a novel model for cell size control. J Cell Biol 197: 89–104 [DOI] [PMC free article] [PubMed] [Google Scholar]
- Balakrishnan R, Park J, Karra K, Hitz BC, Binkley G, Hong EL, Sullivan J, Micklem G, Cherry JM (2012) YeastMine–an integrated data warehouse for Saccharomyces cerevisiae data as a multipurpose tool‐kit. Database (Oxford) 2012: bar062 [DOI] [PMC free article] [PubMed] [Google Scholar]
- Bloom J, Cross FR (2007) Multiple levels of cyclin specificity in cell‐cycle control. Nat Rev Mol Cell Biol 8: 149–160 [DOI] [PubMed] [Google Scholar]
- Bogomolnaya LM, Pathak R, Cham R, Guo J, Surovtseva YV, Jaeckel L, Polymenis M (2004) A new enrichment approach identifies genes that alter cell cycle progression in Saccharomyces cerevisiae . Curr Genet 45: 350–359 [DOI] [PubMed] [Google Scholar]
- Brar GA, Weissman JS (2015) Ribosome profiling reveals the what, when, where and how of protein synthesis. Nat Rev Mol Cell Biol 16: 651–664 [DOI] [PMC free article] [PubMed] [Google Scholar]
- Brooks RF (1977) Continuous protein synthesis is required to maintain the probability of entry into S phase. Cell 12: 311–317 [DOI] [PubMed] [Google Scholar]
- Cho RJ, Campbell MJ, Winzeler EA, Steinmetz L, Conway A, Wodicka L, Wolfsberg TG, Gabrielian AE, Landsman D, Lockhart DJ, Davis RW (1998) A genome‐wide transcriptional analysis of the mitotic cell cycle. Mol Cell 2: 65–73 [DOI] [PubMed] [Google Scholar]
- Collart MA, Oliviero S (2001) Preparation of yeast RNA Curr Protoc Mol Biol 23: 13.12.1–13.12.5 [DOI] [PubMed] [Google Scholar]
- Creanor J, Mitchison J (1979) Reduction of perturbations in leucine incorporation in synchronous cultures of Schizosaccharomyces pombe made by elutriation. J Gen Microbiol 112: 385–388 [Google Scholar]
- Cvijovic M, Dalevi D, Bilsland E, Kemp GJ, Sunnerhagen P (2007) Identification of putative regulatory upstream ORFs in the yeast genome using heuristics and evolutionary conservation. BMC Bioinformatics 8: 295 [DOI] [PMC free article] [PubMed] [Google Scholar]
- David L, Huber W, Granovskaia M, Toedling J, Palm CJ, Bofkin L, Jones T, Davis RW, Steinmetz LM (2006) A high‐resolution map of transcription in the yeast genome. Proc Natl Acad Sci USA 103: 5320–5325 [DOI] [PMC free article] [PubMed] [Google Scholar]
- Di Talia S, Skotheim JM, Bean JM, Siggia ED, Cross FR (2007) The effects of molecular noise and size control on variability in the budding yeast cell cycle. Nature 448: 947–951 [DOI] [PubMed] [Google Scholar]
- Elliott SG, McLaughlin CS (1978) Rate of macromolecular synthesis through the cell cycle of the yeast Saccharomyces cerevisiae . Proc Natl Acad Sci USA 75: 4384–4388 [DOI] [PMC free article] [PubMed] [Google Scholar]
- Elliott SG, Warner JR, McLaughlin CS (1979) Synthesis of ribosomal proteins during the cell cycle of the yeast Saccharomyces cerevisiae . J Bacteriol 137: 1048–1050 [DOI] [PMC free article] [PubMed] [Google Scholar]
- Fagone P, Jackowski S (2013) Phosphatidylcholine and the CDP‐choline cycle. Biochim Biophys Acta 1831: 523–532 [DOI] [PMC free article] [PubMed] [Google Scholar]
- Folch J, Lees M, Sloane Stanley GH (1957) A simple method for the isolation and purification of total lipides from animal tissues. J Biol Chem 226: 497–509 [PubMed] [Google Scholar]
- Futschik ME, Herzel H (2008) Are we overestimating the number of cell‐cycling genes? The impact of background models on time‐series analysis. Bioinformatics 24: 1063–1069 [DOI] [PubMed] [Google Scholar]
- Gaber RF, Copple DM, Kennedy BK, Vidal M, Bard M (1989) The yeast gene ERG6 is required for normal membrane function but is not essential for biosynthesis of the cell‐cycle‐sparking sterol. Mol Cell Biol 9: 3447–3456 [DOI] [PMC free article] [PubMed] [Google Scholar]
- Guo J, Bryan BA, Polymenis M (2004) Nutrient‐specific effects in the coordination of cell growth with cell division in continuous cultures of Saccharomyces cerevisiae . Arch Microbiol 182: 326–330 [DOI] [PubMed] [Google Scholar]
- Hansen M, Taubert S, Crawford D, Libina N, Lee SJ, Kenyon C (2007) Lifespan extension by conditions that inhibit translation in Caenorhabditis elegans . Aging Cell 6: 95–110 [DOI] [PubMed] [Google Scholar]
- Hartwell LH, Unger MW (1977) Unequal division in Saccharomyces cerevisiae and its implications for the control of cell division. J Cell Biol 75: 422–435 [DOI] [PMC free article] [PubMed] [Google Scholar]
- Hasslacher M, Ivessa AS, Paltauf F, Kohlwein SD (1993) Acetyl‐CoA carboxylase from yeast is an essential enzyme and is regulated by factors that control phospholipid metabolism. J Biol Chem 268: 10946–10952 [PubMed] [Google Scholar]
- He C, Tsuchiyama SK, Nguyen QT, Plyusnina EN, Terrill SR, Sahibzada S, Patel B, Faulkner AR, Shaposhnikov MV, Tian R, Tsuchiya M, Kaeberlein M, Moskalev AA, Kennedy BK, Polymenis M (2014) Enhanced longevity by ibuprofen, conserved in multiple species, occurs in yeast through inhibition of tryptophan import. PLoS Genet 10: e1004860 [DOI] [PMC free article] [PubMed] [Google Scholar]
- Henry SA (1973) Death resulting from fatty acid starvation in yeast. J Bacteriol 116: 1293–1303 [DOI] [PMC free article] [PubMed] [Google Scholar]
- Hoose SA, Rawlings JA, Kelly MM, Leitch MC, Ababneh QO, Robles JP, Taylor D, Hoover EM, Hailu B, McEnery KA, Downing SS, Kaushal D, Chen Y, Rife A, Brahmbhatt KA, Smith R III, Polymenis M (2012) A systematic analysis of cell cycle regulators in yeast reveals that most factors act independently of cell size to control initiation of division. PLoS Genet 8: e1002590 [DOI] [PMC free article] [PubMed] [Google Scholar]
- Huang DW, Sherman BT, Tan Q, Collins JR, Alvord WG, Roayaei J, Stephens R, Baseler MW, Lane HC, Lempicki RA (2007) The DAVID Gene Functional Classification Tool: a novel biological module‐centric algorithm to functionally analyze large gene lists. Genome Biol 8: R183 [DOI] [PMC free article] [PubMed] [Google Scholar]
- Huang X, Liu J, Dickson RC (2012) Down‐regulating sphingolipid synthesis increases yeast lifespan. PLoS Genet 8: e1002493 [DOI] [PMC free article] [PubMed] [Google Scholar]
- Hussmann JA, Patchett S, Johnson A, Sawyer S, Press WH (2015) Understanding biases in ribosome profiling experiments reveals signatures of translation dynamics in yeast. PLoS Genet 11: e1005732 [DOI] [PMC free article] [PubMed] [Google Scholar]
- Ingolia NT, Ghaemmaghami S, Newman JR, Weissman JS (2009) Genome‐wide analysis in vivo of translation with nucleotide resolution using ribosome profiling. Science 324: 218–223 [DOI] [PMC free article] [PubMed] [Google Scholar]
- Ingolia NT, Brar GA, Rouskin S, McGeachy AM, Weissman JS (2012) The ribosome profiling strategy for monitoring translation in vivo by deep sequencing of ribosome‐protected mRNA fragments. Nat Protoc 7: 1534–1550 [DOI] [PMC free article] [PubMed] [Google Scholar]
- Ingolia NT, Brar GA, Stern‐Ginossar N, Harris MS, Talhouarne GJ, Jackson SE, Wills MR, Weissman JS (2014) Ribosome profiling reveals pervasive translation outside of annotated protein‐coding genes. Cell Rep 8: 1365–1379 [DOI] [PMC free article] [PubMed] [Google Scholar]
- Ingolia NT (2016) Ribosome footprint profiling of translation throughout the genome. Cell 165: 22–33 [DOI] [PMC free article] [PubMed] [Google Scholar]
- Janssens GE, Meinema AC, Gonzalez J, Wolters JC, Schmidt A, Guryev V, Bischoff R, Wit EC, Veenhoff LM, Heinemann M (2015) Protein biogenesis machinery is a driver of replicative aging in yeast. Elife 4: e08527 [DOI] [PMC free article] [PubMed] [Google Scholar]
- Johnston GC, Pringle JR, Hartwell LH (1977) Coordination of growth with cell division in the yeast Saccharomyces cerevisiae . Exp Cell Res 105: 79–98 [DOI] [PubMed] [Google Scholar]
- Jorgensen P, Rupes I, Sharom JR, Schneper L, Broach JR, Tyers M (2004) A dynamic transcriptional network communicates growth potential to ribosome synthesis and critical cell size. Genes Dev 18: 2491–2505 [DOI] [PMC free article] [PubMed] [Google Scholar]
- Kaeberlein M, Powers RW III, Steffen KK, Westman EA, Hu D, Dang N, Kerr EO, Kirkland KT, Fields S, Kennedy BK (2005) Regulation of yeast replicative life span by TOR and Sch9 in response to nutrients. Science 310: 1193–1196 [DOI] [PubMed] [Google Scholar]
- Kaeberlein M, Kennedy BK (2011) Hot topics in aging research: protein translation and TOR signaling, 2010. Aging Cell 10: 185–190 [DOI] [PMC free article] [PubMed] [Google Scholar]
- Kaiser C, Michaelis S, Mitchell A, Cold Spring Harbor Laboratory (1994) Methods in yeast genetics: a Cold Spring Harbor Laboratory course manual. Cold Spring Harbor, NY: Cold Spring Harbor Laboratory Press; [Google Scholar]
- Kellis M, Patterson N, Endrizzi M, Birren B, Lander ES (2003) Sequencing and comparison of yeast species to identify genes and regulatory elements. Nature 423: 241–254 [DOI] [PubMed] [Google Scholar]
- Kim D, Salzberg SL (2011) TopHat‐Fusion: an algorithm for discovery of novel fusion transcripts. Genome Biol 12: R72 [DOI] [PMC free article] [PubMed] [Google Scholar]
- Kim D, Pertea G, Trapnell C, Pimentel H, Kelley R, Salzberg SL (2013) TopHat2: accurate alignment of transcriptomes in the presence of insertions, deletions and gene fusions. Genome Biol 14: R36 [DOI] [PMC free article] [PubMed] [Google Scholar]
- Klug L, Daum G (2014) Yeast lipid metabolism at a glance. FEMS Yeast Res 14: 369–388 [DOI] [PubMed] [Google Scholar]
- Kushnirov VV (2000) Rapid and reliable protein extraction from yeast. Yeast 16: 857–860 [DOI] [PubMed] [Google Scholar]
- Lange HC, Heijnen JJ (2001) Statistical reconciliation of the elemental and molecular biomass composition of Saccharomyces cerevisiae . Biotechnol Bioeng 75: 334–344 [DOI] [PubMed] [Google Scholar]
- Langmead B, Schatz MC, Lin J, Pop M, Salzberg SL (2009a) Searching for SNPs with cloud computing. Genome Biol 10: R134 [DOI] [PMC free article] [PubMed] [Google Scholar]
- Langmead B, Trapnell C, Pop M, Salzberg SL (2009b) Ultrafast and memory‐efficient alignment of short DNA sequences to the human genome. Genome Biol 10: R25 [DOI] [PMC free article] [PubMed] [Google Scholar]
- Langmead B, Salzberg SL (2012) Fast gapped‐read alignment with Bowtie 2. Nat Methods 9: 357–359 [DOI] [PMC free article] [PubMed] [Google Scholar]
- Larsson O, Sonenberg N, Nadon R (2011) anota: analysis of differential translation in genome‐wide studies. Bioinformatics 27: 1440–1441 [DOI] [PubMed] [Google Scholar]
- Li H, Handsaker B, Wysoker A, Fennell T, Ruan J, Homer N, Marth G, Abecasis G, Durbin R (2009) The sequence alignment/map format and SAMtools. Bioinformatics 25: 2078–2079 [DOI] [PMC free article] [PubMed] [Google Scholar]
- Li B, Dewey CN (2011) RSEM: accurate transcript quantification from RNA‐Seq data with or without a reference genome. BMC Bioinformatics 12: 323 [DOI] [PMC free article] [PubMed] [Google Scholar]
- Li H (2011a) Improving SNP discovery by base alignment quality. Bioinformatics 27: 1157–1158 [DOI] [PMC free article] [PubMed] [Google Scholar]
- Li H (2011b) A statistical framework for SNP calling, mutation discovery, association mapping and population genetical parameter estimation from sequencing data. Bioinformatics 27: 2987–2993 [DOI] [PMC free article] [PubMed] [Google Scholar]
- Lodish HF (1974) Model for the regulation of mRNA translation applied to haemoglobin synthesis. Nature 251: 385–388 [DOI] [PubMed] [Google Scholar]
- Loewith R, Hall MN (2011) Target of rapamycin (TOR) in nutrient signaling and growth control. Genetics 189: 1177–1201 [DOI] [PMC free article] [PubMed] [Google Scholar]
- Longtine MS, McKenzie A III, Demarini DJ, Shah NG, Wach A, Brachat A, Philippsen P, Pringle JR (1998) Additional modules for versatile and economical PCR‐based gene deletion and modification in Saccharomyces cerevisiae . Yeast 14: 953–961 [DOI] [PubMed] [Google Scholar]
- Ly T, Endo A, Lamond AI (2015) Proteomic analysis of the response to cell cycle arrests in human myeloid leukemia cells. ELife 4: e04534 [DOI] [PMC free article] [PubMed] [Google Scholar]
- McCormick MA, Delaney JR, Tsuchiya M, Tsuchiyama S, Shemorry A, Sim S, Chou AC, Ahmed U, Carr D, Murakami CJ, Schleit J, Sutphin GL, Wasko BM, Bennett CF, Wang AM, Olsen B, Beyer RP, Bammler TK, Prunkard D, Johnson SC et al (2015) A comprehensive analysis of replicative lifespan in 4,698 single‐gene deletion strains uncovers conserved mechanisms of aging. Cell Metab 22: 895–906 [DOI] [PMC free article] [PubMed] [Google Scholar]
- McCusker D, Kellogg DR (2012) Plasma membrane growth during the cell cycle: unsolved mysteries and recent progress. Curr Opin Cell Biol 24: 845–851 [DOI] [PMC free article] [PubMed] [Google Scholar]
- Mitchison JM (1971a) Cell growth and protein synthesis In The biology of the cell cycle, 129p. London: Cambridge University Press; [Google Scholar]
- Mitchison JM (1971b) Organelles, respiration and pools In The biology of the cell cycle, 186p. London: Cambridge University Press; [Google Scholar]
- Moore SA (1988) Kinetic evidence for a critical rate of protein synthesis in the Saccharomyces cerevisiae yeast cell cycle. J Biol Chem 263: 9674–9681 [PubMed] [Google Scholar]
- Oliva A, Rosebrock A, Ferrezuelo F, Pyne S, Chen H, Skiena S, Futcher B, Leatherwood J (2005) The cell cycle‐regulated genes of Schizosaccharomyces pombe . PLoS Biol 3: e225 [DOI] [PMC free article] [PubMed] [Google Scholar]
- Oliveira AP, Ludwig C, Zampieri M, Weisser H, Aebersold R, Sauer U (2015) Dynamic phosphoproteomics reveals TORC1‐dependent regulation of yeast nucleotide and amino acid biosynthesis. Sci Signal 8: rs4 [DOI] [PubMed] [Google Scholar]
- Olshen AB, Hsieh AC, Stumpf CR, Olshen RA, Ruggero D, Taylor BS (2013) Assessing gene‐level translational control from ribosome profiling. Bioinformatics 29: 2995–3002 [DOI] [PMC free article] [PubMed] [Google Scholar]
- Park J‐E, Yi H, Kim Y, Chang H, Kim VN (2016) Regulation of poly(A) tail and translation during the somatic cell cycle. Mol Cell 62: 462–471 [DOI] [PubMed] [Google Scholar]
- Pathak R, Bogomolnaya LM, Guo J, Polymenis M (2004) Gid8p (Dcr1p) and Dcr2p function in a common pathway to promote START completion in Saccharomyces cerevisiae . Eukaryot Cell 3: 1627–1638 [DOI] [PMC free article] [PubMed] [Google Scholar]
- Polymenis M, Aramayo R (2015) Translate to divide: control of the cell cycle by protein synthesis. Microb Cell 2: 94–104 [DOI] [PMC free article] [PubMed] [Google Scholar]
- Powell CD, Quain DE, Smart KA (2003) Chitin scar breaks in aged Saccharomyces cerevisiae . Microbiology 149: 3129–3137 [DOI] [PubMed] [Google Scholar]
- Pringle JR, Hartwell LH (1981) The Saccharomyces cerevisiae cell cycle In The molecular and cellular biology of the yeast Saccharomyces, Strathern JN, Jones EW, Broach JR. (eds), pp 97–142. New York: Cold Spring Harbor Laboratory Press; [Google Scholar]
- Puig O, Caspary F, Rigaut G, Rutz B, Bouveret E, Bragado‐Nilsson E, Wilm M, Seraphin B (2001) The tandem affinity purification (TAP) method: a general procedure of protein complex purification. Methods 24: 218–229 [DOI] [PubMed] [Google Scholar]
- Pultz D, Bennetzen MV, Rodkaer SV, Zimmermann C, Enserink JM, Andersen JS, Faergeman NJ (2012) Global mapping of protein phosphorylation events identifies Ste20, Sch9 and the cell‐cycle regulatory kinases Cdc28/Pho85 as mediators of fatty acid starvation responses in Saccharomyces cerevisiae . Mol Biosyst 8: 796–803 [DOI] [PubMed] [Google Scholar]
- Roberts A, Pimentel H, Trapnell C, Pachter L (2011a) Identification of novel transcripts in annotated genomes using RNA‐Seq. Bioinformatics 27: 2325–2329 [DOI] [PubMed] [Google Scholar]
- Roberts A, Trapnell C, Donaghey J, Rinn JL, Pachter L (2011b) Improving RNA‐Seq expression estimates by correcting for fragment bias. Genome Biol 12: R22 [DOI] [PMC free article] [PubMed] [Google Scholar]
- Robinson JT, Thorvaldsdottir H, Winckler W, Guttman M, Lander ES, Getz G, Mesirov JP (2011) Integrative genomics viewer. Nat Biotechnol 29: 24–26 [DOI] [PMC free article] [PubMed] [Google Scholar]
- Rossow PW, Riddle VG, Pardee AB (1979) Synthesis of labile, serum‐dependent protein in early G1 controls animal cell growth. Proc Natl Acad Sci USA 76: 4446–4450 [DOI] [PMC free article] [PubMed] [Google Scholar]
- Rostron KA, Rolph CE, Lawrence CL (2015) Nile red fluorescence screening facilitating neutral lipid phenotype determination in budding yeast, Saccharomyces cerevisiae, and the fission yeast Schizosaccharomyces pombe . Antonie Van Leeuwenhoek 108: 97–106 [DOI] [PubMed] [Google Scholar]
- Santos‐Rosa H, Leung J, Grimsey N, Peak‐Chew S, Siniossoglou S (2005) The yeast lipin Smp2 couples phospholipid biosynthesis to nuclear membrane growth. EMBO J 24: 1931–1941 [DOI] [PMC free article] [PubMed] [Google Scholar]
- Scaglia N, Tyekucheva S, Zadra G, Photopoulos C, Loda M (2014) De novo fatty acid synthesis at the mitotic exit is required to complete cellular division. Cell Cycle 13: 859–868 [DOI] [PMC free article] [PubMed] [Google Scholar]
- Schmoller KM, Skotheim JM (2015) The biosynthetic basis of cell size control. Trends Cell Biol 25: 793–802 [DOI] [PMC free article] [PubMed] [Google Scholar]
- Schmoller KM, Turner JJ, Koivomagi M, Skotheim JM (2015) Dilution of the cell cycle inhibitor Whi5 controls budding‐yeast cell size. Nature 526: 268–272 [DOI] [PMC free article] [PubMed] [Google Scholar]
- Schneider CA, Rasband WS, Eliceiri KW (2012) NIH Image to ImageJ: 25 years of image analysis. Nat Methods 9: 671–675 [DOI] [PMC free article] [PubMed] [Google Scholar]
- Schneiter R, Hitomi M, Ivessa AS, Fasch EV, Kohlwein SD, Tartakoff AM (1996) A yeast acetyl coenzyme A carboxylase mutant links very‐long‐chain fatty acid synthesis to the structure and function of the nuclear membrane‐pore complex. Mol Cell Biol 16: 7161–7172 [DOI] [PMC free article] [PubMed] [Google Scholar]
- Schuldt A (2012) Relaying membrane status. Nat Rev Mol Cell Biol 13: 280 [DOI] [PubMed] [Google Scholar]
- Shedden K, Cooper S (2002) Analysis of cell‐cycle gene expression in Saccharomyces cerevisiae using microarrays and multiple synchronization methods. Nucleic Acids Res 30: 2920–2929 [DOI] [PMC free article] [PubMed] [Google Scholar]
- Shulman RW, Hartwell LH, Warner JR (1973) Synthesis of ribosomal proteins during the yeast cell cycle. J Mol Biol 73: 513–525 [DOI] [PubMed] [Google Scholar]
- Sigal N, Lewinson O, Wolf SG, Bibi E (2007) E. coli multidrug transporter MdfA is a monomer. Biochemistry 46: 5200–5208 [DOI] [PubMed] [Google Scholar]
- Siniossoglou S (2013) Phospholipid metabolism and nuclear function: roles of the lipin family of phosphatidic acid phosphatases. Biochim Biophys Acta 1831: 575–581 [DOI] [PubMed] [Google Scholar]
- Soma S, Yang K, Morales MI, Polymenis M (2014) Multiple metabolic requirements for size homeostasis and initiation of division in Saccharomyces cerevisiae . Microb Cell 1: 256–266 [DOI] [PMC free article] [PubMed] [Google Scholar]
- Son S, Kang JH, Oh S, Kirschner MW, Mitchison TJ, Manalis S (2015) Resonant microchannel volume and mass measurements show that suspended cells swell during mitosis. J Cell Biol 211: 757–763 [DOI] [PMC free article] [PubMed] [Google Scholar]
- Spellman PT, Sherlock G, Zhang MQ, Iyer VR, Anders K, Eisen MB, Brown PO, Botstein D, Futcher B (1998) Comprehensive identification of cell cycle‐regulated genes of the yeast Saccharomyces cerevisiae by microarray hybridization. Mol Biol Cell 9: 3273–3297 [DOI] [PMC free article] [PubMed] [Google Scholar]
- Steffen KK, MacKay VL, Kerr EO, Tsuchiya M, Hu D, Fox LA, Dang N, Johnston ED, Oakes JA, Tchao BN (2008) Yeast life span extension by depletion of 60s ribosomal subunits is mediated by Gcn4. Cell 133: 292–302 [DOI] [PMC free article] [PubMed] [Google Scholar]
- Steffen KK, Kennedy BK, Kaeberlein M (2009) Measuring replicative life span in the budding yeast. J Vis Exp 28: e1209 [DOI] [PMC free article] [PubMed] [Google Scholar]
- Steffen KK, McCormick MA, Pham KM, MacKay VL, Delaney JR, Murakami CJ, Kaeberlein M, Kennedy BK (2012) Ribosome deficiency protects against ER stress in Saccharomyces cerevisiae . Genetics 191: 107–118 [DOI] [PMC free article] [PubMed] [Google Scholar]
- Stumpf CR, Moreno MV, Olshen AB, Taylor BS, Ruggero D (2013) The translational landscape of the mammalian cell cycle. Mol Cell 52: 574–582 [DOI] [PMC free article] [PubMed] [Google Scholar]
- Swinnen E, Ghillebert R, Wilms T, Winderickx J (2014a) Molecular mechanisms linking the evolutionary conserved TORC1‐Sch9 nutrient signalling branch to lifespan regulation in Saccharomyces cerevisiae . FEMS Yeast Res 14: 17–32 [DOI] [PubMed] [Google Scholar]
- Swinnen E, Wilms T, Idkowiak‐Baldys J, Smets B, De Snijder P, Accardo S, Ghillebert R, Thevissen K, Cammue B, De Vos D, Bielawski J, Hannun YA, Winderickx J (2014b) The protein kinase Sch9 is a key regulator of sphingolipid metabolism in Saccharomyces cerevisiae . Mol Biol Cell 25: 196–211 [DOI] [PMC free article] [PubMed] [Google Scholar]
- Tanenbaum ME, Stern‐Ginossar N, Weissman JS, Vale RD (2015) Regulation of mRNA translation during mitosis. Elife 4: e07957 [DOI] [PMC free article] [PubMed] [Google Scholar]
- Tehlivets O, Scheuringer K, Kohlwein SD (2007) Fatty acid synthesis and elongation in yeast. Biochim Biophys Acta 1771: 255–270 [DOI] [PubMed] [Google Scholar]
- Thorvaldsdottir H, Robinson JT, Mesirov JP (2013) Integrative Genomics Viewer (IGV): high‐performance genomics data visualization and exploration. Brief Bioinfor 14: 178–192 [DOI] [PMC free article] [PubMed] [Google Scholar]
- Toda T, Cameron S, Sass P, Wigler M (1988) SCH9, a gene of Saccharomyces cerevisiae that encodes a protein distinct from, but functionally and structurally related to, cAMP‐dependent protein kinase catalytic subunits. Genes Dev 2: 517–527 [DOI] [PubMed] [Google Scholar]
- Trapnell C, Pachter L, Salzberg SL (2009) TopHat: discovering splice junctions with RNA‐Seq. Bioinformatics 25: 1105–1111 [DOI] [PMC free article] [PubMed] [Google Scholar]
- Trapnell C, Williams BA, Pertea G, Mortazavi A, Kwan G, van Baren MJ, Salzberg SL, Wold BJ, Pachter L (2010) Transcript assembly and quantification by RNA‐Seq reveals unannotated transcripts and isoform switching during cell differentiation. Nat Biotechnol 28: 511–515 [DOI] [PMC free article] [PubMed] [Google Scholar]
- Trapnell C, Hendrickson DG, Sauvageau M, Goff L, Rinn JL, Pachter L (2013) Differential analysis of gene regulation at transcript resolution with RNA‐seq. Nat Biotechnol 31: 46–53 [DOI] [PMC free article] [PubMed] [Google Scholar]
- Truong SK, McCormick RF, Polymenis M (2013) Genetic determinants of cell size at birth and their impact on cell cycle progression in Saccharomyces cerevisiae . G3 (Bethesda) 3: 1525–1530 [DOI] [PMC free article] [PubMed] [Google Scholar]
- Tsukagoshi Y, Nikawa J, Yamashita S (1987) Molecular cloning and characterization of the gene encoding cholinephosphate cytidylyltransferase in Saccharomyces cerevisiae . Eur J Biochem 169: 477–486 [DOI] [PubMed] [Google Scholar]
- Turner JJ, Ewald JC, Skotheim JM (2012) Cell size control in yeast. Curr Biol 22: R350–R359 [DOI] [PMC free article] [PubMed] [Google Scholar]
- Urban J, Soulard A, Huber A, Lippman S, Mukhopadhyay D, Deloche O, Wanke V, Anrather D, Ammerer G, Riezman H, Broach JR, De Virgilio C, Hall MN, Loewith R (2007) Sch9 is a major target of TORC1 in Saccharomyces cerevisiae . Mol Cell 26: 663–674 [DOI] [PubMed] [Google Scholar]
- Walters AD, Bommakanti A, Cohen‐Fix O (2012) Shaping the nucleus: factors and forces. J Cell Biochem 113: 2813–2821 [DOI] [PMC free article] [PubMed] [Google Scholar]
- Walters AD, May CK, Dauster ES, Cinquin BP, Smith EA, Robellet X, D'Amours D, Larabell CA, Cohen‐Fix O (2014) The yeast polo kinase Cdc5 regulates the shape of the mitotic nucleus. Curr Biol 24: 2861–2867 [DOI] [PMC free article] [PubMed] [Google Scholar]
- Wei J, Tong L (2015) Crystal structure of the 500‐kDa yeast acetyl‐CoA carboxylase holoenzyme dimer. Nature 526: 723–727 [DOI] [PMC free article] [PubMed] [Google Scholar]
- Witkin KL, Chong Y, Shao S, Webster MT, Lahiri S, Walters AD, Lee B, Koh JL, Prinz WA, Andrews BJ, Cohen‐Fix O (2012) The budding yeast nuclear envelope adjacent to the nucleolus serves as a membrane sink during mitotic delay. Curr Biol 22: 1128–1133 [DOI] [PMC free article] [PubMed] [Google Scholar]
- Yang PL, Hsu TH, Wang CW, Chen RH (2016) Lipid droplets maintain lipid homeostasis during anaphase for efficient cell separation in budding yeast. Mol Biol Cell 27: 2368–2380 [DOI] [PMC free article] [PubMed] [Google Scholar]
- Zettel MF, Garza LR, Cass AM, Myhre RA, Haizlip LA, Osadebe SN, Sudimack DW, Pathak R, Stone TL, Polymenis M (2003) The budding index of Saccharomyces cerevisiae deletion strains identifies genes important for cell cycle progression. FEMS Microbiol Lett 223: 253–258 [DOI] [PubMed] [Google Scholar]
- Zlotek‐Zlotkiewicz E, Monnier S, Cappello G, Le Berre M, Piel M (2015) Optical volume and mass measurements show that mammalian cells swell during mitosis. J Cell Biol 211: 765–774 [DOI] [PMC free article] [PubMed] [Google Scholar]
Associated Data
This section collects any data citations, data availability statements, or supplementary materials included in this article.
Supplementary Materials
Appendix
Expanded View Figures PDF
Source Data for Expanded View
Review Process File
Source Data for Figure 2
Source Data for Figure 3
Source Data for Figure 4
Source Data for Figure 5
Data Availability Statement
All the sequencing data and datasets reported in this paper are available from the Gene Expression Omnibus (accession number GSE81932).